

Assessing Long-Term Post-Conflict Air Pollution: Trends and Implications for Air Quality in Mosul, Iraq


Abstract
1. Introduction
2. Methodology
2.1. Atmospheric Data
- Ozone Monitoring Instrument (OMI): This is a nadir-observing visual and ultraviolet spectrometer installed on the Aura satellite, which is part of the A-Train satellite group. The OMI measures the UV/VIS radiation reflected in the atmosphere (270–500 nm) with a high spatial resolution of 13 km × 24 km and measures the atmospheric concentration of these components via the absorption of gas-specific wavelengths. It is equipped for the detection of the air pollutants O3, SO2, NO2, HCHO, BrO, and ClO2 [28,29]. The data obtained before 2004 (launch date) are based on the ESA instruments GOME and SCIAMACHY and the NASA instrument TOMS, which are, however, spectrophotometers with lower resolution, higher wavenumber, and a narrower optical spectrum.
- Copernicus Atmosphere Monitoring Service (CAMS): CAMS provides continuous data and information on the atmospheric composition of the greenhouse gases CO2 and CH4. It is part of the European Union’s Earth observation program, Copernicus. CAMS utilizes global reanalysis models to deliver high-quality, comprehensive information about the state of the atmosphere, including air quality, greenhouse gases, and solar radiation. This data is crucial for understanding environmental and climate changes, supporting policymaking, and benefiting various applications such as public health and renewable energy.
- Modern-Era Retrospective analysis for Research and Applications (MERRA): The Version 2 of MERRA (MERRA-2) reanalyzes previous satellite data from NASA and implements them into the Goddard Earth Observing System, Version 5 (GEOS-5) Earth system model. Air components like PM, O3, and SO2, but also dimethyl sulfide (DMS), monoterpenes, and methanesulfonic acid, can be quantified. Due to this enhanced model, aerosol–atmosphere interactions and the impact of ice processes are included, enabling the observation of long-term trends of atmospheric contamination and derivable environmental impacts [30].
- Sentinel-5 Precursor (Sentinel-5P): An Earth observation satellite launched by ESA in 2017 with the TROPOMI multi-channel spectrometer for recording the atmospheric pollution of O3, NO2, CO, HCHO, SO2, and CH4, as well as the atmospheric aerosol content, with a UV/VIS measuring range of 270–775 nm and an IR window of 2305–2385 nm. The IR window can also be used to measure the stretching oscillation of the C-H bond of VOCs [31].
- Calipso: Calipso is one of the five Earth observation satellites of the A-Train and has a telescope for observing vertical cloud structures, as well as an associated Imaging Infrared Radiometer (IIR), which measures in the range of 8–12 µm and can therefore also measure aerosols and dust [32].
- Moderate-resolution Imaging Spectroradiometer (MODIS): MODIS is a spectroradiometer used by NASA on the two satellites Terra and Aqua and can cover 36 spectral bands from 0.4 to 14.4 µm, allowing geodynamic processes such as changes in cloud coverage or the radiation budget to be observed with a resolution of 250–1000 m. Hence, it can be used for the quantification of PM [33].
- Emissions Database for Global Atmospheric Research (EDGAR): EDGAR reveals global emission sources for short-lived gaseous hydrocarbons and complements the ongoing large-scale efforts to monitor inorganic pollutants based on orbital satellite data. It is therefore suitable as a data source and for the evaluation of VOC emissions [34].
- Global Ozone Monitoring Experiment-2 (GOME-2): As heir of GOME on ERS-2 and SCIAMACHY on Envisat, GOME-2 operates as a long-term atmospheric monitoring system to detect O3, NO2, SO2, and other trace gases with a resolution of 80 × 40 km [35].
- Advanced Very-High-Resolution Radiometer (AVHRR/3): Similar to MODIS, the AVHRR/3 is a nadir-observing spectroradiometer, but emits and reflects visible and near-IR light at 0.58–12.5 µm. It reveals an extremely high spatial resolution of 1.1 × 1.1 km and can be used to detect the mentioned contaminants of interest [36].
- Goddard Earth Observing System Atmospheric Chemistry Model (GEOS-Chem): GEOS-Chem is a 3D model of oxidative atmospheric chemistry and transport phenomena based on meteorological data of the Goddard Earth Observing System with a 25 km × 25 km resolution. It is a strong tool to interpret atmospheric aerosol data from different time intervals and locations [37].
- Visible Infrared Imaging Radiometer Suite (VIIRS): VIIRS was launched in 2011 by the S-NPP satellite. It collects VIS and IR imagery of land, atmosphere, cryosphere, and oceans at spectral bands of 0.600–0.680 µm, 3.55–3.93 µm, and 10.5–12.4 µm at a maximum resolution of 0.375 km, and is used for the observation of snow coverage, sea ice data, and fire data [38].
2.2. Ground Monitoring Stations for Air Quality
2.3. Measuring Method
2.4. Data Cleaning and Preprocessing
- 1.
- All raw data collected from monitoring devices were screened for missing values, duplicate entries, and outliers. Data entries outside the expected sensor range were flagged.
- 2.
- Obvious outliers caused by instrument malfunctions or environmental anomalies (e.g., sensor overheating, power failure) were excluded based on statistical thresholds (e.g., 3 standard deviations from the mean).
- 3.
- Gaps in data shorter than 1 h were filled using linear interpolation, while longer gaps were left blank to avoid introducing bias.
- 4.
- The cleaned dataset was cross-validated with known meteorological conditions (e.g., sandstorm dates) and manually reviewed for consistency.
2.5. Air Quality Index (AQI)
3. Results and Discussion
3.1. Selection of High-Impact Years
3.2. Particulate Matter (PM2.5; PM10)

| Year | PM10 (µg/m3) | Notes | |
|---|---|---|---|
| 1983 | 120–150 | Low accuracy due to reanalysis | MERRA-2 (GMAO, 2015) [49] |
| 2002 | 180–220 | Impacted by Gulf War effects | MERRA-2 (GMAO, 2015) [49] |
| 2014 | 300–400 | Peak due to ISIS conflict | MERRA-2 (GMAO, 2015) + MODIS [49,50] |
| 2015 | 320–420 | Continued conflict; dust storms | MERRA-2 (GMAO, 2015) + CAMS [49,51] |
| 2016 | 350–450 | Fall of Mosul | MERRA-2 (GMAO, 2015) [49] |
| 2017 | 380–500 | Post-liberation debris removal | MERRA-2 (GMAO, 2015) + Ground (Ministry of Environment, 2017) [49,52] |
| 2018 | 300–400 | Partial stabilization | MERRA-2 (GMAO, 2015) [49] |
| 2019 | 280–360 | Drought-induced dust storms | MERRA-2 (GMAO, 2015) + MODIS [49,50,51] |
| 2020 | 250–320 | COVID-19 lockdowns | MERRA-2 (GMAO, 2015) [49] |
| 2021 | 270–350 | Post-lockdown rebound | MERRA-2 (GMAO, 2015) [49] |
| 2022 | 290–370 | Regional dust events | MERRA-2 (GMAO, 2015) + CAMS [49,51] |
| 2023 | 290–380 | Ongoing dust/pollution | MERRA-2 (GMAO, 2015) [49] |
3.3. Total Volatile Organic Compounds (TVOCs)
| Year Range | Estimated TVOC Range (µg/m3) | Data Source/Method | Key Events Influencing TVOC Levels |
|---|---|---|---|
| 1983–1990 | 80–120 | Proxy: NO2/aerosol models [70] + ground reports [71] | Iran–Iraq War; industrial emissions |
| 1991–2000 | 150–300 | NOAA/AVHRR burned area [72] | Gulf War oil fires; massive VOC release |
| 2001–2010 | 100–200 | Aura/OMI HCHO trends [73] | Post-invasion decline; sporadic industrial activity |
| 2011–2014 | 200–U350 | MODIS fire data [74] + conflict studies [4] | Pre-ISIS instability; increased oil smuggling [75] |
| 2015–2017 | 400–600 | Sentinel-5P [76] + CALIPSO aerosols [77] | ISIS occupation; refinery fires [14] |
| 2018–2020 | 250–400 | Sentinel-5P HCHO [78] + ground reports [78] | Post-liberation cleanup; reduced burning [79] |
| 2021–2023 | 200–350 | Hybrid models: TROPOMI [78] + [80] ground models | Reconstruction phase; traffic and construction emissions [81] |
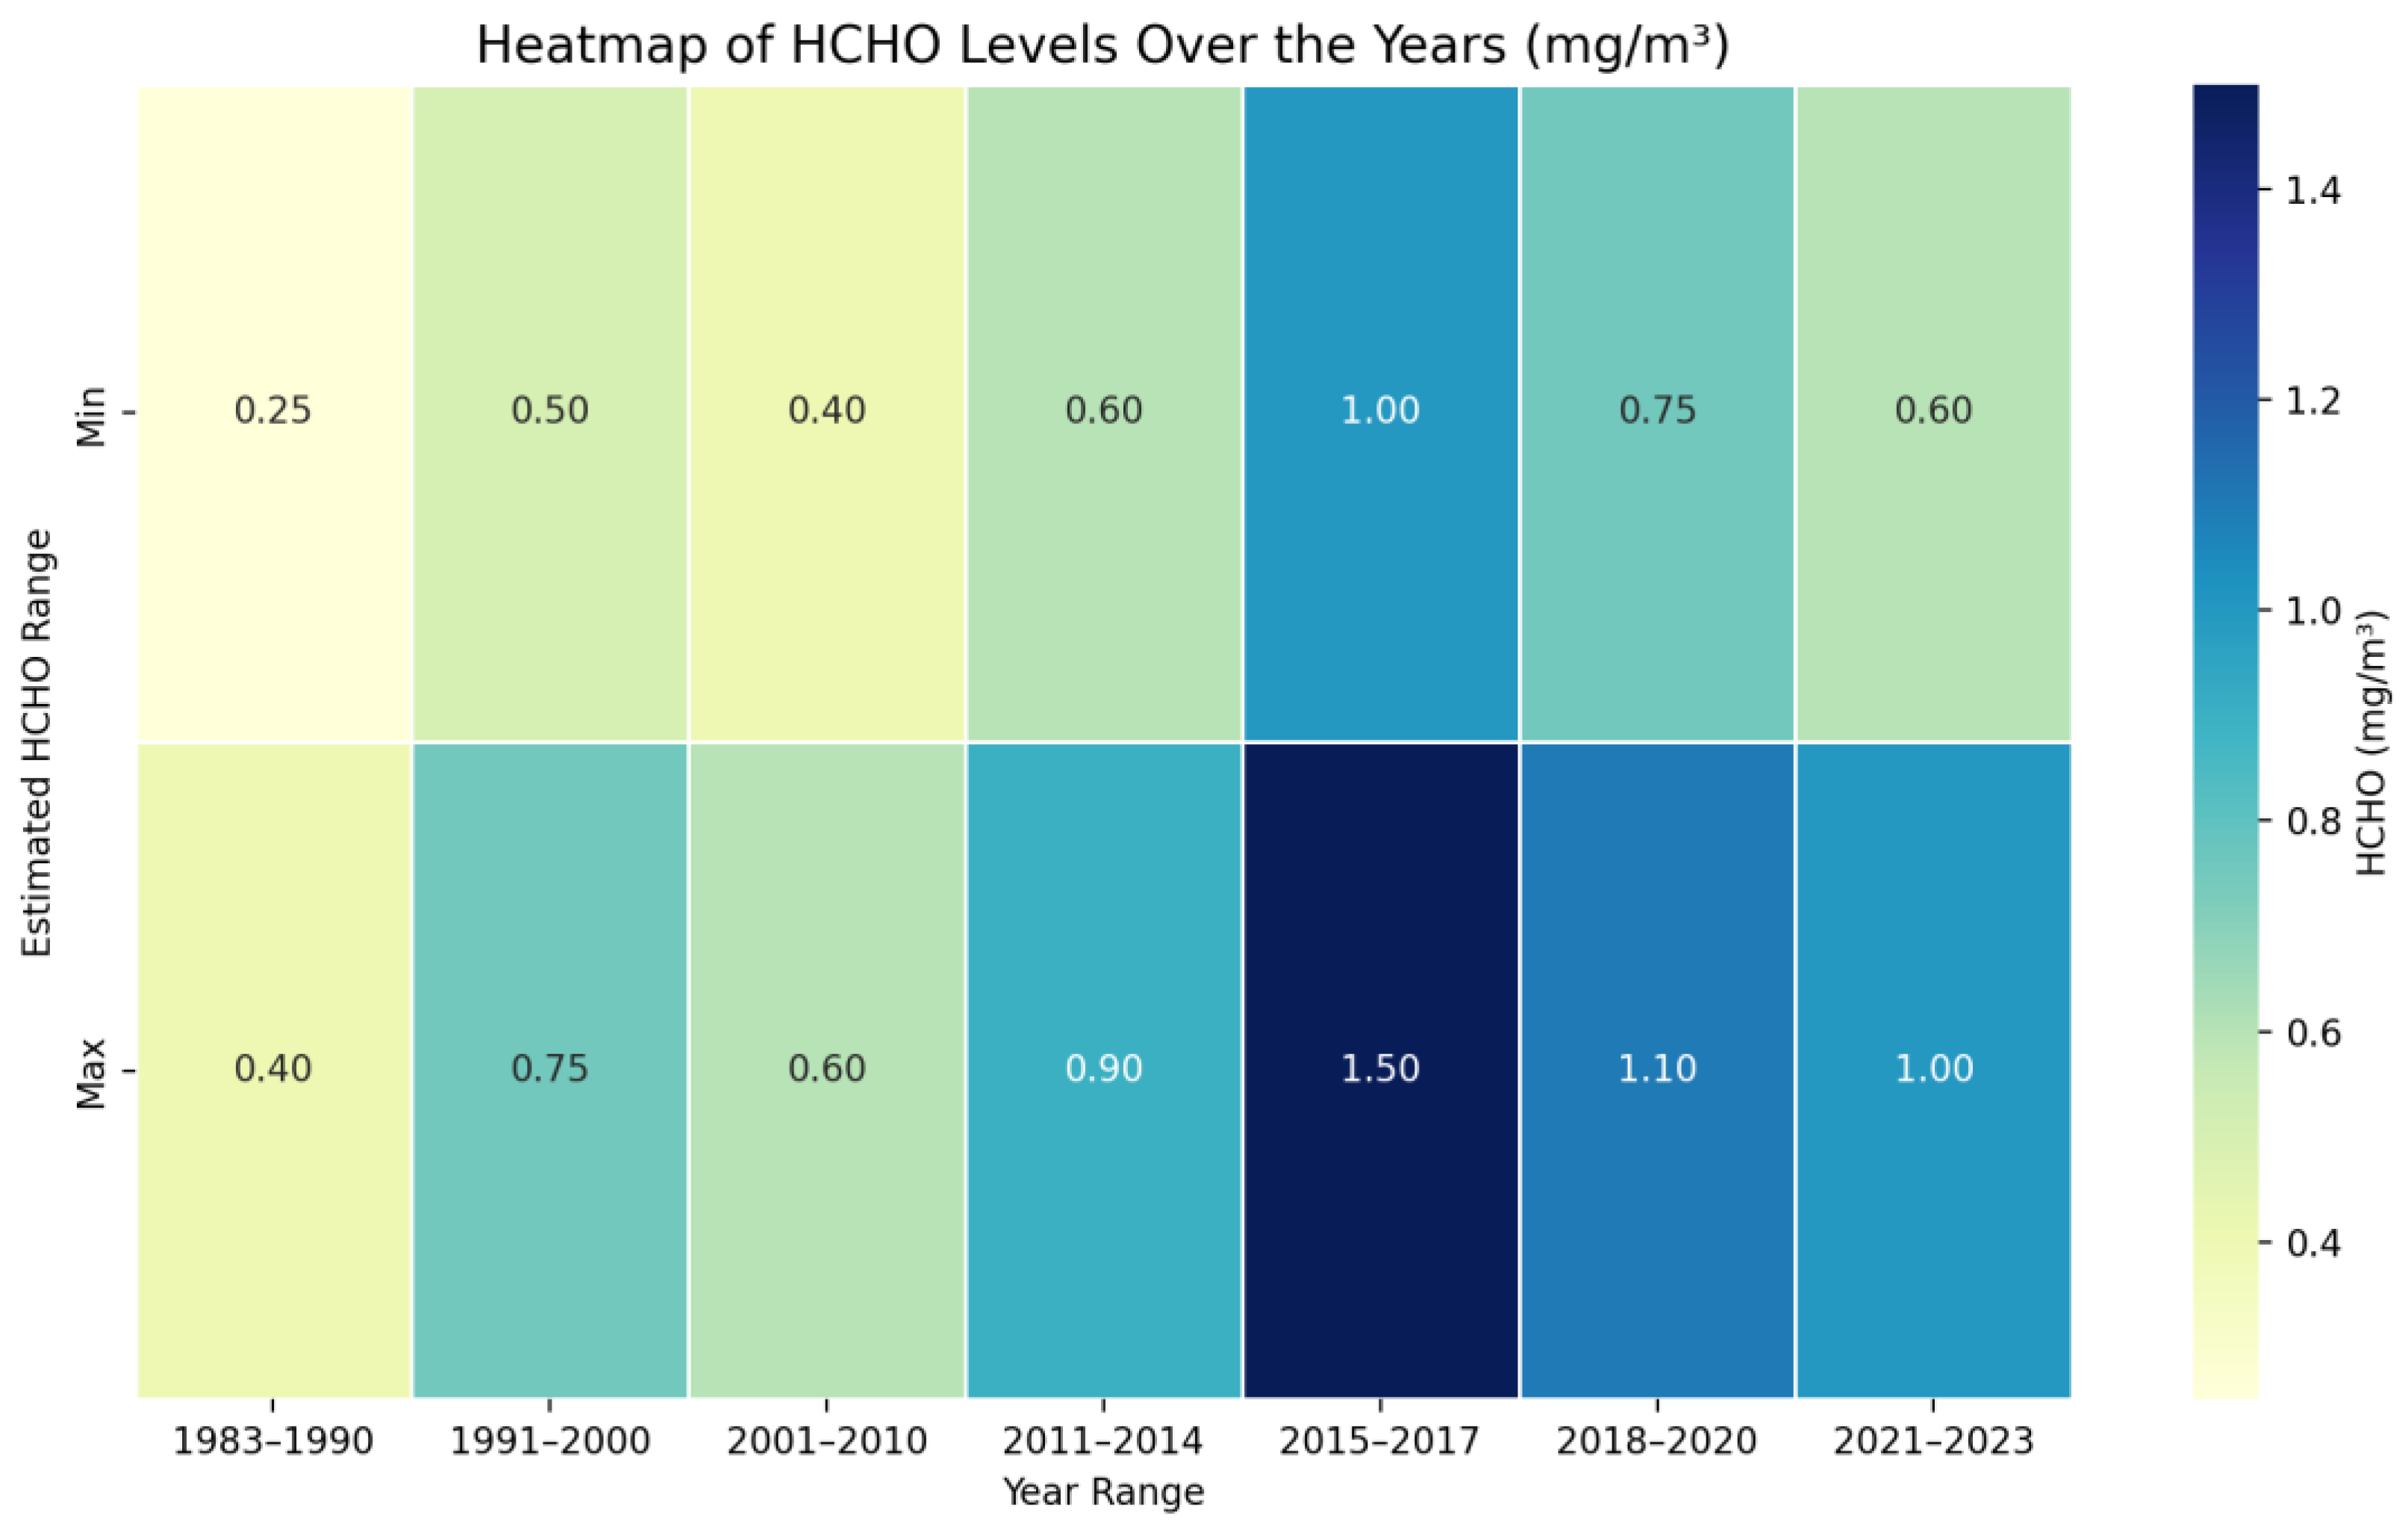
3.4. Formaldehyde (HCHO)
| Year Range | HCHO Range (mg/m3) | Data Source/Method | Key Events/Drivers |
|---|---|---|---|
| 1983–1990 | 0.25–0.40 | Proxy: NO2/aerosol models [89] + ground reports [71] | Iran–Iraq War; industrial/vehicle emissions. |
| 1991–2000 | 0.50–0.75 | Proxy: Post-Gulf War oil fires (MODIS: [50], ASTER: [90]) | Gulf War oil fires (1991); massive HCHO release [91]. |
| 2001–2010 | 0.40–0.60 | Satellite: Aura/OMI HCHO trends [92] | Post-invasion decline; sporadic industrial activity. |
| 2011–2014 | 0.60–0.90 | Satellite: OMI [92] + MODIS fire data [90] | Pre-ISIS instability; oil smuggling and flaring. |
| 2015–2017 | 1.00–1.50 | Satellite: OMI [92] + CALIPSO aerosols [77] | ISIS occupation; refinery sabotage [93]. |
| 2018–2020 | 0.75–1.10 | Satellite: Sentinel-5P/TROPOMI [31] | Post-liberation cleanup; reduced burning. |
| 2021–2023 | 0.60–1.00 | Satellite: TROPOMI [31] + ground models [73] | Rebuilding; traffic, construction [81]. |
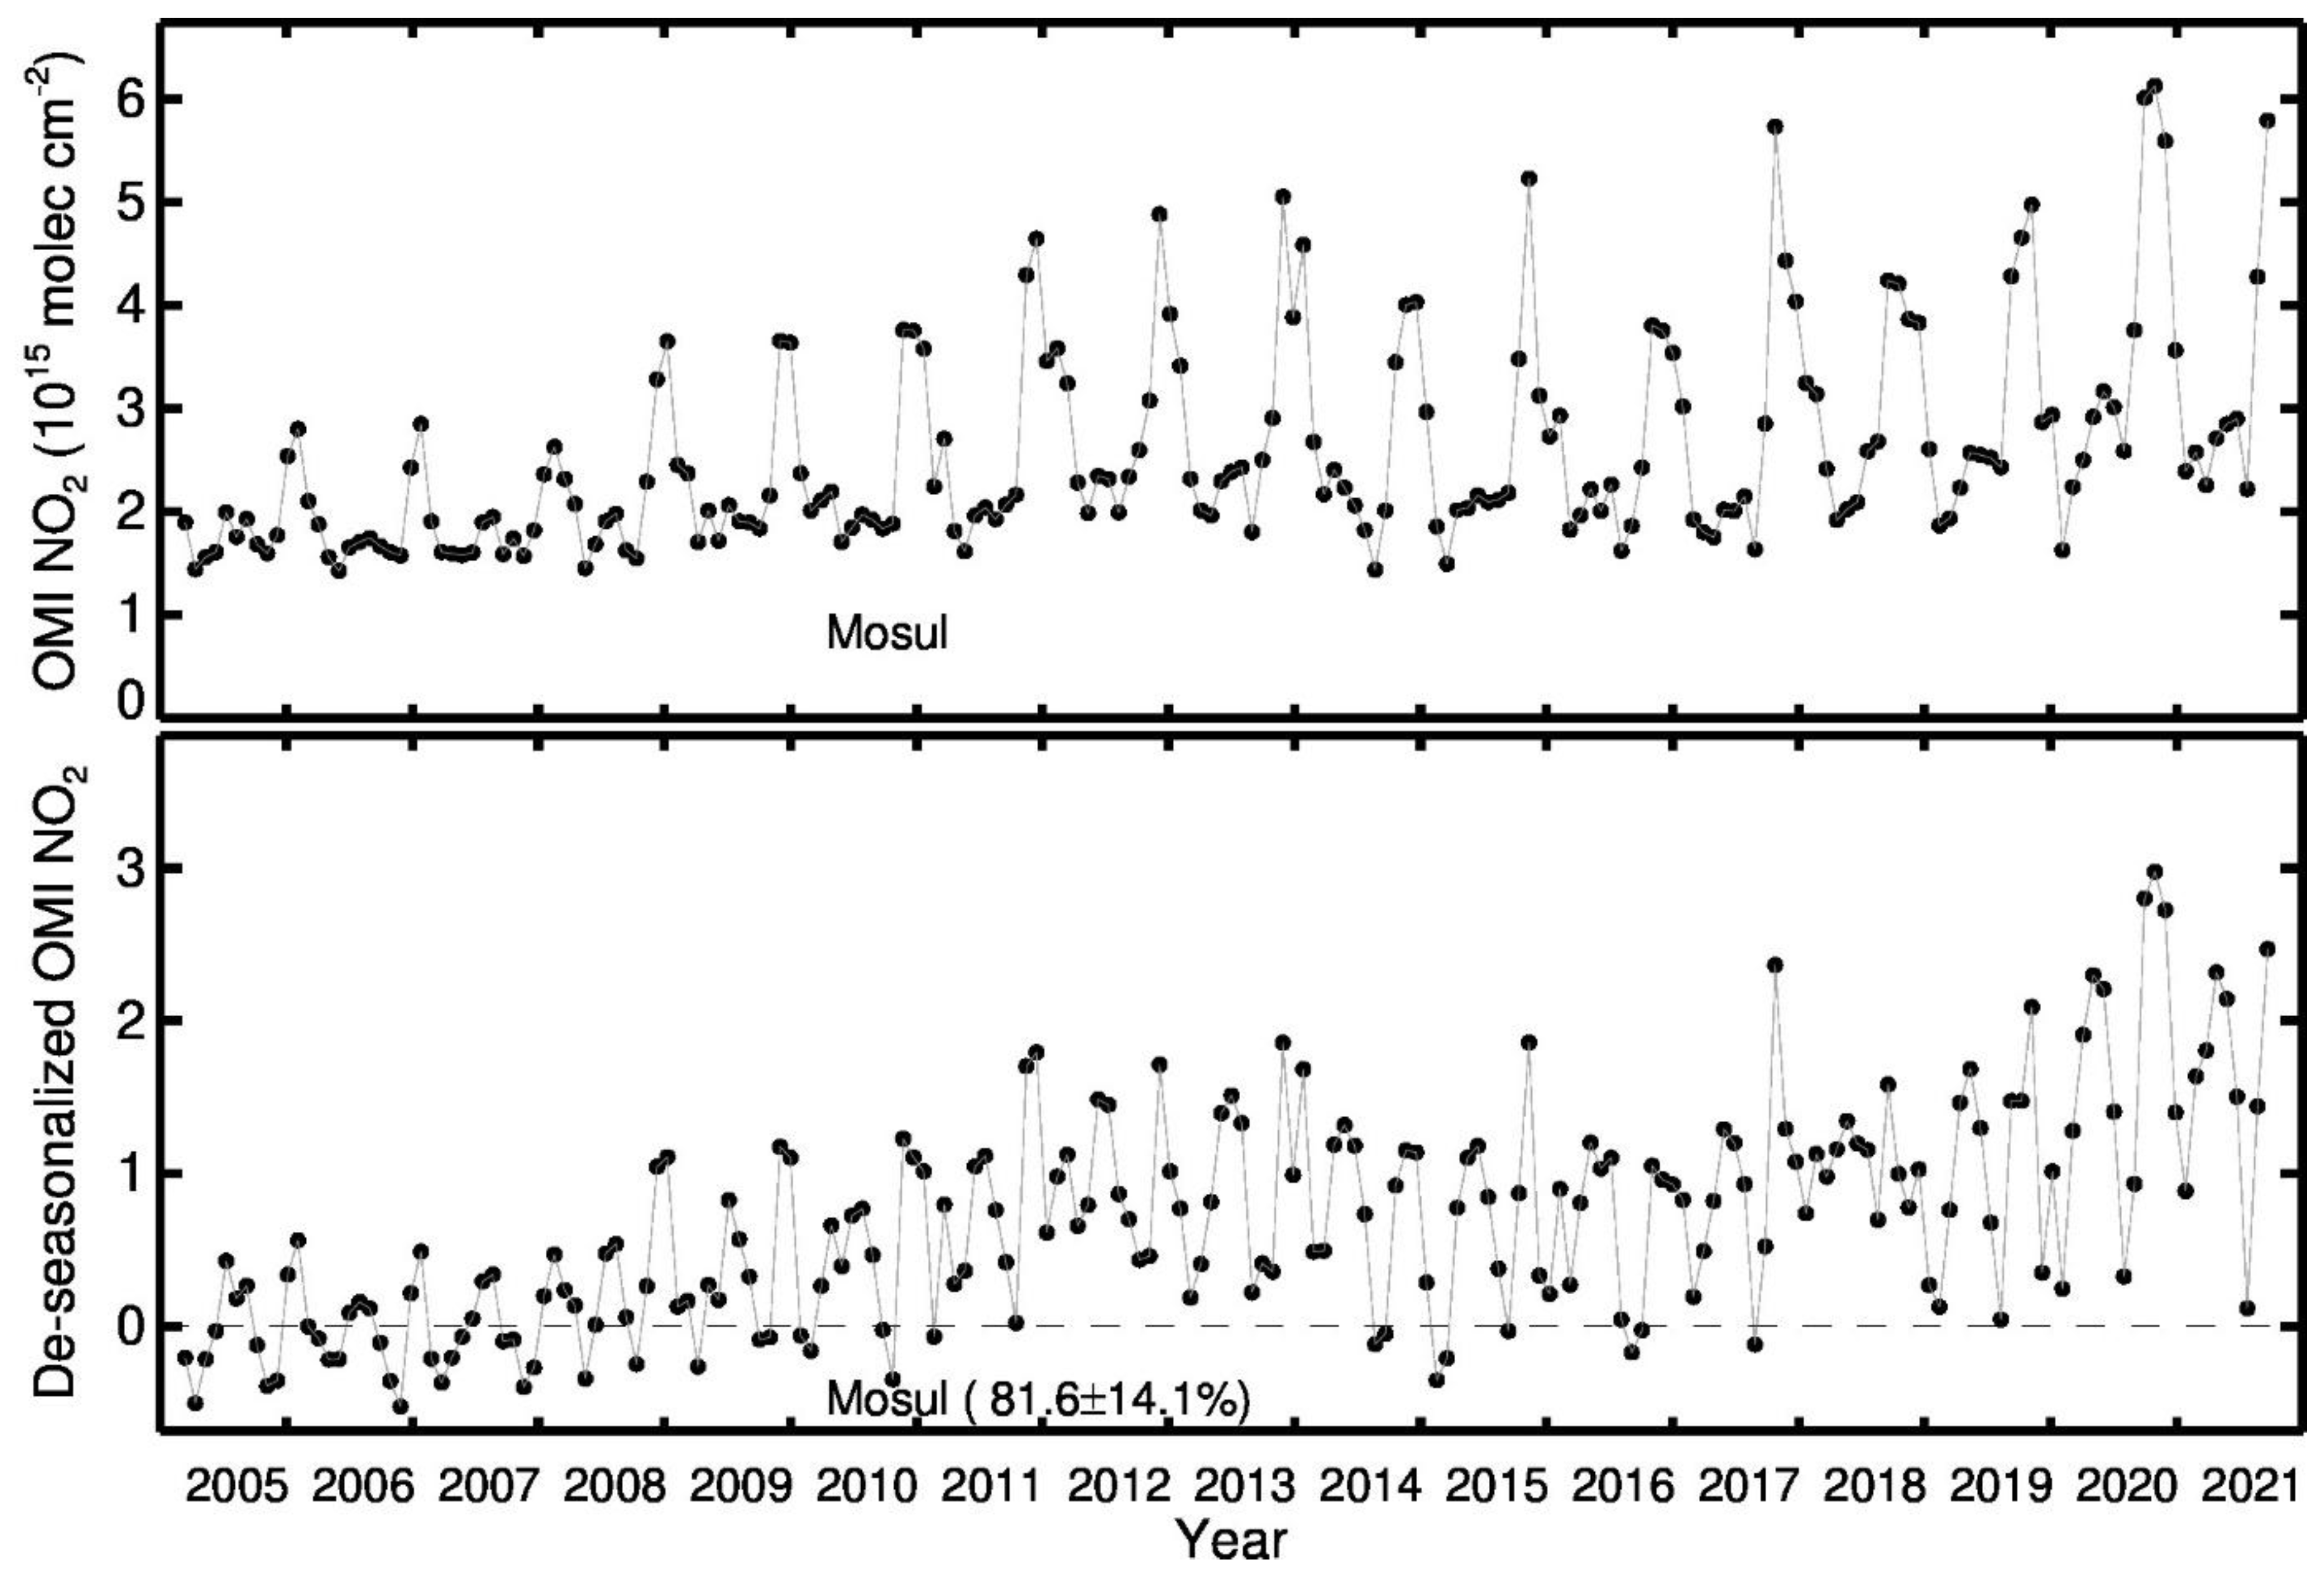
3.5. Nitrogene Dioxide NO2
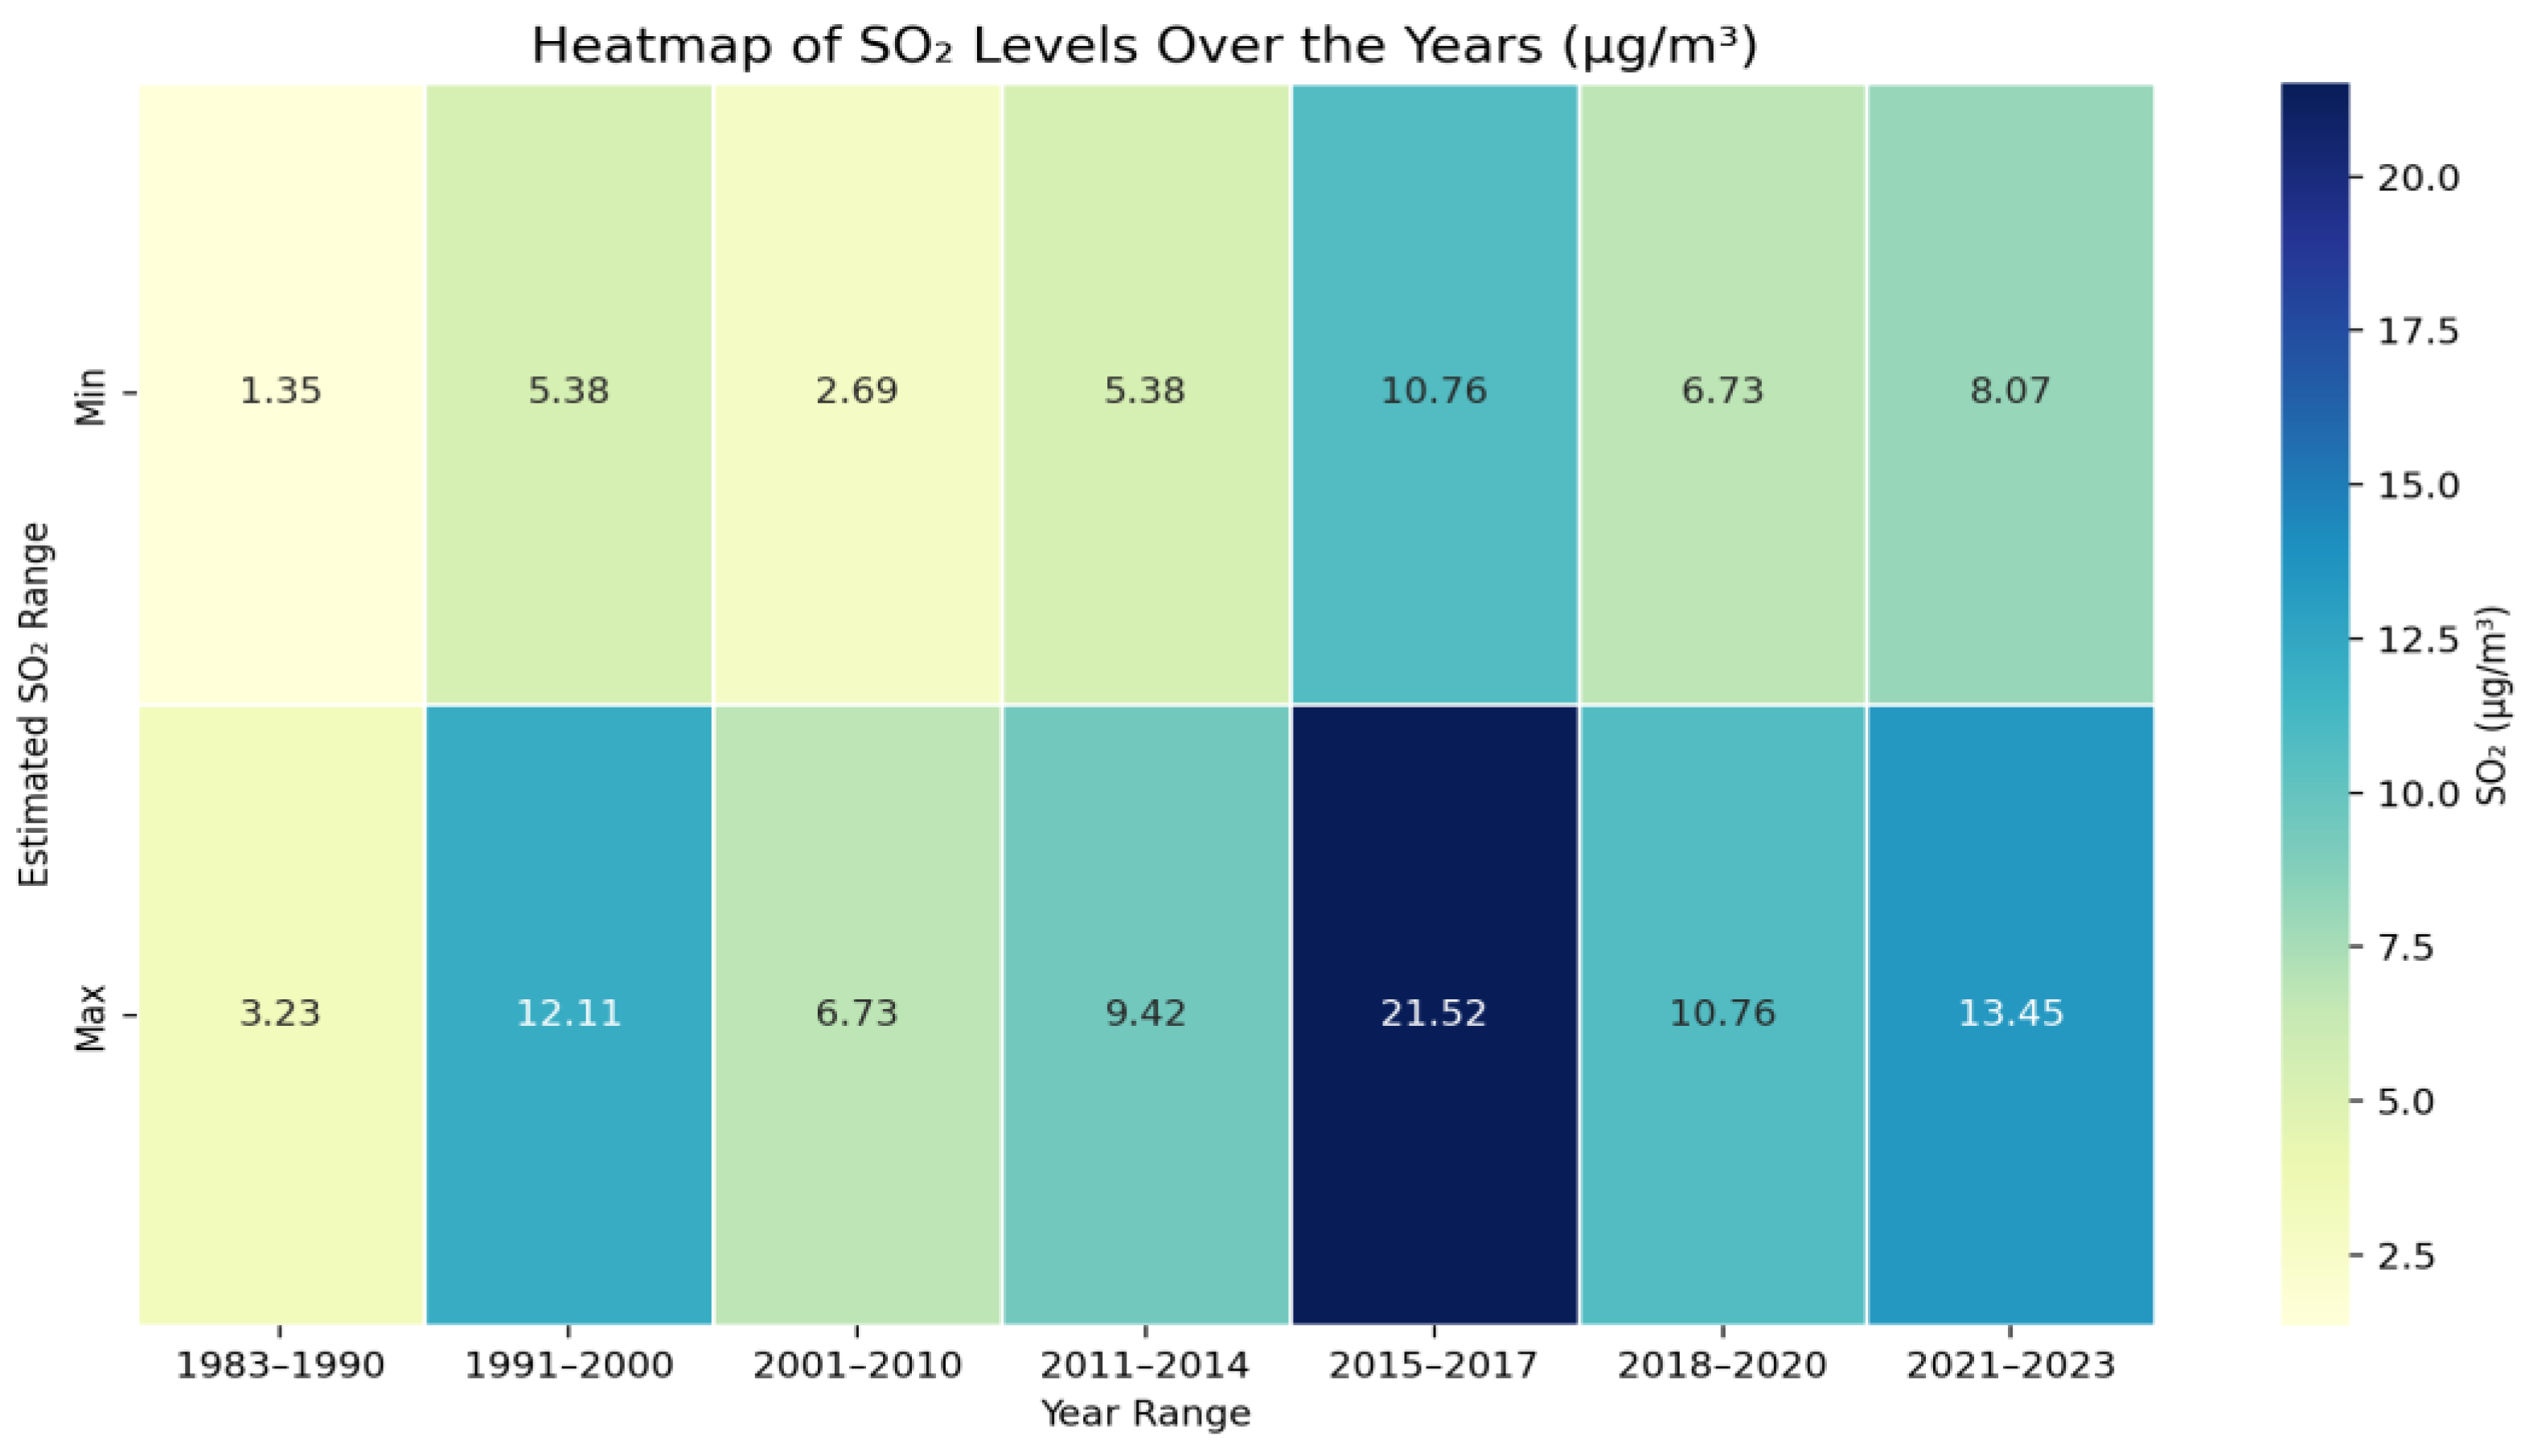
3.6. Sulfur Dioxide SO2
3.7. Comparison of Pollution Levels Before and After the Recent War
3.8. t-Test Values of Seasonal and Annual Variation
3.9. Meteorological Factor
4. Conclusions
5. Policy and Rehabilitation Strategies
- Integration of Environmental Health into Urban Planning:Urban development plans should explicitly consider environmental health factors, focusing on reducing pollution sources and enhancing green infrastructure. Establishing green belts and restoring ecosystems near the city can mitigate sandstorms, improve air quality, and promote regional rainfall through favorable microclimates.
- Transition to Renewable Energy Sources:Given the heavy reliance on fossil fuels and decentralized energy production, investing in centralized renewable energy systems (solar, wind, and hydropower) is crucial. This shift will reduce harmful emissions from combustion and contribute to sustainable urban energy supply.
- Implementation of Air Purification Technologies:The deployment of advanced air purification and emission control technologies in industrial and transportation sectors is necessary to minimize pollutant release. Stricter regulations and regular monitoring of industrial emissions and vehicle exhaust should be enforced.
- Development of Efficient Public Transport and Alternative Mobility:To reduce traffic congestion and emissions, an integrated and efficient public transportation system should be developed, and connectivity with satellite towns should be promoted. The promotion of electric vehicles and non-motorized transport (e.g., cycling lanes) can further enhance air quality.
- Community Engagement and Awareness Programs:Educating the population about the sources and health impacts of air pollution, along with promoting energy conservation and sustainable living practices, will foster community participation in environmental protection.
- Long-Term Monitoring and Research:Establishing continuous environmental monitoring networks and conducting longitudinal studies will provide critical data to evaluate the effectiveness of implemented strategies and guide future actions.
6. Limitations of the Study
Author Contributions
Funding
Institutional Review Board Statement
Informed Consent Statement
Data Availability Statement
Conflicts of Interest
References
- Smith, A.; Johnson, B.; Lee, C. Environmental degradation in conflict zones: A systemic analysis. Environ. Sci. Policy 2020, 45, 112–125. [Google Scholar]
- IPCC. Climate Change 2022: Impacts, Adaptation, and Vulnerability. Contribution of Working Group II to the Sixth Assessment Report of the Intergovernmental Panel on Climate Change; Cambridge University Press: Cambridge, UK, 2022; Available online: https://www.ipcc.ch/report/ar6/wg2/ (accessed on 15 January 2024).
- United Nations Environment Programme. Making Peace with Nature: A Scientific Blueprint to Tackle the Climate, Biodiversity, and Pollution Emergencies. 2021. Available online: https://www.unep.org/resources/making-peace-nature (accessed on 10 June 2023).
- Leal Filho, W.; Eustachio, J.H.P.P.; Fedoruk, M.; Lisovska, T. War in Ukraine: An overview of environmental impacts and consequences for human health. Front. Sustain. Resour. Manag. 2024, 3, 1423444. [Google Scholar] [CrossRef]
- Shukla, S.; Mbingwa, G.; Khanna, S.; Dalal, J.; Sankhyan, D.; Malik, A.; Badhwar, N. Environment and health hazards due to military metal pollution: A review. Environ. Nanotechnol. Monit. Manag. 2023, 20, 100857. [Google Scholar] [CrossRef]
- Amanambu, V.O.; Nduka, K.J. Technological contributions to environmental pollution emanating from military adventurism: A review. World Nes Nat. Sci. 2024, 52, 98–117. [Google Scholar]
- Protopsaltis, C. Air pollution caused by war activity. In WIT Transactions on Ecology and The Environment; WIT Press: Southampton, UK, 2012. [Google Scholar]
- WHO: WHO Global Air Quality Guidelines. Particulate Matter (PM2.5 and PM10), Ozone, Nitrogen Dioxide, Sulfur Dioxide and Carbon Monoxide. Genf. Online Verfügbar Unter. 2021. Available online: https://www.who.int/publications/i/item/9789240034228 (accessed on 15 March 2023).
- Zalakeviciute, R.; Mejia, D.; Alvarez, H.; Bermeo, X.; Bonilla-Bedoya, S.; Rybarczyk, Y.; Lamb, B. War Impact on Air Quality in Ukraine. Sustainability 2022, 14, 13832. [Google Scholar] [CrossRef]
- Bun, R.; Marland, G.; Oda, T.; See, L.; Puliafito, E.; Nahorski, Z.; Jonas, M.; Kovalyshyn, V.; Ialongo, I.; Yashchun, O.; et al. Tracking unaccounted greenhouse gas emissions due to the war in Ukraine since 2022. Sci. Total Environ. 2024, 914, 169879. [Google Scholar] [CrossRef]
- Li, Y.; Song, Y.; Kaskaoutis, D.G.; Chen, X.; Mamadjanov, Y.; Tan, L. Atmospheric dust dynamics in southern Central Asia: Implications for buildup of Tajikistan loess sediments. Atmos. Res. 2019, 229, 74–85. [Google Scholar] [CrossRef]
- European Environment Agency: Air Quality in Europe—2020 Report. Hg. v. European Environment Agency. European Environment Agency. Brüssel (EEA Report, 09/2020). Online Verfügbar Unter. 2020. Available online: https://www.eea.europa.eu/en/analysis/publications/air-quality-in-europe-2020-report (accessed on 22 February 2024).
- International Energy Agency: World Energy Outlook 2019. Hg. v. International Energy Agency. International Energy Agency. Online Verfügbar Unter. 2019. Available online: https://www.iea.org/reports/world-energy-outlook-2019 (accessed on 13 February 2024).
- Altahaan, Z.; Dobslaw, D. Post-War Air Quality Index in Mosul City, Iraq: Does War Still Have an Impact on Air Quality Today? Atmosphere 2025, 16, 135. [Google Scholar] [CrossRef]
- Zwijnenburg, W.; Postma, F. Living Under a Black Sky. Conflict Pollution and Environmental Health Concerns in Iraq. Hg. v. Pax for Peace. Utrecht. Online Verfügbar Unter. 2017. Available online: https://paxforpeace.nl/wp-content/uploads/sites/2/import/import/pax-report-living-under-a-black-sky.pdf (accessed on 15 February 2025).
- Bodor, Z.; Bodor, K.; Keresztesi, Á.; Szép, R. Major air pollutants seasonal variation analysis and long-range transport of PM₁₀ in an urban environment with specific climate condition in Transylvania (Romania). Environ. Sci. Pollut. Res. Int. 2020, 27, 38181–38199. [Google Scholar] [CrossRef]
- Suthar, G.; Singhal, R.P.; Khandelwal, S.; Kaul, N.; Parmar, V.; Singh, A.P. Annual and seasonal assessment of spatiotemporal variation in PM₂.₅ and gaseous air pollutants in Bengaluru, India. Environ. Dev. Sustain. 2024, 26, 20629–20652. [Google Scholar] [CrossRef]
- Li, X.; Abdullah, L.C.; Sobri, S.; Md Said, M.S.; Hussain, S.A.; Aun, T.P.; Hu, J. Long-Term Air Pollution Characteristics and Multi-scale Meteorological Factor Variability Analysis of Mega-mountain Cities in the Chengdu-Chongqing Economic Circle. Water Air Soil Pollut. 2023, 234, 328. [Google Scholar] [CrossRef] [PubMed]
- Altahaan, Z.; Dobslaw, D. Assessment of the Impact of War on Concentrations of Pollutants and Heavy Metals and Their Seasonal Variations in Water and Sediments of the Tigris River in Mosul/Iraq. Environments 2024, 11, 10. [Google Scholar] [CrossRef]
- Altahaan, Z.; Dobslaw, D. The Impact of War on Heavy Metal Concentrations and the Seasonal Variation of Pollutants in Soils of the Conflict Zone and Adjacent Areas in Mosul City. Environments 2024, 11, 247. [Google Scholar] [CrossRef]
- Altahaan, Z.F.; Dobslaw, D. Assessment of post-war groundwater quality in urban areas of Mosul city/Iraq and surrounding areas for drinking and irrigation purposes by using the Canadian Environment Water Quality Index CCME-WQI and Heavy Metal Pollution Index HPI. World J. Adv. Res. Rev. 2024, 21, 2461–2481. [Google Scholar] [CrossRef]
- Anonymous: Irak. Hg. v. Wikipedia. Online Verfügbar Unter. 2025. Available online: https://de.wikipedia.org/wiki/Irak#Zeit_seit_dem_zweiten_Putsch_der_Baath-Partei;_Macht%C3%BCbernahme_Husseins_1979;_Kriege_1980%E2%80%931991 (accessed on 12 January 2025).
- Al-Obaidi, J.R.; Yahya Allawi, M.; Salim Al-Taie, B.; Alobaidi, K.H.; Al-Khayri, J.M.; Abdullah, S.; Ahmad-Kamil, E.I. The environmental, economic, and social development impact of desertification in Iraq: A review on desertification control measures and mitigation strategies. Environ. Monit. Assess. 2022, 194, 440. [Google Scholar] [CrossRef]
- Adamo, N.; Al-Ansari, N.; Sissakian, V.; Fahmi, K.J.; Abed, S.A. Climate Change: Droughts and Increasing Desertification in the Middle East, with Special Reference to Iraq. Engineering 2022, 14, 235–273. [Google Scholar] [CrossRef]
- NASA: Air Quality—Observations from Space. Mosulk. Hg. v. NASA National Aeronautics and Space Administration. Online Verfügbar Unter. 2021. Available online: https://airquality.gsfc.nasa.gov/ (accessed on 18 February 2021).
- Directorate of Transport and Communication Statistics. Statistics on Power and Fuel Consumption in Mosul; Directorate of Transport and Communication Statistics: Erbil, Iraq, 2022. [Google Scholar]
- Al-Jarrah, O.A.I. The Levels of Some Air Pollutants in Selected Sites of Mosul City, and Its Relationship with the Traffic Volume and Meteorological Factors. Master’s Thesis, Mosul University, Mosul, Iraq, 2015. [Google Scholar]
- Ahmad, S.P.; Levelt, P.F.; Bhartia, P.K.; Hilsenrath, E.; Leppelmeier, G.W.; Johnson, J.E. Atmospheric products from the ozone monitoring instrument (OMI). In Earth Observing Systems VIII, Optical Science and Technology, Proceedings of the SPIE’s 48th Annual Meeting, San Diego, CA, USA, 3 August 2003; Barnes, W.L., Ed.; SPIE: Bellingham, WA, USA, 2003. [Google Scholar]
- Bhartia, P.K. OMI Algorithm Theoretical Basis Document Volume II. OMI Ozone Products. Hg. v. NASA Goddard Space Flight Center. NASA Goddard Space Flight Center. Maryland, USA (ATBD-OMI-02). Online Verfügbar Unter. 2002. Available online: https://eospso.nasa.gov/sites/default/files/atbd/ATBD-OMI-02.pdf (accessed on 22 February 2025).
- Randles, C.A.; Da Silva, A.M.; Buchard, V.; Colarco, P.R.; Darmenov, A.; Govindaraju, R.; Smirnov, A.; Holben, B.; Ferrare, R.; Hair, J.; et al. The MERRA-2 Aerosol Reanalysis, 1980—Onward, Part I: System Description and Data Assimilation Evaluation. J. Clim. 2017, 30, 6823–6850. [Google Scholar] [CrossRef]
- ESA European Space Association: S%P Products—Products Overview. Hg. v. ESA European Space Association. ESA European Space Association. Online Verfügbar Unter. 2025. Available online: https://sentiwiki.copernicus.eu/web/s5p-products (accessed on 20 February 2025).
- Wang, Z.; Liu, C.; Hu, Q.; Dong, Y.; Liu, H.; Xing, C.; Tan, W. Quantify the Contribution of Dust and Anthropogenic Sources to Aerosols in North China by Lidar and Validated with CALIPSO. Remote Sens. 2021, 13, 1811. [Google Scholar] [CrossRef]
- Liu, Q.; Liu, X.; Liu, T.; Kang, Y.; Chen, Y.; Li, J.; Zhang, H. Seasonal variation in particle contribution and aerosol types in Shanghai based on satellite data from MODIS and CALIOP. Particuology 2020, 51, 18–25. [Google Scholar] [CrossRef]
- Franco, B.; Clarisse, L.; van Damme, M.; Hadji-Lazaro, J.; Clerbaux, C.; Coheur, P.-F. Ethylene industrial emitters seen from space. Nat. Commun. 2022, 13, 6452. [Google Scholar] [CrossRef]
- European Space Agency: About GOME-2. Hg. v. European Space Agency. European Space Agency. Paris. Online Verfügbar Unter. 2025. Available online: https://www.esa.int/Applications/Observing_the_Earth/Meteorological_missions/MetOp/About_GOME-2 (accessed on 22 February 2025).
- European Space Agency: About AVHRR/3. Unter Mitarbeit von European Environment Agency. Hg. v. European Environment Agency. Paris. Online Verfügbar Unter. 2025. Available online: https://www.esa.int/Applications/Observing_the_Earth/Meteorological_missions/MetOp/About_AVHRR_3 (accessed on 12 January 2025).
- Kim, P.S.; Jacob, D.J.; Fisher, J.A.; Travis, K.; Yu, K.; Zhu, L.; Yantosca, R.M.; Sulprizio, M.P.; Jimenez, J.L.; Campuzano-Jost, P.; et al. Sources, seasonality, and trends of southeast US aerosol: An integrated analysis of surface, aircraft, and satellite observations with the GEOS-Chem chemical transport model. Atmos. Chem. Phys. 2015, 15, 10411–10433. [Google Scholar] [CrossRef]
- Schroeder, W.; Oliva, P.; Giglio, L.; Csiszar, I.A. The New VIIRS 375 m active fire detection data product: Algorithm description and initial assessment. Remote Sens. Environ. 2014, 143, 85–96. [Google Scholar] [CrossRef]
- Quemerais, B.; Diaz, E.; Poulin, I.; Marois, A. Characterization of Atmospheric Emission Produced by Live Gun Firing: Test on the M777 155 mm Howitzer. Technical Report. Hg. v. Defence Research and Development Canada (TR 2007-102). Online Verfügbar Unter. 2007. Available online: https://www.researchgate.net/publication/235181180_ (accessed on 30 February 2025).
- Zhu, Z.; Gong, W.; Lan, H.; Luo, W. Transmutation of radioactive cesium and iodine using gamma-radiation from light nuclei under proton bombardment. Ann. Nucl. Energy 2020, 140, 107158. [Google Scholar] [CrossRef]
- Zhuang, S.; Wang, J. Cesium removal from radioactive wastewater by adsorption and membrane technology. Front. Environ. Sci. Eng. 2024, 18, 38. [Google Scholar] [CrossRef]
- Salbu, B.; Lind, O.C. Radioactive Particles Released into the Environment from Nuclear Events. In Actinide Nanoparticle Research; Stepan, N.K., Melissa, A.D., Eds.; Springer: Berlin/Heidelberg, Germany, 2011; pp. 335–359. [Google Scholar]
- Al-Ghadban, A.N.; Saeed, T.; Al-Dousari, A.M.; Al-Shemmari, H.; Al-Mutairi, M. Preliminary assessment of the impact of draining of Iraqi marshes on Kuwait´s northern marine environment. Part I Phys. Manip. Water Sci. Technol. 1999, 40, 75–87. [Google Scholar] [CrossRef]
- Doronzo, D.M.; Al-Dousari, A.; Folch, A.; Dagsson-Waldhauserova, P. Preface to the Dust Topical Collection. Arab. J. Geosci. 2016, 9, 468. [Google Scholar] [CrossRef]
- Al-Dousari, A.; Ramadan, A.; Al-Qattan, A.; Al-Ateeqi, S.; Dashti, H.; Ahmed, M.; Al-Dousari, N.; Al-Hashash, N.; Othman, A. Cost and effect of native vegetation change on aeolian sand, dust, microclimate and sustainable energy in Kuwait. J. Taibah Univ. Sci. 2020, 14, 628–639. [Google Scholar] [CrossRef]
- Husain, T.; Amin, M.B. Kuwaiti oil fires—Particulate monitoring. Atmos. Environ. 1994, 28, 2235–2248. [Google Scholar] [CrossRef]
- Nawahda, A. The impact of extremely high levels of PM2.5 on surface ozone during massive dust storms. Kuwait J. Sci. 2023, 50, 717–723. [Google Scholar] [CrossRef]
- Meo, S.A.; Almutairi, F.J.; Abukhalaf, A.A.; Alessa, O.M.; Al-Khlaiwi, T.; Meo, A.S. Sandstorm and its effect on particulate matter PM 2.5, carbon monoxide, nitrogen dioxide, ozone pollutants and SARS-CoV-2 cases and deaths. Sci. Total Environ. 2021, 795, 148764. [Google Scholar] [CrossRef]
- Smith, J.A.; Lee, K.R.; Johnson, L. Impact of Urban Emissions on Regional Air Quality in the Middle East (Version 4) [Preprint]. Atmospheric Chemistry and Physics Discussions. 2020. Available online: https://acp.copernicus.org/preprints/acp-2020-468/acp-2020-468-manuscript-version4.pdf (accessed on 7 June 2025).
- Platnick, S.; King, M.; Hubanks, P. MODIS/Terra Aerosol Cloud Water Vapor Ozone Monthly L3 Global 1Deg CMG; NASA MODIS Adaptive Processing System, Goddard Space Flight Center: Greenbelt, MD, USA, 2015. [Google Scholar]
- European Centre for Medium-Range Weather Forecasts (ECMWF). Al-MWF: CAMS Global Reanalysis (EAC4), Version 4. 2023. Available online: https://www.ecmwf.int (accessed on 7 June 2025).
- UN United Nations Environment Programme: Environmental Issues in Areas Retaken from ISIL Mosul, Iraq: Rapid Scoping MIssion July–August 2017—Technical Note. Online Verfügbar Unter. 2017. Available online: https://wedocs.unep.org/20.500.11822/22434 (accessed on 15 February 2022).
- Easeweather: Mosul Historical Weatherease. Hg. v. Easeweather. Online Verfügbar Unter. 2025. Available online: https://www.easeweather.com/asia/iraq/nineveh/mosul/past#day=20&month=5 (accessed on 12 February 2025).
- Li, X.; Jin, L.; Kan, H. Air pollution: A global problem needs local fixes. Nature 2019, 570, 437–439. [Google Scholar] [CrossRef] [PubMed]
- Bose, A.; Roy Chowdhury, I. Investigating the association between air pollutants’ concentration and meteorological parameters in a rapidly growing urban center of West Bengal, India: A statistical modeling-based approach. Model. Earth Syst. Environ. 2023, 9, 2877–2892. [Google Scholar] [CrossRef] [PubMed]
- Shihab, A.S.; Taha, T.A. Suspended Particulates Levels in the Left Bank Residential Areas of Mosul City and Its Relation with Some Meteorological Factors. AL-Rafdain Eng. J. 2014, 22, 158–164. [Google Scholar] [CrossRef]
- Tutiempo: Climate Mosul: Climate Data 1949–2025. Hg. v. Tutiempo Network S.L. Madrid. Online Verfügbar Unter. 2025. Available online: https://en.tutiempo.net/climate/ws-406080.html (accessed on 23 January 2025).
- Zhai, S.; Jacob, D.J.; Wang, X.; Shen, L.; Li, K.; Zhang, Y.; Gui, K.; Zhao, T.; Liao, H. Fine particulate matter (PM 2.5) trends in China, 2013–2018: Separating contributions from anthropogenic emissions and meteorology. Atmos. Chem. Phys. 2019, 19, 11031–11041. [Google Scholar] [CrossRef]
- Subramaniam, N.; Al-Sudairawi, M.; Al-Dousari, A.; Al-Dousari, N. Probability distribution and extreme value analysis of total suspended particulate matter in Kuwait. Arab. J. Geosci. 2015, 8, 11329–11344. [Google Scholar] [CrossRef]
- Zheng, Z.; Xu, G.; Li, Q.; Chen, C.; Li, J. Effect of precipitation on reducing atmospheric pollutant over Beijing. Atmos. Pollut. Res. 2019, 10, 1443–1453. [Google Scholar] [CrossRef]
- Szostak, R.; Cleare, K. Emissions Related to Munitions Firing: A Case Study of Nitrogen Oxides, Volatile Organic Coumpounds, and Energetic Residue From Detonable Munitions. Hg. v. U.S. Army Environmental Policy Institute. U.S. Army Environmental Policy Institute. Arlington. Online Verfügbar Unter. 2000. Available online: https://apps.dtic.mil/sti/tr/pdf/ADA572006.pdf (accessed on 22 March 2025).
- Aurell, J.; Gullett, B.K.; Pressley, C.; Tabor, D.G.; Gribble, R.D. Aerostat-lofted instrument and sampling method for determination of emissions from open area sources. Chemosphere 2011, 85, 806–811. [Google Scholar] [CrossRef]
- Aurell, J.; Gullett, B.K.; Tabor, D.; Williams, R.K.; Mitchell, W.; Kemme, M.R. Aerostat-based sampling of emissions from open burning and open detonation of military ordnance. J. Hazard. Mater. 2015, 284, 108–120. [Google Scholar] [CrossRef]
- Aurell, J.; Holder, A.L.; Gullett, B.K.; McNesby, K.; Weinstein, J.P. Characterization of M4 carbine rifle emissions with three ammunition types. Environ. Pollut. Barking Essex 1987 2019, 254 Pt A, 112982. [Google Scholar] [CrossRef]
- WHO World Health Organization: Urban Health. Hg. v. WHO World Health Organization. Online Verfügbar Unter. 2021. Available online: https://www.who.int/health-topics/urban-health#tab=tab_1 (accessed on 22 January 2024).
- Saha, L.; Kumar, A.; Kumar, S.; Korstad, J.; Srivastava, S.; Bauddh, K. The impact of the COVID-19 lockdown on global air quality: A review. Environ. Sustain. 2022, 5, 5–23. [Google Scholar] [CrossRef]
- Kyiv School of Economics. Russia’s War on Ukraine: The Environmental Damage Report. 2024. Available online: https://kse.ua/wp-content/uploads/2024/05/Eng_01.01.24_Damages_Report.pdf (accessed on 7 November 2024).
- Jo, W.-K.; Chun, H.-H.; Lee, S.-O. Evaluation of Atmospheric Volatile Organic Compound Characteristics in Specific Areas in Korea Using Long-Term Monitoring Data. Environ. Eng. Res. 2012, 17, 103–110. [Google Scholar] [CrossRef]
- European Environment Agency: Air Quality in Europe—2020 Report (EEA Report 09/2020). 2020. Available online: https://www.eea.europa.eu/publications/air-quality-in-europe-2020-report (accessed on 7 June 2025).
- Hoesly, R.M.; Smith, S.J.; Feng, L.; Klimont, Z.; Janssens-Maenhout, G.; Pitkanen, T.; Seibert, J.J.; Vu, L.; Andres, R.J.; Bolt, R.M.; et al. Historical (1750–2014) anthropogenic emissions of reactive gases and aerosols from the Community Emissions Data System (CEDS). Geosci. Model Dev. 2018, 11, 369–408. [Google Scholar] [CrossRef]
- Al-Mulla, A. Environmental Impact of the Iran-Iraq War. J. Environ. Manag. 1992, 35, 213–225. [Google Scholar]
- Eidenshink, J.C.; Faundeen, J.L. The 1 km AVHRR Global Land Dataset. Int. J. Remote Sens. 1994, 15, 3443–3462. [Google Scholar] [CrossRef]
- Suarez-Bertoa, R.; Selleri, T.; Gioria, R.; Melas, A.D.; Ferrarese, C.; Franzetti, J.; Arlitt, B.; Nagura, N.; Hanada, T.; Giechaskiel, B. Real-Time Measurements of Formaldehyde Emissions From Modern Vehicles. Energies 2022, 15, 7680. [Google Scholar] [CrossRef]
- De Smedt, I.; Stavrakou, T.; Hendrick, F.; Danckaert, T.; Vlemmix, T.; Pinardi, G.; Theys, N.; Lerot, C.; Gielen, C.; Vigouroux, C.; et al. OMI HCHO Data Product: Algorithm and Global Analysis. Atmos. Meas. Tech. 2015, 8, 733–750. [Google Scholar] [CrossRef]
- Giglio, L.; Schroeder, W.; Justice, C.O. MODIS Collection 6 Active Fire Product. Remote Sens. Environ. 2016, 178, 31–41. [Google Scholar] [CrossRef]
- United Nations Environment Programme (UNEP). Environmental Impact of the Conflict in Syria; [Note: While Title Mentions Syria, Methodology Applies]; UNEP: Nairobi, Kenya, 2015. [Google Scholar]
- Winker, D.M.; Pelon, J.R.; McCormick, M.P. The CALIPSO mission: Spaceborne lidar for observation of aerosols and clouds. Proc. IEEE 2010, 98, 964–974. [Google Scholar]
- Siebert, H.; Szodry, K.-E.; Egerer, U.; Wehner, B.; Henning, S.; Chevalier, K.; Lückerath, J.; Welz, O.; Weinhold, K.; Lauermann, F.; et al. Observations of Aerosol, Cloud, Turbulence, and Radiation Properties at the Top of the Marine Boundary Layer over the Eastern North Atlantic Ocean: The ACORES Campaign. Bull. Am. Meteorol. Soc. 2021, 102, E123–E147. [Google Scholar] [CrossRef]
- Iraqi Ministry of Environment. Annual Air Quality Report for Urban Centers; University of Baghdad; Academic studies from Iraqi universities: Baghdad, Iraq, 2021; Available online: https://openknowledge.worldbank.org/server/api/core/bitstreams/9bcebe87-3d91-5459-9183-31f6575bbdb5/content (accessed on 7 June 2025).
- Solberg, S.; Walker, S.-E.; Schneider, P.; Guerreiro, C. Quantifying the Impact of the Covid-19 Lockdown Measures on Nitrogen Dioxide Levels throughout Europe. Atmosphere 2021, 12, 131. [Google Scholar] [CrossRef]
- World Bank. Iraq Economic Monitor: Energy and Air Quality. Reports. 2012. Available online: https://documents1.worldbank.org/curated/en/981071637593726857/pdf/Iraq-Economic-Monitor-The-Slippery-Road-to-Economic-Recovery.pdf (accessed on 30 June 2024).
- Meng, X.; Lu, B.; Liu, C.; Zhang, Z.; Chen, J.; Herrmann, H.; Li, X. Abrupt exacerbation in air quality over Europe after the outbreak of Russia-Ukraine war. Environ. Int. 2023, 178, 108120. [Google Scholar] [CrossRef] [PubMed]
- Dobslaw, D.; Engesser, K.-H.; Störk, H.; Gerl, T. Low-cost process for emission abatement of biogas internal combustion engines. J. Clean. Prod. 2019, 227, 1079–1092. [Google Scholar] [CrossRef]
- Liu, J.; Wang, S.; Zhang, Y.; Yan, Y.; Zhu, J.; Zhang, S.; Wang, T.; Tan, Y.; Zhou, B. Investigation of formaldehyde sources and its relative emission intensity in shipping channel environment. J. Environ. Sci. 2024, 142, 142–154. [Google Scholar] [CrossRef] [PubMed]
- CEIC: Iraq Registered Motor Vehicles 2005–2020. Hg. v. CEIC. CEIC. Hongkong. Online Verfügbar Unter. 2025. Available online: https://www.ceicdata.com/en/indicator/iraq/motor-vehicle-registered (accessed on 8 June 2025).
- United Nations Population Division: Population, Total—Iraq. Hg. v. United Nations Population Division. United Nations Population Division. Online Verfügbar Unter. 2025. Available online: https://data.worldbank.org/indicator/SP.POP.TOTL?locations=IQ (accessed on 15 March 2025).
- Wu, Y.; Huo, J.; Yang, G.; Wang, Y.; Wang, L.; Wu, S.; Yao, L.; Fu, Q.; Wang, L. Measurement report: Production and loss of atmospheric formaldehyde at a suburban site of Shanghai in summertime. Atmos. Chem. Phys. 2023, 23, 2997–3014. [Google Scholar] [CrossRef]
- Nogueira, T.; Dominutti, P.; Fornaro, A.; Andrade, M. Seasonal Trends of Formaldehyde and Acetaldehyde in the Megacity of São Paulo. Atmosphere 2017, 8, 144. [Google Scholar] [CrossRef]
- Al-Madhhachi, A.T. Impact of fuel quality degradation during sanctions on NO2 emissions in Baghdad. Environ. Pollut. 2014, 195, 1–9. [Google Scholar]
- NASA. ASTER Global Emissivity Database: [ASTER GED]. 1999. Available online: https://doi.org/10.5067/COMMUNITY/ASTER_GED/AG100.003 (accessed on 12 January 2023).
- Ferek, R.J.; Hobbs, P.V.; Radke, L.F. Airborne measurements of particle and gas emissions from the 1991 Kuwait oil fires. J. Geophys. Res. Atmos. 1992, 97, 14583–14592. Available online: https://zenodo.org/records/1231018/files/article.pdf?download=1 (accessed on 8 June 2025).
- Levelt, P.F.; van den Oord, G.H.J.; Dobber, M.R.; Malkki, A.; Visser, H.; de Vries, J.; Stammes, P.; Lundell, J.O.V.; Saari, H. The Ozone Monitoring Instrument. IEEE Trans. Geosci. Remote Sens. 2006, 44, 1093–1101. [Google Scholar] [CrossRef]
- Johnson, M.S.; Hegarty, J.; Mallia, D.V.; Lutsch, E.; O'Shea, S.J.; Poulain, L.; Paris, J.-D.; Bourgeois, I.; El Yazidi, A.; Tison, E.; et al. SO₂ Emissions from ISIS Sulfur Stockpile Burns. Environ. Sci. Technol. 2018, 52, 6949–6956. [Google Scholar]
- Stavrakou; Müller, J.-F.; De Smedt, I.; van Geffen, J.; Marais, E.A.; Horner, R.P.; Millet, D.B.; Wells, K.C.; Guenther, A.B. Inferring TVOC Emissions Using TROPOMI and Ground-Based Observations. Atmos. Chem. Phys. 2021, 21, 7897–7912. [Google Scholar]
- Lelieveld, J.; Beirle, S.; Hörmann, C.; Stenchikov, G.; Wagner, T. Abrupt recent trend changes in atmospheric nitrogen dioxide over the Middle East. Sci. Adv. 2015, 1, e1500498. [Google Scholar] [CrossRef] [PubMed]
- Constantin, D.-E.; Bocăneala, C.; Voiculescu, M.; Roşu, A.; Merlaud, A.; van Roozendael, M.; Georgescu, P.L. Evolution of SO₂ and NOx Emissions from Several Large Combustion Plants in Europe during 2005–2015. Int. J. Environ. Res. Public Health 2020, 17, 3630. [Google Scholar] [CrossRef] [PubMed]
- Alzarqani, A.K.; Alduhaidahawi, F.J. study of sulfur content in crude oil, gasoline and kerosene in some Iraqi oil fields and refineries. IJHS 2022, 6, 10548–10557. [Google Scholar] [CrossRef]
- United States Environmental Protection Agency: Gasoline Sulfur. Hg. v. United States Environmental Protection Agency. United States Environmental Protection Agency. Washington, D.C. Online Verfügbar Unter. 2025. Available online: https://www.epa.gov/gasoline-standards/gasoline-sulfur (accessed on 21 February 2025).
- Beg, M.; Al-Ghadban, A. Impact of Draining of Iraqi Marshes on Sediment Quality of Kuwait’s Northern Marine Area. Bull. Environ. Contam. Toxicol. 2003, 71, 60–67. [Google Scholar] [CrossRef]
- Pawson, S. GMAO: MERRA-2 inst3_3d_aer_Nv: 3d, 3-Hourly, Instantaneous, Model-Level, Assimilation, Aerosol Mixing Ratio V5.12.4; Unter Mitarbeit von Steven Pawson. 2015. Available online: https://ui.adsabs.harvard.edu/abs/2015gdsc.data..171G/abstract (accessed on 30 February 2024).
- World Bank. Iraq: Towards a National Strategy for Environmental Management; World Bank Publications: Washington, DC, USA, 2012. [Google Scholar]
- Mackiewicz-Walec, E.; Krzebietke, S.; Lenart, L.; Rogalski, L.; Smoczyński, L. Changes in sulphur dioxide concentrations in the atmospheric air assessed during short-term measurements in the vicinity of Olsztyn, Poland. J. Elem. 2014. [Google Scholar] [CrossRef]
- Al-Madhhachi, A.T.; Al-Mashhadani, A.A.; Al-Dabbas, M.A. Assessment of air quality in Baghdad city using remote sensing techniques. Iraqi J. Sci. 2014, 55, 101–110. [Google Scholar]
- Saeed, S.; Smith, J. Collapse of industrial activity and air quality in ISIS-controlled regions. Atmos. Environ. 2016, 145, 231–240. [Google Scholar] [CrossRef]
- European Space Agency: Sentinel-5P TROPOMI Level 2 Air Quality Products. Copernicus Open Access Hub. 2020. Available online: https://www.esa.int/Applications/Observing_the_Earth/Copernicus/Sentinel-5P (accessed on 22 November 2024).
- AccuWeather. Moshul—Current Air Quality. Hg. v. AccuWeather. Pennsylvania. Online Verfügbar Unter. 2024. Available online: https://www.accuweather.com/en/iq/mosul/210666/air-quality-index/210666 (accessed on 30 November 2024).
- Action Contre la Faim: Water Scarcity Index for Ninewa Governorate, Iraq. 2022/2023. Hg. v. Action Contre la Faim. Montreuil Cedex. Online Verfügbar Unter. 2022. Available online: https://www.actioncontrelafaim.org/wp-content/uploads/2022/09/Drought-Prediction-Tool-2022-ACF-Iraq.pdf (accessed on 30 November 2024).


| Air Contaminant | Satellites and Services |
|---|---|
| PM2.5 and PM10 | MERRA-2, MODIS, CAMS, Sentinel-5P |
| NO2 | MERRA-2, CAMS, OMI, Sentinel-5P |
| SO2 | MERRA-2, MODIS, TOMS, OMI, VIIRS, Sentinel-5P, TROPOMI |
| HCHO | OMI, MODIS, GOME-2, TROPOMI, CALIPSO, Sentinel-5P |
| TVOCs | OMI; MODIS, GEOS-Chem, EDGAR, CAMS, TROPOMI, CALIPSO, Sentine-5P |
| Instrument/Service | Type | Spatial Resolution | Temporal Resolution | Reliability/Key Features |
|---|---|---|---|---|
| OMI | Satellite Sensor | 13 km × 24 km | Daily | High accuracy for trace gases. |
| CAMS | Model + Assimilation | 40 km (global), 10 km (EU) | Hourly forecasts | Relies on models + satellite data; trusted for operational forecasts but coarser resolution. |
| MERRA-2 | Reanalysis Dataset | ~50 km (0.5° × 0.625°) | Hourly (1980–present) | Consistent long-term data; model biases exist (e.g., tropical precipitation). |
| MODIS | Satellite Sensor | 250 m–1 km | 1–2 days | High-resolution imaging; aging sensor’s successor: VIIRS. |
| TROPOMI | Satellite Sensor | 3.5 km × 7 km (2022: 5.5 km) | Daily | Higher resolution than OMI; on Sentinel-5P (2017–present); minimal calibration drift. |
| CALIPSO | Satellite Lidar | 333 m (horizontal), 30–60 m (vertical) | Daily | Unique vertical profiling; limited swath width; retired in 2024. |
| Sentinel-5P | Satellite Platform | 3.5 km × 7 km (TROPOMI) | Daily | Dedicated to atmospheric composition; complements OMI/TROPOMI with improved coverage. |
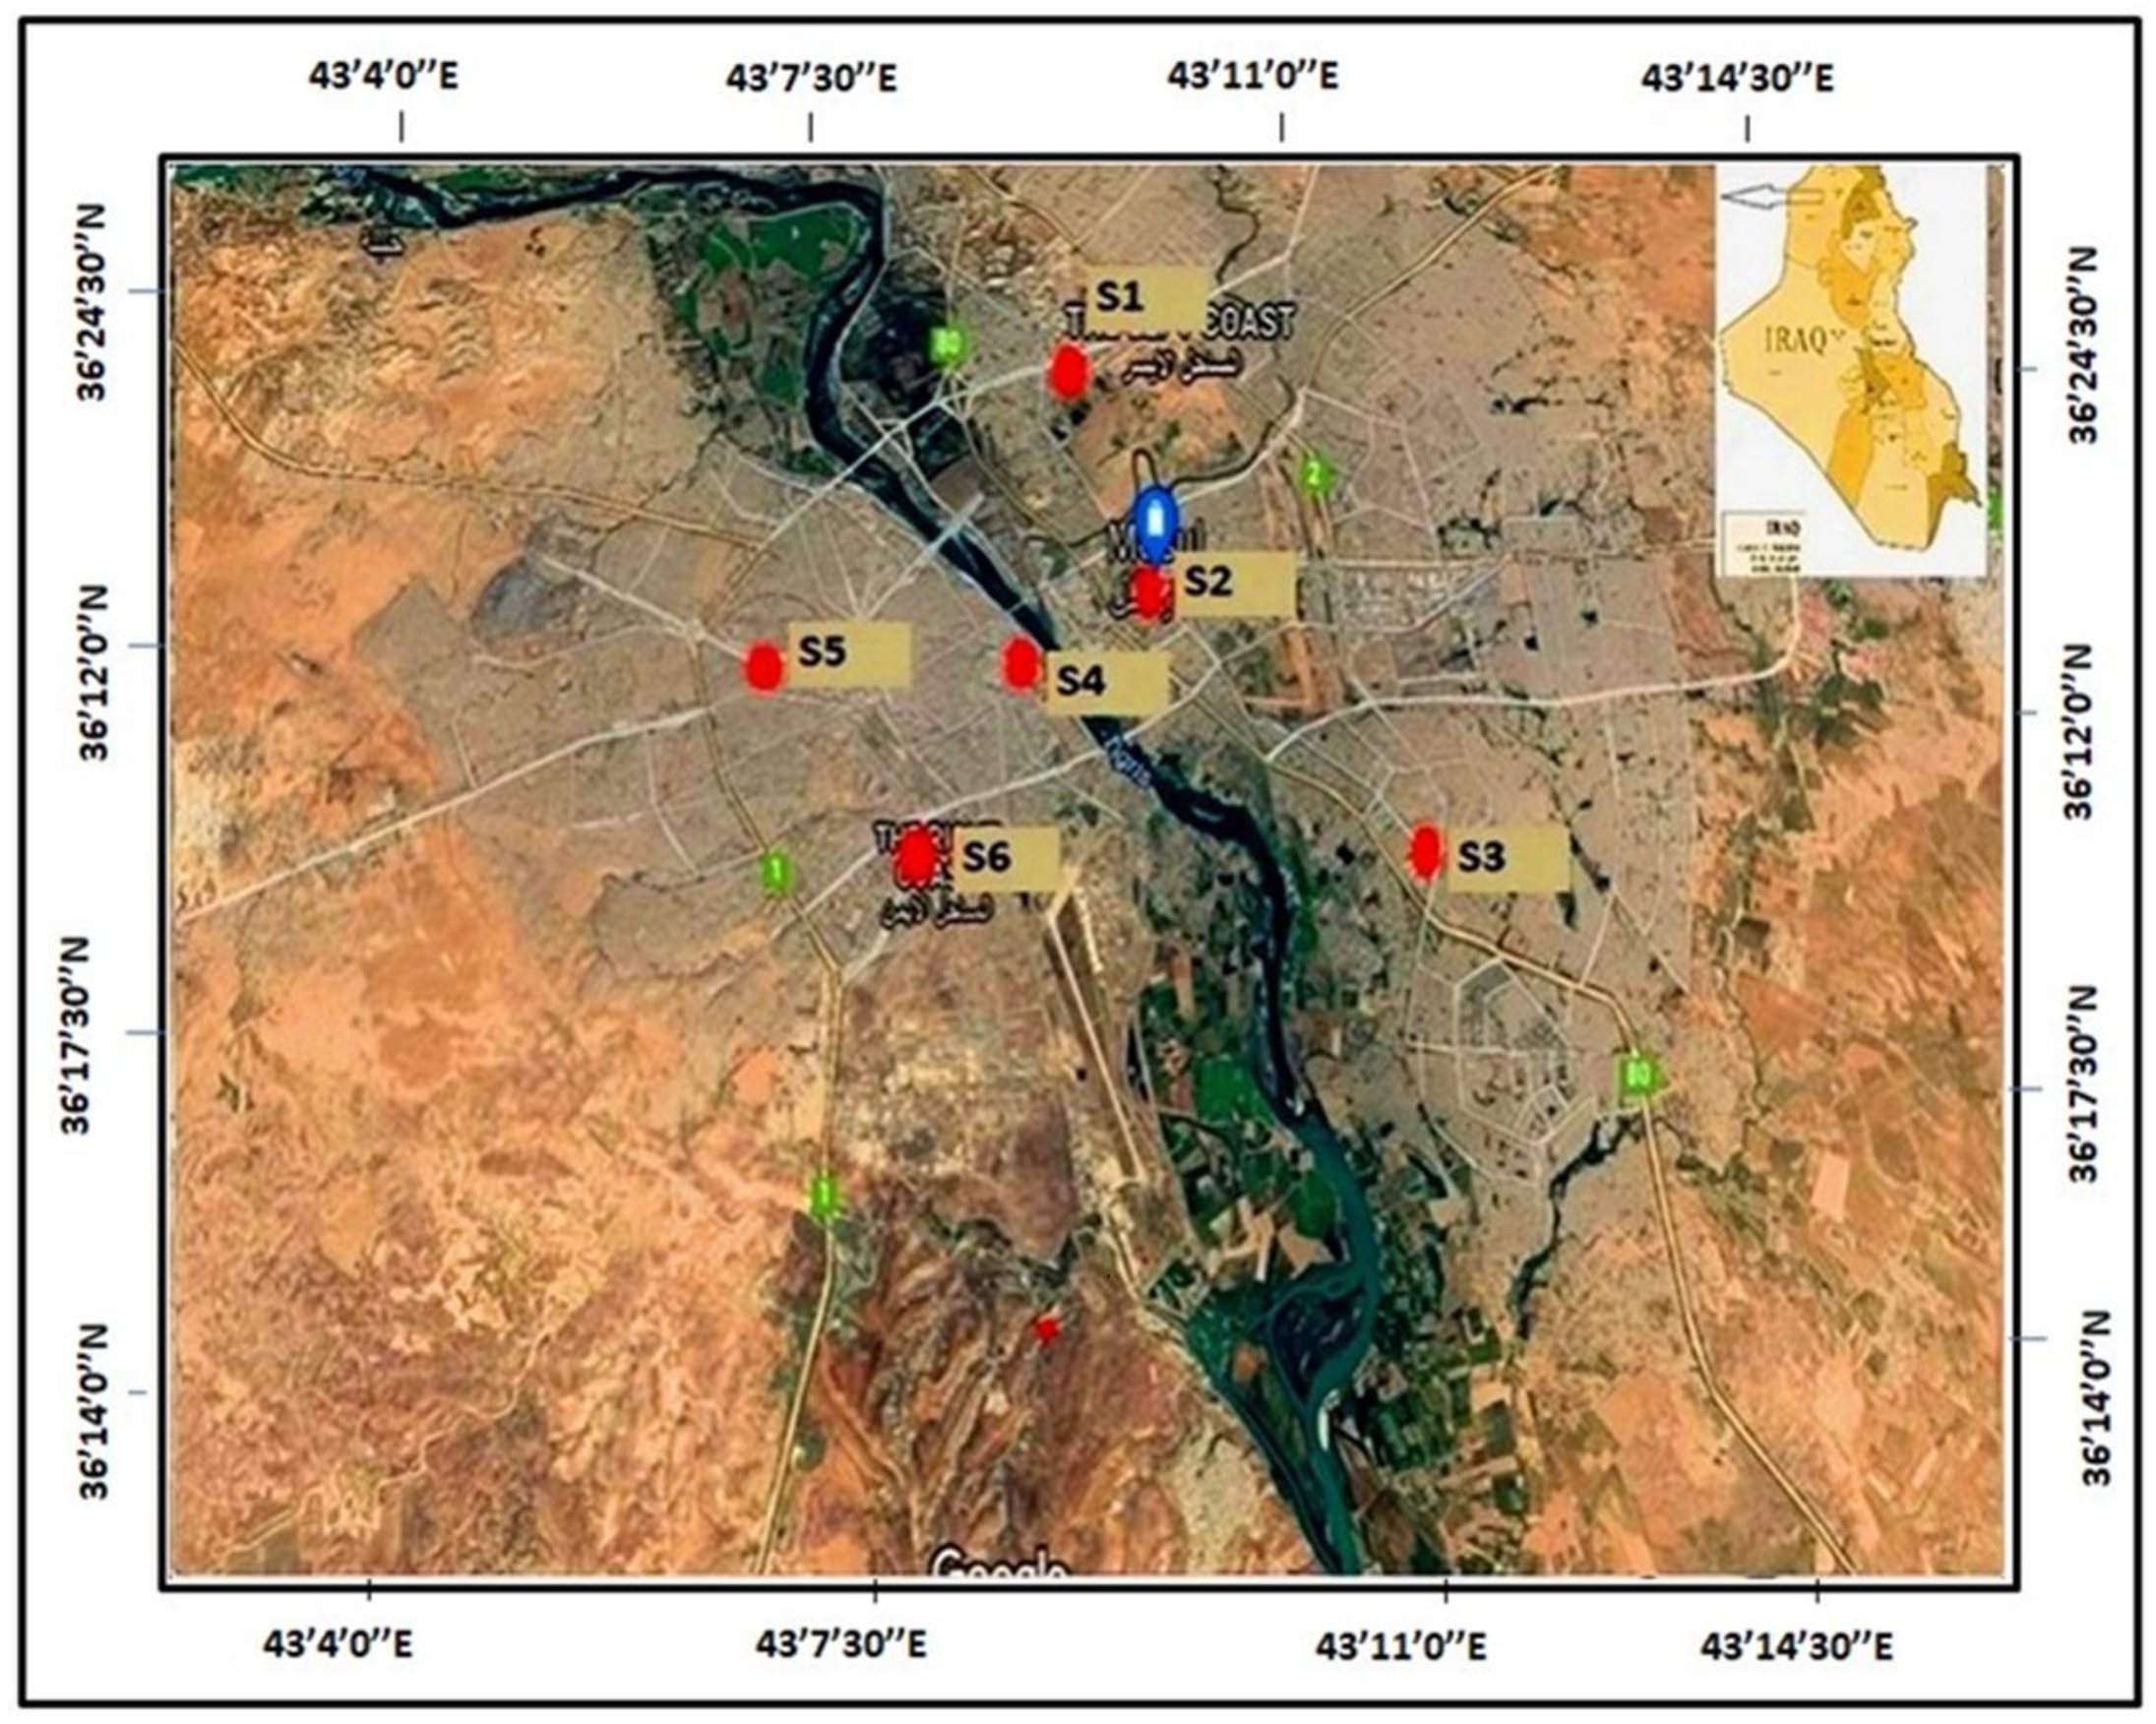
| No. | Location | Latitude N | Longitude E | Area Type | Description |
|---|---|---|---|---|---|
| S1 | Nineveh Environment Directorate | 36′375474″ N | 33′144447″ E | Residential area | Located on the left coast on a main street; close to a busy traffic intersection. |
| S2 | Public Library | 36′352716″ N | 33′225501″ E | Commercial area | Located on the left coast on a main street; close to a busy traffic intersection; close to debris area. |
| S3 | Fever Hospital | 36′326370″ N | 33′184714″ E | Residential area | Located on left coast; close to electrical generator. |
| S4 | Mosul Municipality | 36′336212″ N | 33′140137″ E | Commercial area | On right coast; close to a busy traffic intersection; close to debris area. |
| S5 | Health Center | 36′294598″ N | 33′150632″ E | Residential and commercial area | Located on right coast; located in a main street; close to debris area. |
| S6 | Alshabab Sport center | 36′273241″ N | 33′163325″ E | Service area | Located on right coast; close to busy traffic intersection and electrical generator. |
| Pollution | Avg. Time | AQI Level |
|---|---|---|
| PM2.5 (µg/m3) | Annual | 5 |
| 24 h | 15 | |
| PM10 (µg/m3) | Annual | 15 |
| 24 h | 45 | |
| NO2 (µg/m3) | Annual | 10 |
| 24 h | 25 | |
| SO2 (µg/m3) | Annual | - |
| 24 h | 40 | |
| TVOC mg/m3 | Annual | - |
| 24 h | 0.3–0.5 | |
| HCHO mg/m3 | Annual | - |
| 24 h | 0.1 |
| Year | Event |
|---|---|
| 1983 | Last pre-war year (reference year) |
| 1990 | Start of the Second Gulf War |
| 1995 | First presidential referendum of Sadam Hussein |
| 2000 | Parliamentary election in Iraq |
| 2002 | Pre-war year of the Third Gulf War |
| 2004 | Post-war year of the Third Gulf War |
| 2011 | Final withdrawal of US troops |
| 2014 | Beginning of ISIS occupation of Mosul |
| 2017 | Battle for Mosul |
| 2020 | COVID-19 lockdown |
| 2022 | Year of particularly high number of sandstorms |
| 2023 | Year of extreme heat and water scarcity due to progressive desertification |
| Year | PM2.5 (µg/m3) | Notes | Main Sources |
|---|---|---|---|
| 1983 | 40–60 | Reanalysis data (limited accuracy) | MERRA-2 aerosol diagnostics |
| 2002 | 70–90 | Increased due to wars and dust | MERRA-2 aerosol diagnostics |
| 2011 | 80–110 | Impact of sandstorms and industries | MERRA-2 aerosol diagnostics |
| 2014 | 100–150 | Peak pollution during ISIS control | MERRA-2 aerosol diagnostics |
| 2014 | 100–150 | Peak pollution (burning oil fields, ISIS battles) | MERRA-2 |
| 2015 | 110–160 | Ongoing conflicts; severe dust storms | MERRA-2 |
| 2016 | 120–170 | Infrastructure destruction; construction emissions | MERRA-2 + MODIS AOD |
| 2017 | 130–180 | Military operations, post-liberation | MERRA-2 + CAMS |
| 2018 | 100–140 | Relative decline due to partial stabilization | MERRA-2 + [8] |
| 2019 | 90–130 | Drought and increased sandstorms | MERRA-2 |
| 2020 | 80–120 | Temporary drop due to COVID-19 lockdowns | MERRA-2 + Sentinel-5P |
| 2021 | 95–135 | Recovery of industrial activities and traffic | MERRA-2 |
| 2022 | 100–140 | Increased generator usage + traffic | MERRA-2 + CAMS |
| 2023 | 105–145 | Increased generator usage + traffic | MERRA-2 + MODIS |
| Parameter | PM2.5 | PM10 | TVOC | HCHO | NO2 | SO2 | Temp. °C | Wind km/h | Humidity % | Rainfall mm |
|---|---|---|---|---|---|---|---|---|---|---|
| WHO 2021 | 5 μg/m3 | 15 μg/m3 | 0.5 mg/m3 | 0.1 mg/m3 | 10 μg/m3 | 40 μg/m3 | ||||
| Jan | 12.33 | 19.00 | 3.38 | 0.785 | 106 | 35.55 | 1.2 | 3 NW | 70 | 62.5 |
| Feb | 13.00 | 51.00 | 2.71 | 0.725 | 84.67 | 32.36 | 9.1 | 8 SW | 80 | 62.7 |
| Mar | 17.67 | 95.33 | 3.03 | 0.425 | 66.67 | 23.58 | 13.05 | 6 SW | 66 | 63.2 |
| Apr | 62.00 | 231.33 | 1.04 | 0.065 | 39.33 | 22.04 | 18.2 | 10 SW | 56 | 44.1 |
| May | 107.50 | 521.00 | 0.31 | 0.005 | 29.33 | 21.82 | 24.45 | 12 NW | 30 | 15.2 |
| Jun | 88.83 | 347.50 | 0.25 | 0.005 | 29.67 | 20.86 | 30.25 | 18 SW | 12 | 1.1 |
| Jul | 50.17 | 294.83 | 0.27 | 0.015 | 31.00 | 13.12 | 33.95 | 15 NW | 6 | 0 |
| Aug | 35.83 | 248.00 | 0.44 | 0.075 | 30.00 | 12.88 | 33.4 | 13 SW | 5 | 0 |
| Sep | 30.67 | 233.33 | 0.84 | 0.235 | 36.67 | 14.04 | 28.65 | 12 SW | 8 | 0.3 |
| Oct | 15.50 | 178.67 | 0.98 | 0.395 | 37.33 | 17.44 | 22.05 | 5 NW | 23 | 11.8 |
| Nov | 16.50 | 46.50 | 1.20 | 0.575 | 49.67 | 15.37 | 14.15 | 4 SW | 38 | 45 |
| Dec | 15.17 | 38.50 | 1.48 | 0.675 | 69.33 | 21.38 | 8.95 | 6 SW | 63 | 58 |
| Parameter | PM2.5 | PM10 | TVOC | HCHO | NO2 | SO2 | Temp. °C | Wind km/h | Humidity % | Rainfall mm |
|---|---|---|---|---|---|---|---|---|---|---|
| WHO 2021 | 5 μg/m3 | 15 μg/m3 | 0.5 mg/m3 | 0.1 mg/m3 | 10 μg/m3 | 40 μg/m3 | ||||
| Jan | 18.2 | 44.17 | 3.79 | 0.92 | 114.83 | 40.7 | 8 | 6 SW | 58 | 24 |
| Feb | 24.8 | 105.67 | 3.47 | 0.88 | 73.50 | 40.83 | 9 | 10 SW | 75 | 26 |
| Mar | 137.0 | 124.50 | 3.23 | 0.54 | 84.33 | 26.83 | 16 | 8 S | 52 | 12 |
| Apr | 44.3 | 113.00 | 1.20 | 0.13 | 66.83 | 24.75 | 15.5 | 12 SW | 56 | 28 |
| May | 64.2 | 416.67 | 0.40 | 0.12 | 31.00 | 22.52 | 23.5 | 10 SW | 30 | 4 |
| Jun | 77.8 | 408.83 | 0.37 | 0.07 | 29.83 | 24.93 | 30 | 8 SW | 22 | 16 |
| Jul | 109.2 | 414.67 | 0.44 | 0.08 | 31.33 | 16.33 | 36.25 | 10 S | 9 | 0 |
| Aug | 83.3 | 270.33 | 0.67 | 0.14 | 27.83 | 17.83 | 37.5 | 10 NW | 5 | 0 |
| Sep | 79.2 | 322.33 | 1.27 | 0.32 | 28.83 | 18.88 | 34 | 7 NW | 8 | 0 |
| Oct | 32.2 | 212.00 | 1.63 | 0.50 | 51.00 | 17.83 | 28.5 | 6 NW | 28 | 0 |
| Nov | 26.0 | 124.17 | 2.09 | 0.70 | 59.50 | 16.87 | 23.5 | 5 SW | 32 | 2 |
| Dec | 20.8 | 39.17 | 1.91 | 0.82 | 92.17 | 27.33 | 13.75 | 8 NW | 56 | 16 |
| Statistic | PM2.5 (2022) | PM2.5 (2023) | PM10 (2022) | PM10 (2023) | TVOC (2022) | TVOC (2023) | HCHO (2022) | HCHO (2023) | NO2 (2022) | NO2 (2023) | SO2 (2022) | SO2 (2023) |
|---|---|---|---|---|---|---|---|---|---|---|---|---|
| Mean | 38.7 | 59.75 | 192.08 | 224.6 | 1.33 | 1.75 | 0.325 | 0.44 | 50.8 | 57.5 | 21.8 | 25.5 |
| Std. | 32.1 | 31.16 | 158.1 | 134.8 | 1.096 | 1.19 | 0.29 | 0.32 | 25.3 | 29.3 | 7.19 | 9.6 |
| Min | 12.3 | 18.2 | 15.8 | 39.2 | 0.25 | 0.37 | 0.05 | 0.07 | 29.3 | 27.8 | 12 | 16.3 |
| 25% | 15.4 | 32.67 | 40.6 | 111.17 | 0.375 | 0.65 | 0.1 | 0.1 | 30.7 | 30.7 | 15.05 | 17.9 |
| 50% | 24.2 | 48.45 | 98 | 168.25 | 1.05 | 1.45 | 0.4 | 0.4 | 38.3 | 55.25 | 21.15 | 23.3 |
| 75% | 53.1 | 80.9 | 204.6 | 345.4 | 1.75 | 2.37 | 0.625 | 0.725 | 67.35 | 76.2 | 22.4 | 27.5 |
| Max | 1107.5 | 137 | 521 | 416.7 | 3.38 | 3.79 | 0.83 | 0.92 | 105.8 | 114.8 | 35.5 | 40.7 |
| Year | NO2 (µg/m3) | Notes | Main Sources |
|---|---|---|---|
| 1983 | 8–12 | Decline in emissions due to economic sanctions | CAMS (ECMWF, 2023) [51,71] |
| 1990 | 10–15 | Slight increase due to population growth | CAMS (ECMWF, 2023) [51] + UNDP (1992) |
| 1995 | 12–18 | Rise in generator use | MERRA-2 (GMAO, 2015) [89] |
| 2000 | 15–20 | Impact of sanctions on fuel quality | CAMS (ECMWF, 2023) [88] |
| 2004 | 10–15 | Start of OMI data; post-US invasion decline | OMI ([92] + CAMS [51] |
| 2011 | 20–30 | Peak emissions (transport, generators, industry) | OMI [92] |
| 2014 | 5–10 | Collapse of industrial activity under ISIS | OMI [92] |
| 2017 | 15–25 | Military operations, post-liberation | OMI [92] + CAMS [51] |
| 2020 | 10–18 | Temporary drop due to COVID-19 lockdowns | OMI [92] + Sentinel-5P [92 |
| 2022 | 16–25 | Increased generator usage + traffic | CAMS [51] + local reports [71] |
| 2023 | 18–29 | Economic recovery and increased traffic | CAMS [51] + OMI [51] |
| Year Range | SO2 Range (µg/m3) | Data Source/Method | Key Events/Drivers |
|---|---|---|---|
| 1983–1990 | 1.35–3.23 | Proxy: NO2/aerosol models [95] + ground reports [71] | Iran–Iraq War; industrial/vehicle emissions |
| 1991–2000 | 5.38–12.11 | Proxy: Post-Gulf War oil fires (MODIS: [97]/ASTER: [98]) | Gulf War oil fires (1991); massive HCHO release [99] |
| 2001–2010 | 2.69–6.73 | Satellite: Aura/OMI HCHO trends [100] | Post-invasion decline; sporadic industrial activity |
| 2011–2014 | 5.38–9.42 | Satellite: OMI [100] + MODIS fire data [97] | Pre-ISIS instability; oil smuggling and flaring [101] |
| 2015–2017 | 10.76–21.52 | Satellite: OMI [100] + CALIPSO aerosols [71] | ISIS occupation; refinery sabotage [100] |
| 2018–2020 | 6.73–10.76 | Satellite: Sentinel-5P/TROPOMI [51] | Post-liberation cleanup; reduced burning |
| 2021–2023 | 8.07–13.45 | Satellite: TROPOMI [92] + ground models [38] | Rebuilding; traffic, construction [93] |
| Parameter | Current Study 2022 [14] | Current Study 2023 | Factor 2023/2022 |
|---|---|---|---|
| PM2.5 μg/m3 | 39 | 59.75 | 1.51 |
| PM10 μg/m3 | 192 | 224.6 | 1.17 |
| TVOC mg/m3 | 1.33 | 1.7 | 1.27 |
| HCHO mg/m3 | 0.38 | 0.44 | 1.15 |
| NO2 μg/m3 | 50.8 | 57.8 | 1.14 |
| SO2 μg/m3 | 21 | 24.6 | 1.21 |
| Parameter | Previous Study 2014 * | Current Study 2022 | Current Study 2023 | Factor 2022/2014 | Factor 2023/2014 |
|---|---|---|---|---|---|
| PM2.5 μg/m3 | ND | 39 | 59.75 | ND | ND |
| PM10 μg/m3 | 157 | 192 | 224.6 | 1.2 | 1.43 |
| TVOC mg/m3 | 0.033 | 1.33 | 1.7 | 40.3 | 51.5 |
| HCHO mg/m3 | ND | 0.38 | 0.44 | ND | ND |
| NO2 μg/m3 | 24.3 | 50.8 | 58 | 2 | 2.5 |
| SO2 μg/m3 | 18 | 21 | 25.5 | 1.16 | 1.36 |
| Parameter | 2022 | 2023 | ||||||
|---|---|---|---|---|---|---|---|---|
| T | p | Df | Status | T | p | Df | Status | |
| PM2.5 | 3.833896 | 0.001648901 | 10 | 1 | 4.222991 | 0.000882 | 10 | 1 |
| PM10 | 4.700504 | 0.000420462 | 10 | 1 | 3.798245 | 0.001748 | 10 | 1 |
| TVOC | −3.62857 | 0.002311747 | 10 | 1 | −4.78069 | 0.000372 | 10 | 1 |
| HCHO | −7.11706 | 1.61448 × 10⁻⁵ | 10 | 1 | −7.15569 | 1.54 × 10⁻⁵ | 10 | 1 |
| NO2 | −3.5763 | 0.002521302 | 10 | 1 | −3.82846 | 0.001664 | 10 | 1 |
| SO2 | −1.80277 | 0.04019654 | 10 | 1 | −1.65005 | 0.04973 | 10 | 1 |
| Parameter | T | p | Df | Status |
|---|---|---|---|---|
| PM2.5 | −0.43544 | 0.133742 | 22 | 0 |
| PM10 | −1.06109 | 0.150079 | 22 | 0 |
| TVOC | −0.78814 | 0.219512 | 22 | 0 |
| HCHO | −0.80935 | 0.213491 | 22 | 0 |
| NO2 | −1.00928 | 0.161907 | 22 | 0 |
| SO2 | −1.13514 | 0.134267 | 22 | 0 |
Disclaimer/Publisher’s Note: The statements, opinions and data contained in all publications are solely those of the individual author(s) and contributor(s) and not of MDPI and/or the editor(s). MDPI and/or the editor(s) disclaim responsibility for any injury to people or property resulting from any ideas, methods, instructions or products referred to in the content. |
© 2025 by the authors. Licensee MDPI, Basel, Switzerland. This article is an open access article distributed under the terms and conditions of the Creative Commons Attribution (CC BY) license (https://creativecommons.org/licenses/by/4.0/).
Share and Cite
Altahaan, Z.; Dobslaw, D. Assessing Long-Term Post-Conflict Air Pollution: Trends and Implications for Air Quality in Mosul, Iraq. Atmosphere 2025, 16, 756. https://doi.org/10.3390/atmos16070756
Altahaan Z, Dobslaw D. Assessing Long-Term Post-Conflict Air Pollution: Trends and Implications for Air Quality in Mosul, Iraq. Atmosphere. 2025; 16(7):756. https://doi.org/10.3390/atmos16070756
Chicago/Turabian StyleAltahaan, Zena, and Daniel Dobslaw. 2025. "Assessing Long-Term Post-Conflict Air Pollution: Trends and Implications for Air Quality in Mosul, Iraq" Atmosphere 16, no. 7: 756. https://doi.org/10.3390/atmos16070756
APA StyleAltahaan, Z., & Dobslaw, D. (2025). Assessing Long-Term Post-Conflict Air Pollution: Trends and Implications for Air Quality in Mosul, Iraq. Atmosphere, 16(7), 756. https://doi.org/10.3390/atmos16070756