Article

The Cost of Heat: Health and Economic Burdens in Three Brazilian Cities

by
Daniela Debone
1,2,*,
Nilton Manuel Évora do Rosário
3 and
Simone Georges El Khouri Miraglia
1,2,*
1
Departamento de Engenharia Química, Instituto de Ciências Ambientais, Químicas e Farmacêuticas, Universidade Federal de São Paulo (UNIFESP), Diadema 09913-030, Brazil
2
Antimicrobial Resistance Institute of São Paulo (ARIES), São Paulo 04023-900, Brazil
3
Departamento de Ciências Ambientais, Instituto de Ciências Ambientais, Químicas e Farmacêuticas, Universidade Federal de São Paulo (UNIFESP), Diadema 09913-030, Brazil
*
Authors to whom correspondence should be addressed.
Atmosphere 2025, 16(7), 755; https://doi.org/10.3390/atmos16070755
Submission received: 1 May 2025 / Revised: 3 June 2025 / Accepted: 19 June 2025 / Published: 20 June 2025
(This article belongs to the Section Air Quality and Health)

Abstract

Excess mortality due to heat is a major public health concern globally. In this study, we investigated the association between extreme heat and mortality in three distinct locations in São Paulo state, Brazil—São Paulo city (the capital), Campinas (a large countryside city), and Marília (a typical medium-sized rural city)—from 2004 to 2018. We applied a generalized linear model (GLM) with a Poisson distribution and a logarithmic link function for each city, using the excess heat factor (EHF) as the exposure metric. The results showed that increases in the EHF were associated with relative risks of 1.0018 (95% CI: 1.0015–1.0022) in São Paulo, 1.0029 (95% CI: 1.0023–1.0036) in Campinas, and 1.0033 (95% CI: 1.0025–1.0041) in Marília. Altogether, 2319 heat-attributable deaths were estimated, representing an economic burden of USD 6.03 billion based on the value of a statistical life. By integrating economic valuation with mortality risk estimates, our study offers a broader perspective on the consequences of extreme heat, reinforcing the need for public health and policy interventions.

1. Introduction

Greenhouse gases (GHGs) remain a concern due to the intensity of economic activity and the persistence of production-based emissions in countries that have not implemented sufficient reduction measures. According to the IPCC, the total net anthropogenic GHG emissions continued to rise during the period of 2010–2019, and cumulative net CO2 emissions have been rising since 1850. Moreover, the average annual GHG emissions in the period 2010–2019 were higher than those in any previous decade [1]. The persistent growth in anthropogenic emissions is driving current climate change, which, in turn, is having several impacts, with one of the most important being adverse health impacts. Indeed, climate change is among the greatest public health threats of the 21st century and a modifier of the global burden of disease [2], the direct effects of which can lead to acute and chronic diseases as a result of increased or decreased temperatures, extreme climate events, food and water insecurity, air pollution, and vector-borne diseases [3].
Globally, approximately 489,000 heat-related deaths have been estimated to have occurred each year between 2000 and 2019 [4]. Recent epidemiological evidence has indicated a substantial rise in heat-related mortality across Latin America. Between 2013 and 2022, countries in the region experienced, on average, a 140% increase in heat-related deaths compared to 2000–2009 [5]. This growing health burden is compounded by increased exposure to other climate-related risks, such as wildfires, with Brazil, Chile, Venezuela, Argentina, and Colombia experiencing a marked increase in the number of days classified as having very high or extreme fire risk. As a recent example, between mid-August and mid-September 2024, Brazil faced an unprecedented environmental crisis, with smoke from widespread fires severely affecting air quality as far as São Paulo, thousands of kilometers from the fire outbreaks. During this period, concentrations of air pollutants, such as fine particulate matter, increased by 144.26% compared to the same period in 2023, resulting in a 3.5% increase in cardiorespiratory risks and a notable rise in hospital visits for respiratory conditions [6]. This scenario highlights how climate-related hazards—extreme heat and air pollution from wildfires—interact to amplify health risks, particularly in highly urbanized areas. Additionally, during the 2013–2022 period, the number of heatwave days increased dramatically among vulnerable populations—by 248% for infants and 271% for people aged 65 and older—compared with 1986–2005 [5].
Extreme ambient temperatures are strongly associated with increased mortality and morbidity, particularly among individuals with pre-existing conditions, such as cardiovascular, respiratory, renal, and metabolic diseases. Exposure to heat can trigger a range of acute health outcomes, including heatstroke, dehydration, an electrolyte imbalance, and the exacerbation of chronic conditions. Cardiovascular stress caused by heat leads to increased risks of myocardial infarction, arrhythmia, heart failure, and stroke, while respiratory diseases are aggravated due to impaired thermoregulation, the dehydration of airways, and elevated levels of pollutants commonly associated with heatwaves. Additionally, extreme heat disproportionately affects older adults, infants, and socioeconomically disadvantaged populations, who have a reduced physiological or adaptive capacity to cope with thermal stress [7,8,9,10,11,12,13,14].
Identifying and measuring heat-related deaths can provide quantitative results for comparison purposes, thus enabling the recognition of the main temperature threats and a monitoring alert for both developed and developing countries to avoid these additional climate impacts.
Several epidemiological studies have related high temperatures to health outcomes, characterizing their relationship by evaluating heat either at ambient temperature or during heatwaves [15,16,17,18]. These studies have analyzed the predictability of heatwaves and have associated them with different time ranges according to the locations’ overall characteristics, usually forecasting future waves.
Temperature–mortality associations have been established using different statistical models [19,20,21,22], such as Poisson regression; generalized linear models (GLMs), with a quasi-Poisson distribution or a logarithmic link function; and nonlinear distributed lag models. We employ GLMs with a Poisson distribution for our analyses, as they present distinct advantages in capturing the nuanced relationship between ambient temperature and human health effects. Furthermore, assessing the impacts of the excess heat factor (EHF) [23] on human health provides a basis for characterizing the relation between excess heat severity and health and different magnitudes of the impact for early warning purposes.
The EHF considers the average temperature for a period of 3 days in relation to a climatological temperature threshold (95th percentile) for the municipality in question. Additionally, the EHF metric considers acclimatization by including a comparison of the current 3-day average temperature with the last 30-day average. Severe excess heat events are identified by considering EHFs above the 85th percentile of the EHF historical series for the municipality itself, and extreme events are evaluated by considering three times the value of the 85th percentile of the EHFs [23].
The public health risks from extremely hot days have been reported worldwide [4,5,10], and investigations evaluating the patterns and magnitudes of these impacts in a developing country are important for planning mitigation measures and developing public policies to protect the population.
Understanding the magnitude and distribution of heat-related mortality is fundamental for informing climate adaptation policies, developing heat–health warning systems, and guiding investments in public health infrastructure. Moreover, by integrating an economic assessment through the value of a statistical life (VSL)—a widely used metric in environmental economics that reflects the monetary value that individuals assign to small reductions in mortality risk based on their willingness to pay [24,25,26,27] —this study provides decision-makers with a concrete estimation of the financial burden of heat-attributable deaths. These insights are crucial for supporting evidence-based actions aiming to reduce climate vulnerability, particularly in urban centers located in the state of São Paulo, which are increasingly exposed to extreme heat events.
São Paulo, Campinas, and Marília are selected as study sites because they represent different geographic regions within the state of São Paulo, Brazil, ensuring a comprehensive examination of the relationship between ambient temperature and human health across varied climatic and urban–rural contexts. Additionally, the inclusion of these locations allows for an exploration of how temperature-related health effects may differ among populations with distinct demographic profiles and socioeconomic and climate adaptation characteristics. Furthermore, the availability of reliable climate and health data in these urban centers facilitates rigorous and insightful analyses. Given the importance of São Paulo, Campinas, and Marília as distinct references of population centers in São Paulo state [28], focusing on these cities enables us to address epidemiological questions relevant to local and regional public health concerns, thus informing targeted policy interventions at the regional level and the effectiveness of adaptation strategies.
Although the adverse impacts of extreme heat on public health are well established, to the best of our knowledge, no previous studies have combined the EHF with an economic valuation of heat-related mortality based on the VSL. This is the first study to provide an integrated health and economic assessment within this framework. There is a critical need for locally grounded evidence to support effective adaptation policies, and this study directly addresses this gap by providing both epidemiological and economic assessments of heat-related mortality.
To address this gap, we conducted a study to assess the impact of ambient excess heat on mortality in São Paulo, Campinas, and Marília, Brazil, between 2004 and 2018. We analyzed the relationship between extreme heat and mortality for respiratory, cardiovascular, and all-cause deaths. Additionally, we estimated the economic valuation of heat-attributable mortality by applying the VSL approach, providing a reference for climate change policy assessments.

2. Materials and Methods
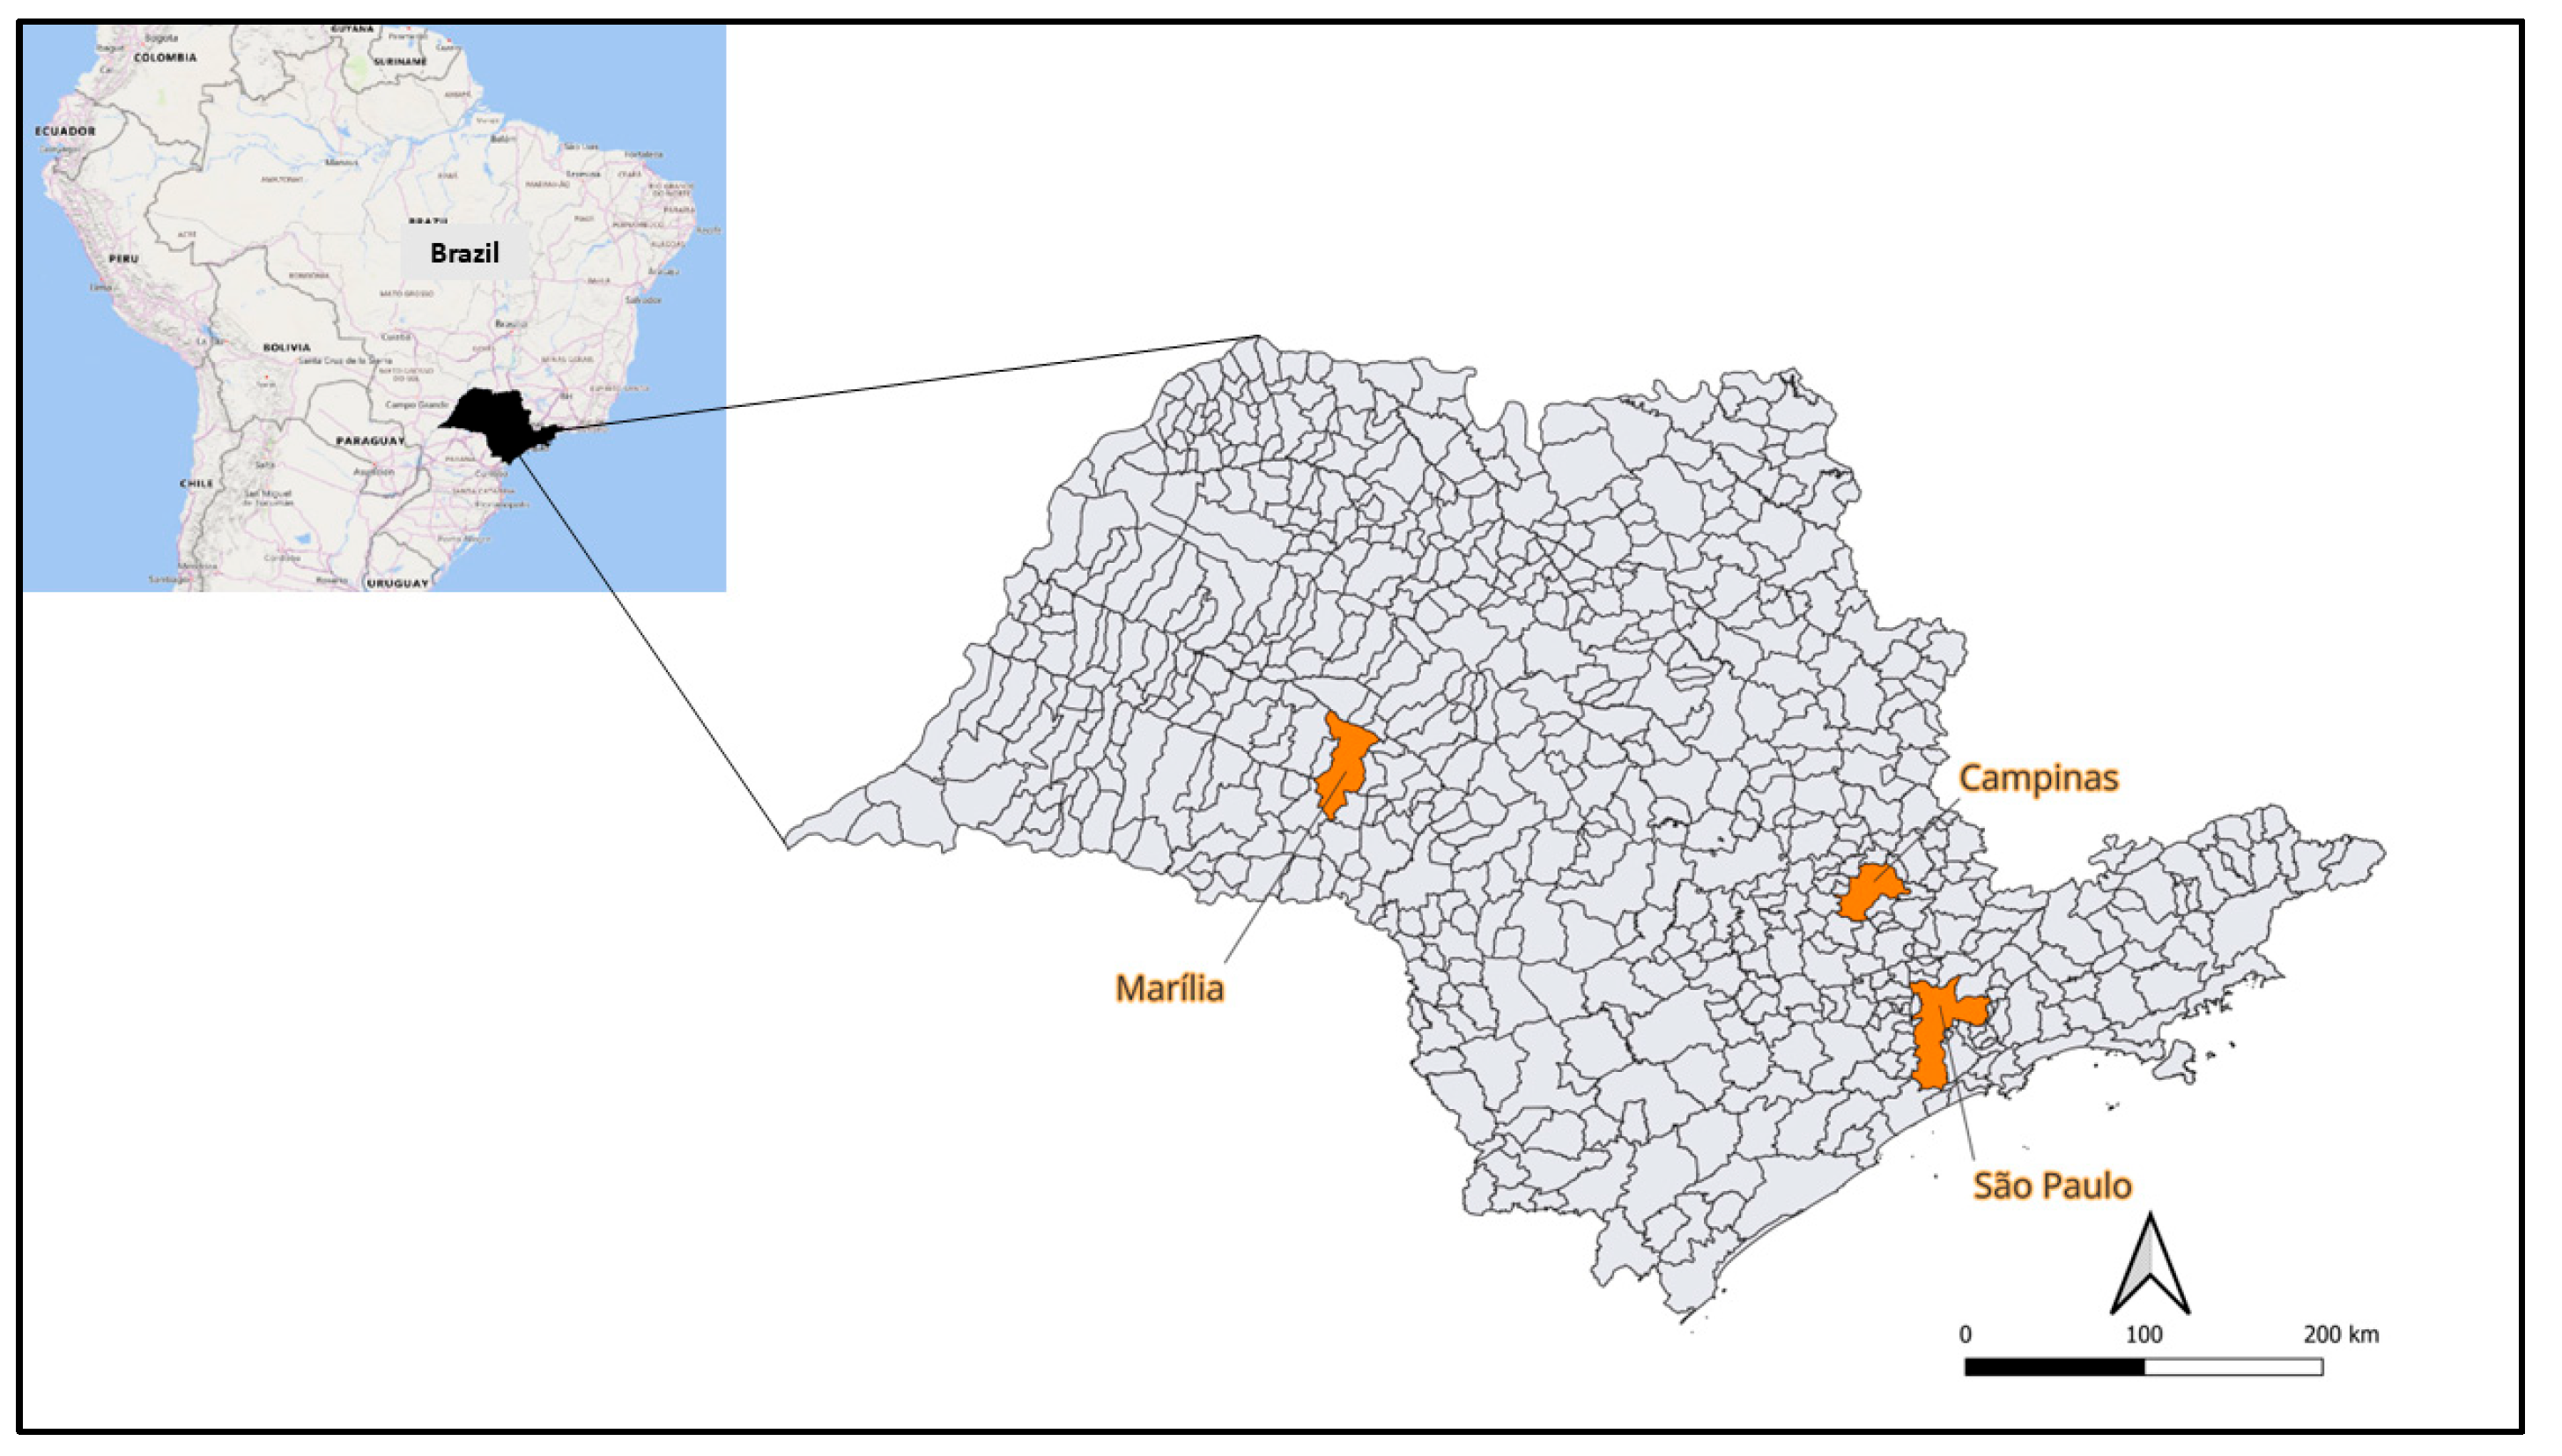
2.1. Study Area

Analyses were conducted in the cities of São Paulo, Campinas, and Marília, all located in the state of São Paulo. São Paulo, a megacity with 11,451,999 inhabitants, has a population density of 7528.26 inhabitants per square kilometer and an urbanized area of 914.56 km2. Campinas, a medium-sized city, has 1,139,047 residents, a population density of 1433.54 inhabitants per square kilometer, and an urbanized area of 245.14 km2. Marília, a smaller city, is home to 237,627 inhabitants, with a population density of 203.01 inhabitants per square kilometer and an urbanized area of 69.09 km2. Despite these differences, the municipalities share similar climatic conditions, characterized by dry winters and hot, rainy summers [28]. Figure 1 shows the geographical locations of the selected municipalities.

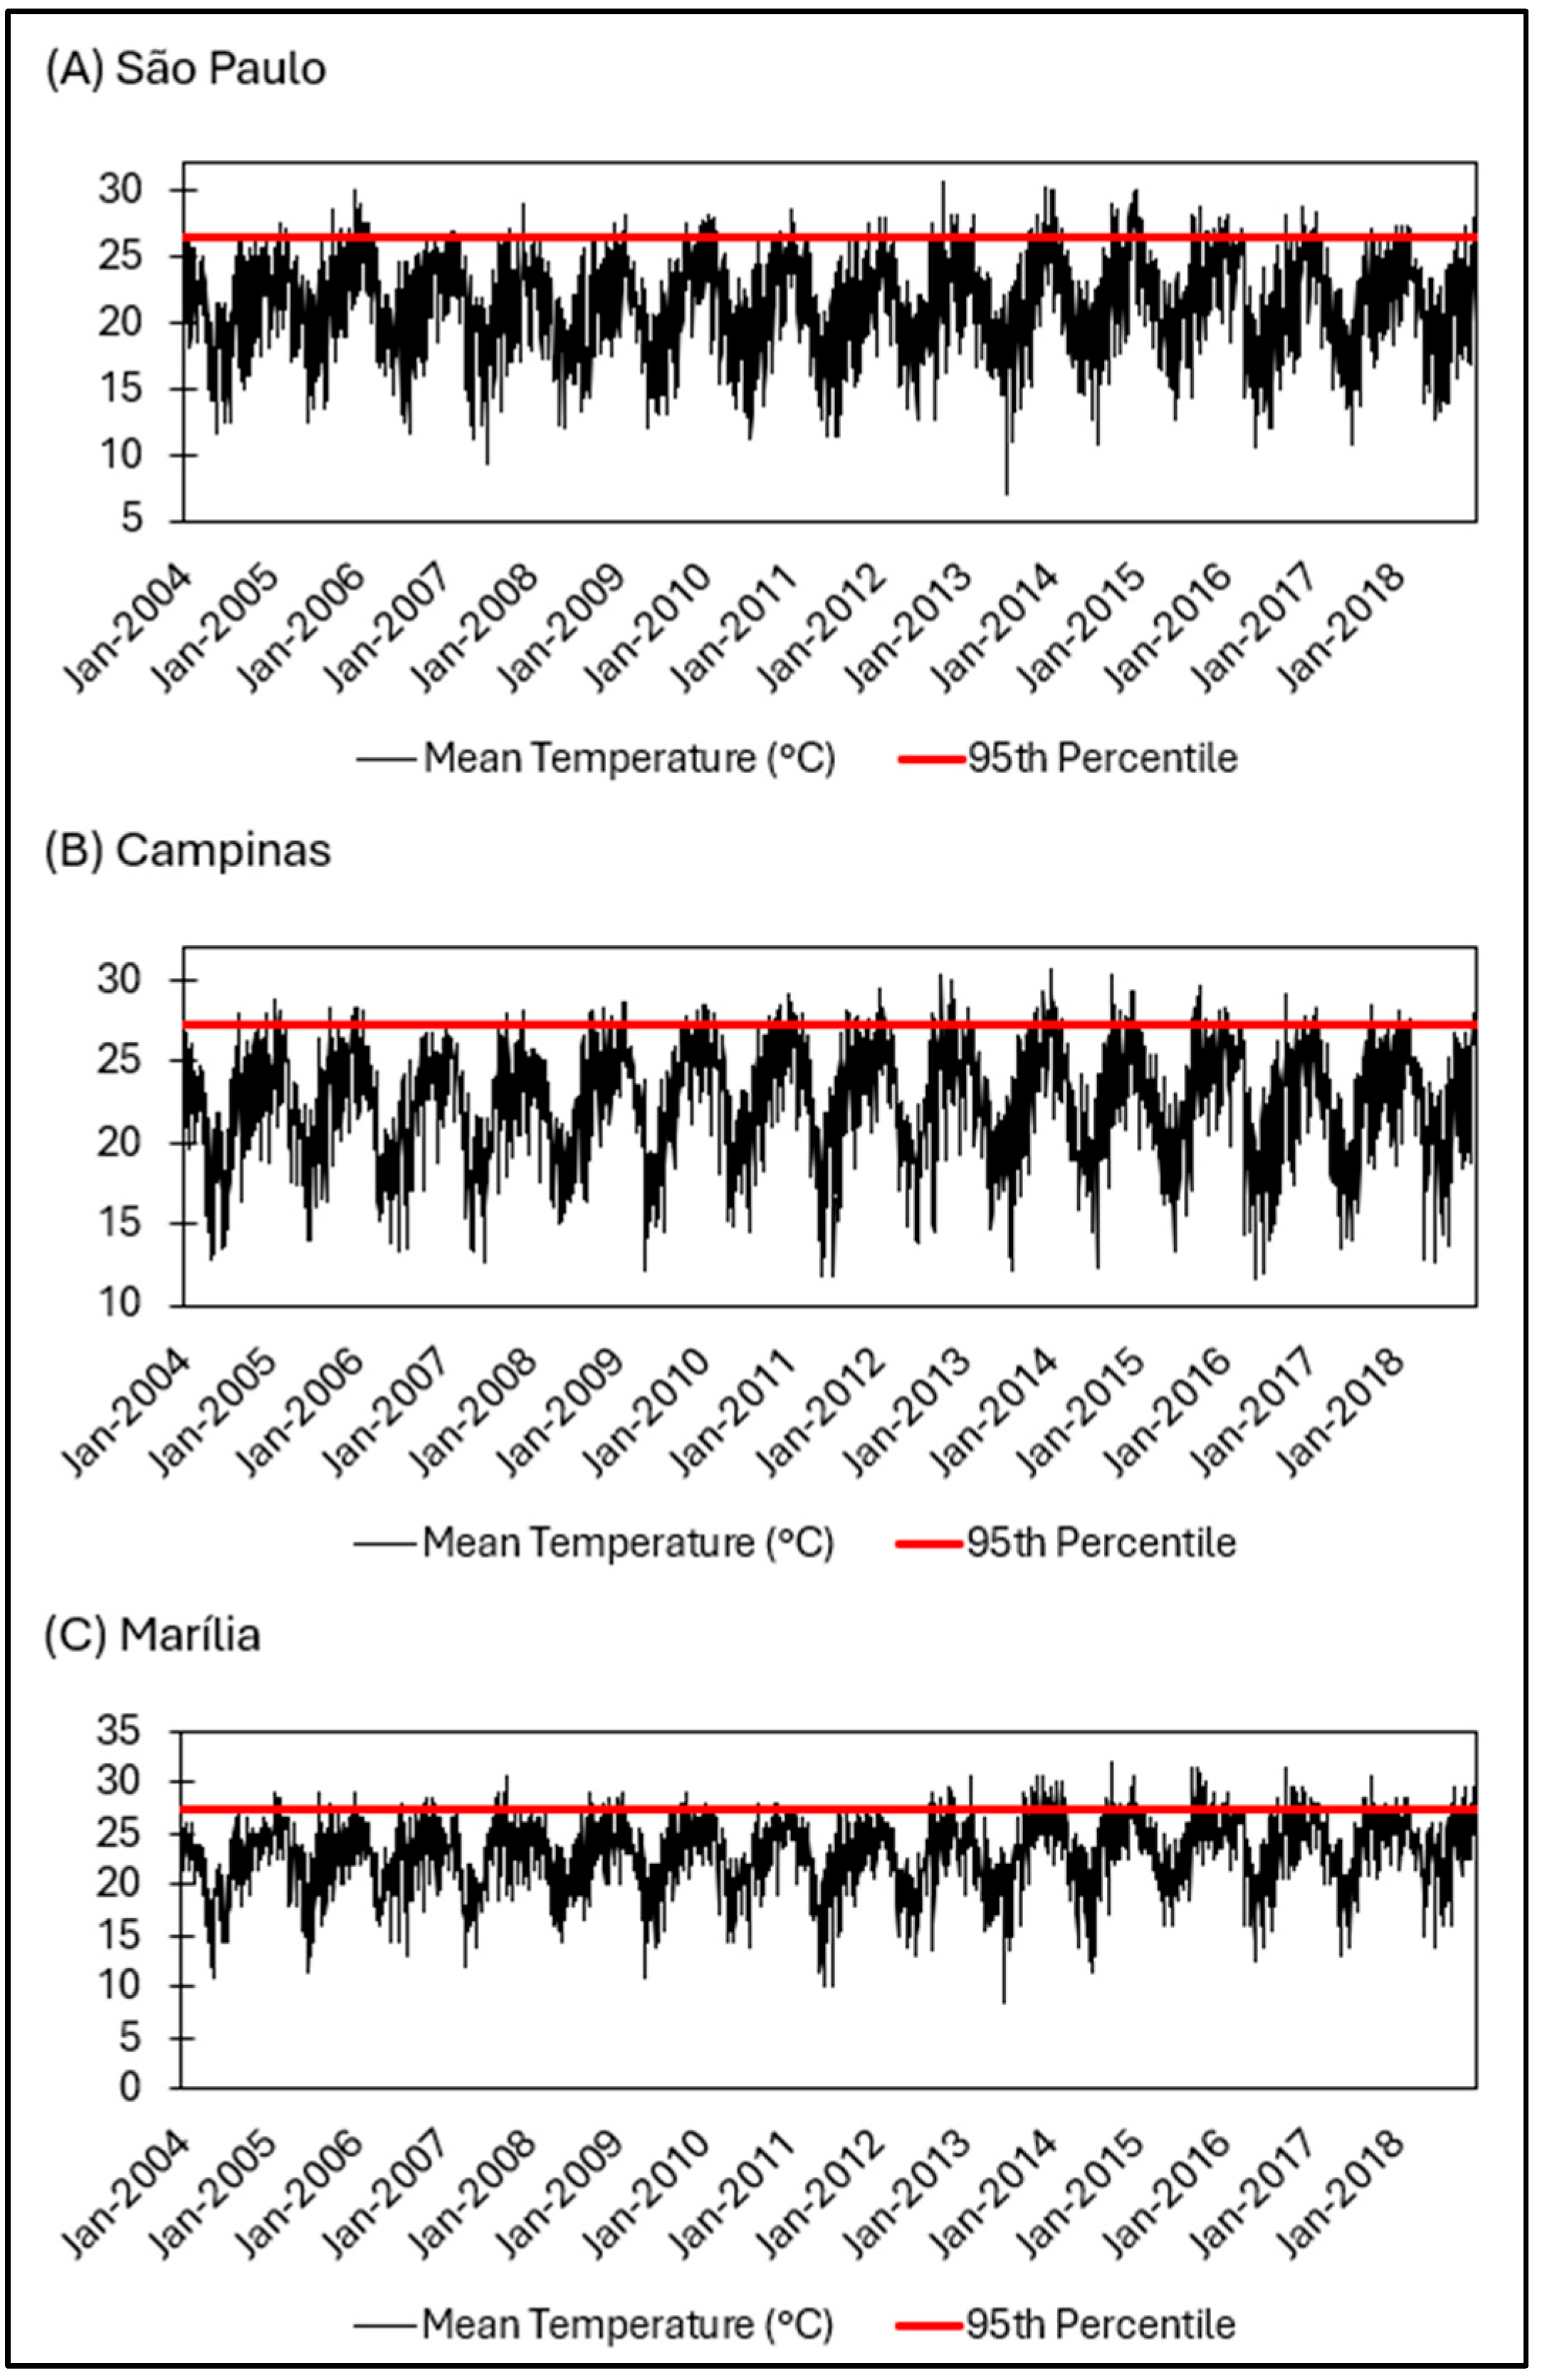
2.2. Meteorological Data

Meteorological data were obtained from the National Institute of Meteorology (INMET) [29] and the Brazilian Agrometeorological Monitoring System (AGRITEMPO) [30]. For São Paulo, we considered data from the Mirante de Santana station (23°29′ S, 46°37′ W); for Campinas, we used data from the CEPAGRI/UNICAMP monitoring station (22°49′ S, 47°04′ W); and for Marília, we used data from TRMM 1149 (Tropical Rainfall Measuring Mission—22°13′ S, 49°56′ W). To ensure consistency and comparability across cities, we used a single representative weather station for each study location. For São Paulo and Campinas, we selected central city monitoring stations, which are commonly used in environmental epidemiology studies and have been shown to adequately capture population-level exposure to temperature and air pollution. For Marília, due to limitations in ground-based measurements and to maximize the temporal coverage of the dataset, we used data from a satellite-based station, which provides a longer and more continuous time series. The raw daily mean air temperature from 2004 to 2018 was obtained from each station and used as the input variable to calculate the EHF.

2.3. Mortality Data

The dataset for the daily mortality in each city for the period from 2004 to 2018 was based on the 10th revision of the International Classification of Diseases (ICD-10) and was collected from the Brazilian Health System Database (DATASUS) [31]. Specifically, we collected data on cardiovascular mortality (ICD-10, Chapter IX), respiratory mortality (ICD-10, Chapter X), and all-cause mortality. Mortality data were modeled using daily counts for each cause, with no exclusions for holidays or weekends. No specific adjustments were made for calendar-related variations. This choice reflects the exploratory nature of the analysis, aiming to estimate the total effect of the EHF on mortality without introducing further assumptions or controls that could dilute the climate–health relationship under investigation.

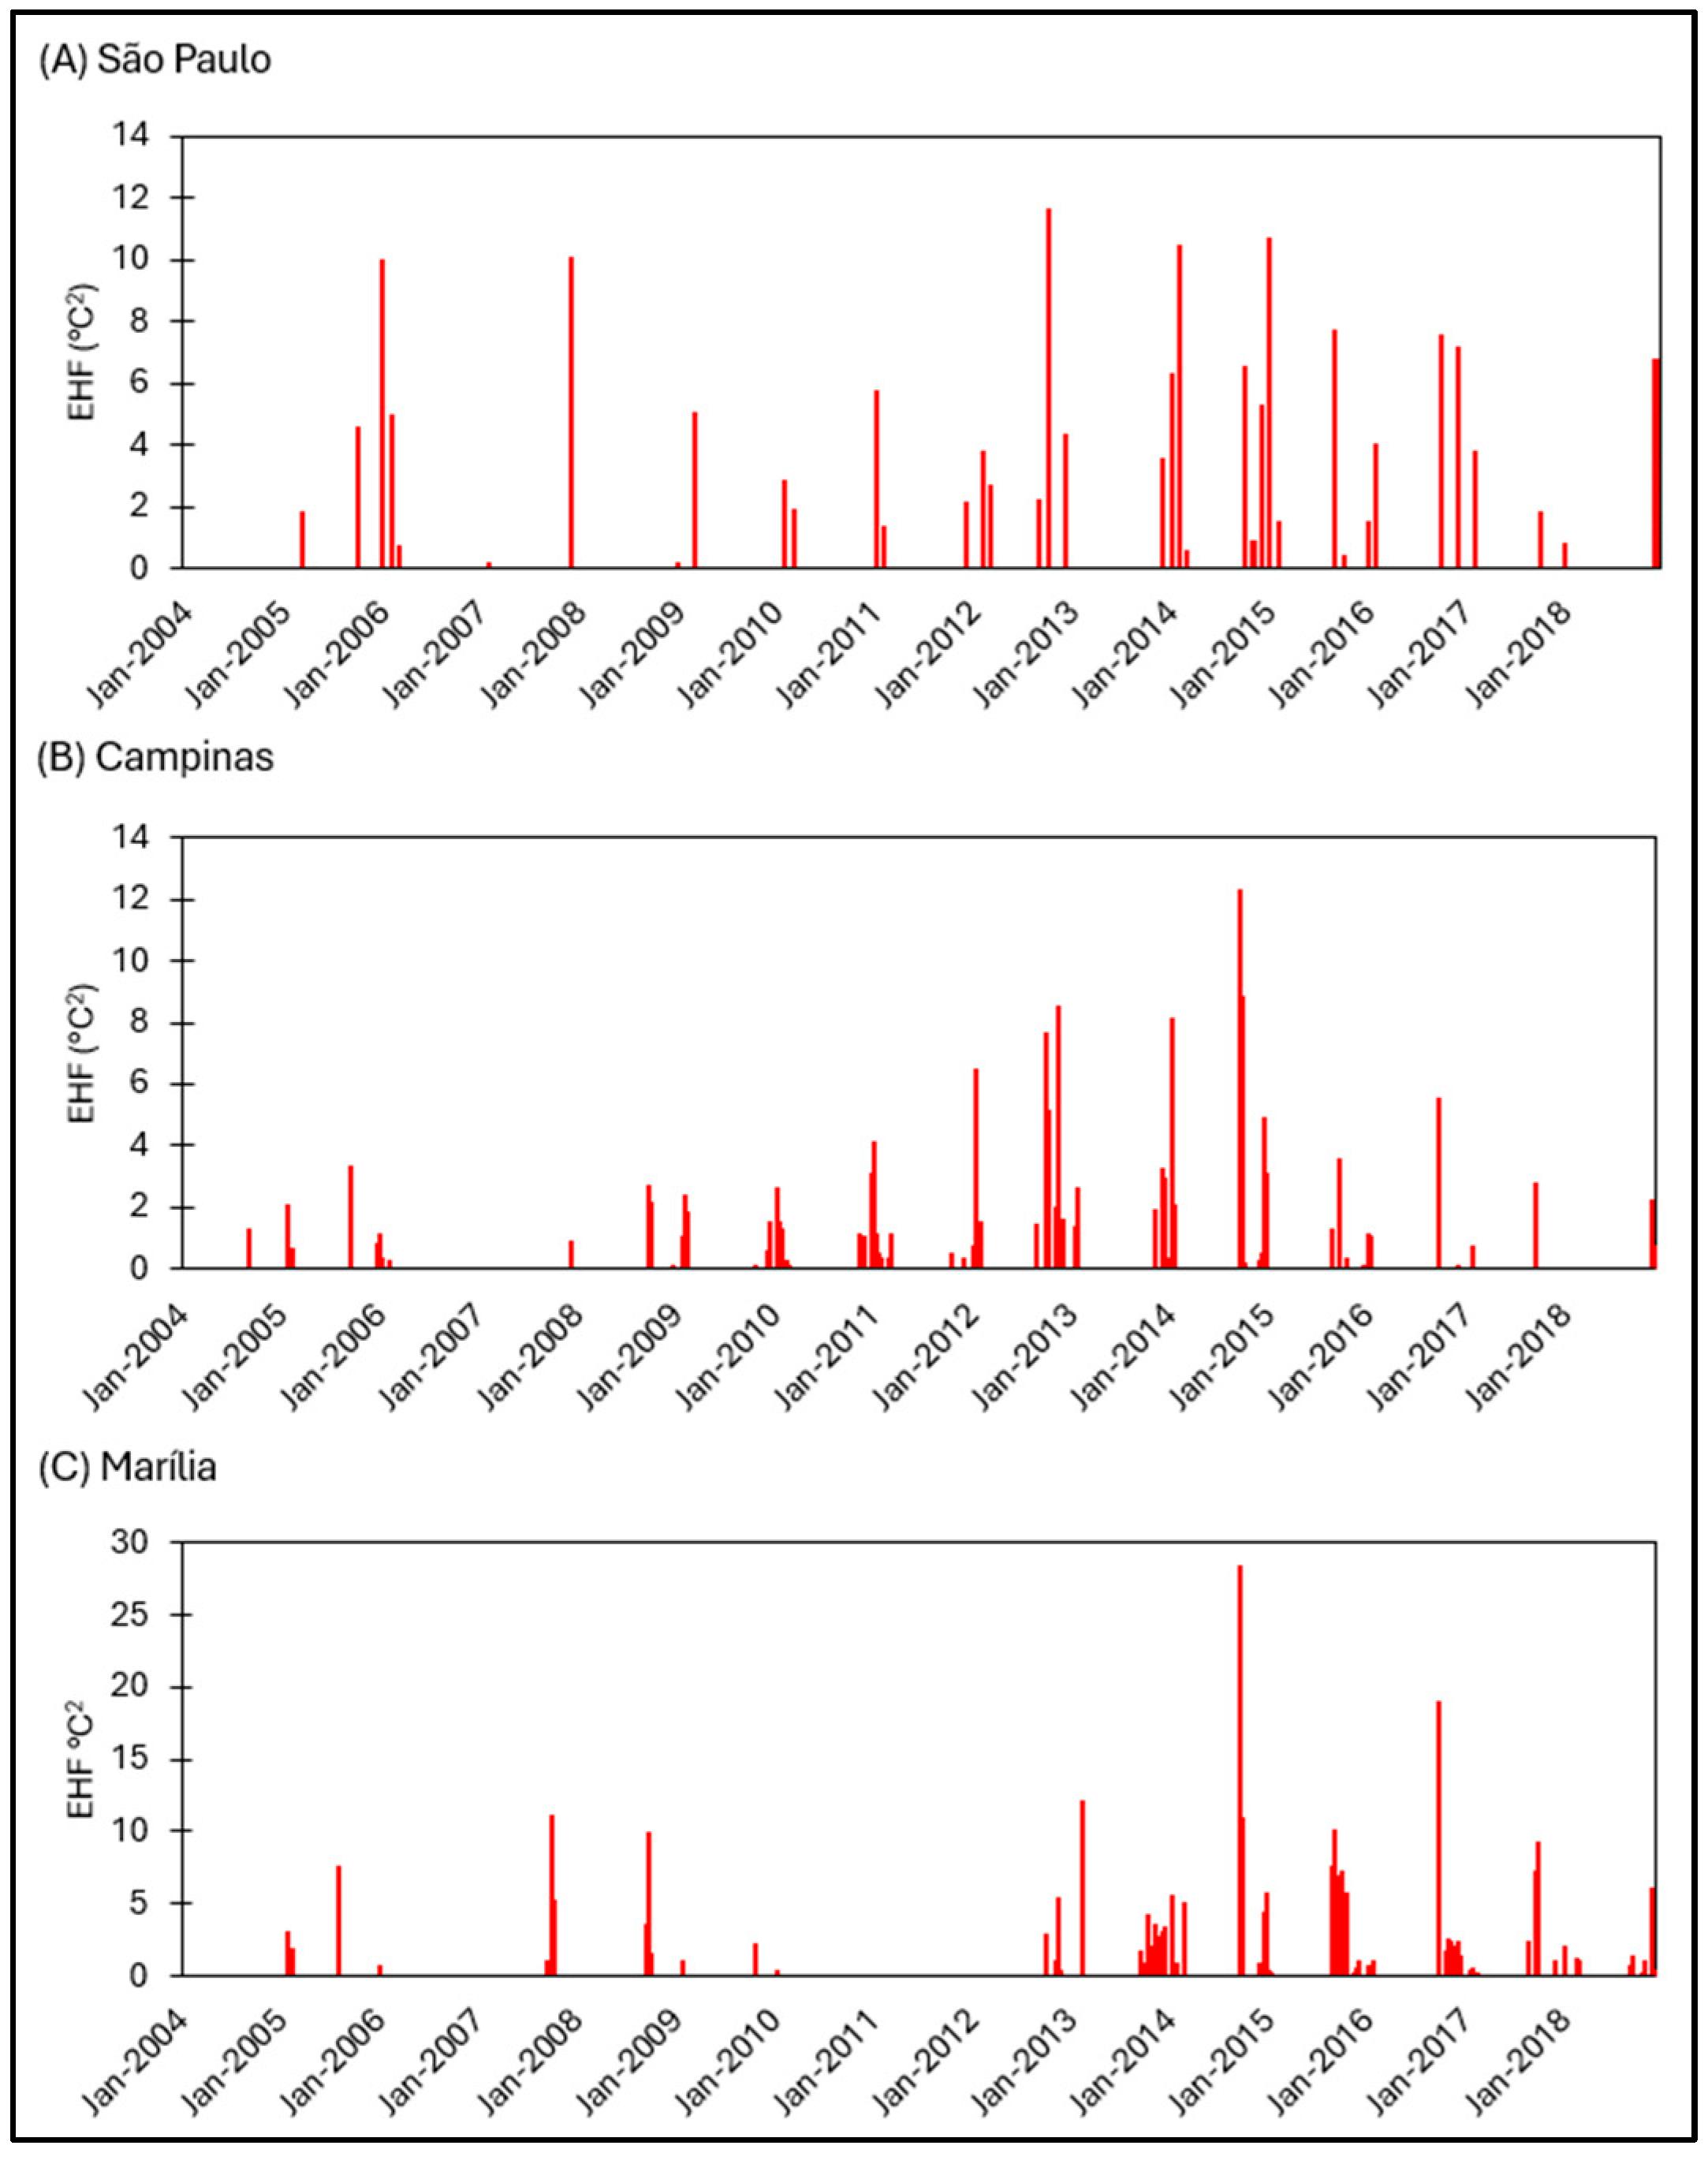
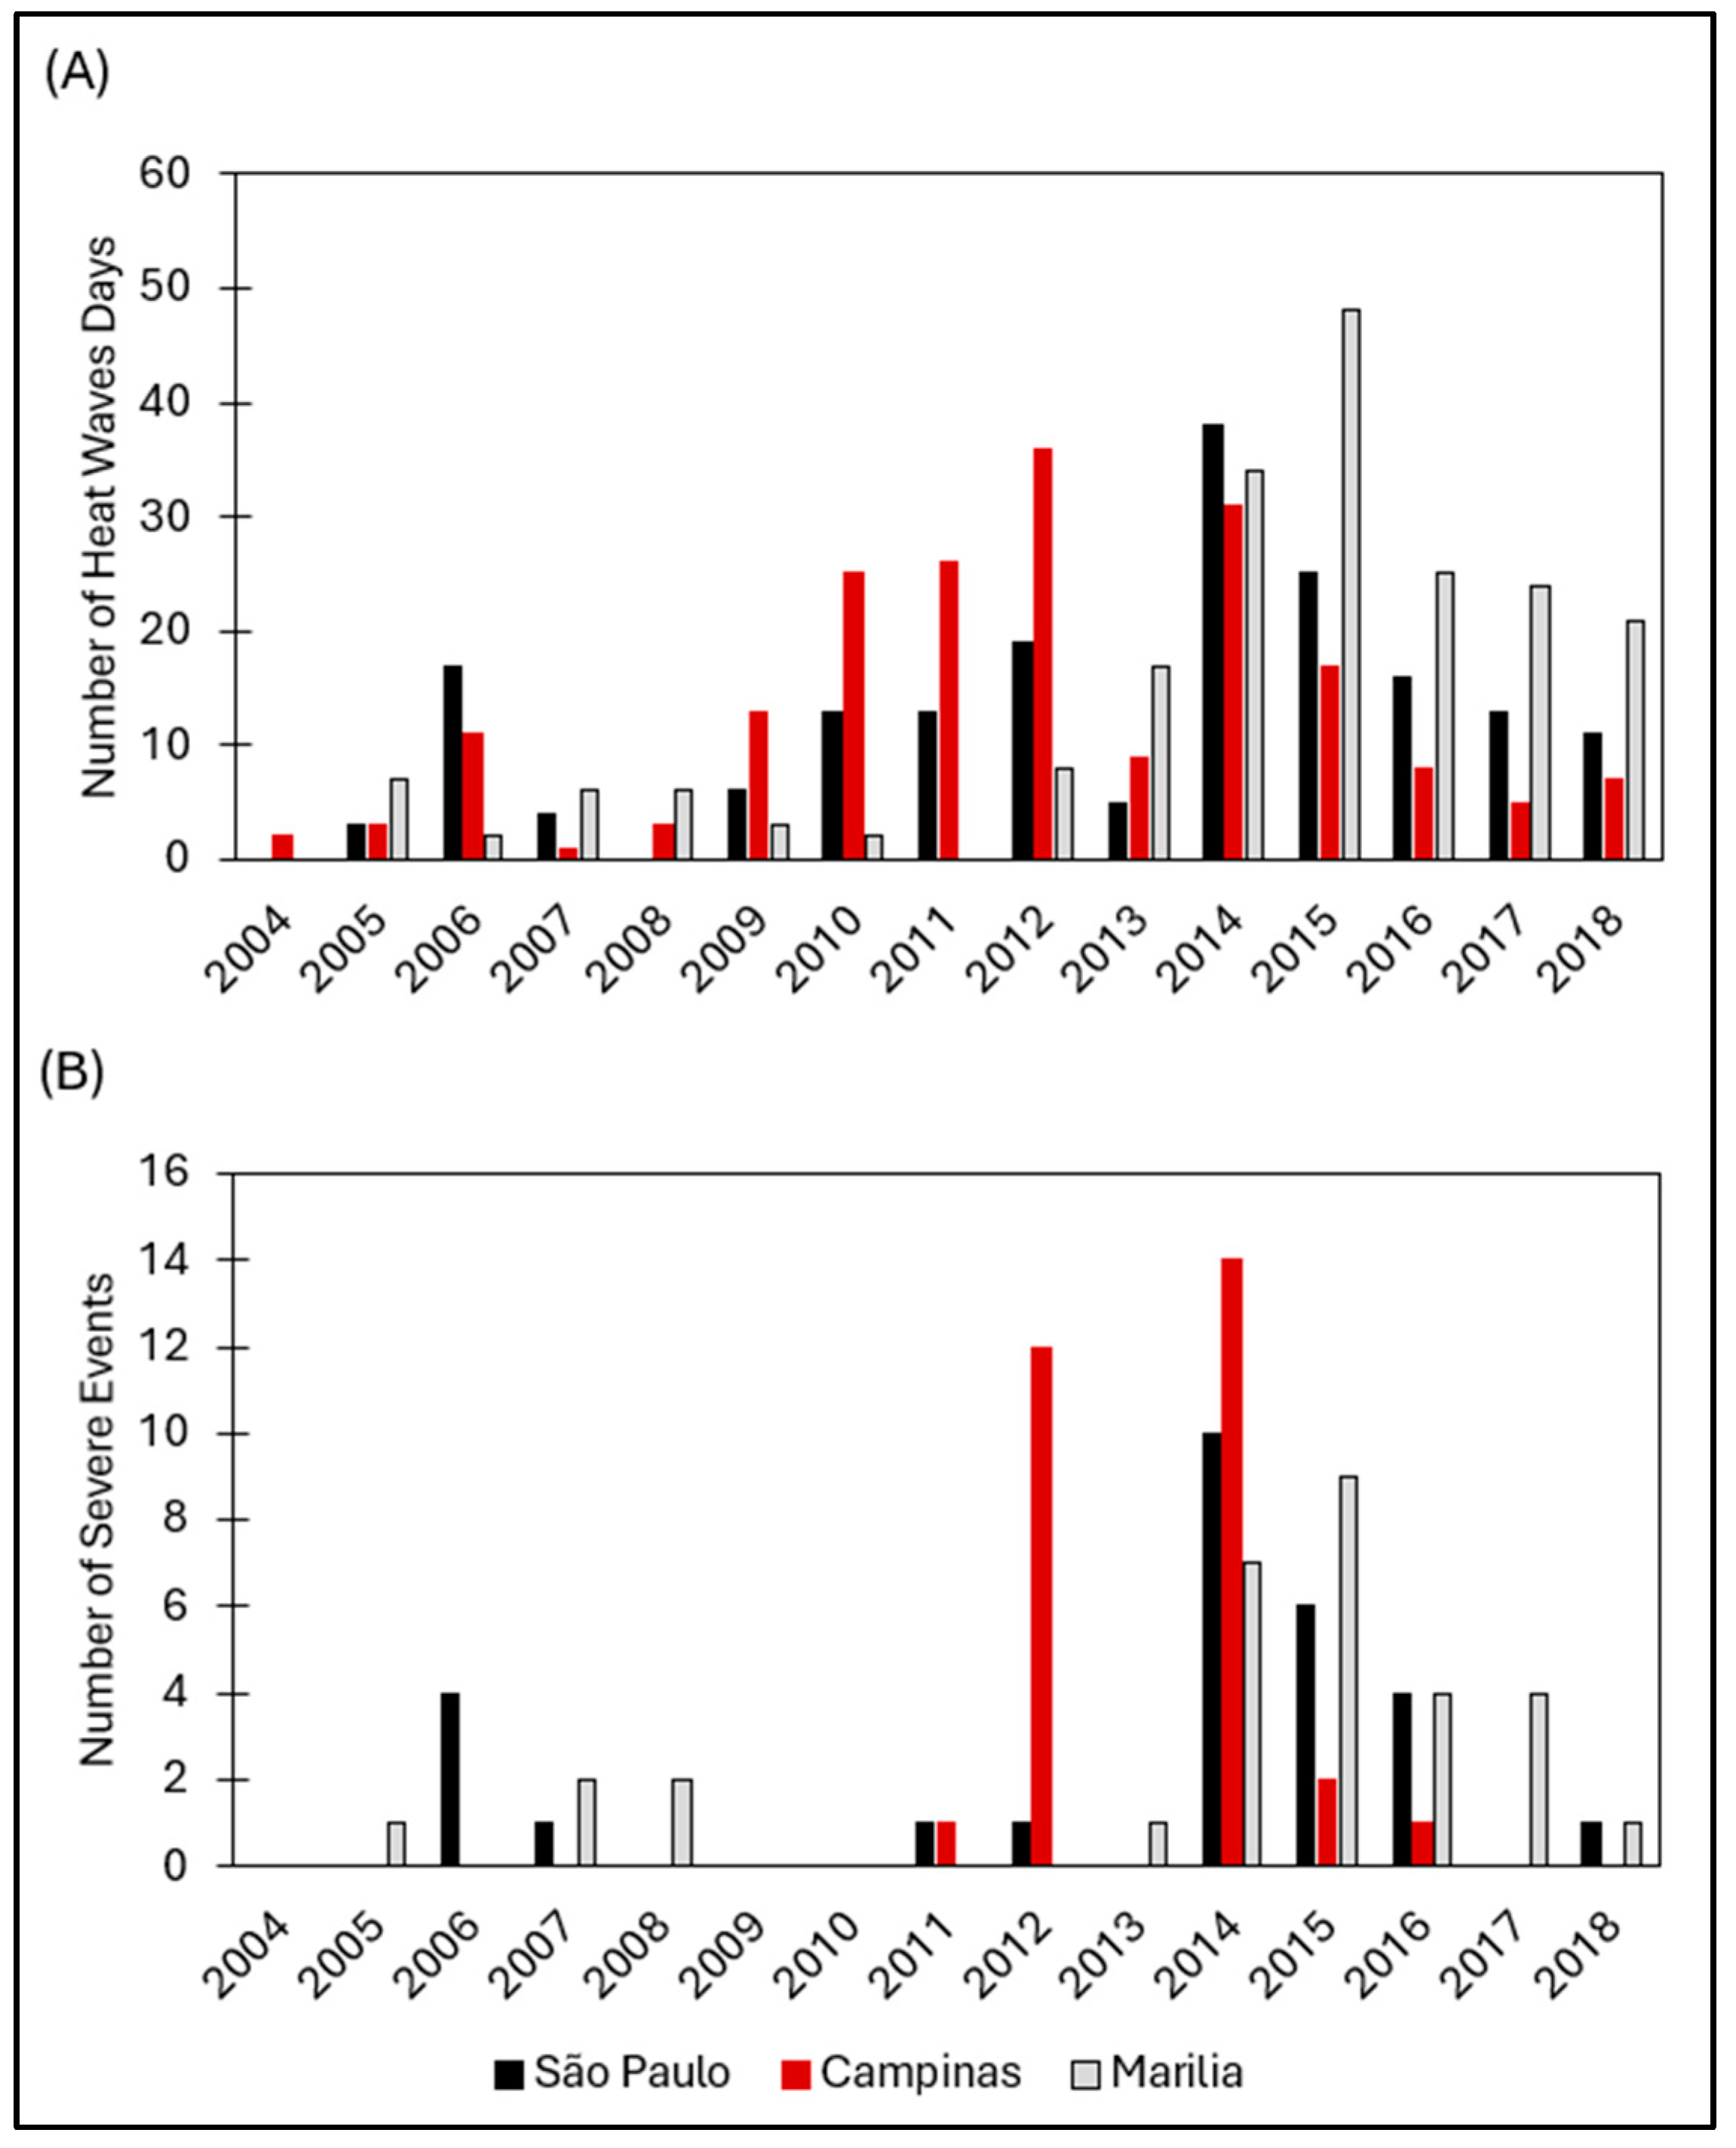
2.4. Excess Heat Factor

The EHF is a metric developed to assess and monitor heatwaves [23], and it has been widely used as a predictor of heatwave impacts on human health [32,33]. It takes into account the effect of excess heat and heat stress by combining two indices considering both short- and long-term temperature anomalies [34]. It has been used and evaluated across the world in different climate scenarios and contexts, revealing its effectiveness as a metric that enables comparisons of international heatwave events and their impacts, and it has already been implemented in several international heatwave early warning systems [32]. The EHF is obtained as a product of two sub-indices, the Excess Heat Index Significance (EHIsig), which measures the difference between the 3-day average temperature and the 95th percentile of the daily temperature for the reference period (here, 2004–2018), and the Excess Heat Index Acclimatization (EHIaccl), which measures the difference between the 3-day average temperature and the average temperature of the preceding 30 days. The long-term temperature anomaly evaluation is represented in the EHIsig calculations as follows:
EHIsig = (Ti + Ti+1 + Ti+2)/3 − T95
where Ti, Ti+1, Ti+2 represent the sequence of the 3-day mean temperature, and T95 is the 95th percentile of the daily mean temperature (Ti) for the climate reference period of 2004–2018. The following equation considers the heat stress induced by the short-term temperature anomaly:
EHIaccl = (Ti + Ti+1 + Ti+2)/3 − (Ti–1+ … + Ti–30)/30
Finally, the EHF is obtained as follows:
EHF = EHIsig × max (1, EHIaccl)
The 95th and 85th percentiles were considered to assess different levels of heat intensity. The 95th percentile represents extreme values of the EHF, indicating more severe heat impacts experienced by 5% of the highest records. The 85th percentile represents EHF values higher than 85% of records, providing insights into the responses to intense but less extreme heat. Both percentiles are crucial for evaluating resilience and planning adaptations to manage the risks associated with varying levels of heat impact [32,33,34].

2.5. Generalized Linear Model (GLM)

GLMs with a Poisson distribution and a logarithmic link function were used to assess the association between cause-specific mortality (all-cause, cardiovascular, and respiratory) and EHF in each municipality.
A separate model was fitted for each combination of municipality and health outcome, allowing for localized estimates of the EHF–mortality relationship. No additional covariates were included; the models were intended to estimate the total effect of the EHF on mortality under an exploratory framework, as applied in contexts where time-varying confounders are unavailable or inconsistently measured across settings.
This approach ensured that distinct models were applied to each health outcome, allowing for a comprehensive examination of the impact of heat exposure on different aspects of mortality within each study area. The models can be represented according to the following equation:
log   E Y | x = α + β x
where β represents the effect of each explanatory variable x on the response variable Y. Poisson regression assumes that the logarithm of the mean of the response variable Y (mortality) can be modeled as a linear combination of the explanatory variables x (EHF).
Using the exposure–response coefficients of each model, we were able to estimate the probability of mortality associated with exposure to heatwaves, referred to as the relative risk (RR). Thereafter, the RR values were used to infer the attributable fraction (AF), the fraction of deaths attributable to EHF, in order to estimate the daily mortality caused by days with extreme heat records.
RR = exp[β(EHF)]
AF = (RR − 1)/RR
The choice of a GLM with a Poisson distribution was justified by its suitability for modeling count data, such as mortality counts, where the outcome variable represents the number of events occurring within a specific time period, with daily data considered in the analysis. Additionally, the logarithmic link function was selected because it facilitates the interpretation of relative risks associated with changes in the exposure variable (in this case, the EHF) for each health outcome. For all analyses, as well as the creation of graphs and tables, IBM SPSS version 26.0 and Microsoft Excel were used.

2.6. Valuation of Mortality Risk

An estimation of mortality valuation associated with heatwaves is an important tool for informing climate change policy assessments. In order to conduct this analysis, we compiled studies’ reviews on different values of statistical life (VSLs) in OECD countries and the USA, as no VSL estimate study has been conducted in Brazil for changes in mortality risks in the environmental and health contexts [35].
The VSL is a widely applied metric in environmental economics and health risk assessment. It represents the monetary value that individuals assign to marginal reductions in mortality risk, reflecting their willingness to pay (WTP) for a small decrease in the probability of premature death [24,25,26,27].
We adopted an intermediate VSL value from the literature review to establish a comparable reference among European and American studies, considering a VSL for Brazil of USD 2.6 million (Table 1).

3. Results

Figure 2 presents the interannual variability in the daily mean temperatures (DMTs) for São Paulo, Campinas, and Marília, along with their 95th percentiles, serving as long-term references (2004–2018) for evaluating heatwaves. For São Paulo, the DMT varied between 7 °C and 30.5 °C. Throughout the time series, occasional records above the 95th percentile (26.5 °C) were observed, but they rarely exceeded 30 °C. The Campinas DMT ranged from 11.6 °C to 30.7 °C. Throughout the time series, sporadic events above the 95th percentile (27.2 °C) were observed, and a few even surpassed 30 °C. Finally, the Marília DMT ranged from 8.5 °C to 32 °C. It is worth noting that, among the municipalities, Marília had the highest value in the 95th percentile.
Strong interannual variability was observed in the occurrence of excess heat events, with an increase in heatwave occurrence from 2010 onwards, which peaked in 2014/2015 for São Paulo and Campinas. For Marília, the events were more frequent from 2013 onwards. Throughout the time series, the highest EHF values observed were 11.64 (2012), 12.32 (2012), and 28.4 (2014) for São Paulo, Campinas, and Marília, respectively (Figure 3).
Regarding the number of heatwave events (Figure 4A), São Paulo, Campinas, and Marília presented 183, 197, and 203 events throughout the analyzed period, respectively, with the highest numbers occurring in 2014 and 2015. Additionally, the municipalities experienced 28, 30, and 31 severe heatwave events, respectively, defined as days with EHF values greater than or equal to the 85th percentile (EHF > 5.71 for São Paulo, >3.79 for Campinas, and >5.69 for Marília), as depicted in Figure 4B.
The results of the relative risk and attributable death analyses for total, cardiovascular, and respiratory deaths in each municipality, as well as the mortality economic valuation, are presented in Table 2.
In São Paulo, an increase of 1 unit in the EHF was associated with a RR of 1.0018 (95% CI: 1.0015–1.0022) for total deaths, 1.0017 (95% CI: 1.0014–1.0021) for respiratory deaths, and 1.0012 (95% CI: 1.0010–1.0015) for cardiovascular deaths. Based on these results, we estimated that approximately 1960 total deaths, 239 respiratory deaths, and 415 cardiovascular deaths in São Paulo could be attributed to heatwave exposure. In Campinas, an increase of 1 unit in the EHF was associated with RR values of 1.0029 (95% CI: 1.0023–1.0036) for total deaths, 1.0054 (95% CI: 1.0042–1.0066) for respiratory deaths, and 1.0006 (95% CI: 1.0005–1.0007) for cardiovascular deaths. Consequently, we estimated that approximately 286 total deaths, 78 respiratory deaths, and 18 cardiovascular deaths in Campinas could be attributed to heatwave exposure. In Marília, an increase of 1 unit in the EHF was associated with RR values of 1.0033 (95% CI: 1.0025–1.0041) for total deaths, 1.0008 (95% CI: 1.0006–1.0010) for respiratory deaths, and 1.0055 (95% CI: 1.0041–1.0069) for cardiovascular deaths. Based on these findings, approximately 73 total deaths, 2 respiratory deaths, and 36 cardiovascular deaths in Marília could be attributed to heatwave events.
The cumulative attributable total deaths from São Paulo (1960), Campinas (286), and Marília (73) amounted to 2319 deaths, representing an economic burden of USD 6.03 billion. These findings highlight the considerable impact of extreme heat on mortality across the analyzed cities, reflecting the significant financial burden associated with the health risks of heatwaves.
Figure 5 illustrates a consistent pattern across the three cities, with relative risks greater than 1 predominantly concentrated in the warmer months. Conversely, the coldest months (April to August) consistently exhibited relative risks equal to or close to 1. While the magnitude of the risks varies between cities and causes of death, the seasonal pattern—characterized by higher risks during hotter months—is clearly demonstrated. This result is consistent with the fact that the EHF captures periods of anomalous heat, which are naturally more frequent and impactful during the warm season.

4. Discussion

The impacts of high temperatures on human health, particularly those affecting the elderly and economically disadvantaged populations, have been extensively studied [13]. However, there is no standardization in the published analyses, and statistical models vary widely, as well as the climatic variables considered, including the maximum temperature, average temperature, apparent temperature, relative humidity, atmospheric pollutants, cumulative heat, and other heat excess indices [21,36,37,38,39,40,41].
The incorporation of the EHF as an exposure metric represents a methodological strength of this study, especially in the Brazilian context, where its use remains limited. By accounting for both short- and long-term temperature anomalies and population acclimatization, the EHF offers a more precise characterization of extreme heat events than conventional indicators [23,32]. This improves the specificity of exposure assessment and reinforces the consistency and interpretability of the observed associations. Although formal causal inference methods were not applied, the relationship between heat and mortality is well established in environmental epidemiology, supported by the plausibility of associated physiological mechanisms and consistent temporal patterns linking heat exposure to health outcomes [10,21,42]. In this context, our findings contribute to the growing body of evidence suggesting a likely causal link between heatwaves and increased mortality.
Our analysis revealed that heatwaves, as represented by the EHF, are associated with increased relative risks of mortality across São Paulo, Campinas, and Marília. In São Paulo, this increase corresponded to a relative risk of 1.0018 (95% CI: 1.0015–1.0022) for total deaths, 1.0017 (95% CI: 1.0014–1.0021) for respiratory deaths, and 1.0012 (95% CI: 1.0010–1.0015) for cardiovascular deaths, leading to an estimated 1960 total deaths, 239 respiratory deaths, and 415 cardiovascular deaths attributable to heat exposure. Campinas showed slightly higher relative risks, with RR values of 1.0029 (95% CI: 1.0023–1.0036) for total deaths, 1.0054 (95% CI: 1.0042–1.0066) for respiratory deaths, and 1.0006 (95% CI: 1.0005–1.0007) for cardiovascular deaths, resulting in approximately 286 total deaths, 78 respiratory deaths, and 18 cardiovascular deaths due to heatwaves. In Marília, the relative risks were 1.0033 (95% CI: 1.0025–1.0041) for total deaths, 1.0008 (95% CI: 1.0006–1.0010) for respiratory deaths, and 1.0055 (95% CI: 1.0041–1.0069) for cardiovascular deaths, translating to an estimated 73 total deaths, 2 respiratory deaths, and 36 cardiovascular deaths attributed to heatwave events.
São Paulo is approximately 49 times larger than Marília and 10.0 times larger than Campinas in terms of population [28], which may explain the observed differences in relative risks and attributable deaths. Despite the higher RRs in Campinas and Marília, especially for total deaths, the absolute number of attributable deaths may be lower due to their smaller populations. Furthermore, as illustrated in Figure 3, Campinas and Marília experienced more heatwave events than São Paulo, with 197, 203, and 183 heatwave days throughout the analyzed period, respectively. This increased frequency of heatwaves in Campinas and Marília could account for the elevated RRs, as a higher incidence of extreme heat events may exacerbate health risks, even though the total number of attributable deaths was lower in these cities than in São Paulo.
Our findings are consistent with those of recent studies that clearly demonstrate an association between heatwaves and increased health risks. Dos Santos et al. (2024) [36] analyzed various Brazilian urban centers and found that the metropolitan region of São Paulo experienced the highest number of heat-related excess deaths, totaling 14,850 between 2000 and 2018. During the same period, the metropolitan regions of Rio de Janeiro and Belém also faced significant impacts, with 9641 and 5429 deaths, respectively. Another study in Brazil documented approximately 1800 excess deaths related to heatwaves in Rio de Janeiro during the years of 2010 and 2012 [37]. In the United States, Weinberger et al. (2020) [43] estimated an average of about 5600 deaths annually attributable to extreme heat stress between 1997 and 2006, representing 61.6% of the country’s population.
Our findings on heat-related mortality are part of a broader pattern of impact observed on different health outcomes. Studies applying the EHF in Australia have shown that heatwaves also lead to a significant increase in healthcare demand. Patel et al. (2019) [44] and Campbell et al. (2021) [45] reported higher numbers of emergency department admissions (RR: 1.053, 95% CI: 1.048–1.058) and ambulance dispatches (OR: 1.34, 95% CI: 1.18–1.52), respectively, during heatwave periods.
In addition, Vicedo-Cabrera et al. (2021) [46], through an analysis of 732 locations around the world, observed that heat-associated risks varied significantly by geographic location. While regions in Western and Central Europe exhibited high heat-related mortality risks, most locations in Asia and the Americas had lower risks. These geographical patterns indicate that the relationship between heat and mortality is influenced by both global and regional factors. In this context, the observed differences between São Paulo, Campinas, and Marília demonstrate that local factors, in terms of variation in heat exposure, can also influence mortality risks, reflecting the complexity of the climate–health interaction.
The alignment of our findings with those of recent literature highlights the robustness of our analysis and reinforces the established understanding of the adverse health outcomes associated with extreme heat events. Additionally, our study makes a unique contribution by incorporating an economic analysis, which provides a comprehensive perspective on the financial burden of heat-related mortality, complementing the health outcome data and offering a more nuanced understanding of the impacts of extreme heat.
Estimating the economic burden of heat-related deaths offers a crucial metric for policy assessments aiming to mitigate this threat. In the present study, the estimated economic burden of mortality due to heatwaves in the three Brazilian cities amounted to as much as USD 6 billion, corresponding to 1% of the whole-state GNP (gross national product).
Adelaïde et al. (2022) [47] estimated the economic impact of heat-related mortality in France at EUR 23 billion, underscoring the significant burden on the French health system and serving as a critical alert to decision-makers to develop mitigation and adaptation measures. Heatwaves in Australia (in the cities of Sydney, Melbourne, and Brisbane) have resulted in annual health costs of AUD 10 million to AUD 20 million [48]. Despite differences in population size, study period, currency, and location, the studies conducted in France, Australia, and the three Brazilian cities provide evidence of the economic burden on the health system and highlight the need to implement both adaptation and mitigation measures to reduce the effects of heatwaves.
Sousa et al. (2022) [49], using EHF in Portugal, reported a significant increase in heat-related deaths in 2020 compared to previous years, highlighting that the impacts of extreme heat are strongly influenced by social vulnerabilities and health system capacity. While the direct effect of COVID-19 was residual during the summer, excess mortality was predominantly attributed to non-COVID-19 causes. A prolonged hot spell in mid-July led to a 45% increase in daily deaths, placing mortality in the upper tertile for the period, with a lethality ratio of 14 deaths per cumulated ºC. This pattern aligns with our findings, where the highest relative risks were also observed during the hottest months in all three cities. Although risk magnitudes vary by city and cause, the tendency for higher mortality during warmer months is consistent, reflecting the strong influence of extreme temperatures on heat-related deaths. Heatwaves also negatively impact economies by reducing labor productivity, increasing healthcare costs, damaging infrastructure, and harming crops and livestock [50]. The negative economic impact is particularly pronounced when cooling systems, such as air conditioning, are insufficient or nonexistent, and when access to healthcare services is limited. Under these conditions, workers are forced to take more frequent breaks to rest and rehydrate [51], many refrain from doing so, since taking a break often means losing money. In this context, measures aiming to reduce the intensity and frequency of heatwaves are highly desirable and should be cost-effective in terms of protecting human health, saving resources, and reducing the need for further investments.
For the three analyzed cities, given their varying characteristics in terms of size and socioeconomic conditions, mitigation and adaptation strategies should be tailored accordingly. In this sense, our findings offer practical guidance for public health planning and climate risk management. Reinforcing this perspective, our results are also consistent with international evidence applying the same metric to assess heat-related mortality.
The quantification of mortality associated with heatwaves, particularly through a standardized metric such as the excess heat factor (EHF), can directly support the development and refinement of heat early warning systems at municipal and regional levels. By identifying the magnitude of health impacts in cities with distinct socioeconomic and demographic profiles, local authorities can prioritize targeted interventions, such as the implementation of cooling centers, public health advisories during heat events, and urban design strategies that reduce heat exposure, especially in vulnerable neighborhoods. Additionally, our results provide evidence to guide climate adaptation policies that integrate health considerations, including heat-resilient housing, urban greening, and emergency response protocols. The approach presented here is replicable and scalable, offering a foundation for other municipalities to assess heat-related health risks and estimate economic burden so that context-specific adaptation strategies can be implemented.
While our study provides valuable insights, it is important to acknowledge a few limitations. A meta-analysis of the VSL was not conducted, as the necessary adjustments of base VSL values across different policy contexts would have required more extensive study. Future research should focus on evaluating different susceptibilities and other health outcomes associated with heatwaves rather than mortality. Investigations into the type of urban environment, housing, and transportation modes should be improved to diminish the burden, both in rural and urban areas.

5. Conclusions

Our findings contribute to the growing evidence on heat-related mortality by providing a novel perspective on its economic burden through the integration of the EHF and the VSL approach. Studies assessing the economic impact of extreme heat using these combined methods remain limited, and, to the best of our knowledge, this is the first study to apply this framework in Brazil.
Moreover, it is important to highlight that our findings are particularly relevant in the context of the upcoming 30th Conference of the Parties (COP30) to the United Nations Framework Convention on Climate Change (UNFCCC), which will take place in Belém, Brazil, in 2025. As climate change increases, heatwaves are expected to become more frequent and severe, disproportionately affecting populations in tropical and subtropical regions [1]. Our study quantifies not only the health burden of extreme heat but also its economic impact, demonstrating that heat-related mortality represents a significant financial cost for society. These results highlight the urgent need for adaptation strategies, such as early warning systems and urban planning measures, to mitigate heat exposure. Furthermore, incorporating economic metrics such as VSL into climate policy discussions can strengthen arguments for increased climate adaptation funding, particularly under the framework of loss and damage, a key issue at COP 30. As Brazil hosts global climate negotiations, our findings provide critical local evidence to inform policies aiming to protect vulnerable populations from the growing risks of extreme heat.

Author Contributions

D.D.: investigation, conceptualization, data curation, formal analysis, and writing—review and editing. N.M.É.d.R.: investigation, methodology, and writing—review and editing. S.G.E.K.M.: supervision, investigation, conceptualization, formal analysis, and writing—review and editing. All authors have read and agreed to the published version of the manuscript.

Funding

This research was supported by the Fundação de Amparo à Pesquisa do Estado de São Paulo under the grants 2024/02476-7, 2023/04466-6, and 2021/10599-3, and by the Conselho Nacional de Desenvolvimento Científico e Tecnológico under the grant 308378/2021-0.

Institutional Review Board Statement

Not applicable.

Informed Consent Statement

Not applicable.

Data Availability Statement

Data are contained within the article. The original contributions presented in this study are included in the article; further inquiries can be directed at the corresponding author.

Conflicts of Interest

The authors declare no conflicts of interest.

Abbreviations

The following abbreviations are used in this manuscript:
EHFexcess heat factor
RRrelative risk
DMTdaily mean temperature
VSLvalue of statistical life
GLMgeneralized linear model

References

  1. IPCC. Climate Change 2022: Mitigation of Climate Change. Summary for Policymakers. Working Group III Contribution to the Sixth Assessment Report of the Intergovernmental Panel on Climate Change; Intergovernmental Panel on Climate Change: Geneva, Switzerland, 2022; Available online: https://www.ipcc.ch/report/ar6/wg3/downloads/report/IPCC_AR6_WGIII_SPM.pdf (accessed on 20 February 2023).
  2. Watts, N.; Amann, M.; Arnell, N.; Ayeb-Karlsson, S.; Belesova, K.; Boykoff, M.; Byass, P.; Cai, W.; Campbell-Lendrum, D.; Capstick, S.; et al. The 2019 Report of The Lancet Countdown on Health and Climate Change: Ensuring That the Health of a Child Born Today Is Not Defined by a Changing Climate. Lancet 2019, 394, 1836–1878. [Google Scholar] [CrossRef] [PubMed]
  3. Goshua, A.; Gomez, J.; Erny, B.; Burke, M.; Luby, S.; Sokolow, S.; LaBeaud, A.D.; Auerbach, P.; Gisondi, M.A.; Nadeau, K. Addressing Climate Change and Its Effects on Human Health: A Call to Action for Medical Schools. Acad. Med. 2021, 96, 324–328. [Google Scholar] [CrossRef] [PubMed]
  4. Zhao, Q.; Guo, Y.; Ye, T.; Gasparrini, A.; Tong, S.; Overcenco, A.; Urban, A.; Schneider, A.; Entezari, A.; Vicedo-Cabrera, A.M.; et al. Global, Regional, and National Burden of Mortality Associated with Non-Optimal Ambient Temperatures from 2000 to 2019: A Three-Stage Modelling Study. Lancet Planet. Health 2021, 5, e415–e425. [Google Scholar] [CrossRef]
  5. Hartinger, S.M.; Palmeiro-Silva, Y.K.; Llerena-Cayo, C.; Blanco-Villafuerte, L.; Escobar, L.E.; Diaz, A.; Sarmiento, J.H.; Lescano, A.G.; Melo, O.; Rojas-Rueda, D.; et al. The 2023 Latin America Report of the Lancet Countdown on Health and Climate Change: The Imperative for Health-Centred Climate-Resilient Development. Lancet Reg. Health Am. 2024, 33, 100746. [Google Scholar] [CrossRef] [PubMed]
  6. Miraglia, S.G.E.K.; Tavella, R.A.; Debone, D. Unprecedented Air Quality Crisis: The Impact of Widespread Fires on Air Pollution in São Paulo. Air Qual. Atmos. Health 2025, 18, 1257–1262. [Google Scholar] [CrossRef]
  7. Huynen, M.M.; Martens, P.; Schram, D.; Weijenberg, M.P.; Kunst, A.E. The Impact of Heat Waves and Cold Spells on Mortality Rates in the Dutch Population. Environ. Health Perspect. 2001, 109, 463–470. [Google Scholar] [CrossRef]
  8. Habeeb, D.; Vargo, J.; Stone, B. Rising Heat Wave Trends in Large US Cities. Nat. Hazards 2015, 76, 1651–1665. [Google Scholar] [CrossRef]
  9. Cui, Y.; Yin, F.; Deng, Y.; Volinn, E.; Chen, F.; Ji, K.; Zeng, J.; Zhao, X.; Li, X. Heat or Cold: Which One Exerts Greater Deleterious Effects on Health in a Basin Climate City? Impact of Ambient Temperature on Mortality in Chengdu, China. Int. J. Environ. Res. Public Health 2016, 13, 1212. [Google Scholar] [CrossRef]
  10. Guo, Y.; Gasparrini, A.; Armstrong, B.G.; Tawatsupa, B.; Tobias, A.; Lavigne, E.; Coelho, M.S.Z.S.; Pan, X.; Kim, H.; Hashizume, M.; et al. Heat Wave and Mortality: A Multicountry, Multicommunity Study. Environ. Health Perspect. 2017, 125, 087006. [Google Scholar] [CrossRef]
  11. Lin, Y.K.; Maharani, A.T.; Chang, F.T.; Wang, Y.C. Mortality and Morbidity Associated with Ambient Temperatures in Taiwan. Sci. Total Environ. 2019, 651, 210–217. [Google Scholar] [CrossRef]
  12. Ferguson, L.; Anna, M. The Impact of Heat Adaptation on Socioeconomically Vulnerable Populations. In Mitigation and Adaptation of Urban Overheating; Elsevier: Amsterdam, The Netherlands, 2024; pp. 277–293. [Google Scholar] [CrossRef]
  13. Hutton, A.; Maud, K.; Giggins, H.; Skipp, M.; Verdon-Kidd, D. Are We Adequately Promoting Climate Change Adaptation to Address the Increasing Heatwaves Affecting the Elderly? Int. J. Disaster Risk Sci. 2025, 16, 182–189. [Google Scholar] [CrossRef]
  14. Zhou, Y.; Larochelle, L.; Khan, F.A.; Pilote, L. Sex Differences in the Impact of Extreme Heat on Cardiovascular Disease Outcomes: A Systematic Review and Meta-Analysis. Environ. Health 2025, 24, 20. [Google Scholar] [CrossRef]
  15. Basu, R.; Samet, J.M. Relation between Elevated Ambient Temperature and Mortality: A Review of the Epidemiologic Evidence. Epidemiol. Rev. 2002, 24, 190–202. [Google Scholar] [CrossRef] [PubMed]
  16. Basu, R. High Ambient Temperature and Mortality: A Review of Epidemiologic Studies from 2001 to 2008. Environ. Health 2009, 8, 40. [Google Scholar] [CrossRef] [PubMed]
  17. Bell, M.L.; O’Neill, M.S.; Ranjit, N.; Borja-Aburto, V.H.; Cifuentes, L.A.; Gouveia, N.C. Vulnerability to Heat-Related Mortality in Latin America: A Case-Crossover Study in São Paulo, Brazil, Santiago, Chile and Mexico City, Mexico. Int. J. Epidemiol. 2008, 37, 796–804. [Google Scholar] [CrossRef]
  18. Xu, Z.; FitzGerald, G.; Guo, Y.; Jalaludin, B.; Tong, S. Impact of Heatwave on Mortality under Different Heatwave Definitions: A Systematic Review and Meta-Analysis. Environ. Int. 2016, 89–90, 193–203. [Google Scholar] [CrossRef]
  19. Bettaieb, J.; Toumi, A.; Leffondre, K.; Chlif, S.; Salah, A.B. High Temperature Effect on Daily All-Cause Mortality in Tunis 2005–2007. Rev. Epidemiol. Sante Publique 2020, 68, 37–43. [Google Scholar] [CrossRef]
  20. de Visser, M.; Kunst, A.E.; Fleischmann, M. Geographic and Socioeconomic Differences in Heat-Related Mortality among the Dutch Population: A Time Series Analysis. BMJ Open 2022, 12, e058185. [Google Scholar] [CrossRef]
  21. Gasparrini, A.; Guo, Y.; Hashizume, M.; Kinney, P.L.; Petkova, E.P.; Lavigne, E.; Zanobetti, A.; Schwartz, J.D.; Tobias, A.; Leone, M.; et al. Temporal Variation in Heat-Mortality Associations: A Multicountry Study. Environ. Health Perspect. 2015, 123, 1200–1207. [Google Scholar] [CrossRef]
  22. Sera, F.; Armstrong, B.; Tobias, A.; Vicedo-Cabrera, A.M.; Åström, C.; Bell, M.L.; Chen, B.Y.; de Sousa Zanotti Stagliorio Coelho, M.; Matus Correa, P.; Cruz, J.C.; et al. How Urban Characteristics Affect Vulnerability to Heat and Cold: A Multi-Country Analysis. Int. J. Epidemiol. 2019, 48, 1101–1112. [Google Scholar] [CrossRef]
  23. Nairn, J.R.; Fawcett, R.J.B. The Excess Heat Factor: A Metric for Heatwave Intensity and Its Use in Classifying Heatwave Severity. Int. J. Environ. Res. Public Health 2015, 12, 227–253. [Google Scholar] [CrossRef]
  24. Alberini, A.; Hunt, A.; Markandya, A. Willingness to Pay to Reduce Mortality Risks: Evidence from a Three-Country Contingent Valuation Study. Environ. Resour. Econ. 2006, 33, 251–264. [Google Scholar] [CrossRef]
  25. Ding, D.; Xing, J.; Wang, S.; Liu, K.; Hao, J. Estimated Contributions of Emissions Controls, Meteorological Factors, Population Growth, and Changes in Baseline Mortality to Reductions in Ambient PM2.5 and PM2.5-Related Mortality in China, 2013–2017. Environ. Health Perspect. 2019, 127, 067009. [Google Scholar] [CrossRef] [PubMed]
  26. Wolfe, P.; Davidson, K.; Fulcher, C.; Fann, N.; Zawacki, M.; Baker, K.R. Monetized Health Benefits Attributable to Mobile Source Emission Reductions across the United States in 2025. Sci. Total Environ. 2019, 650, 2490–2498. [Google Scholar] [CrossRef] [PubMed]
  27. Debone, D.; Leirião, L.F.L.; Miraglia, S.G.E.K. Air Quality and Health Impact Assessment of a Truckers’ Strike in São Paulo State, Brazil: A Case Study. Urban Clim. 2020, 34, 100687. [Google Scholar] [CrossRef]
  28. IBGE. Brazilian Institute of Statistics and Geography. 2023. Available online: https://cidades.ibge.gov.br/brasil/sp/sao-paulo/panorama (accessed on 20 February 2023).
  29. INMET. Instituto Nacional de Meteorologia. Gráficos Climatológicos. 2020. Available online: https://clima.inmet.gov.br/GraficosClimatologicos/SP/83781 (accessed on 20 February 2023).
  30. AGRITEMPO. Brazilian Agro-Meteorological Monitoring System. Monitoring. São Paulo State. 2020. Available online: https://www.agritempo.gov.br/br/estado/SP/monitoramento/ (accessed on 20 February 2023).
  31. DATASUS. Brazilian Health System Database (TABNET). 2020. Available online: https://datasus.saude.gov.br/mortalidade-desde-1996-pela-cid-10 (accessed on 20 February 2023).
  32. Nairn, J.; Ostendorf, B.; Bi, P. Performance of Excess Heat Factor Severity as a Global Heatwave Health Impact Index. Int. J. Environ. Res. Public Health 2018, 15, 2494. [Google Scholar] [CrossRef] [PubMed]
  33. Oliveira, A.; Lopes, A.; Soares, A. Excess Heat Factor Climatology, Trends, and Exposure across European Functional Urban Areas. Weather Clim. Extremes 2022, 36, 100455. [Google Scholar] [CrossRef]
  34. Langlois, N.; Herbst, J.; Mason, K.; Nairn, J.; Byard, R.W. Using the Excess Heat Factor (EHF) to Predict the Risk of Heat-Related Deaths. J. Forensic Legal Med. 2013, 20, 408–411. [Google Scholar] [CrossRef]
  35. OECD. Mortality Risk Valuation in Environment, Health and Transport Policies; OECD Publishing: Paris, France, 2012; p. 140. [Google Scholar] [CrossRef]
  36. dos Santos, D.M.; Libonati, R.; Garcia, B.N.; Geirinhas, J.L.; Salvi, B.B.; Lima e Silva, E.; Rodrigues, J.A.; Peres, L.F.; Russo, A.; Gracie, R.; et al. Twenty-First-Century Demographic and Social Inequalities of Heat-Related Deaths in Brazilian Urban Areas. PLoS ONE 2024, 19, e0295766. [Google Scholar] [CrossRef]
  37. Geirinhas, J.L.; Russo, A.; Libonati, R.; Trigo, R.M.; Castro, L.C.O.; Peres, L.F.; Magalhães, M.A.F.M.; Nunes, B. Heat-Related Mortality at the Beginning of the Twenty-First Century in Rio de Janeiro, Brazil. Int. J. Biometeorol. 2020, 64, 1319–1332. [Google Scholar] [CrossRef]
  38. Perkins-Kirkpatrick, S.E.; Lewis, S.C. Increasing Trends in Regional Heatwaves. Nat. Commun. 2020, 11, 3357. [Google Scholar] [CrossRef] [PubMed]
  39. Heaviside, C.; Tsangari, H.; Paschalidou, A.; Vardoulakis, S.; Kassomenos, P.; Georgiou, K.E.; Yamasaki, E.N. Heat-Related Mortality in Cyprus for Current and Future Climate Scenarios. Sci. Total Environ. 2016, 569–570, 627–633. [Google Scholar] [CrossRef] [PubMed]
  40. Mitropoulos, D.; Pytharoulis, I.; Zanis, P.; Anagnostopoulou, C. Synoptic Analysis and Subseasonal Predictability of an Early Heatwave in the Eastern Mediterranean. Atmosphere 2024, 15, 442. [Google Scholar] [CrossRef]
  41. Rathi, S.K.; Sodani, P.R.; Joshi, S. Summer Temperature and All-Cause Mortality from 2006 to 2015 for Smart City Jaipur, India. J. Health Manag. 2021, 23, 294–301. [Google Scholar] [CrossRef]
  42. Arsad, F.S.; Hod, R.; Ahmad, N.; Ismail, R.; Mohamed, N.; Baharom, M.; Osman, Y.; Radi, M.F.M.; Tangang, F. The Impact of Heatwaves on Mortality and Morbidity and the Associated Vulnerability Factors: A Systematic Review. Int. J. Environ. Res. Public Health 2022, 19, 16356. [Google Scholar] [CrossRef]
  43. Weinberger, K.R.; Harris, D.; Spangler, K.R.; Zanobetti, A.; Wellenius, G.A. Estimating the Number of Excess Deaths Attributable to Heat in 297 United States Counties. Environ. Epidemiol. 2020, 4, e096. [Google Scholar] [CrossRef]
  44. Patel, D.; Jian, L.; Xiao, J.; Jansz, J.; Yun, G.; Robertson, A. Joint Effect of Heatwaves and Air Quality on Emergency Department Attendances for Vulnerable Population in Perth, Western Australia, 2006 to 2015. Environ. Res. 2019, 174, 80–87. [Google Scholar] [CrossRef]
  45. Campbell, S.L.; Remenyi, T.; Williamson, G.J.; Rollins, D.; White, C.J.; Johnston, F.H. Ambulance Dispatches and Heatwaves in Tasmania, Australia: A Case-Crossover Analysis. Environ. Res. 2021, 202, 111655. [Google Scholar] [CrossRef]
  46. Vicedo-Cabrera, A.M.; Scovronick, N.; Sera, F.; Royé, D.; Schneider, R.; Tobias, A.; Åström, C.; Guo, Y.; Honda, Y.; Hondula, D.M.; et al. The Burden of Heat-Related Mortality Attributable to Recent Human-Induced Climate Change. Nat. Clim. Change 2021, 11, 492–500. [Google Scholar] [CrossRef]
  47. Adélaïde, L.; Chanel, O.; Pascal, M. Health Effects from Heat Waves in France: An Economic Evaluation. Eur. J. Health Econ. 2022, 23, 119–131. [Google Scholar] [CrossRef]
  48. Cheng, J.; Xu, Z.; Bambrick, H.; Su, H.; Tong, S.; Hu, W. Heatwave and Elderly Mortality: An Evaluation of Death Burden and Health Costs Considering Short-Term Mortality Displacement. Environ. Int. 2018, 115, 334–342. [Google Scholar] [CrossRef] [PubMed]
  49. Sousa, P.M.; Trigo, R.M.; Russo, A.; Geirinhas, J.L.; Rodrigues, A.; Silva, S.; Torres, A. Heat-Related Mortality Amplified during the COVID-19 Pandemic. Int. J. Biometeorol. 2022, 66, 457–468. [Google Scholar] [CrossRef] [PubMed]
  50. Caruso, G.; de Marcos, I.; Noy, I. Climate Changes Affect Human Capital. Econ. Disasters Clim. Change 2024, 8, 157–196. [Google Scholar] [CrossRef]
  51. de Sario, M.; de’Donato, F.K.; Bonafede, M.; Marinaccio, A.; Levi, M.; Ariani, F.; Morabito, M.; Michelozzi, P. Occupational Heat Stress, Heat-Related Effects and the Related Social and Economic Loss: A Scoping Literature Review. Front. Public Health 2023, 11, 1173553. [Google Scholar] [CrossRef]
Figure 1. São Paulo state domain and the geographical locations of São Paulo, Campinas, and Marília, developed using QGIS software (version 3.34.15).
Atmosphere 16 00755 g001
Figure 2. Multiyear variation in the daily mean temperature and its 95th percentile for (A) São Paulo, (B) Campinas, and (C) Marília municipalities.
Atmosphere 16 00755 g002
Figure 3. Interannual variability in EHF values for São Paulo (A), Campinas (B), and Marília (C) municipalities.
Atmosphere 16 00755 g003
Figure 4. Number of heatwave days (A) and severe events (B) in São Paulo, Campinas, and Marília municipalities.
Atmosphere 16 00755 g004
Figure 5. Monthly mean relative risks (RRs) for all-cause, respiratory, and cardiovascular deaths in São Paulo, Campinas, and Marília (2004–2018). Error bars represent the standard error of the mean (SEM) across the study period. Only months with an RR greater than 1 are displayed, highlighting periods associated with excess risk.
Atmosphere 16 00755 g005
Table 1. Summary of selected estimates of values of statistical life (VSLs) with values in USD.
RegionVSL (Million USD Range) aVSL (Million USD—Selected Value)
Europe1.5–4.53
USA (EPA)1–107.5
Great Britain--2.1 b
Adopted for Brazil--2.6
a Values obtained from [35]. b Conversion: GBP 1000 = USD 1265 (27 June 2024).
Table 2. Estimated relative risks (RRs) and attributable fractions (AFs), the fraction of deaths attributable to the EHF, and mortality economic valuation for São Paulo, Campinas, and Marília municipalities.
Cause of DeathRRs [95% CI]AFsMonetary Valuation
(Million USD)
São PauloTotal1.0018 [1.0015; 1.0022]19605096
Respiratory 1.0017 [1.0014; 1.0021]239621.4
Cardiovascular 1.0012 [1.0010; 1.0015]4151079
CampinasTotal1.0029 [1.0023; 1.0036]286743.6
Respiratory 1.0054 [1.0042; 1.0066]78202.8
Cardiovascular 1.0006 [1.0005; 1.0007]1846.8
MaríliaTotal1.0033 [1.0025; 1.0041]73189.8
Respiratory 1.0008 [1.0006; 1.0010]25.2
Cardiovascular 1.0055 [1.0041; 1.0069]3693.6
95% CI refers to the 95% confidence interval.
Disclaimer/Publisher’s Note: The statements, opinions and data contained in all publications are solely those of the individual author(s) and contributor(s) and not of MDPI and/or the editor(s). MDPI and/or the editor(s) disclaim responsibility for any injury to people or property resulting from any ideas, methods, instructions or products referred to in the content.

