1. Introduction
Air pollution is one of the most pressing environmental issues globally, significantly affecting public health and contributing to increased morbidity and mortality [
1,
2]. The World Health Organization (WHO) estimates that 90% of the global population is exposed to polluted air, resulting in more than seven million premature deaths each year [
3,
4,
5].
Atmospheric air pollution refers to the presence of harmful chemical, physical, and biological substances that alter the natural composition of the air and pose risks to ecosystems and human health. Major pollutants include particulate matter (PM
2.5, PM
10), nitrogen dioxide (NO
2), sulfur dioxide (SO
2), carbon monoxide (CO), phenol, hydrogen fluoride, and lead [
6,
7]. Exposure to these pollutants is a recognized risk factor for both acute and chronic health conditions. Short-term exposure can cause respiratory infections and bronchospasms, while long-term exposure increases the risk of chronic pulmonary disease, cardiovascular disorders, stroke, and cancer [
8,
9,
10]. Urban and industrial populations are particularly vulnerable, as pollutant concentrations frequently exceed the WHO’s recommended thresholds. In Kazakhstan, air pollution remains a serious problem in many cities. In 21 urban areas, pollutant levels exceed the maximum permissible concentrations by more than ten times. According to WHO data, air pollution contributes to over 100,000 deaths annually in Kazakhstan [
11,
12,
13,
14,
15,
16,
17,
18]. For example, in Almaty, average PM
2.5 concentrations exceed WHO guidelines twofold, reaching up to 21.9 µg/m
3 [
19]. Key pollution sources include coal-fired thermal power plants, transportation emissions, and adverse meteorological phenomena such as temperature inversions [
20].
The East Kazakhstan Region, a key industrial area in the country, faces serious environmental and public health challenges. Home to large non-ferrous metallurgy enterprises, the region is characterized by high anthropogenic emissions, including sulfur dioxide, nitrogen oxides, volatile organic compounds (VOCs), dioxins, and polycyclic aromatic hydrocarbons (PAHs) [
21,
22]. These pollutants threaten both environmental and human health [
23,
24].
Similar trends have been documented globally. In Jakarta, over 7000 pediatric health cases, 10,000 deaths, and 5000 hospitalizations are reported annually due to air pollution, leading to economic losses exceeding USD 2.9 billion [
25]. In Bangladesh, The weakening of environmental standards exacerbates pollution and its socio-environmental impacts [
26,
27]. In China, industrial activities, fossil fuel use, and dense traffic contribute to critical air quality problems in regions such as the Yangtze River Delta and Guangdong Province [
28]. Likewise, in Bucharest, Romania, air pollution linked to industrial activity regularly exceeds safe levels for PM
2.5 and PAHs [
29]. These examples highlight the global relevance of strict pollution control and sustainable development.
The effective assessment of air pollution’s health impact requires a comprehensive approach, including statistical forecasting, artificial intelligence techniques, and numerical modeling [
1,
30]. These tools aid in predicting pollution levels and formulating mitigation strategies.
Studies from South Korea show that residents near industrial complexes face higher risks of chronic respiratory and allergic diseases. Multiple regression analysis revealed significantly increased rates of symptoms like persistent cough and sputum production [
31]. Such evidence underscores the importance of air quality monitoring and early health interventions.
Recent advancements in air filtration also offer potential solutions. For instance, hybrid nanofibrous membranes incorporating chitosan, silver nanoparticles, and cellulose acetate have achieved 99.78% efficiency in PM
2.5 removal while maintaining low air resistance [
32]. Similarly, nonwoven polyacrylonitrile (PAN)-based filter media have shown HEPA-grade performance, with further potential through carbonization and VOC adsorption [
33]. Research into carbon–silicon sorbents with antibacterial properties presents additional promise for improving urban air quality [
34].
International studies confirm the global nature of this problem and emphasize the necessity of an integrated approach to its resolution [
35,
36].
Overall, these technological and policy efforts demonstrate a growing global response to air pollution. Nonetheless, the specific mechanisms linking industrial air pollution and public health outcomes in East Kazakhstan require further study. This research aims to fill that gap by evaluating long-term health data and pollutant levels, contributing to regional pollution control and public health policy.
2. Materials and Methods
2.1. Study Area
The East Kazakhstan region is one of the largest industrialized regions of the Republic of Kazakhstan, formed as a territorial–economic complex that integrates natural, human-made, and agricultural systems. The region is located in the eastern part of the country, bordered by the Russian Federation to the north and the People’s Republic of China to the east. It consists of 11 districts and 2 cities of regional subordination. The region has a population of 723.1 thousand, with an urbanization rate of approximately 79%, the majority of whom reside in industrial centers.
The regional economy is predominantly driven by non-ferrous metallurgy, which contributes about 60% of the gross regional product and up to 15% of the region’s total tax revenues. Other well-developed sectors include mechanical engineering, metal processing, energy, timber and woodworking, as well as light and food industries. The region’s industrial strength is underpinned by major enterprises such as JSC Kazzinc, JSC Ust-Kamenogorsk Titanium-Magnesium Plant, and JSC Ulba Metallurgical Plant. The primary industrial hubs are the cities of Ust-Kamenogorsk, Ridder, Altai, Shemonaikha, and the Glubokovsky district.
However, the region faces serious environmental challenges. Critically high levels of air pollution have been recorded in Ust-Kamenogorsk, Ridder, Altai, and Shemonaikha. The geographic setting—where cities are located in intermountain basins encircled by mountain ranges—combined with persistent meteorological phenomena such as temperature inversions, leads to stagnant air conditions and the accumulation of pollutants near the surface. Industrial emissions not only affect urban zones but also extend into nearby rural areas. For instance, elevated concentrations of sulfur dioxide (SO2) and nitrogen oxides (NOx) originating from Ust-Kamenogorsk have been detected in the settlement of Glubokoe, highlighting the regional spread of pollution due to specific air circulation patterns.
The combination of territorial features, complex orography, the dense concentration of industrial enterprises, and unfavorable climatic conditions renders East Kazakhstan one of the most vulnerable regions in the country to anthropogenic air pollution.
2.2. Research Methods
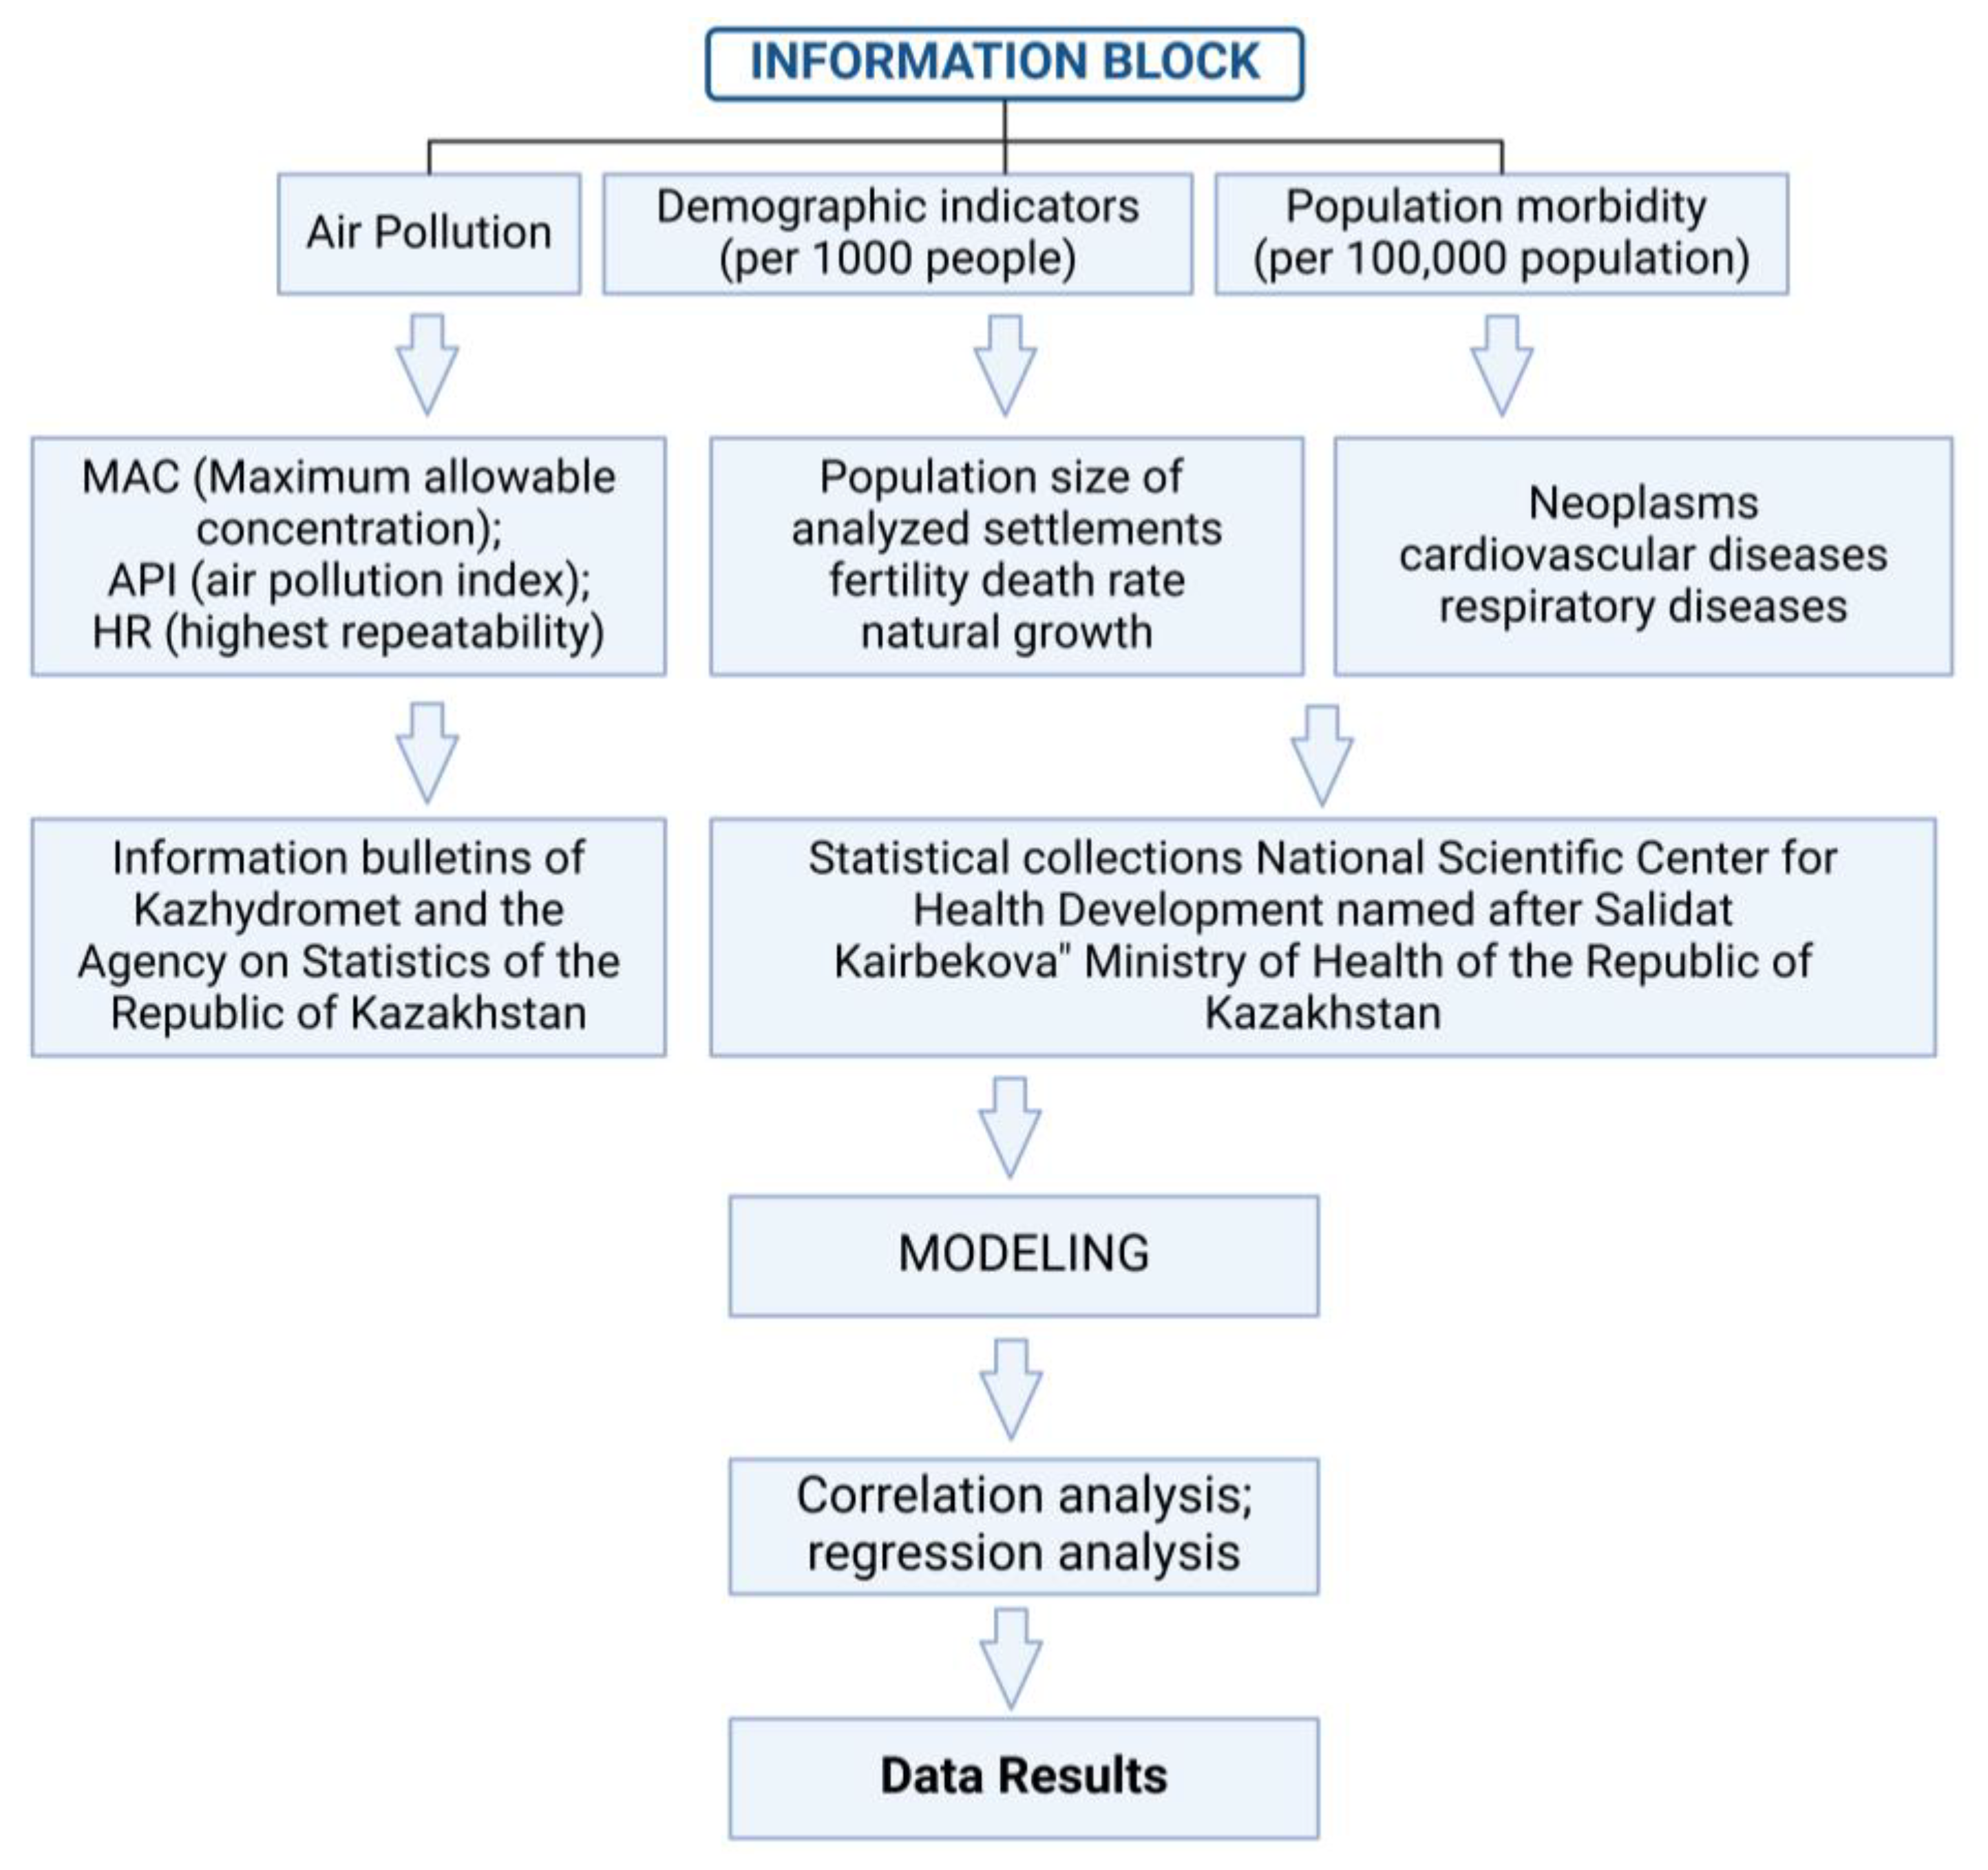
Various methods of analysis were employed in the study of atmospheric air quality at the regional level, including cartographic and mathematical data processing methods, as well as correlation and regression analyses.
Figure 1 presents a technical diagram of the study route, illustrating the stages of statistical analysis and interpretation of the obtained data.
Atmospheric air quality data were sourced from official databases, specifically the Unified State Monitoring System, accessible via the Kazhydromet website (
https://www.kazhydromet.kz/ accessed on 23 January 2025 ) and the Bureau of National Statistics of Kazakhstan (
https://stat.gov.kz/ accessed on 23 January 2025).
In the East Kazakhstan region, the atmospheric air quality is monitored through a network of stationary observation posts located in five settlements: Ust-Kamenogorsk, Ridder, Glubokoye, Altai, and Shemonaikha. The list of monitored pollutants is determined based on the volumes and structure of industrial emissions, as well as pilot studies of atmospheric air quality in specific areas. In Ust-Kamenogorsk city, there are 10 observation stations, including 5 automatic stations and 5 manual/automatic sampling stations. A total of 20 pollutants are monitored: (1) suspended particulate matter (PM2.5); (2) suspended particulate matter (PM10); (3) sulfur dioxide; (4) carbon monoxide; (5) nitrogen dioxide; (6) nitrogen oxide; (7) phenol; (8) hydrogen sulfide; (9) hydrogen fluoride; (10) benz(a)pyrene; (11) hydrogen chloride; (12) formaldehyde; (13) chlorine; (14) sulfuric acid; (15) lead; (16) zinc; (17) cadmium; (18) copper; (19) beryllium; and (20) ozone. In Ridder, monitoring is conducted at three stations (two manual/automatic and one automatic station), with the determination of 13 pollutants: (1) suspended particulate matter (dust); (2) sulfur dioxide; (3) carbon monoxide; (4) nitrogen dioxide; (5) nitrogen oxide; (6) hydrogen sulfide; (7) phenol; (8) formaldehyde; (9) cadmium; (10) copper; (11) lead; (12) beryllium; and (13) zinc. In the Glubokoye settlement, monitoring is conducted at two stations (one manual and one automatic), with the measurement of 6 indicators: (1) suspended particulate matter (dust); (2) sulfur dioxide; (3) carbon monoxide; (4) nitrogen dioxide; (5) nitrogen oxide; and (6) phenol. In Altai city, monitoring is conducted at one automatic station, where 5 indicators are measured: (1) suspended particulate matter (PM10); (2) sulfur dioxide; (3) carbon monoxide; (4) nitrogen dioxide; and (5) nitrogen oxide. In Shemonaikha town, monitoring is conducted at one automatic station, where 4 pollutants are measured: (1) sulfur dioxide; (2) carbon monoxide; (3) nitrogen dioxide; and (4) hydrogen sulfide.
The primary indicators of air quality are the values of the maximum allowable concentrations (MAC) of pollutants in the air of residential areas.
In this study, the Atmospheric Pollution Index (API) was used to assess the level of atmospheric air pollution. The API is calculated based on the average concentrations of key pollutants over a specified period and provides a comprehensive characterization of the degree of environmental pollution. This approach aligns closely with the objectives of the retrospective analysis of spatial and temporal patterns of pollution and its impact on public health.
where q
cp.i represents the average concentration of substance i; MAC
c.ci is the average daily maximum permissible concentration of substance i; and C
i is the coefficient dependent on the hazard class of substance i, which is taken as 1.7, 1.3, 0.1, and 0.9 for hazard classes 1, 2, 3, and 4, respectively, of the pollutant.
The average annual values, the percentage of the highest frequency of MAC exceedance, and the average multiplicity of pollutants from stationary sources of atmospheric air pollution were calculated.
The study analysed demographic indicators for the period 2014–2023, focusing on population dynamics, birth rates, mortality, natural increase, and the main causes of death. Additionally, the morbidity of the population was examined, including general indicators and distribution by major disease classes according to the International Classification of Diseases (ICD). Given the high morbidity rate in the region, neoplasms were selected as the focus for analysis to explore the relationship between disease rates and emission levels. Morbidity rates were estimated by the number of registered cases per 100,000 population. The database was formed based on retrospective data for the period 2014–2023, covering the industrial districts of East Kazakhstan region. Statistical information was provided by the East Kazakhstan region branch of the Republican State Enterprise “Salidat Kairbekova National Scientific Centre for Health Development” under the Ministry of Health of the Republic of Kazakhstan (
https://nrchd.kz/ru/ accessed on 23 January 2025).
Linear correlation analysis was conducted to identify direct dependencies between the analyzed variables based on their absolute values. In the case of linear dependence, the Pearson correlation coefficient (r) is used to determine the strength and direction of the relationship between the variables. This coefficient is essential for statistical analysis. The general formula for calculating the Pearson coefficient is as follows:
where
xi and
yi are the values of the variables and
and
are their mean values.
Regression analysis was conducted to more accurately quantify the relationship between emissions and morbidity. A regression model represents a mathematical relationship between an independent variable (emissions) and a dependent variable (morbidity). The general formula for linear regression is as follows:
where
y is the dependent variable (predicted value);
x1,
x2,...,
xn are the independent variables (factors, predictors);
β0 is the intercept (free term);
β1,
β2,...,
βn are the regression coefficients (indicating the contribution of each variable to the outcome); and ε represents the random error (model error or noise).
All calculations were performed using the specialized Statistica Ultimate Academic software package, version 14.1.0, designed for scientific research.
Based on the created databases, an analysis and visualization of information on the state of the environment and its impact on biological systems, including human health, were carried out. The method of ecological mapping enabled the assessment of spatial and temporal variability of environmental factors affecting the ecological situation and the state of ecosystems. This study analyzed the indicators of atmospheric air pollution in the East Kazakhstan region.
ArcGIS Pro software version 3.2 was used to create cartographic materials. This geographic information system enables the collection, management, analysis, and visualization of geographic information. For this study, a limited yet functionally significant subset of the software’s tools was employed to generate detailed cartographic materials. The application of GIS technology allowed for a comprehensive analysis of environmental issues, the identification of key risk factors, and the prediction of their potential consequences.
3. Results
3.1. Analysis of Atmospheric Air Pollution in East Kazakhstan
The territory of East Kazakhstan region is characterized by a significant level of industrial pollution, primarily caused by the activities of the metallurgical, mining, and chemical industries. The main sources of pollution are enterprises in the first category. One of the primary reasons for the unfavorable epidemiological situation in the region is the high volume of industrial waste, which indicates the concentration of pollutants in areas of intensive industrial activity. In terms of total pollutant emissions across Kazakhstan, East Kazakhstan region ranks seventh, with emissions totaling 80.9 thousand tonnes. This is lower than other industrial regions such as Pavlodar (694.2 thousand tonnes), Karaganda (455 thousand tonnes), and Atyrau (140.1 thousand tonnes).
The main sources of atmospheric air pollution are non-ferrous metallurgy and mining, which together account for 85.7 percent of emissions. Enterprises involved in the distribution of electricity, gas, and water contribute 22.4 percent of the total pollution, while transport and communications account for 6.4 percent, and other sources contribute 2.2 percent.
Of the total amount of pollutants emitted in 2023 (over 1168 thousand tonnes), 30.9% were gaseous and liquid emissions, while 69.1% were particulate matter. Of the 517 thousand tonnes of gaseous and liquid emissions,
- -
91.8% is sulfur dioxide;
- -
0.001% is hydrogen sulfide;
- -
2.9% is carbon monoxide;
- -
0.06% is ammonia;
- -
2.3% is nitrogen oxides (in terms of NO2);
- -
0.4% is hydrocarbons (excluding volatile organic compounds);
- -
0.3% is volatile organic compounds (VOCs).
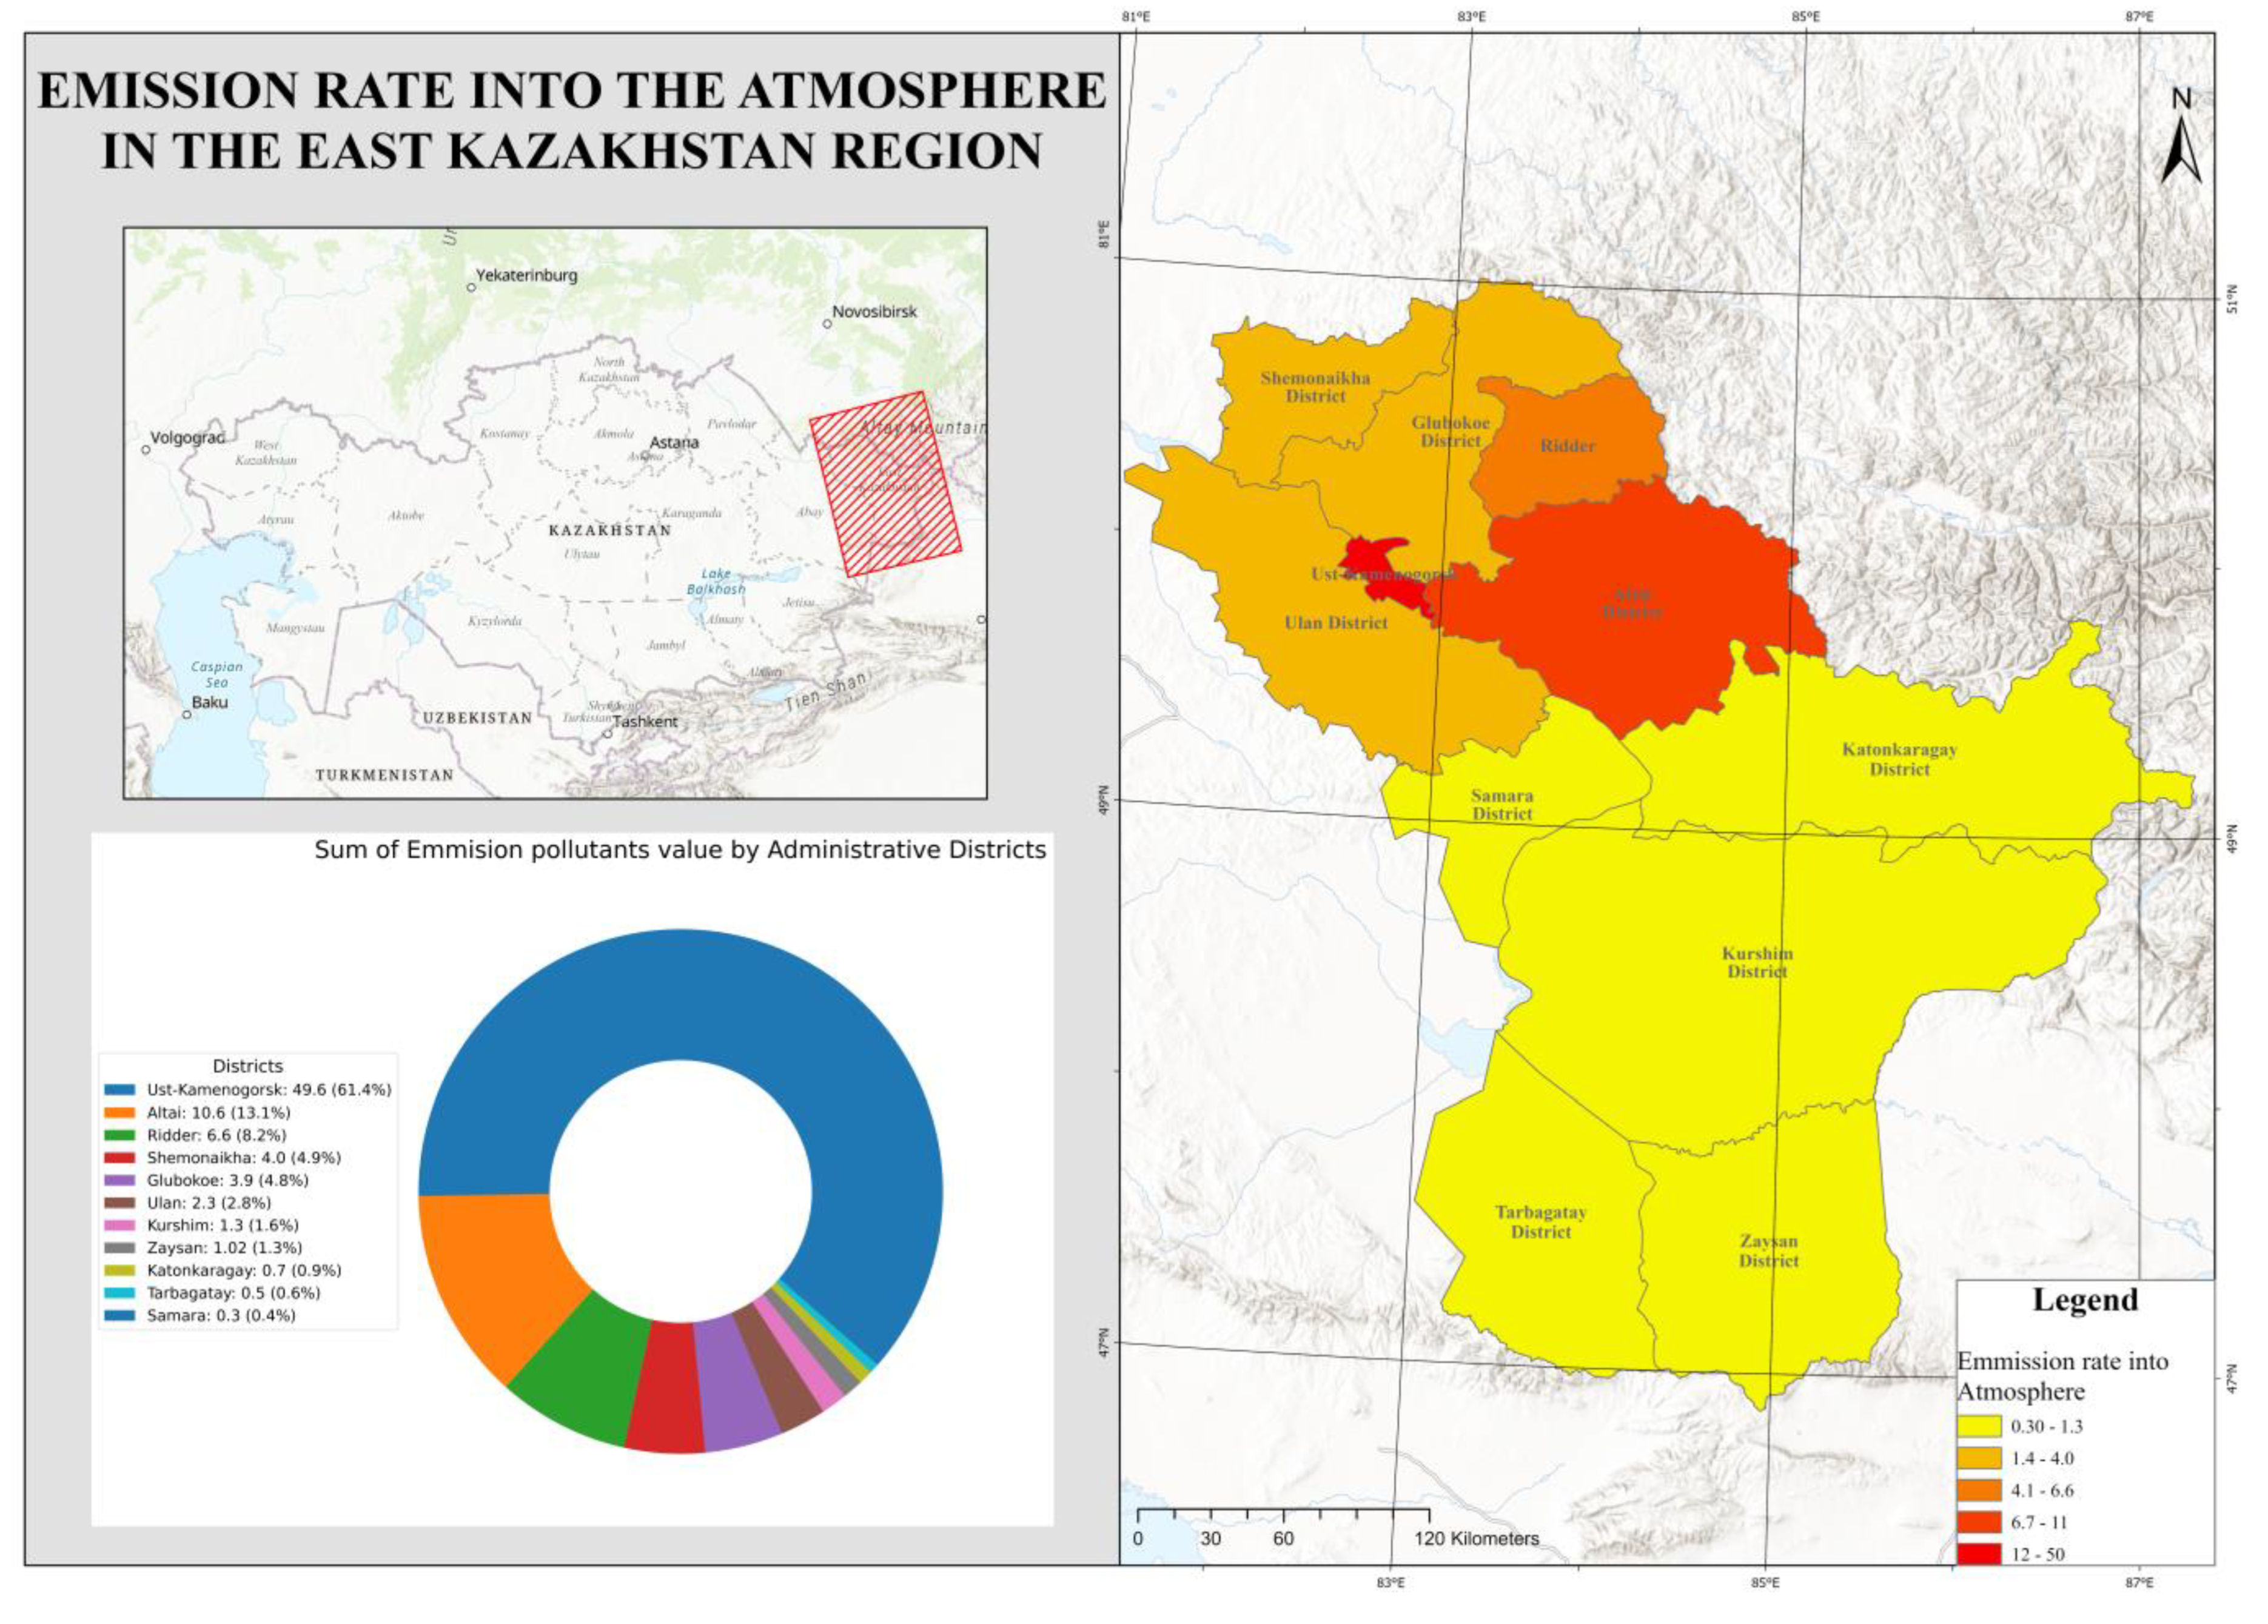
The largest contribution to air pollution in the East Kazakhstan region is made by (
Figure 2):
- -
Ust-Kamenogorsk—46.4% of emissions;
- -
Ridder—10.8% of emissions;
- -
Glubokoe—0.5% of emissions;
- -
Altai—41.1% of emissions;
- -
Shemonaikha—0.5% emissions.
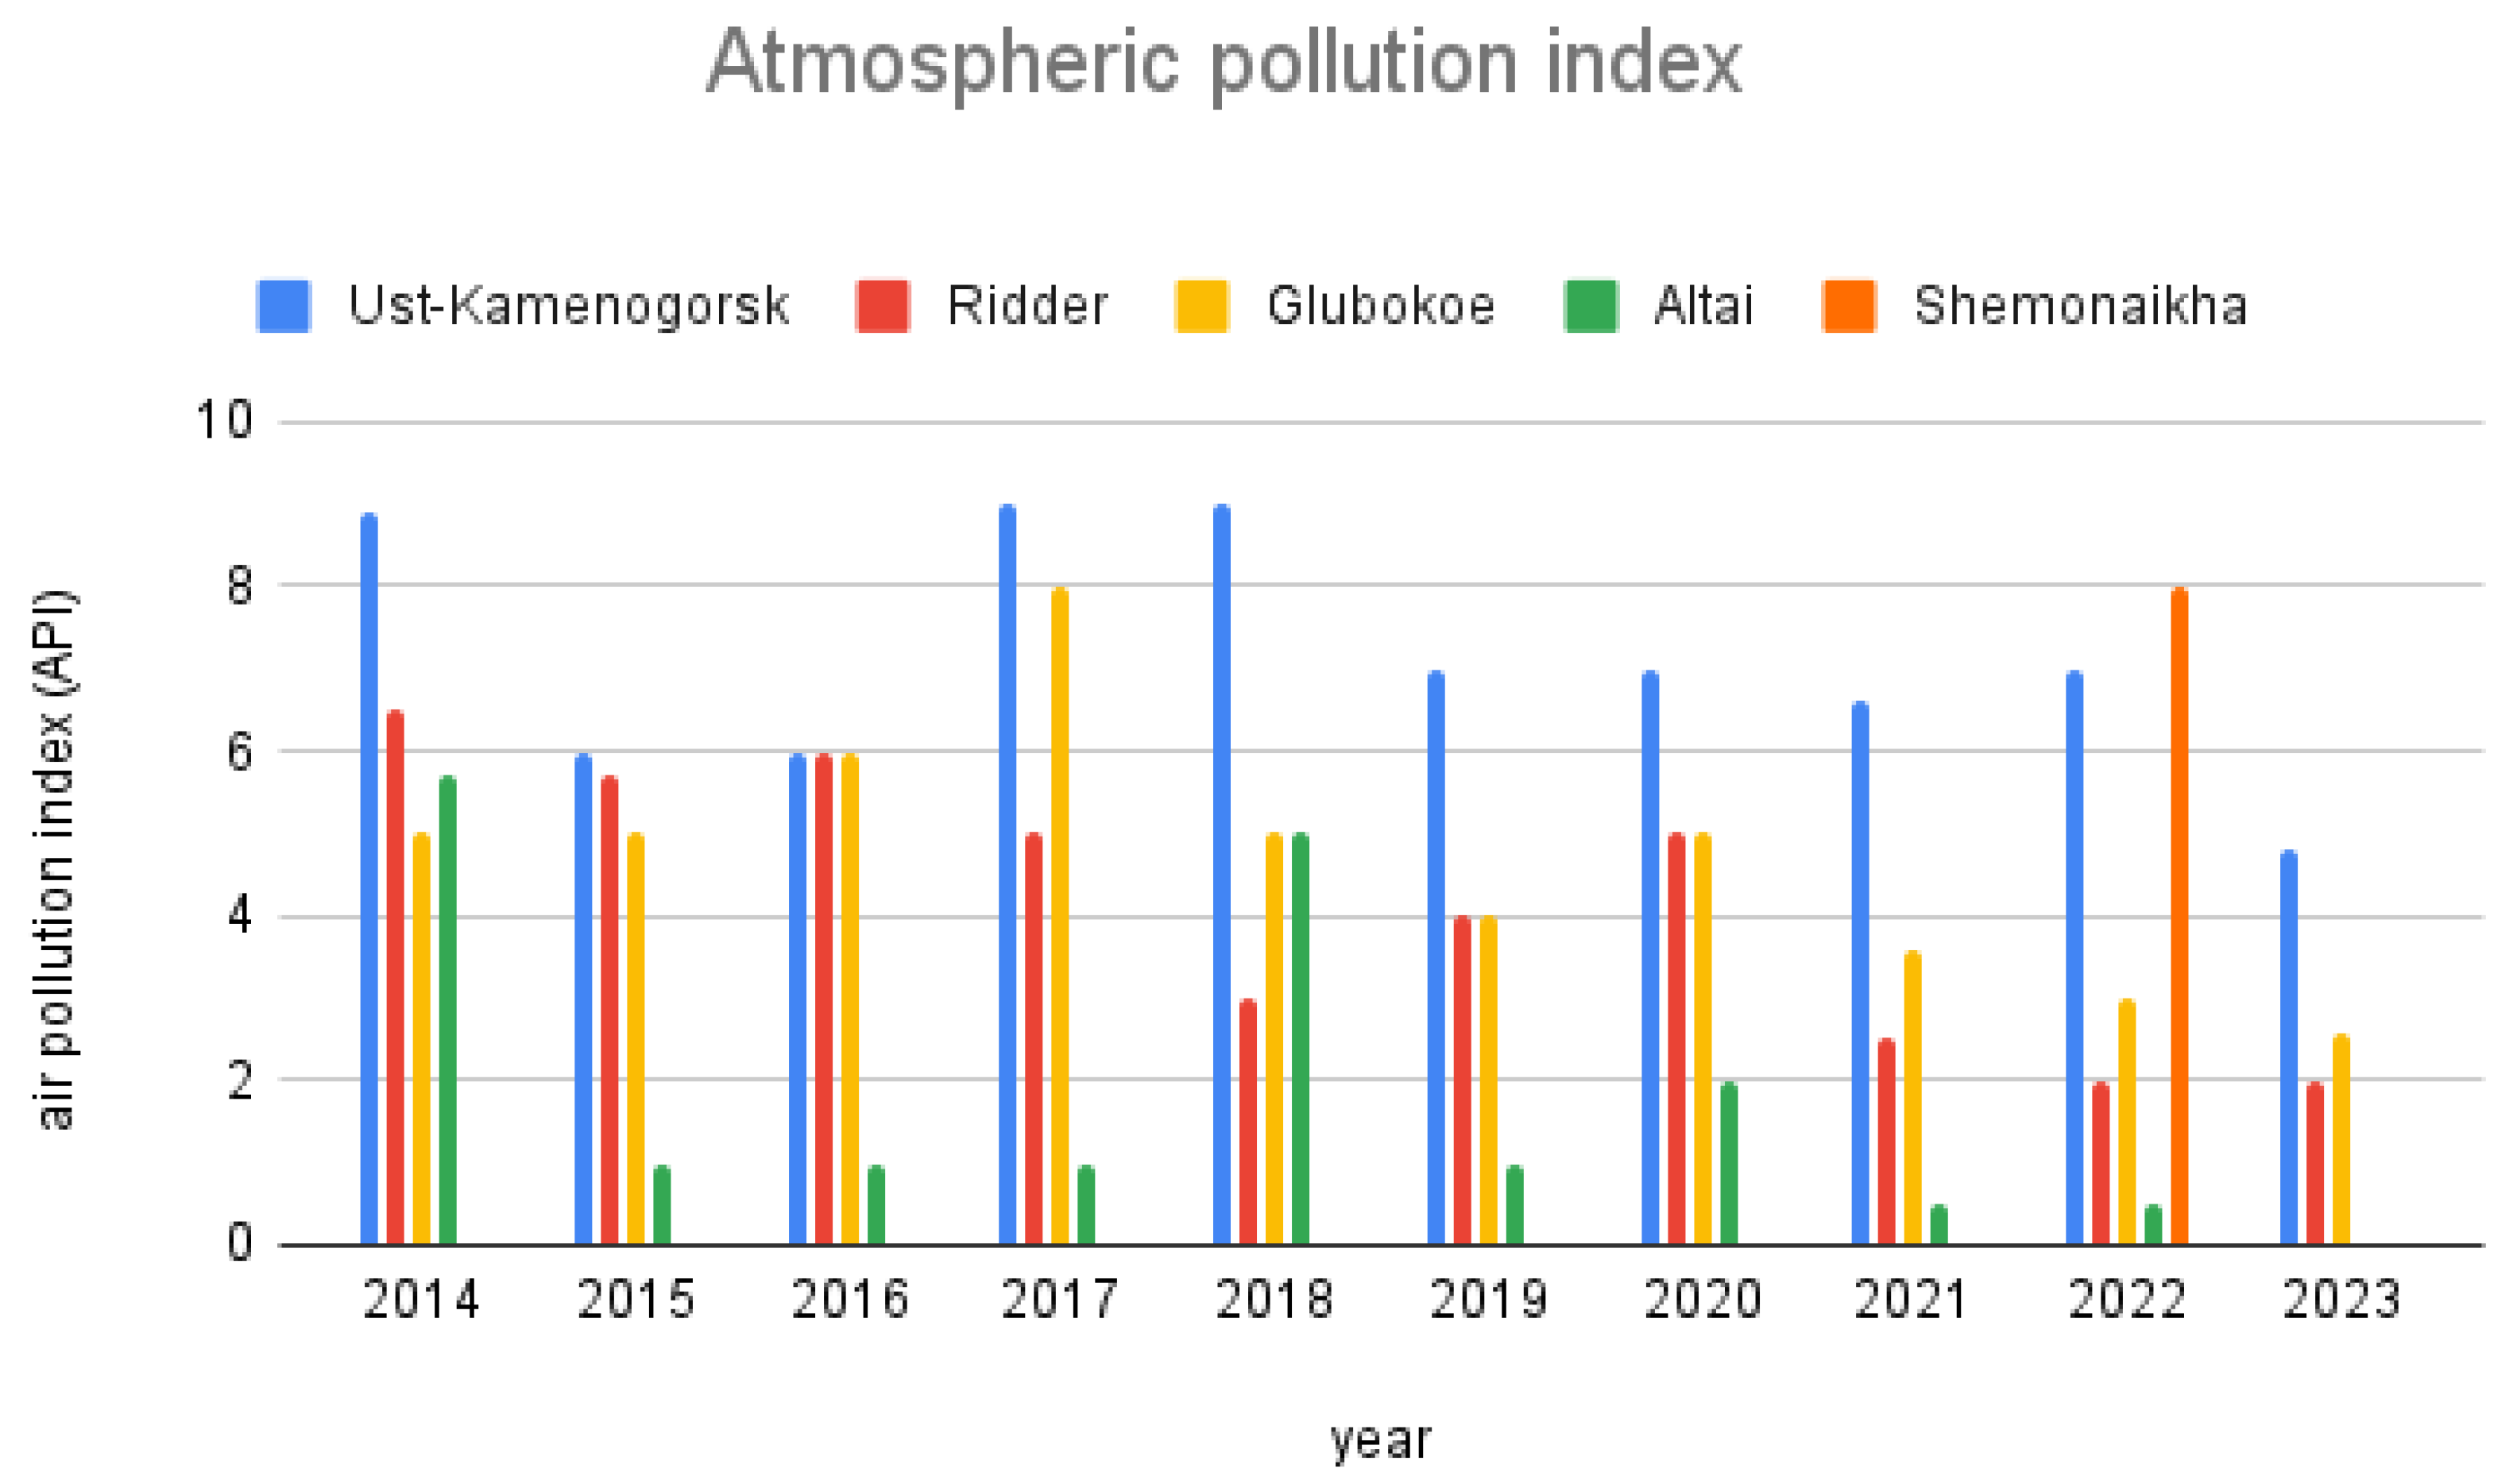
The complex level of air pollution in the industrial areas of the East Kazakhstan region for 2014–2023, determined by the air pollution index (API
5), has a downward trend. The highest API
5 value was recorded in Ust-Kamenogorsk (8.9–9 conventional units) and Shemonaikha (8.0 conventional units). In some areas of the region, the API
5 values varied from 0.5 conventional units (low level) to 7.0 conventional units (high level). The main pollutant of the air in the city was hydrogen sulfide, which caused a high level of pollution (see
Figure 3).
According to the observation network data, the most polluted cities are Ust-Kamenogorsk and Ridder, where multiple exceedances of MAC are recorded for several pollutants. In Ust-Kamenogorsk, sulfur dioxide exceeds MAC by up to 6.9 times, while in Ridder, it exceeds it by 6.5 times. Hydrogen sulfide levels exceed MAC by up to 5.3 times in Ust-Kamenogorsk and 8.6 times in Ridder. Carbon monoxide exceeds MAC by up to 3.8 times, and significant exceedances of MAC are also recorded for phenol, hydrogen chloride, and nitrogen dioxide. The cities of Altai and Shemonaikha also show increased pollution levels, although exceedances of MAC are less pronounced. The average and maximum concentrations of harmful impurities varied significantly, depending on the volume of emissions from industrial enterprises and the physical and geographical features of the cities’ locations.
Despite the overall reduction in air pollutant emissions in East Kazakhstan region, it remains one of the major sources of industrial pollution in the country. Considering the volume of ore mining, concentrate production, and their subsequent metallurgical processing, emissions into the atmosphere over the past 10 years have ranged from 3 to over 80 thousand tonnes (see
Table 1).
A significant portion of environmental pollution is associated with dust generation. Toxic compounds contained in waste from enrichment plants, mined rocks, and metallurgical production are released into the atmosphere.
Calculations show that the annual volume of dust emissions containing nearly all toxic components from mining and metallurgical operations in the East Kazakhstan region amounts to 113 thousand tonnes. Over the entire period of mining activity in the region, the total volume of emitted dust has exceeded 10 million tonnes, accounting for approximately 1% of total industrial waste (see
Table 2 and
Table 3).
3.2. Demographic Indicators of the Population in East Kazakhstan
An analysis of the dynamics of natural population growth in the industrial regions of East Kazakhstan region over the past 10 years (since 2014) shows that the mortality rate has consistently exceeded the birth rate, with the exception of Ust-Kamenogorsk, where positive growth is observed. However, in recent years, there has been a trend toward a worsening demographic situation, attributed to the combined impact of several factors, including high levels of atmospheric air pollution.
During the analyzed period, there was a significant decline in the birth rate—from 13.8 per 1000 persons in 2013 to 9.98 per 1000 in 2023, representing a decrease of 29.7%. In contrast, the mortality rate rose from 14.0 per 1000 persons in 2017 to 19.2 per 1000 in 2021 (an increase of 37.1%), followed by a decrease of 26.04% by 2023. The combined effect of these trends resulted in a 201.46% decrease in natural population growth in 2023 compared to 2013, or a reduction by a factor of 0.99 (see
Table 4).
The analysis of the causes of death revealed that the East Kazakhstan region ranks first in the Republic of Kazakhstan in terms of mortality from malignant neoplasms and cardiovascular diseases (see
Table 5).
3.3. Health Effects
According to the data of the Salidat Kairbekova National Scientific Center for Health Development of the Ministry of Health of the Republic of Kazakhstan, based on the approved annual reporting forms, the East Kazakhstan region in 2023 occupied the following positions:
- -
Second place in the Republic of Kazakhstan in terms of bronchial asthma incidence (after Astana);
- -
Third place in terms of malignant neoplasm incidence (second to Pavlodar region and Almaty);
- -
Third place in terms of circulatory system diseases, including first place in terms of acute myocardial infarction and cerebrovascular diseases;
- -
Second place in terms of mental disorders and behavioral disorders (second to Astana).
An analysis of the dynamics of the neoplasm incidence rate in East Kazakhstan region from 2014 to 2023, per 100,000 people, shows divergent trends. As seen in
Table 6, the overall incidence rate in the region significantly increased in 2023, particularly in cities such as Ridder (+60%) and Glubokoye (+38%). The sharp decline in 2020 is likely due to diagnostic and treatment restrictions during the pandemic. Ridder shows a consistent and notable increase, which may indicate specific localized risk factors.
In the present study, a correlation analysis was conducted to examine the relationship between the volume of industrial emissions and the incidence of malignant neoplasms in the population. The calculation of the Pearson correlation coefficient (r) revealed a moderate positive relationship between these variables (r = 0.59), suggesting a possible influence of air pollution on the increase in cancer morbidity. It should be noted that this analysis did not include a detailed examination of the chemical composition of the emissions; the assessment was based on their total volume (see
Table 7).
The moderate linear relationship between emissions and neoplasms indicates that an increase in emissions is associated with a rise in cancer incidence in the region. Our analysis revealed that the highest correlation (r = 0.59) was observed between neoplasms and gaseous emissions.
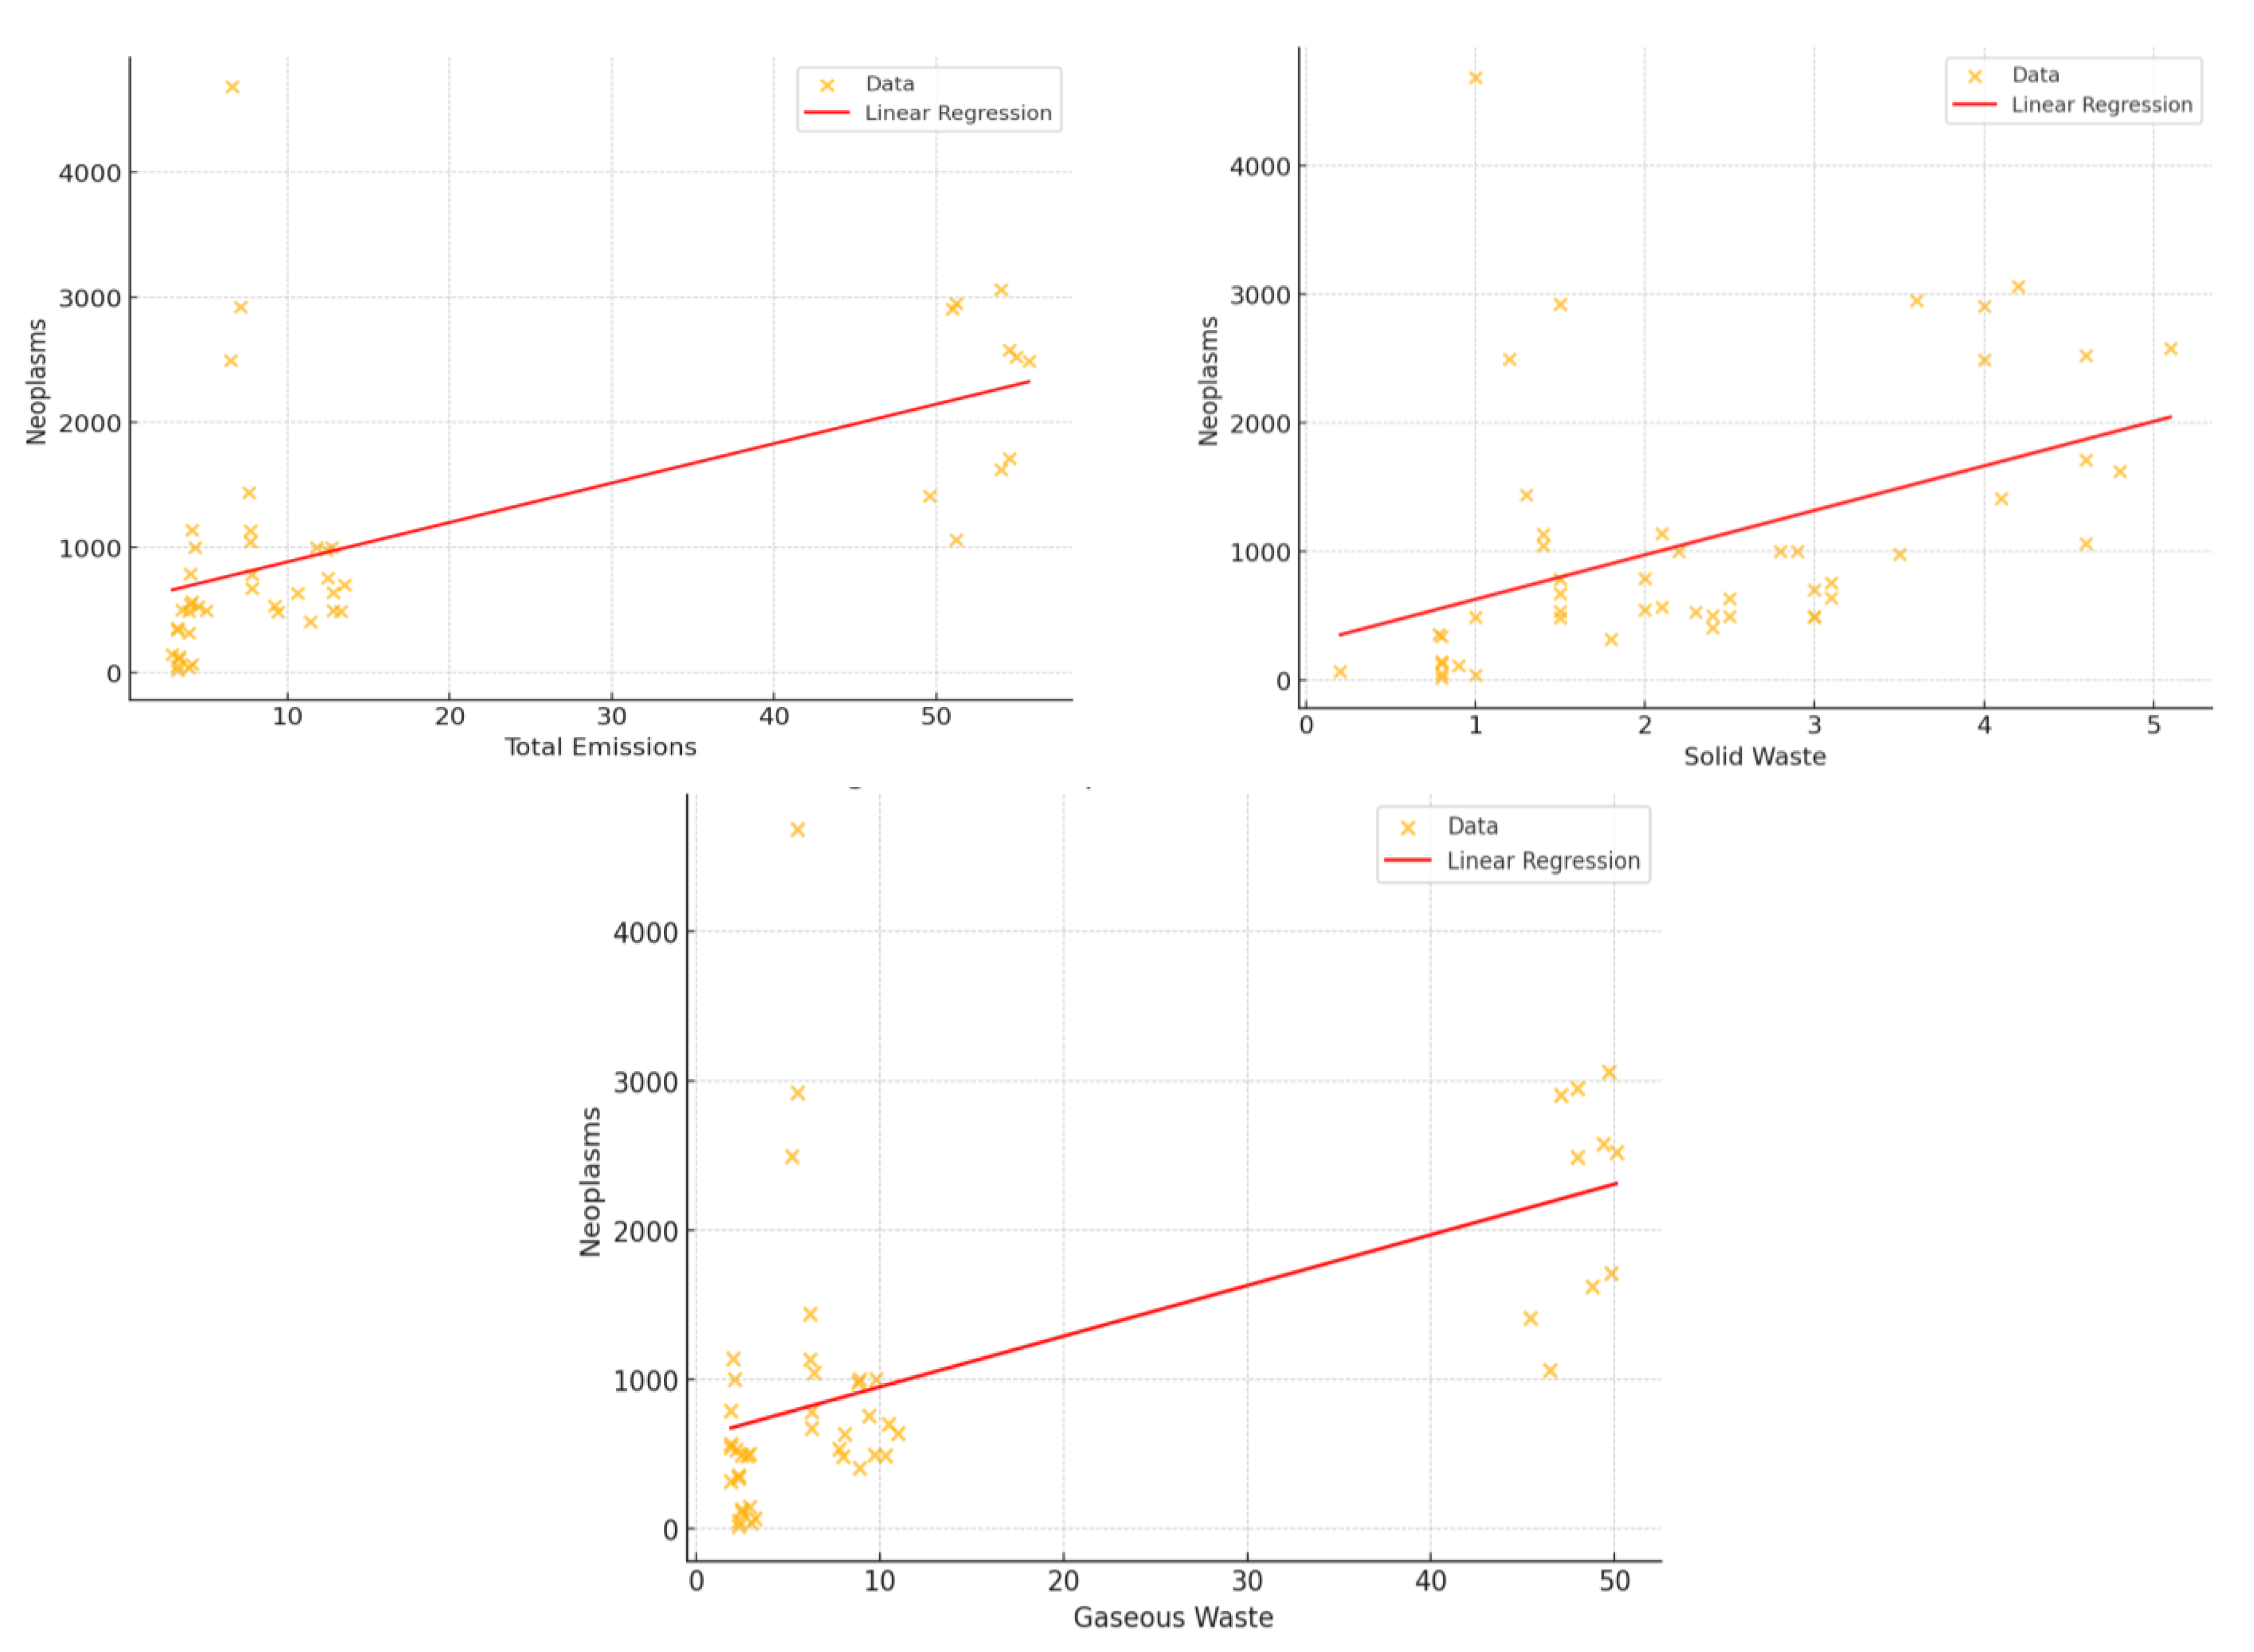
To further study the relationship, regression analysis was conducted after calculating the correlation coefficients (see
Table 8).
In assessing the quality of the model, it was found that the linear regression model confirms a linear relationship between emissions and neoplasms, as shown in
Figure 4.
4. Discussion
Exposure to atmospheric air pollution increases mortality and morbidity rates, as well as reduces life expectancy. The results obtained confirm the relationship between the level of atmospheric pollution, particularly emissions from stationary sources, and the incidence of malignant neoplasms in industrially affected areas of East Kazakhstan region. The moderate positive correlation revealed between the concentrations of gaseous pollutants (r = 0.59) and the morbidity rate of oncological diseases, as well as the results of regression analysis (R2 = 0.35), suggests a linear relationship between the volume of emissions and the rise in cancer morbidity in the study region. The East Kazakhstan region ranks among the leading regions in the Republic of Kazakhstan for morbidity and mortality rates from a number of diseases, highlighting the need for a detailed analysis and a comprehensive approach to addressing the emerging issues. Carcinogenic substances such as benzene, dioxins, cadmium, and others significantly increase the risk of malignant neoplasms, as well as diseases of the respiratory and cardiovascular systems. The regular exceedance of MACs for toxic substances such as sulfur dioxide, hydrogen sulfide, carbon monoxide, hydrogen chloride, and nitrogen dioxide increases the risk of chronic respiratory and cardiovascular diseases in the region. The East Kazakhstan region ranks first in the number of patients on the dispensary register, which also indicates an unfavorable environmental situation. Continuous exposure to pollutants causes chronic inflammatory processes in the respiratory tract, provokes bronchial asthma, damages the cardiovascular system, impairs cognitive functions, and contributes to the development of cancer. The role of both particulate matter (PM2.5, PM10) and gaseous components (NO2, NOx, SO2) in the structure of atmospheric pollution warrants special attention. Modern scientific data suggest that it is their combined impact that poses the most significant threat to public health. In real environmental conditions, the population is exposed to a complex mixture of pollutants, where particles and gases act not in isolation but in synergy, enhancing the toxic and carcinogenic effects of each other. Gaseous components can adsorb onto the surface of PM particles, increasing their stability, penetration capacity, and biological activity.
According to the Global Burden of Disease Study 2015 (Cohen et al., 2017) [
37], ambient air pollution is the fifth leading risk factor for mortality globally. In 2015, PM
2.5 pollution was estimated to cause 4.2 million premature deaths and more than 103 million lost disability-adjusted life years (DALYs), with a significant proportion attributed to lung cancer (16.5%), coronary heart disease (17.1%), and COPD (27.1%). Pollution-related mortality rates are particularly high in countries with intense industrial activity and high levels of urbanization, where pollutants often interact in complex ways. These global estimates highlight the importance of local studies in regions with similar emission patterns, such as East Kazakhstan.
This is confirmed by data from international epidemiological and toxicological studies. In particular, Loomis et al. (2014) [
38] emphasize that atmospheric air pollution, fine particulate matter (PM
2.5, PM
10), and gaseous components such as nitrogen dioxide (NO
2) and sulfur dioxide (SO
2) are classified by the International Agency for Research on Cancer (IARC) as Group 1 carcinogens. These pollutants have been found to cause inflammation, oxidative stress, genetic mutations, and DNA damage, which underlie carcinogenesis. More than 200 epidemiological studies in Europe, Asia, and North America have demonstrated a consistent positive association between air pollution levels and lung cancer, including cases in non-smokers. According to the literature, the average period of exposure to pollutants required to develop lung cancer ranges from 10 to 30 years (Lipfert & Wyzga, 2019) [
39], emphasizing the delayed nature of the carcinogenic effects of polluted air. Jiang et al. (2024) [
40] demonstrate that air pollution impacts not only the risk of colorectal cancer but also patient survival. The UK Biobank study established an association between exposure to PM
2.5, NO
2, and reduced survival in colorectal cancer (CRC), with mechanisms involving epigenetic changes—specifically, the methylation of CpG sites associated with the CXCR5 and TMBIM1 genes. This opens the door to understanding the role of contaminants as modifiers of gene expression that influence tumor growth and disease progression. Of key importance are the results of the epigenetic analysis conducted by Peng et al. (2025) [
41]. A two-sample Mendelian randomization using data from 58 global cohort studies identified 130 CpG sites sensitive to PM
2.5, PM
10, and NO
2 contaminants, which are associated with the risk of 14 types of malignancies. Particularly pronounced associations were found for basal cell carcinoma, lung cancer, breast cancer, and prostate cancer. These data suggest that air pollution has a systemic carcinogenic effect not only through direct tissue damage but also through epigenetic mechanisms that alter gene regulation. The systemic effect of air pollution is further supported by a study by Chen et al. (2025) [
42], which shows that exposure to PM and NO
2 significantly increases the risk of developing frailty in adults. This geriatric syndrome, characterized by reduced physiological reserve and stress tolerance, may serve as a predictor of accelerated aging and overall vulnerability to cancer pathologies. Mechanisms underlying these effects include mitochondrial dysfunction, systemic inflammation, epigenetic abnormalities, and DNA damage, making them universal to most chronic diseases, including cancer. Further support for the role of aerosol particulate chemistry in the development of lung cancer is provided by Jenwitheesuk et al. (2020) [
43], who found that accumulated exposure to organic carbon (OC), sulfate (SO
4), and dust was statistically significantly associated with increased incidence in Thailand. Specifically, the IRR for dust was 1.061, for sulfates 1.026, and for organic carbon 1.021. The authors emphasize that not only the mass of PM particles but also their chemical composition contributes to carcinogenesis, especially in cases of long-term accumulation.
Despite the fact that environmental information on atmospheric air pollution (e.g., concentrations of PM, NO2, and other substances) is publicly available in the East Kazakhstan region and can be accessed through official websites, issues related to the level of public awareness of real risks, as well as their perception and behavior, remain unresolved.
It is important to assess not only the availability of access to data but also how this information is perceived and used at both the individual and collective levels. In the future, separate studies should be conducted to investigate environmental behavior, trust in information sources, and the effectiveness of communication between government agencies and the population in near-industrial areas. Furthermore, it is essential to evaluate how effectively the public is engaged in decision-making processes related to environmental health risks and the extent to which this engagement influences their actions.
Thus, the totality of modern epidemiological, molecular, and epigenetic data confirms that atmospheric air pollution, especially in the form of a complex mixture of solid particles and gaseous components (PM2.5, PM10, NO2, NOx, SO2), has a multilevel, systemic impact that contributes to carcinogenesis. In the conditions of the East Kazakhstan region, where high anthropogenic load and the exceeding of MACs for the main pollutants persist, it is particularly important to introduce measures to reduce emissions, expand environmental monitoring, and integrate data on environmental impact into cancer statistics and prevention programs. The findings underscore the importance of conducting additional research to broaden both the range of pathologies studied and the time period of analysis, as well as to assess the impact of air pollution on the healthcare system and the economy as a whole.
5. Conclusions
In the East Kazakhstan region, a consistent linear relationship was identified between atmospheric air pollution from stationary industrial sources and the increase in cancer morbidity among the population. Gaseous pollutants such as nitrogen dioxide (NO2), sulfur dioxide (SO2), and carbon monoxide (CO), along with fine particulate matter (PM2.5) and dust, were found to exert the most significant influence on morbidity rates. The combined exposure to these pollutants increases carcinogenic risk. The highest rates of cancer-related illnesses were recorded in the industrial cities of Ust-Kamenogorsk and Ridder, correlating strongly with elevated emission levels.
The findings of this study provide a scientific basis for policy-making in the fields of environmental monitoring, urban planning, and public health prevention strategies. Transitioning to stricter air quality standards, deploying advanced filtration technologies, and expanding the use of renewable energy sources are crucial steps toward mitigating public health risks associated with air pollution.
5.1. Limitations of the Study
The ten-year study period limits the ability to fully assess the long-term cumulative effects of atmospheric pollutants, particularly in relation to chronic and oncological diseases, which may develop over several decades. The absence of detailed data on individual exposure levels—both in terms of dose and duration—precludes establishing direct causal links at the individual level. Additionally, the use of aggregated data restricts the analysis of behavioral and social risk factors such as smoking, occupational exposure, and lifestyle. Seasonal variations and meteorological factors that influence pollutant concentration and spatial distribution were not accounted for in the regression models.
5.2. Use of Artificial Intelligence
Artificial intelligence (AI) tools were employed solely for the grammatical, stylistic, and structural enhancement of the manuscript. AI was not involved in data generation, analysis, interpretation, or in the formulation of scientific conclusions. All research findings and interpretations presented herein are the sole responsibility of the authors.


