Article

Numerical Analysis of Air Quality Improvement and Thermal Comfort in a Classroom Using Organic Air Cleaners

by
Enrique Cruz-Octaviano
1,
Guillemo Efren Ovando-Chacon
1,*,
Abelardo Rodriguez-Leon
1 and
Sandy Luz Ovando-Chacon
2,*
1
Tecnológico Nacional de México, Instituto Tecnológico de Veracruz, Calzada Miguel Ángel de Quevedo 2779, Veracruz 91860, Mexico
2
Tecnológico Nacional de México, Instituto Tecnológico de Tuxtla Gutiérrez, Carretera Panamericana Km 1080, Tuxtla Gutierrez 29000, Mexico
*
Authors to whom correspondence should be addressed.
Atmosphere 2025, 16(6), 727; https://doi.org/10.3390/atmos16060727
Submission received: 14 May 2025 / Revised: 10 June 2025 / Accepted: 12 June 2025 / Published: 15 June 2025
(This article belongs to the Section Air Quality)

Abstract

:
Evaluating ventilation behavior inside classrooms in hot climates is fundamental to ensure good indoor air quality and proper thermal comfort, thus guaranteeing a healthy environment for the users. This study analyzes the impact of mixed ventilation strategies, which combine mechanical extractors and organic air cleaners (OACs), on CO2 concentration and temperature distribution in an air-conditioned classroom with closed doors and windows. We used computational fluid dynamics simulations to analyze the effect of different extractor and OACs configurations on airflow distribution and average temperature, as well as the temporal evolution of average CO2 concentrations inside the classroom. The configuration with one extractor and two OACs reduces CO2 concentrations to 613 ppm, representing an effective solution with lower energy consumption. These findings demonstrate that hybrid ventilation systems can significantly improve IAQ and maintain thermal comfort, offering viable and energy-efficient alternatives for enclosed classrooms in hot climate regions.

1. Introduction

Nowadays, thermal comfort and air quality in enclosed spaces are important factors in the well-being of the people who occupy them. Adequate classroom ventilation reduces the concentrations of carbon dioxide (CO2) to which students and teachers are exposed, improving academic performance. Understanding airflow behavior, heat transfer, and contaminant transport within classrooms is essential to achieving efficient ventilation that maintains thermal comfort and ensures proper air quality. One way to analyze the behavior of contaminant dispersion and temperature inside classrooms is using computational fluid dynamics (CFD) [1,2,3,4,5,6]. Various studies show the adequacy of CFD models in evaluating thermal performance and indoor environmental quality in buildings or spaces with different ventilation and air conditioning systems in different climates.
Thermal comfort analysis has been studied in various spaces, for example, educational centers such as schools [1], classrooms [2,3], and workshops [4]; health centers such as operating rooms [5], isolation rooms [6], and laboratories [4]; meeting centers such as living rooms [7], mosques [8], conference rooms [9], and stadiums [10]; work centers such as buildings [11], offices [12,13], and finally, vehicles such as buses [14] and airplanes [15]. Currently, there are many studies related to thermal comfort; yet, they do not consider air quality analysis.
Research has analyzed the impact of the type of ventilation and air conditioning systems on thermal comfort; some of it has focused on the effect of architecture on passive ventilation of buildings [16,17], while others have evaluated the impact of natural ventilation [1,2,8], and the use of air conditioners [10,12] or fan coils [13,18]. The implementation of stratified ventilation systems [19,20] has also been studied, along with underfloor air distribution [21,22] and the use of extractors [8] and heating systems [7,23].
Climate and weather conditions are fundamental in the analysis of thermal comfort, as different climates have different external parameters, such as air temperature, heat transfer, and air velocity, which affect the exterior surfaces like roofs, walls, and building windows. Therefore, CFD models require appropriate boundary conditions. Different studies have assessed thermal comfort in warm climates [9,10,14], tropical climates [21], equatorial climates [2], and continental climates [12]; moreover, to enable sound scenario recommendations for high or low temperatures, several studies have considered assessing thermal comfort in summer [24], winter [7,18,25] or both summer and winter [8,13], while other studies have looked into thermal comfort during the seasonal transitions [11]; on the other hand, only a few studies have carried out time-dependent simulations to obtain the evolution of temperature and contaminant concentration throughout the day [3].
Modifying operating parameters related to thermal comfort can indirectly influence indoor air quality conditions and vice versa. The close relationship between thermal performance and indoor environmental quality has been the focus of different studies, which have focused on analyzing various interior spaces, from simple geometries [26,27] to bedrooms [28,29], kitchens [30,31], classrooms [32,33], houses [34], offices [35,36], libraries [37,38], and multi-purpose rooms [39].
Because the different operating modes of ventilation and air conditioning systems modify the behavior of airflow and indoor concentrations of contaminants such as carbon dioxide, a number of researchers have taken different approaches to analyzing indoor air quality. For example, the air quality in various systems has been studied considering passive elements such as natural ventilation [2,35]; the influence of partition screens on the dispersion of CO2 indoors [37]; the effect of the size and angle of window overhangs on natural ventilation [39] and the implementation of plants as organic air cleaners [27,40]; similarly, indoor air quality has been evaluated using active ventilation systems, such as upward air supply ventilation systems through ducts [41]; range hoods [30]; ducted heat pumps [34]; the implementation of air diffusers [33]; ventilation systems with heat recovery [28,29]; personalized ventilation systems [31,32]; thermal displacement ventilation systems [42]; impinging jet air distribution method [36]; personalized ceiling-mounted ventilation systems [43]; underfloor air distribution systems [22]; additionally, there are studies like those of [44] that compare the effect of various ventilation systems on thermal comfort and air quality. On the other hand, air quality in industrial facilities has also been recently studied [45].
Given the different configurations of interior spaces and the different types of ventilation and air conditioning systems, carbon dioxide concentration levels have been evaluated using various indices, one of which is contaminant removal efficiency, which measures how well the ventilation system or device works to clean a contaminated space [41,46,47]. It is important to note that the CO2 level is used to indicate indoor air quality and ventilation effectiveness rather than a direct health hazard at common indoor levels.
In high-occupancy indoor spaces such as classrooms, ensuring good air quality and adequate thermal comfort is essential to preserve the health and productivity of occupants [41]. Although air conditioning systems maintain comfortable temperatures [4,20], their use in closed environments without adequate ventilation can lead to CO2 accumulation [24]. To mitigate this problem, several studies recommend the use of mechanical ventilation using air extractors [6,45], while other works suggest the implementation of indoor plants that act as organic air purifiers [27,40]. The integration of these strategies improves air quality, preserves thermal comfort, and reduces energy consumption [9,29].
Several studies assess thermal comfort or air quality, and some evaluate the interaction between these two parameters; however, very few have assessed the temporal and spatial behavior of thermal comfort and indoor air quality in a hot climate like that of the city of Veracruz, Mexico. The present study aims to improve air quality without affecting the thermal comfort of classrooms located in hot climates. To improve air quality, we propose placing air extractors and organic air cleaners in different positions inside the classroom. This work presents as its main novelty the three-dimensional simulation of a real classroom, in which a hybrid strategy is proposed that integrates passive elements (OACs) and active ones (extractors) to improve air quality. An additional advantage is that OACs do not require energy to operate, which promotes energy savings and contributes to environmental protection.

2. Materials and Methods

2.1. Case Studies

In this study, we assess a classroom (see Figure 1a) in the city of Veracruz, Mexico, which is located on the Gulf of Mexico coast, at geographic coordinates of latitude 19°11′56″ north and longitude 96°9′35″ west and an altitude of 10 m above sea level. During the hottest months, maximum temperatures exceed 35 °C. According to [48], the region features a tropical warm-humid climate (Köppen classification Aw). In this city, the weather is extremely hot throughout the year, which demands a very high cooling load. The room is 8 m long, 6 m wide, and 2.9 m high. On the east side of the room, there are two windows and a door. The windows are 1.6 m long by 1.6 m high and 2.6 m long by 1.6 m high, respectively. The wooden door is 1 m long by 2.2 m high. On the west side of the room, there are two windows measuring 2.8 m long by 1.6 m high and 2.6 m long by 1.6 m high, respectively. The roof and the north, east, and west walls are completely exposed to heat flow from direct sunlight, while the south wall adjoins another classroom. The classroom has an air conditioning system to mitigate the effects of hot weather so students can take classes throughout the day.
The hottest period of the year for the city of Veracruz, where the analyzed classroom is located, is from May to August, which is why temperature measurements were taken during this period throughout the academic day (from 07:00 h to 19:00 h). The study conditions correspond to 26 May 2024, at 1:00 p.m., the day and time when the highest temperature of the working days was recorded (Figure 1b).
The door and the windows are closed most of the day due to the hot weather conditions outside throughout the day. For the above reason, CO2 levels increase inside the classroom, exceeding the permissible values of 1000 ppm [49]. Air extractors are implemented to alleviate this situation. The extractors are located in the southeast and southwest corners of the classroom. Additionally, plants (Sansevieria trifasciata) are proposed as organic air cleaners to absorb CO2 (3.6 × 10⁻⁹ kg/m3s) [27].
This study considers 15 students and one teacher in the classroom, for a total of 16 occupants. The analysis considers that the occupants are contaminant sources with a CO2 concentration of 40,000 ppm and heat sources at a temperature of 36 °C. On the other hand, a temperature of 45 °C is considered for the roof, 35 °C for the north wall, and 40 °C for the east and west windows. The south wall is adiabatic, and all the walls have no-slip velocity boundary conditions. The temperature and CO2 concentration at the air conditioner inlet are Tin = 20 °C and Cin = 410 ppm, respectively. Simulations are carried out for different extractor configurations, with varying extractor operating speeds, and number of extractors used (1 or 2). Table 1 shows the different cases with extractors. Additionally, simulations are carried out where OACs (organic air cleaners) that absorb CO2 are implemented in different locations inside the classroom, as shown in Table 2.

2.2. Governing Equations

The geometry used to study thermal comfort and air quality in a classroom is a three-dimensional space, as shown in Figure 1a. The equations governing the turbulent flow of an incompressible fluid in this space are the equations of mass and momentum conservation and energy and mass transport.
ρ u i t + ρ u i u j x j = p x i + x j μ u i x j + u j x i ρ u 𝚤 u 𝚥 ¯ + F i ,
u i x i = 0 ,
ρ T t + ρ U j T x j = 1 C p x j λ T x j ρ C p u ȷ T ¯ ,
ρ C t + ( ρ u j C ) x j = x j ρ D C x j ρ u ȷ C ¯ ,
where ui is component i of velocity, xi is component i of spatial coordinate, ρ is density, p is pressure, μ is dynamic viscosity, Fi is component i for external body force, T is temperature, Cp is specific heat, λ is thermal conductivity, C is concentration, and D is the diffusion coefficient.
In Equations (1)–(4), the Reynolds stress tensor, the turbulent heat flux, and the turbulent mass flux can be approximated by
ρ u ı u ȷ ¯ = μ t u i x j + u j x i + 2 3 ρ K δ i j ,
ρ u ȷ T ¯ = μ t σ t T x i ,
ρ u ȷ C ¯ = μ t S c t C x i ,
where Sct is the turbulent Schmidt number.
Turbulent kinetic energy K and turbulent kinetic energy dissipation ε are calculated by
ρ K t + ρ u i K x i = x i μ + μ t σ K K x i + P K + G K ρ ε ,
ρ ϵ t + ρ u i ϵ x i = x i μ + μ t σ ε ε x i + C ϵ 1 ϵ K P K + C ϵ 3 G K C ϵ 2 ρ ε 2 K ,
In the previous equations, µt is the turbulent viscosity, PK is the production rate of kinetic energy, and Gk is the generation or destruction of turbulence.

2.3. Discretization

The present study uses the finite element method to solve the governing Equations (1)–(9), as well as the operator splitting scheme [50,51] to decompose the original problem into various subproblems, as indicated in Equations (10)–(19):
Ω u i n + 1 3 u i n t ψ d Ω + Ω μ + μ t u i n x j Ψ x j d Ω Ω p n Ψ x i d Ω = 0 ,
Ω u i n + 1 3 x i ψ d Ω = 0 ,
Ω u i n + 2 3 u i n 1 3 t ψ d Ω + Ω u j n + 1 u i n + 2 3 x j ψ d Ω = 0 ,
Ω T n + 2 3 T n t ψ d Ω + Ω u j n + 1 3 T n + 2 3 x j ψ d Ω = 0 ,
Ω T n + 1 T n + 2 3 t ψ d Ω + Ω λ ρ · C p T n + 1 x j Ψ x j d Ω Ω μ t ρ · P r t T n + 1 x j Ψ x i d Ω = Γ T D Ψ d Γ
Ω C n + 2 3 C n t ψ d Ω + Ω u j n + 1 3 C n + 2 3 x j ψ d Ω = 0
Ω C n + 1 C n + 2 3 t ψ d Ω + Ω D C n + 1 x j Ψ x j d Ω Ω μ t S c t C n + 1 x j Ψ x i d Ω = Γ C D Ψ d Γ
Ω u i n + 1 u i n + 2 3 t ψ d Ω + Ω μ + μ t u i n + 1 x j Ψ x j d Ω = Ω 2 3 ρ K n δ i j Ψ d Ω + Ω F i Ψ d Ω + Γ u i D Ψ d Γ
Ω K n + 1 K n t ψ d Ω + Ω u j K n + 1 x j ψ d Ω + Ω μ + μ t σ K K n + 1 x j Ψ x j d Ω = Ω P K ψ d Ω + Ω G K ψ d Ω Ω ρ ϵ n ψ d Ω + Γ K D Ψ d Γ
Ω ϵ n + 1 ϵ n t ψ d Ω + Ω u j ϵ n + 1 x j ψ d Ω + Ω μ + μ t σ ε ϵ n + 1 x j Ψ x j d Ω = Ω ϵ n k n C ϵ 1 P K + C ϵ 3 G K ψ d Ω Ω ρ ϵ n k n C ϵ 2 ϵ ψ d Ω + Γ ϵ D Ψ d Γ

2.4. Convergence

Simulations are carried out with different mesh sizes to ensure that the results are independent of the mesh used. Table 3 shows an example of the mesh convergence study for the average CO2 concentrations simulated at two different times; the error is less than 1% between meshes of 1,740,220 and 1,923,461 nodes. Numerical simulations were performed using a numerical code, ITVFem v2206, developed in the Fortran programming language, which was executed on a high-performance computing cluster.

2.5. Validation

Two problems in turbulent regime previously reported by Saury et al. [52] and Ampofo and Karayiannis [53] are simulated to validate the results of the present study, obtained through numerical simulations. In Figure 2a, we compare the Nusselt number as a function of height for a three-dimensional cavity with two of its vertical walls at different temperatures. Figure 2b shows the comparison of temperature along the mean width of a three-dimensional square cavity differentially heated on two of its vertical walls.
Additionally, measurements are taken at different points in the studied classroom to demonstrate the validity of the results. During the measurements, the classroom is considered with the air conditioning on; there were 16 occupants and the measurements spanned a period of 1 h. Table 4 shows an example of the comparison of measurements and simulations for the baseline case in three positions of the studied space with the following coordinates: PA (0.8,5,1.8), PB (3.9,3,1.8), PC (6.8,1,1.8). The compared values correspond to the CO2 concentrations at different times. The maximum error between the simulated values and the measurements is under 1.5%. CO2 measurements were made with a CO2 sensing module controlled by an ESP32 microcontroller, Espressif Systems, Shanghai, China.

3. Results

3.1. Airflow Behavior

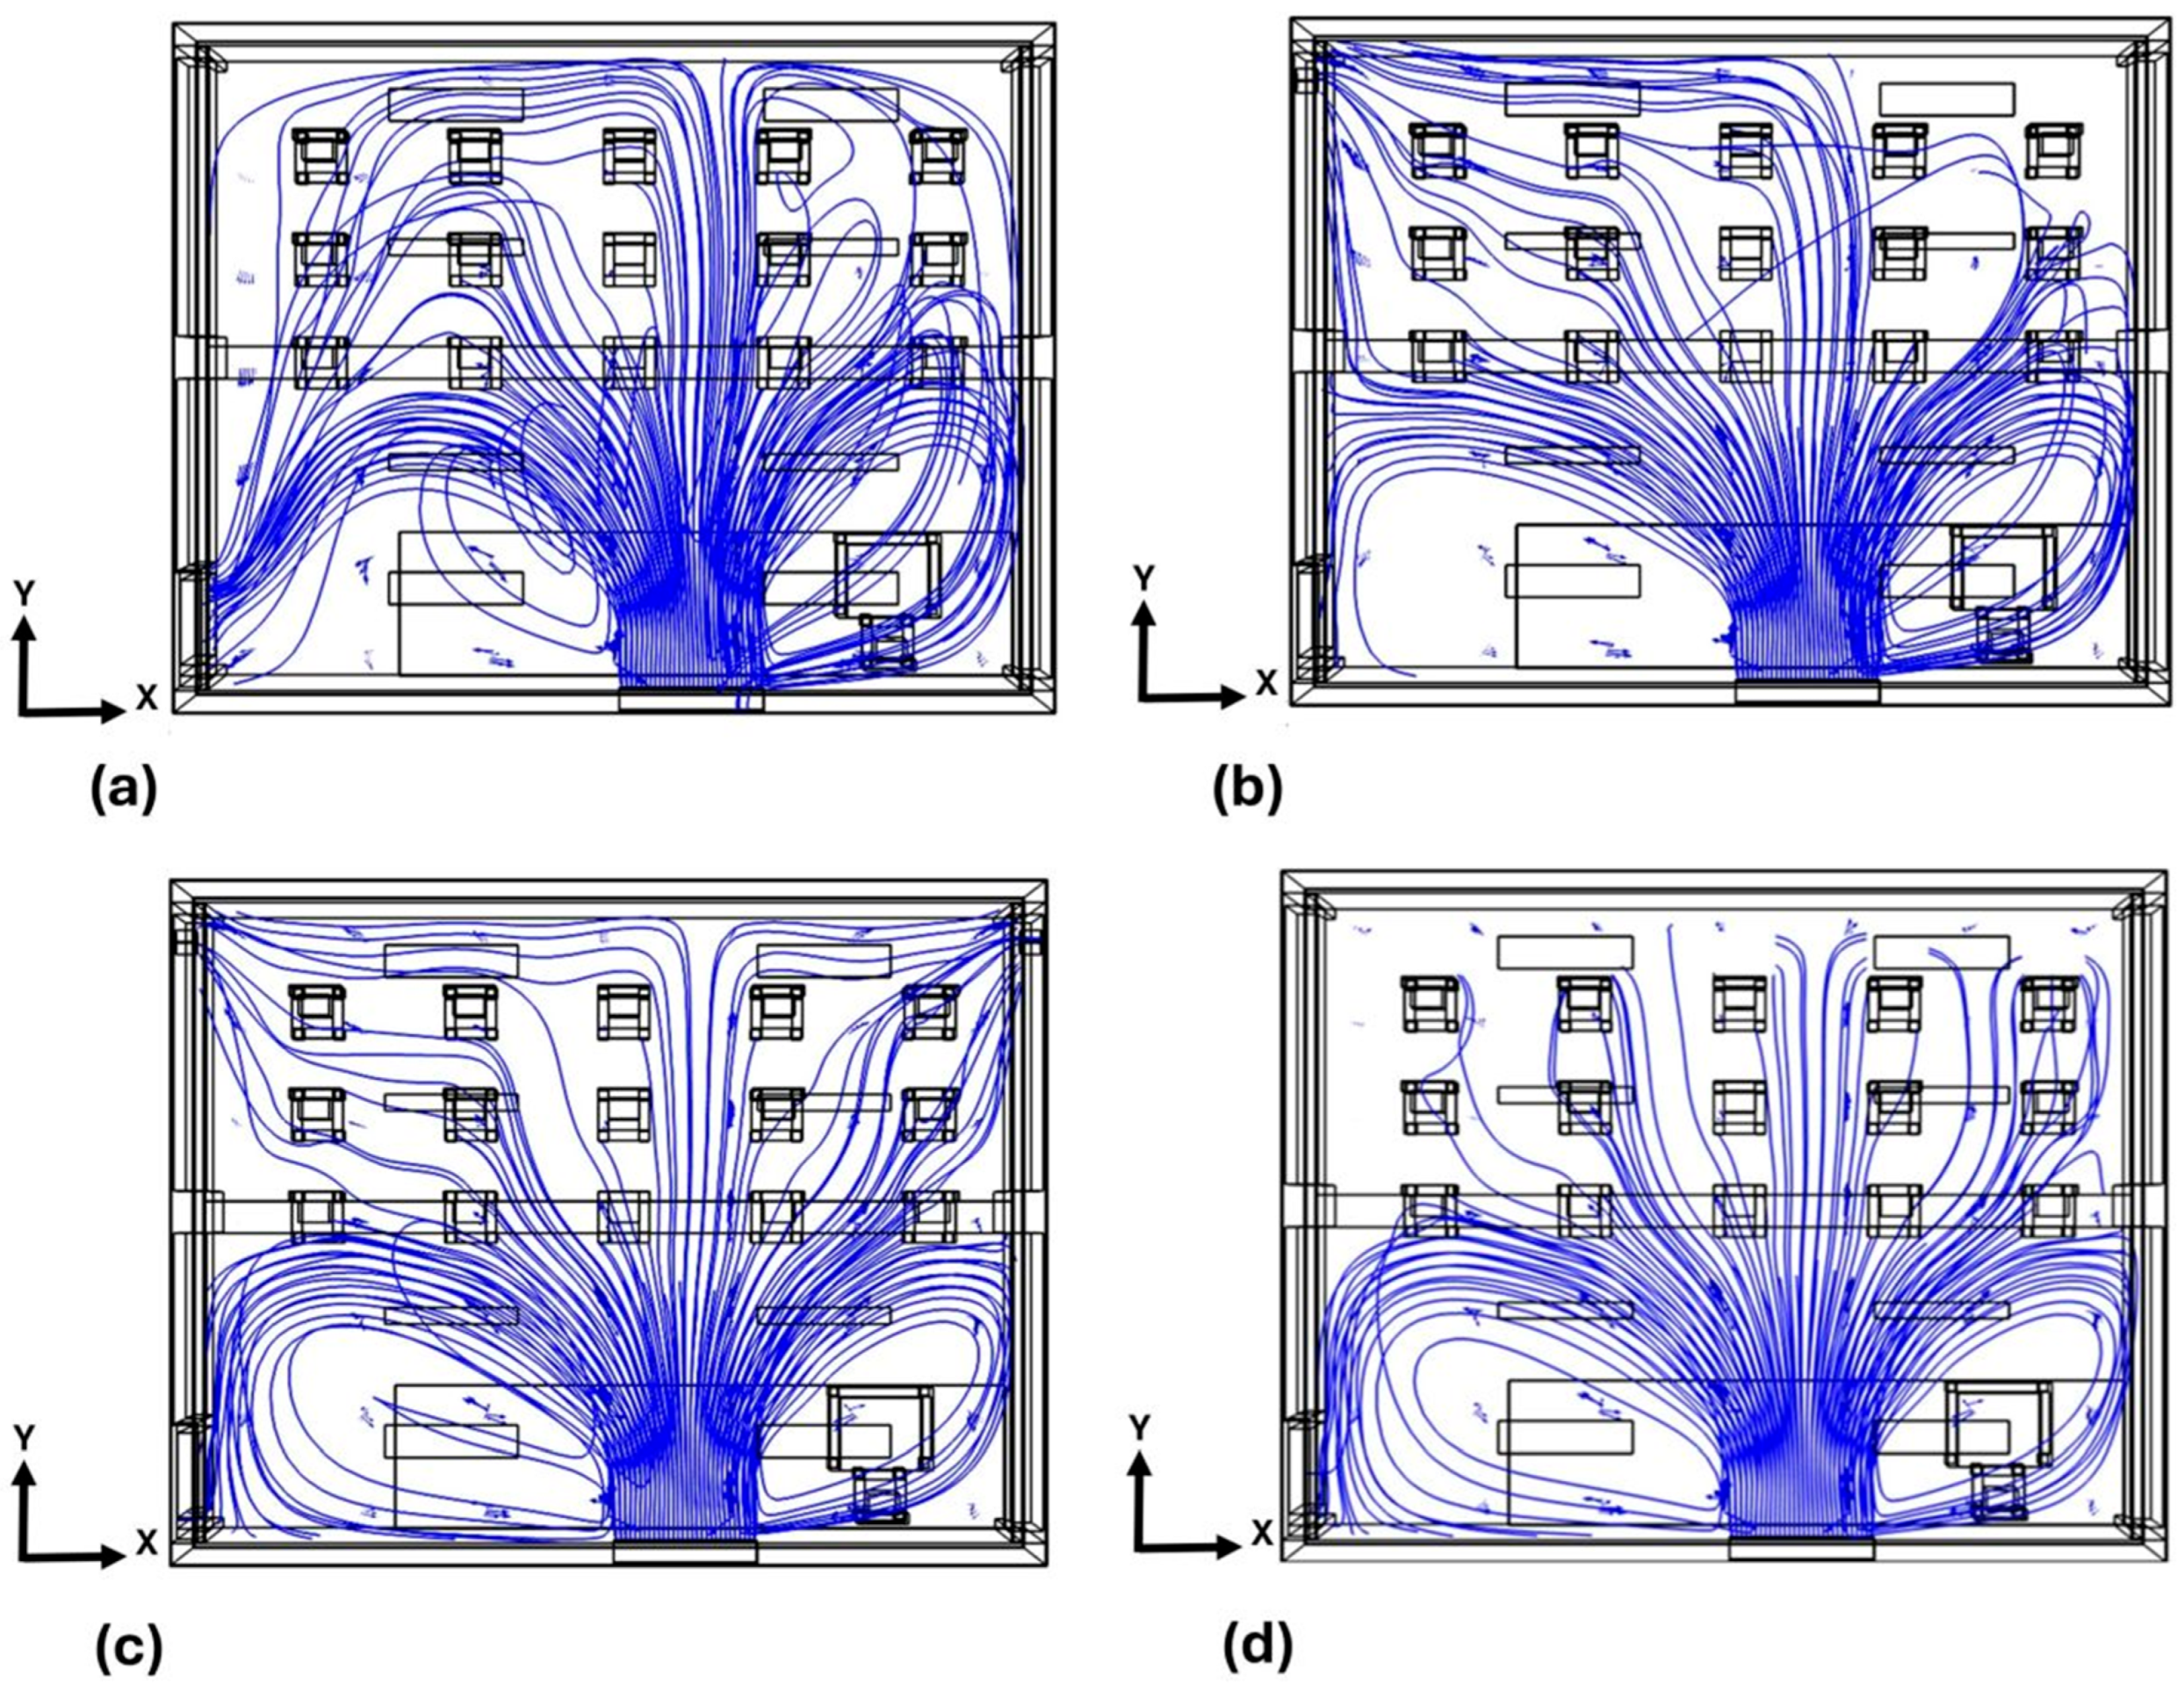
The study of airflow behavior allows for visualizing the variations when installing extractors and OACs in the classroom and the effects of their different operating conditions. Figure 3 shows the airflow streamlines for the baseline case: Case 1A with one extractor, Case 1B with two extractors, and Case 10A with five organic cleaners.
Figure 3a shows the streamlines when no strategy is implemented to reduce the CO2 concentration in the classroom (baseline case). The cold air stream exits the air conditioner at a 50° angle as a flow descending diagonally and hitting the floor directly after the platform. The flow then divides into three main streams. The first one moves east of the classroom, seeking to exit through the door slots. The second one collides with the south wall and moves along it, splitting into two secondary streams that graze the east and west walls. The third stream moves toward the west wall and collides with the secondary stream, which pushes it toward the north wall of the classroom. It passes by the teacher’s desk, generating a vortex and joining the return of the air conditioner.
Meanwhile, Figure 3b describes the movement of airflow when implementing an extractor, with a flow of 13.92 m3/min, in the southeast corner of the classroom (Case 1A). Similarly, the cold airflow from the air conditioner is divided into three primary streams that behave differently compared to the baseline case.
In contrast, Figure 3c shows the behavior of the streamlines when implementing two extractors with a flow of 13.92 m3/min, one in the southeast corner and the other in the southwest corner of the classroom (Case 1B). In this case, the cold airflow from the air conditioner is divided into five primary streams.
On the other hand, Figure 3d illustrates the streamlines when implementing five organic air cleaners at the back of the classroom behind the students near the south wall (Case 10A). This is a passive strategy to reduce CO2 levels inside the classroom. The cold airflow coming out of the air conditioner is also divided into three primary streams, as in the baseline case. One air stream moves to the center and the other two move laterally toward the east and west walls. Unlike the baseline case, the air streams are more intense in the front part of the room.
The different behaviors of the airflow inside the classroom are mainly generated by the implementation of exhaust fans and the collision with the walls. Figure 3b,c shows how the flow of cold air, after hitting the floor, tends to move toward the extractors due to the suction they create. On the other hand, in Figure 3a, the cold airflow moves to the back of the classroom, colliding with the south wall. When adding extractors, the airflow movement is reduced at the back of the room (see Figure 3d). Furthermore, as additional extractors are added, the number of primary streams tends to increase, as in Figure 3c, where five primary streams are generated.
In all cases, the north wall of the classroom has a strong temperature gradient, causing the air in contact with the warm north wall to move upward due to the change in its density. In contrast, the flow coming from the air conditioner moves with an inclination in the opposite direction, affecting air mobility and favoring the formation of vortices in the areas near the hot wall, that is, the teacher’s desk area and the area near the door.

3.2. Temperature Behavior

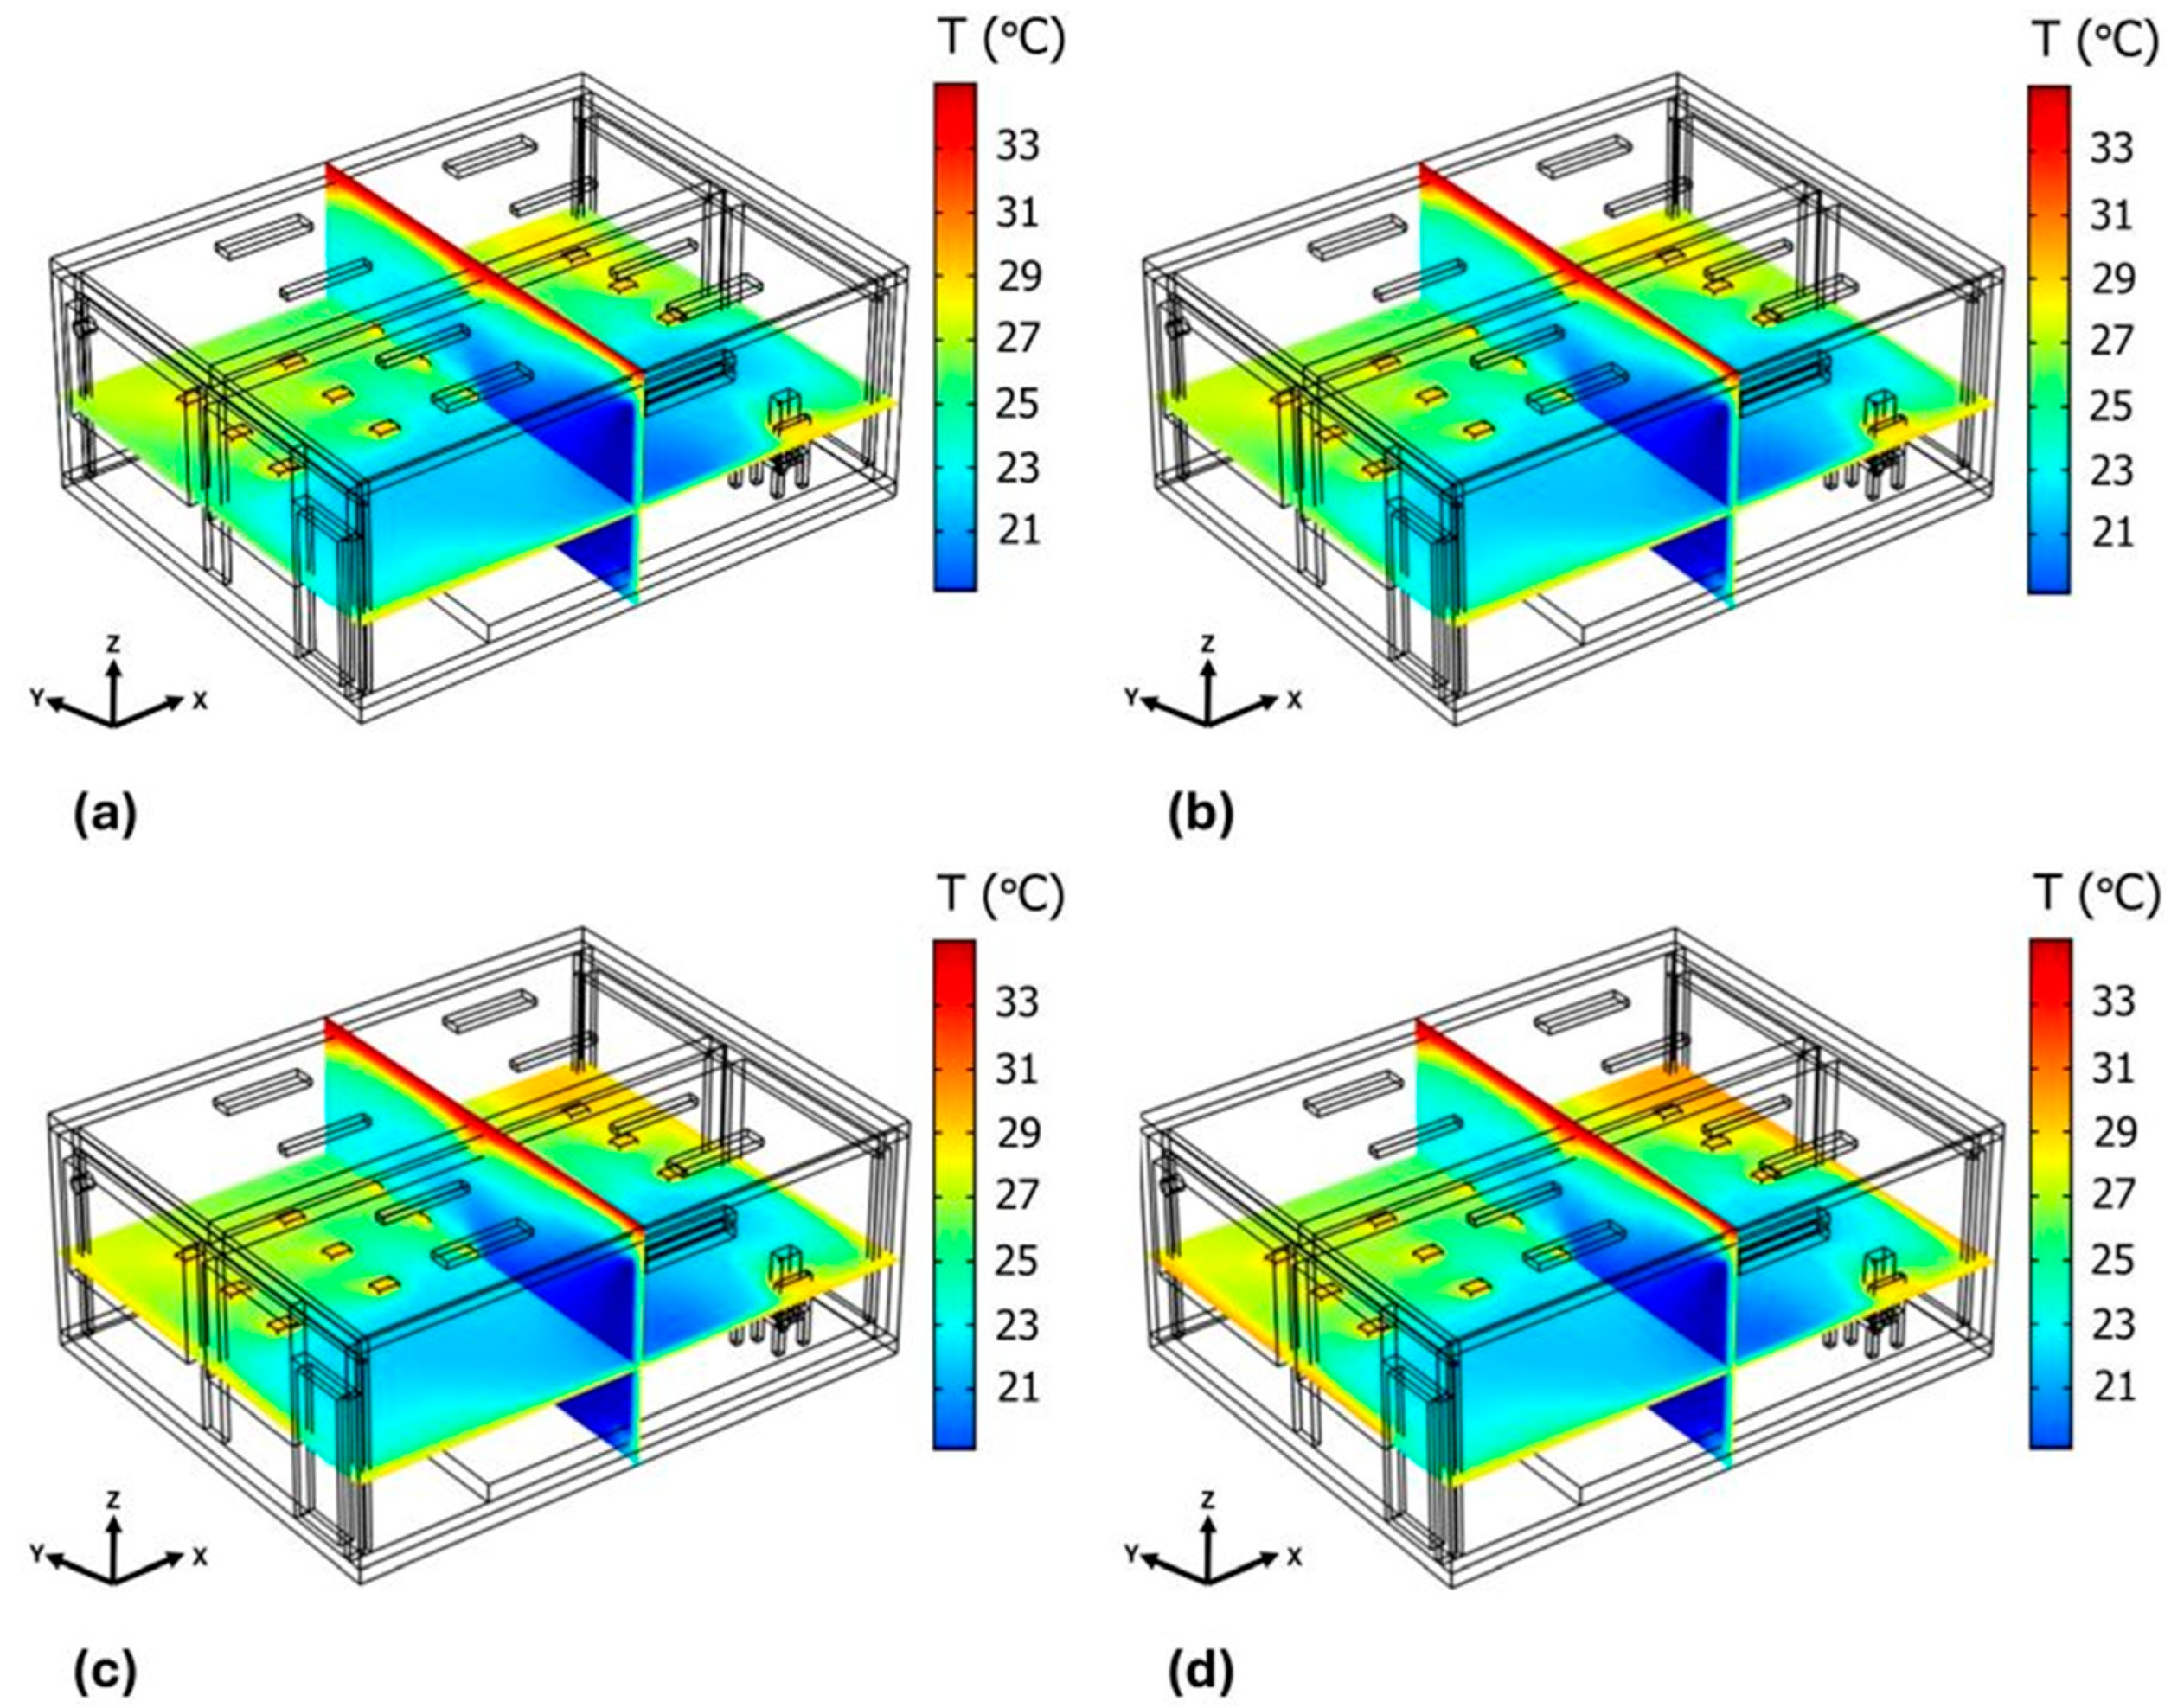
Studying temperature behavior is important to ensure the occupants’ thermal comfort in the classroom. In this study, the air conditioner located on the north wall of the classroom supplies cold air at a temperature of 20 °C with a 50° inclination.
Figure 4 shows the evolution of the temperature fields when implementing an extractor with a flow of 13.92 m3/min (Case 1A). After 5 min (see Figure 4a), the flow of cold air hits the floor, dispersing throughout the room and lowering the temperature for all occupants. Hot air moves toward the classroom’s south wall, and the warmer air rises to the top of the classroom due to the buoyancy effect. After 15 min (see Figure 4b), the temperature behaves consistently, with an average temperature of 24.2 °C inside the room. Subsequently, at 45 min (see Figure 4c), a heat island forms in the room’s southwest corner. At that time, an increase in temperature is also observed in the east and west windows, which are the main thermal bridges to the classroom’s interior. After 60 min (see Figure 4d), the heat island in the southwest corner increases in size because the extractor is installed in the opposite corner, so the cold air displacing the hot air does not reach the southwest corner.
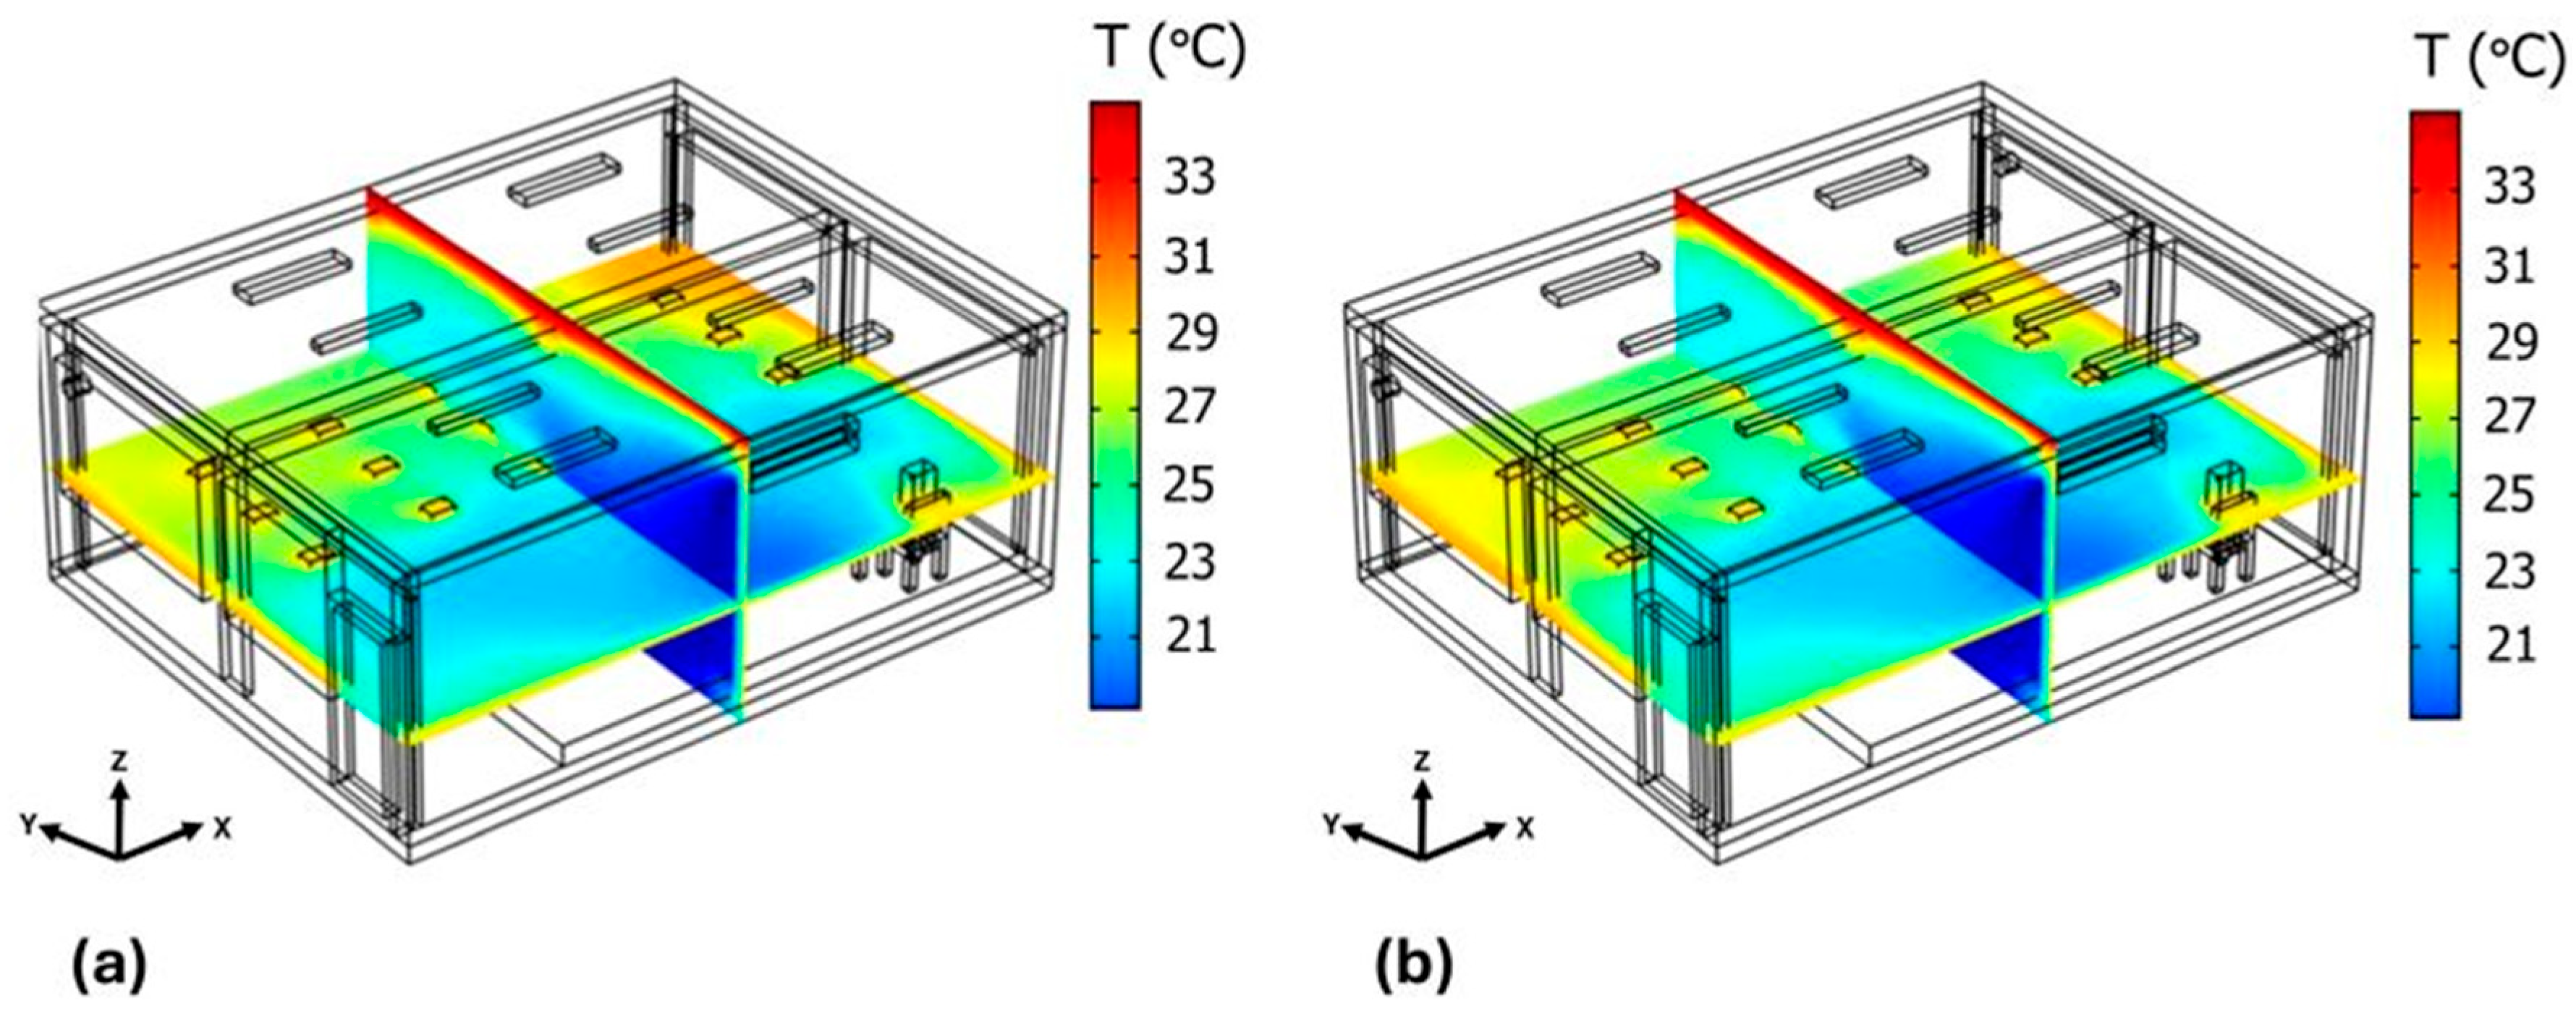
When two extractors with a flow of 13.92 m3/min are placed in the southeast corner and the southwest corner of the classroom (Case 1B), the behavior of the temperature fields over time is similar to when a single extractor is used (Case 1A). However, after 60 min, the heat island that is generated in the southwest corner of the classroom with one extractor (see Figure 5a) does not appear with two extractors (see Figure 5b) because cold air flows from the air conditioner’s outlet to the extractor in the southwest corner, pushing the hot air along its path, as seen in the streamlines in Figure 3c.
For Case 1A and Case 1B, the average temperature inside the room after 60 min is 24.5 °C and 24.3 °C, respectively. These temperature values are within the thermal comfort range, oscillating between 23 °C and 26 °C [54].

3.3. Behavior of CO2 Levels

The use of air conditioning equipment in classrooms in cities with high daytime temperatures, such as the city of Veracruz, Mexico, is necessary to provide a comfortable environment for the academic activities of students and teachers. This requires that classroom doors and windows remain closed for the correct operation of air conditioning equipment. However, keeping the classrooms completely closed during classes increases CO2 levels, which can affect users’ health. Therefore, implementing strategies to reduce CO2 levels inside classrooms is of utmost importance.
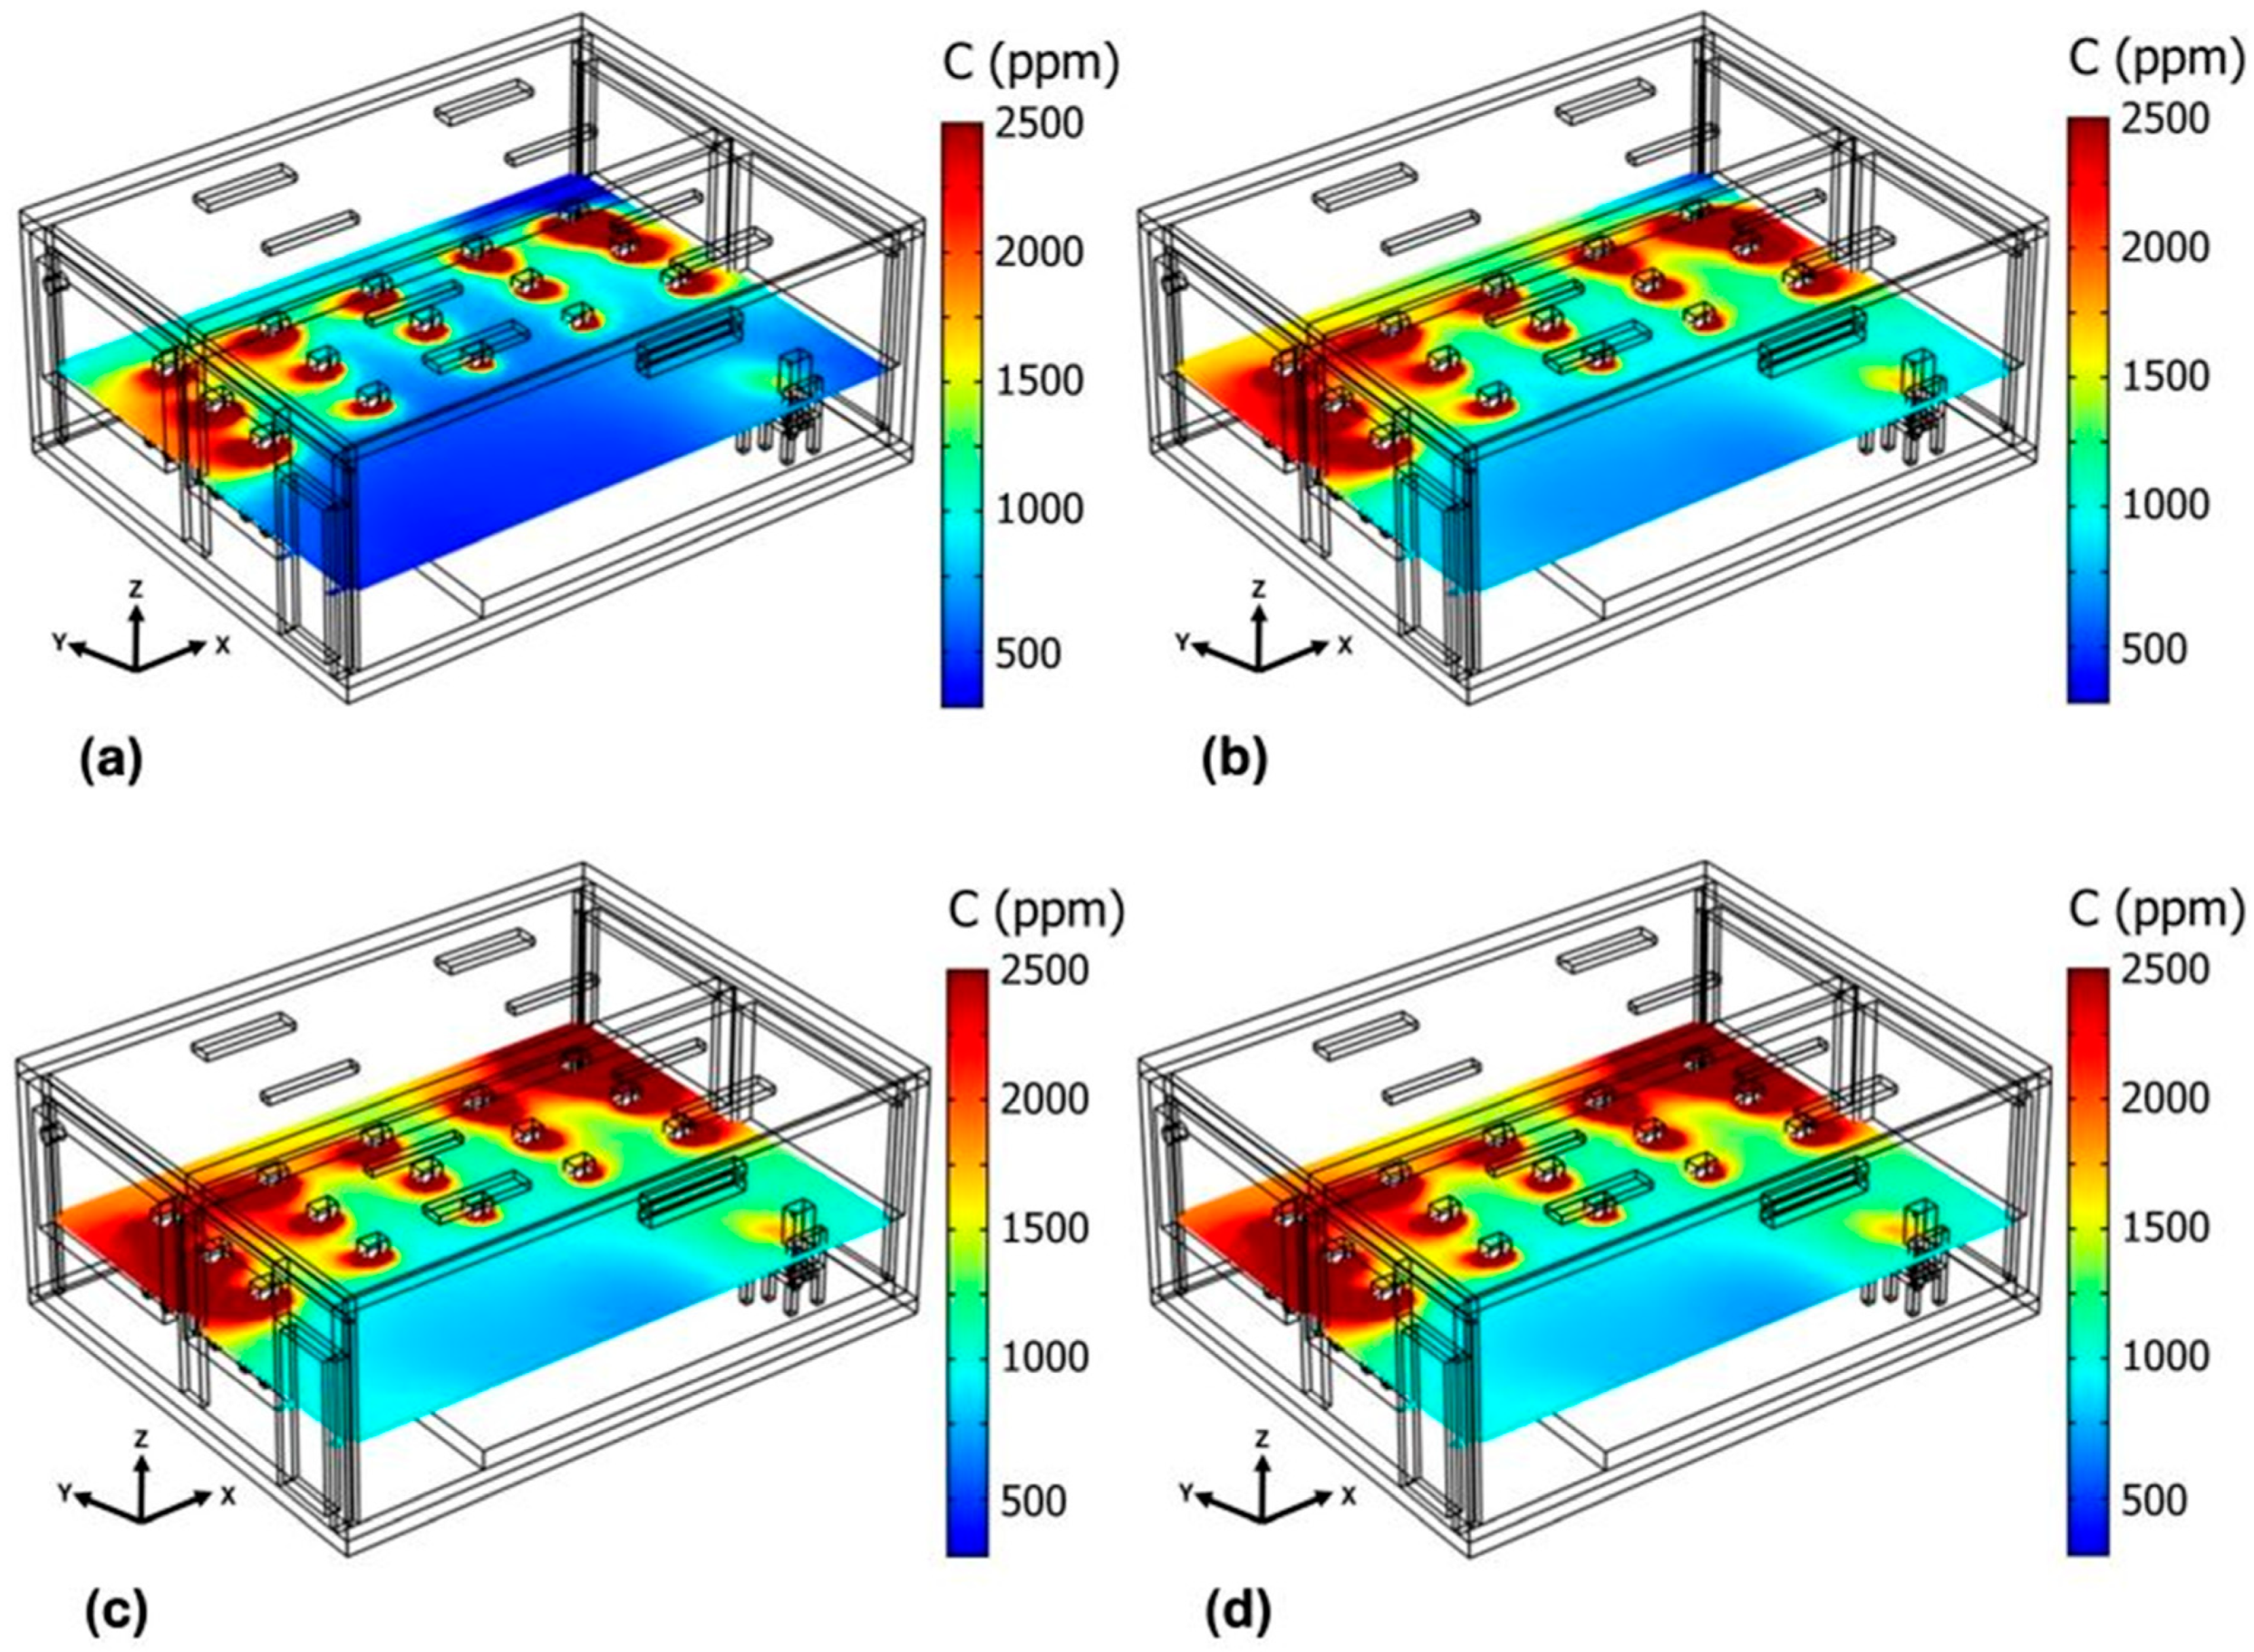
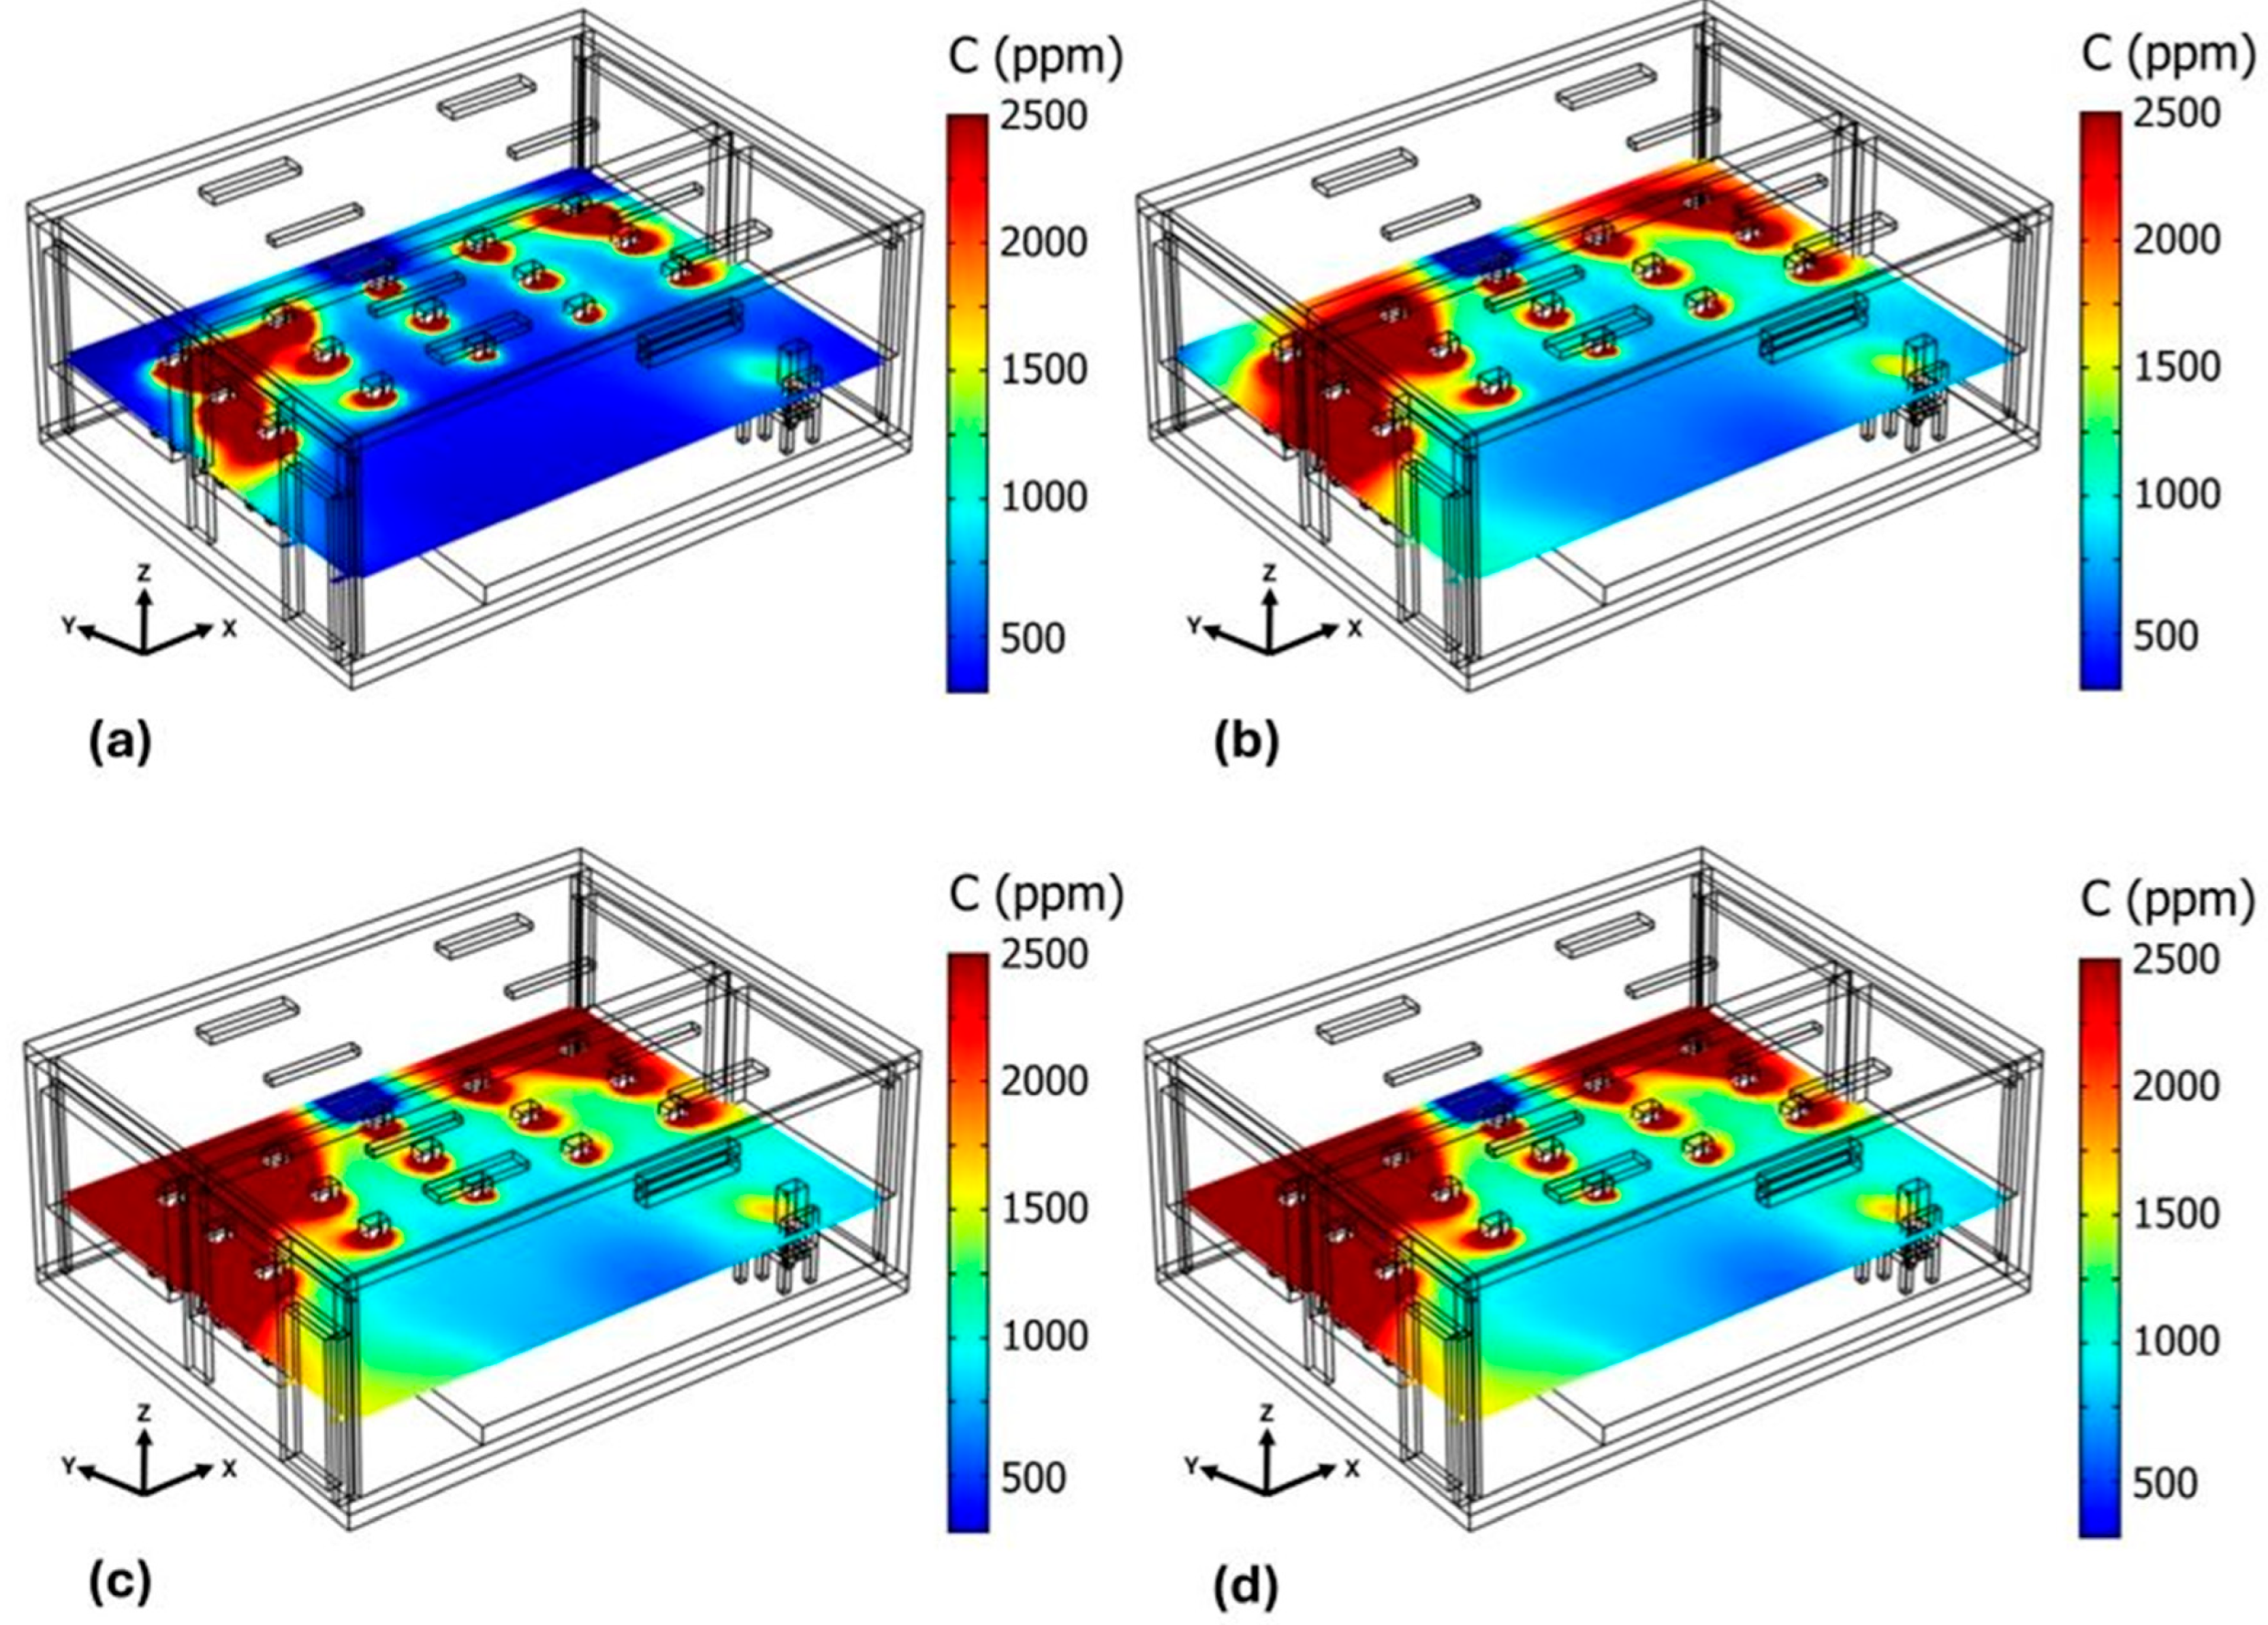
Figure 6 shows the baseline case of the study room, where no CO2 reduction strategy is used. After 5 min (see Figure 6a), the CO2 concentration around the occupants begins to increase due to their exhalation. After 15 min (see Figure 6b), the highest contamination occurs around the occupants and in the east and west areas of the classroom. After 45 min (see Figure 6c), practically all students are in an environment with high levels of CO2 exceeding 2070 ppm; however, since the desk area is close to the air conditioner airflow, the teacher is exposed to a lower CO2 concentration. The classroom’s inadequate ventilation becomes apparent after 60 min (see Figure 6d), as areas such as the southeast corner, the south wall, and the southwest corner have CO2 concentrations exceeding 2090 ppm.
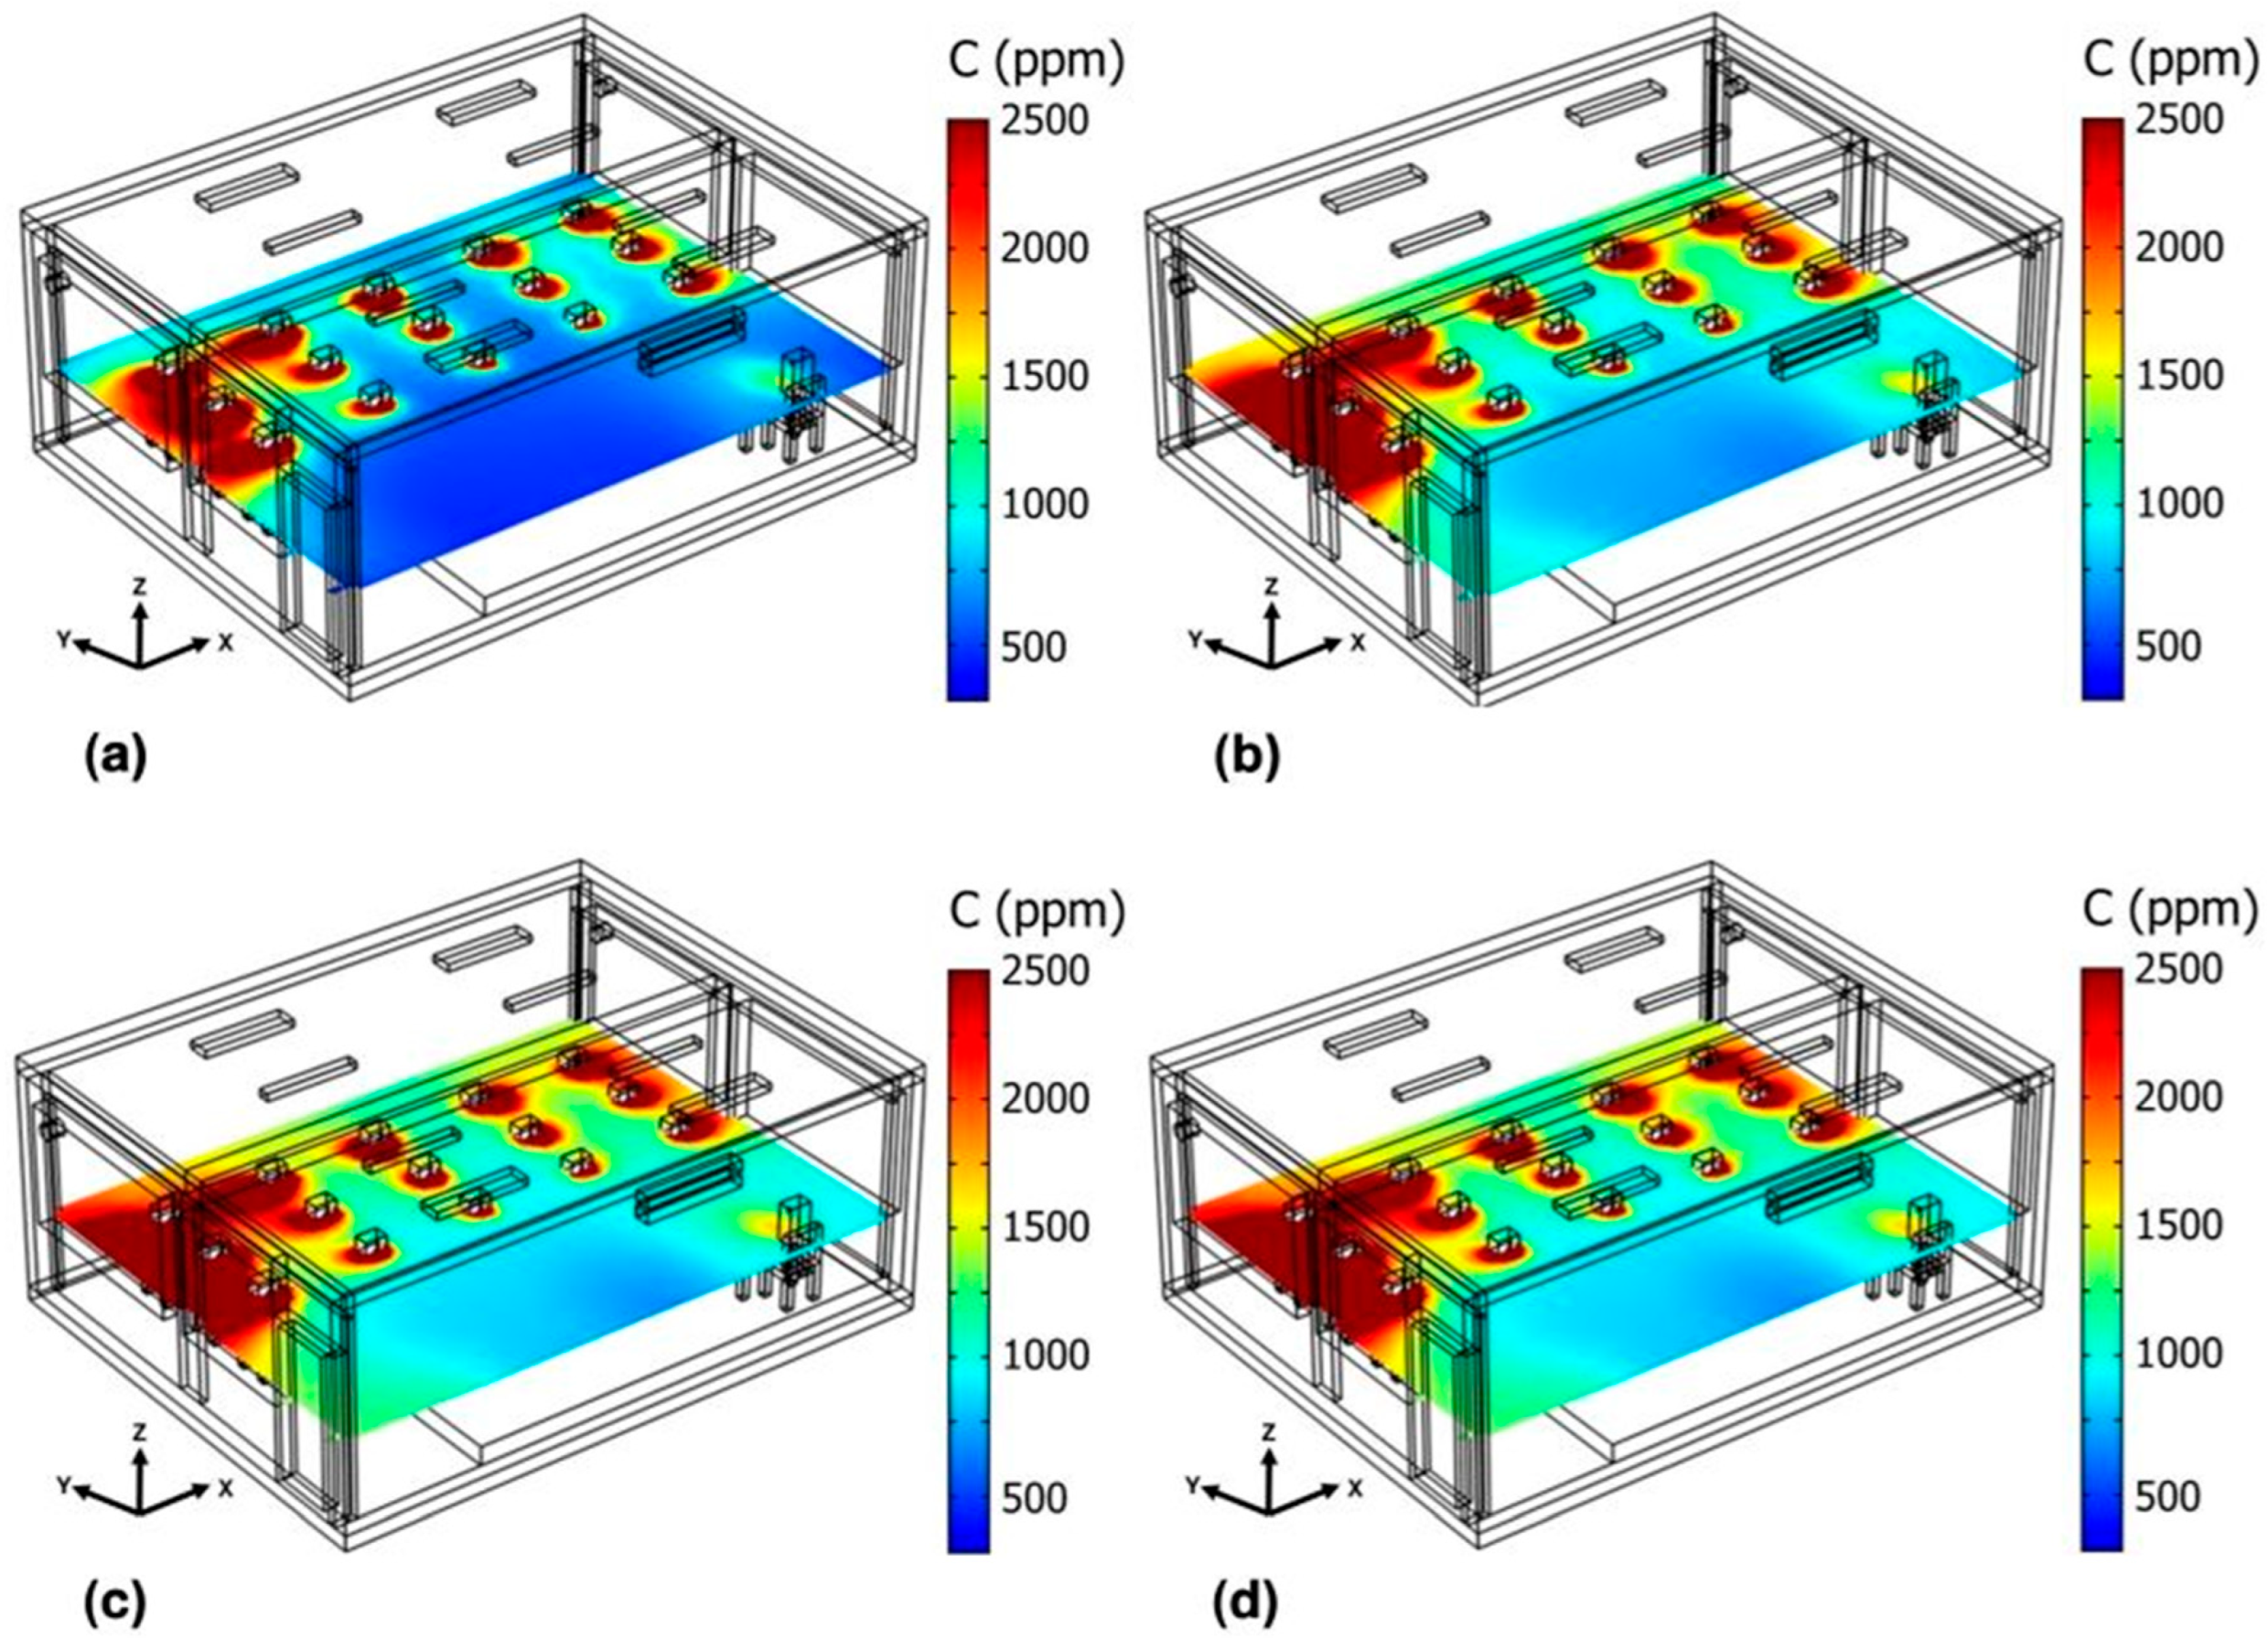
Figure 7 illustrates the behavior of CO2 concentration when implementing an extractor, with a flow rate of 13.92 m3/min, in the southeast corner of the classroom (Case 1A). After 60 min (see Figure 7d), an average concentration of 1541 ppm is reached, and the southeast and southwest corners concentrate the highest CO2 levels. The high concentrations occur in the southeast corner because the flow of cold air from the air conditioner continuously carries the air with the occupants’ exhalations toward the extractor (see Figure 3b). On the other hand, the high levels of CO2 in the southwest corner occur due to the lack of airflow reaching that area (see Figure 3b), causing the stagnation of air and the occupants’ continuous exhalations.
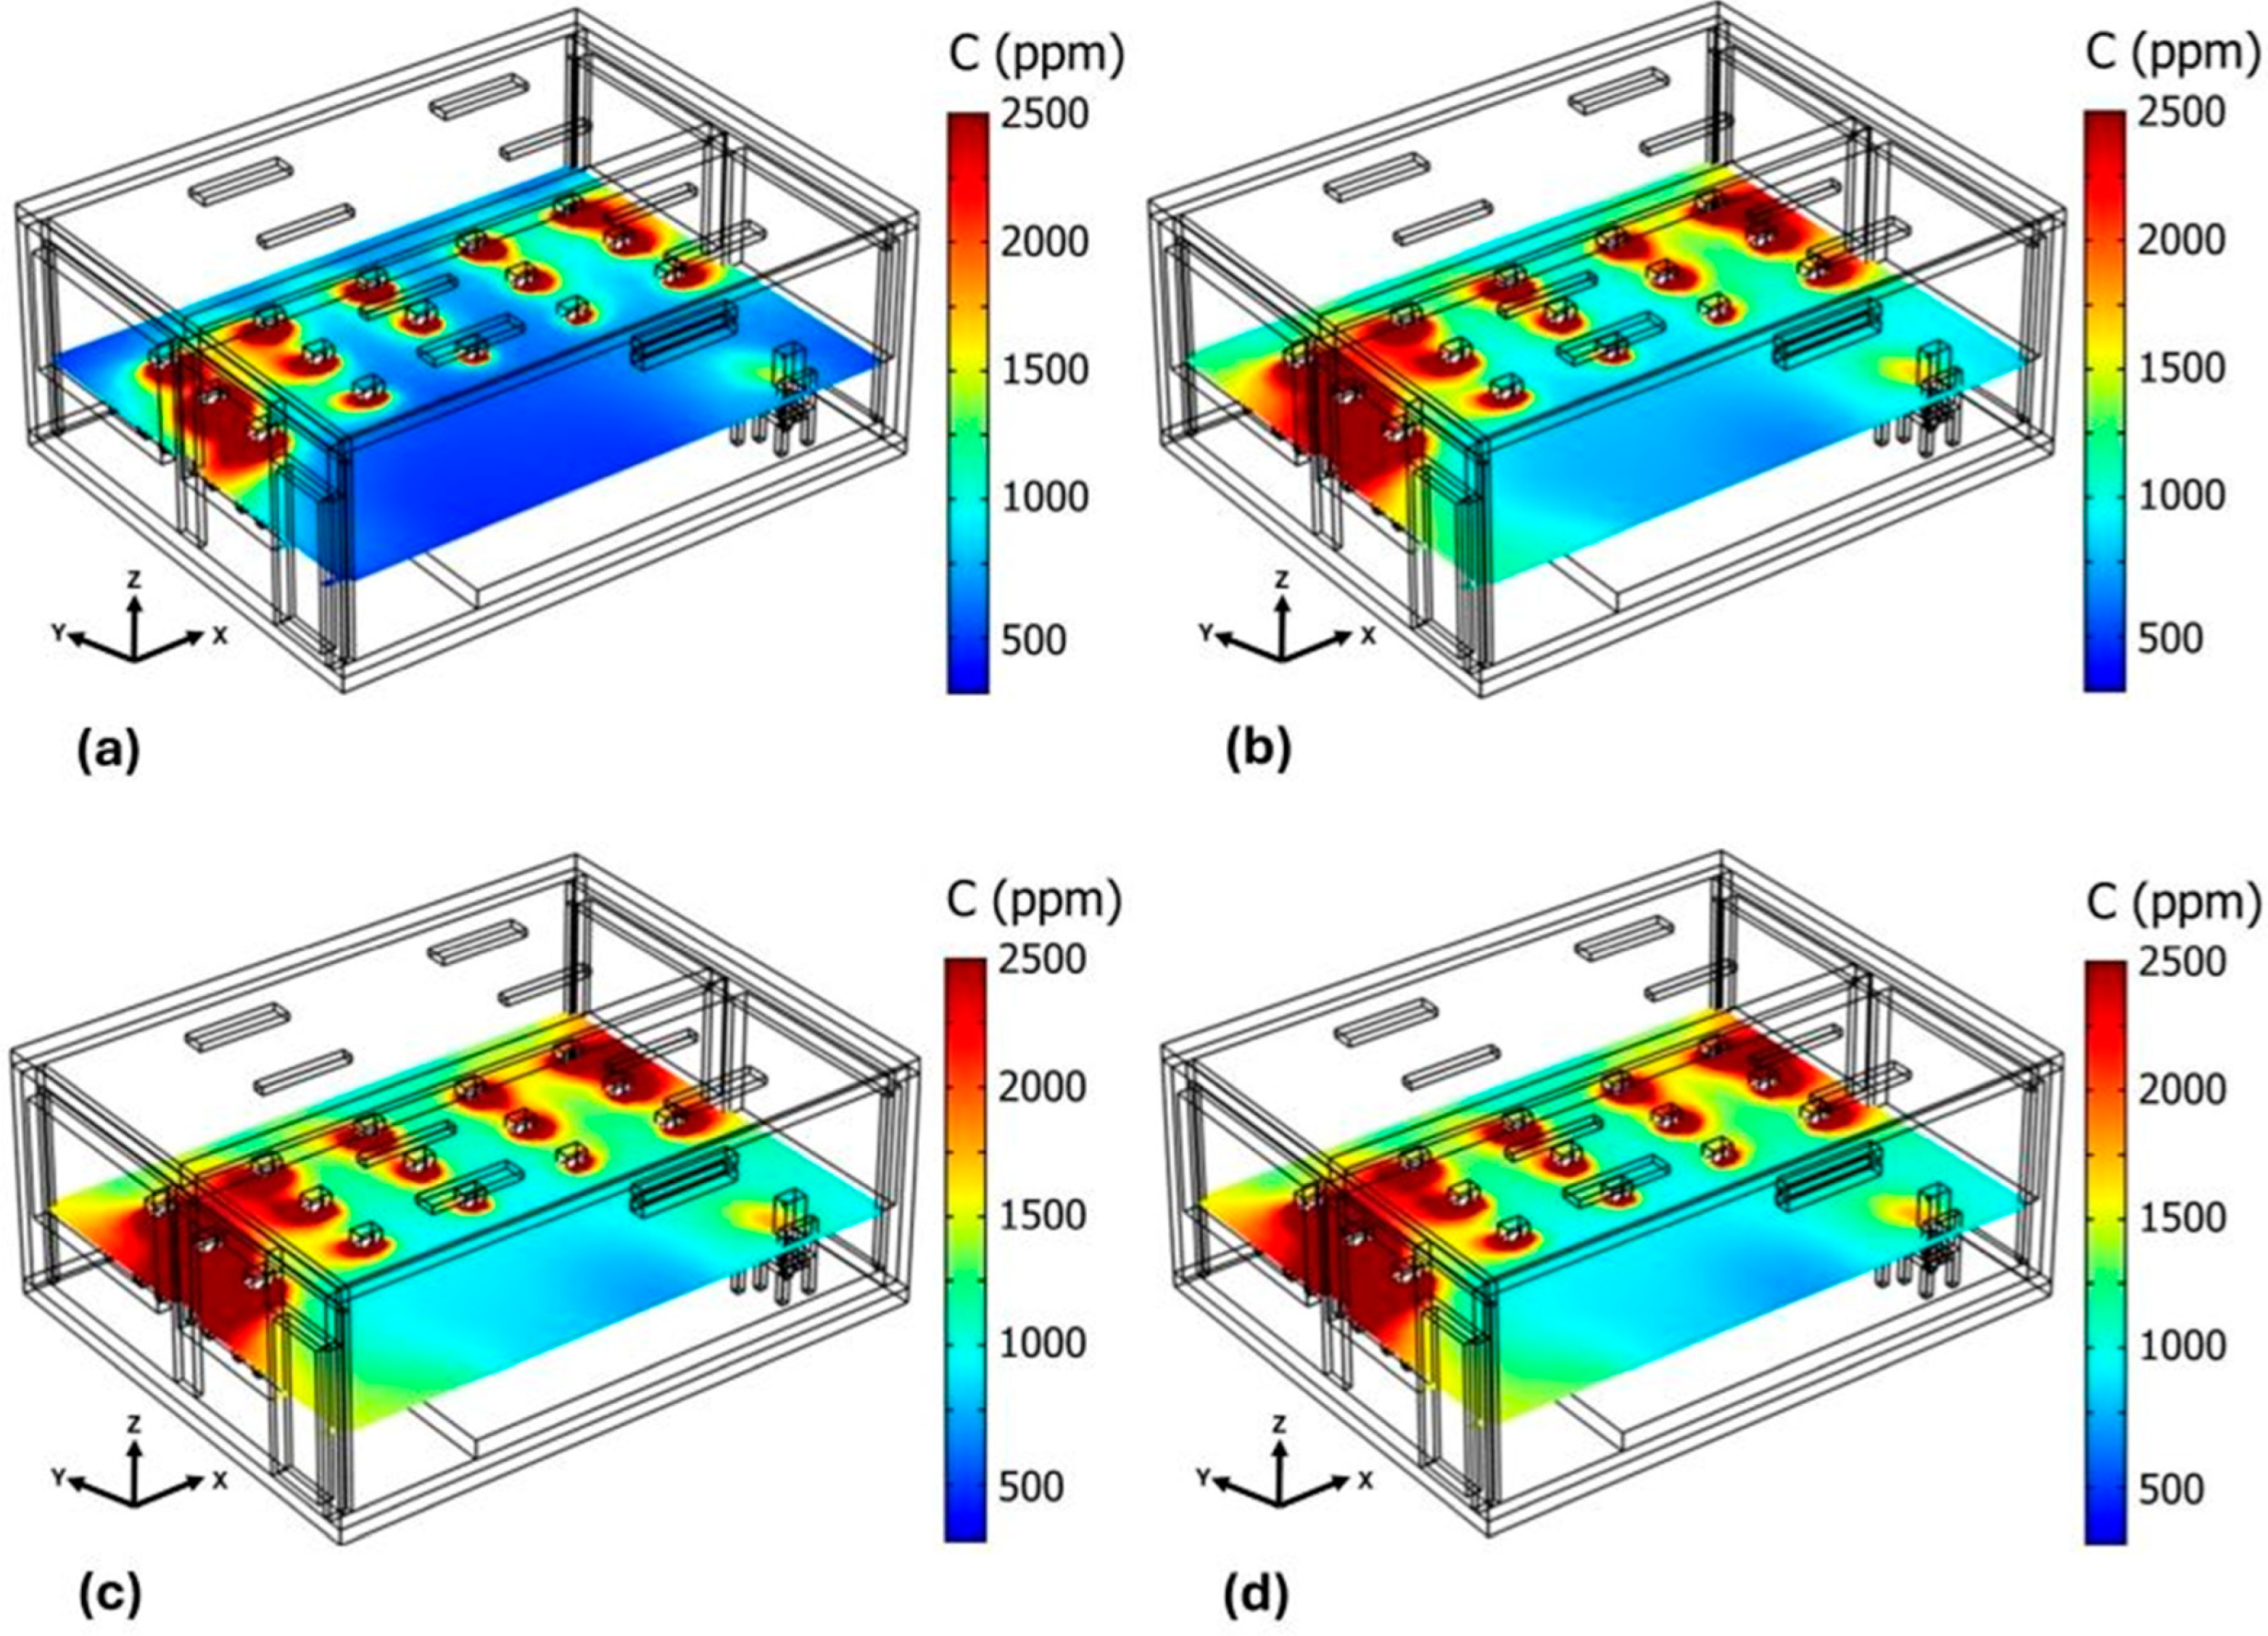
Figure 8 shows the behavior of CO2 concentration when implementing two extractors with a flow rate of 13.92 m3/min, one installed in the southeast corner of the classroom and the other in the southwest corner (Case 1B). Regarding the contaminant levels, the average concentration in the classroom after 60 min is 1370 ppm with two extractors. It is important to emphasize that the southwest corner is cleaner with two extractors (see Figure 8d) than when only one extractor is used (see Figure 7d). This is because the extractor in the southwest corner is closer to the cold air outlet of the air conditioner than the extractor in the southeast corner. Therefore, mass transport is more efficient, pushing the contaminated air and directing it to the southwest extractor in a shorter time so the high-CO2 air does not stagnate.
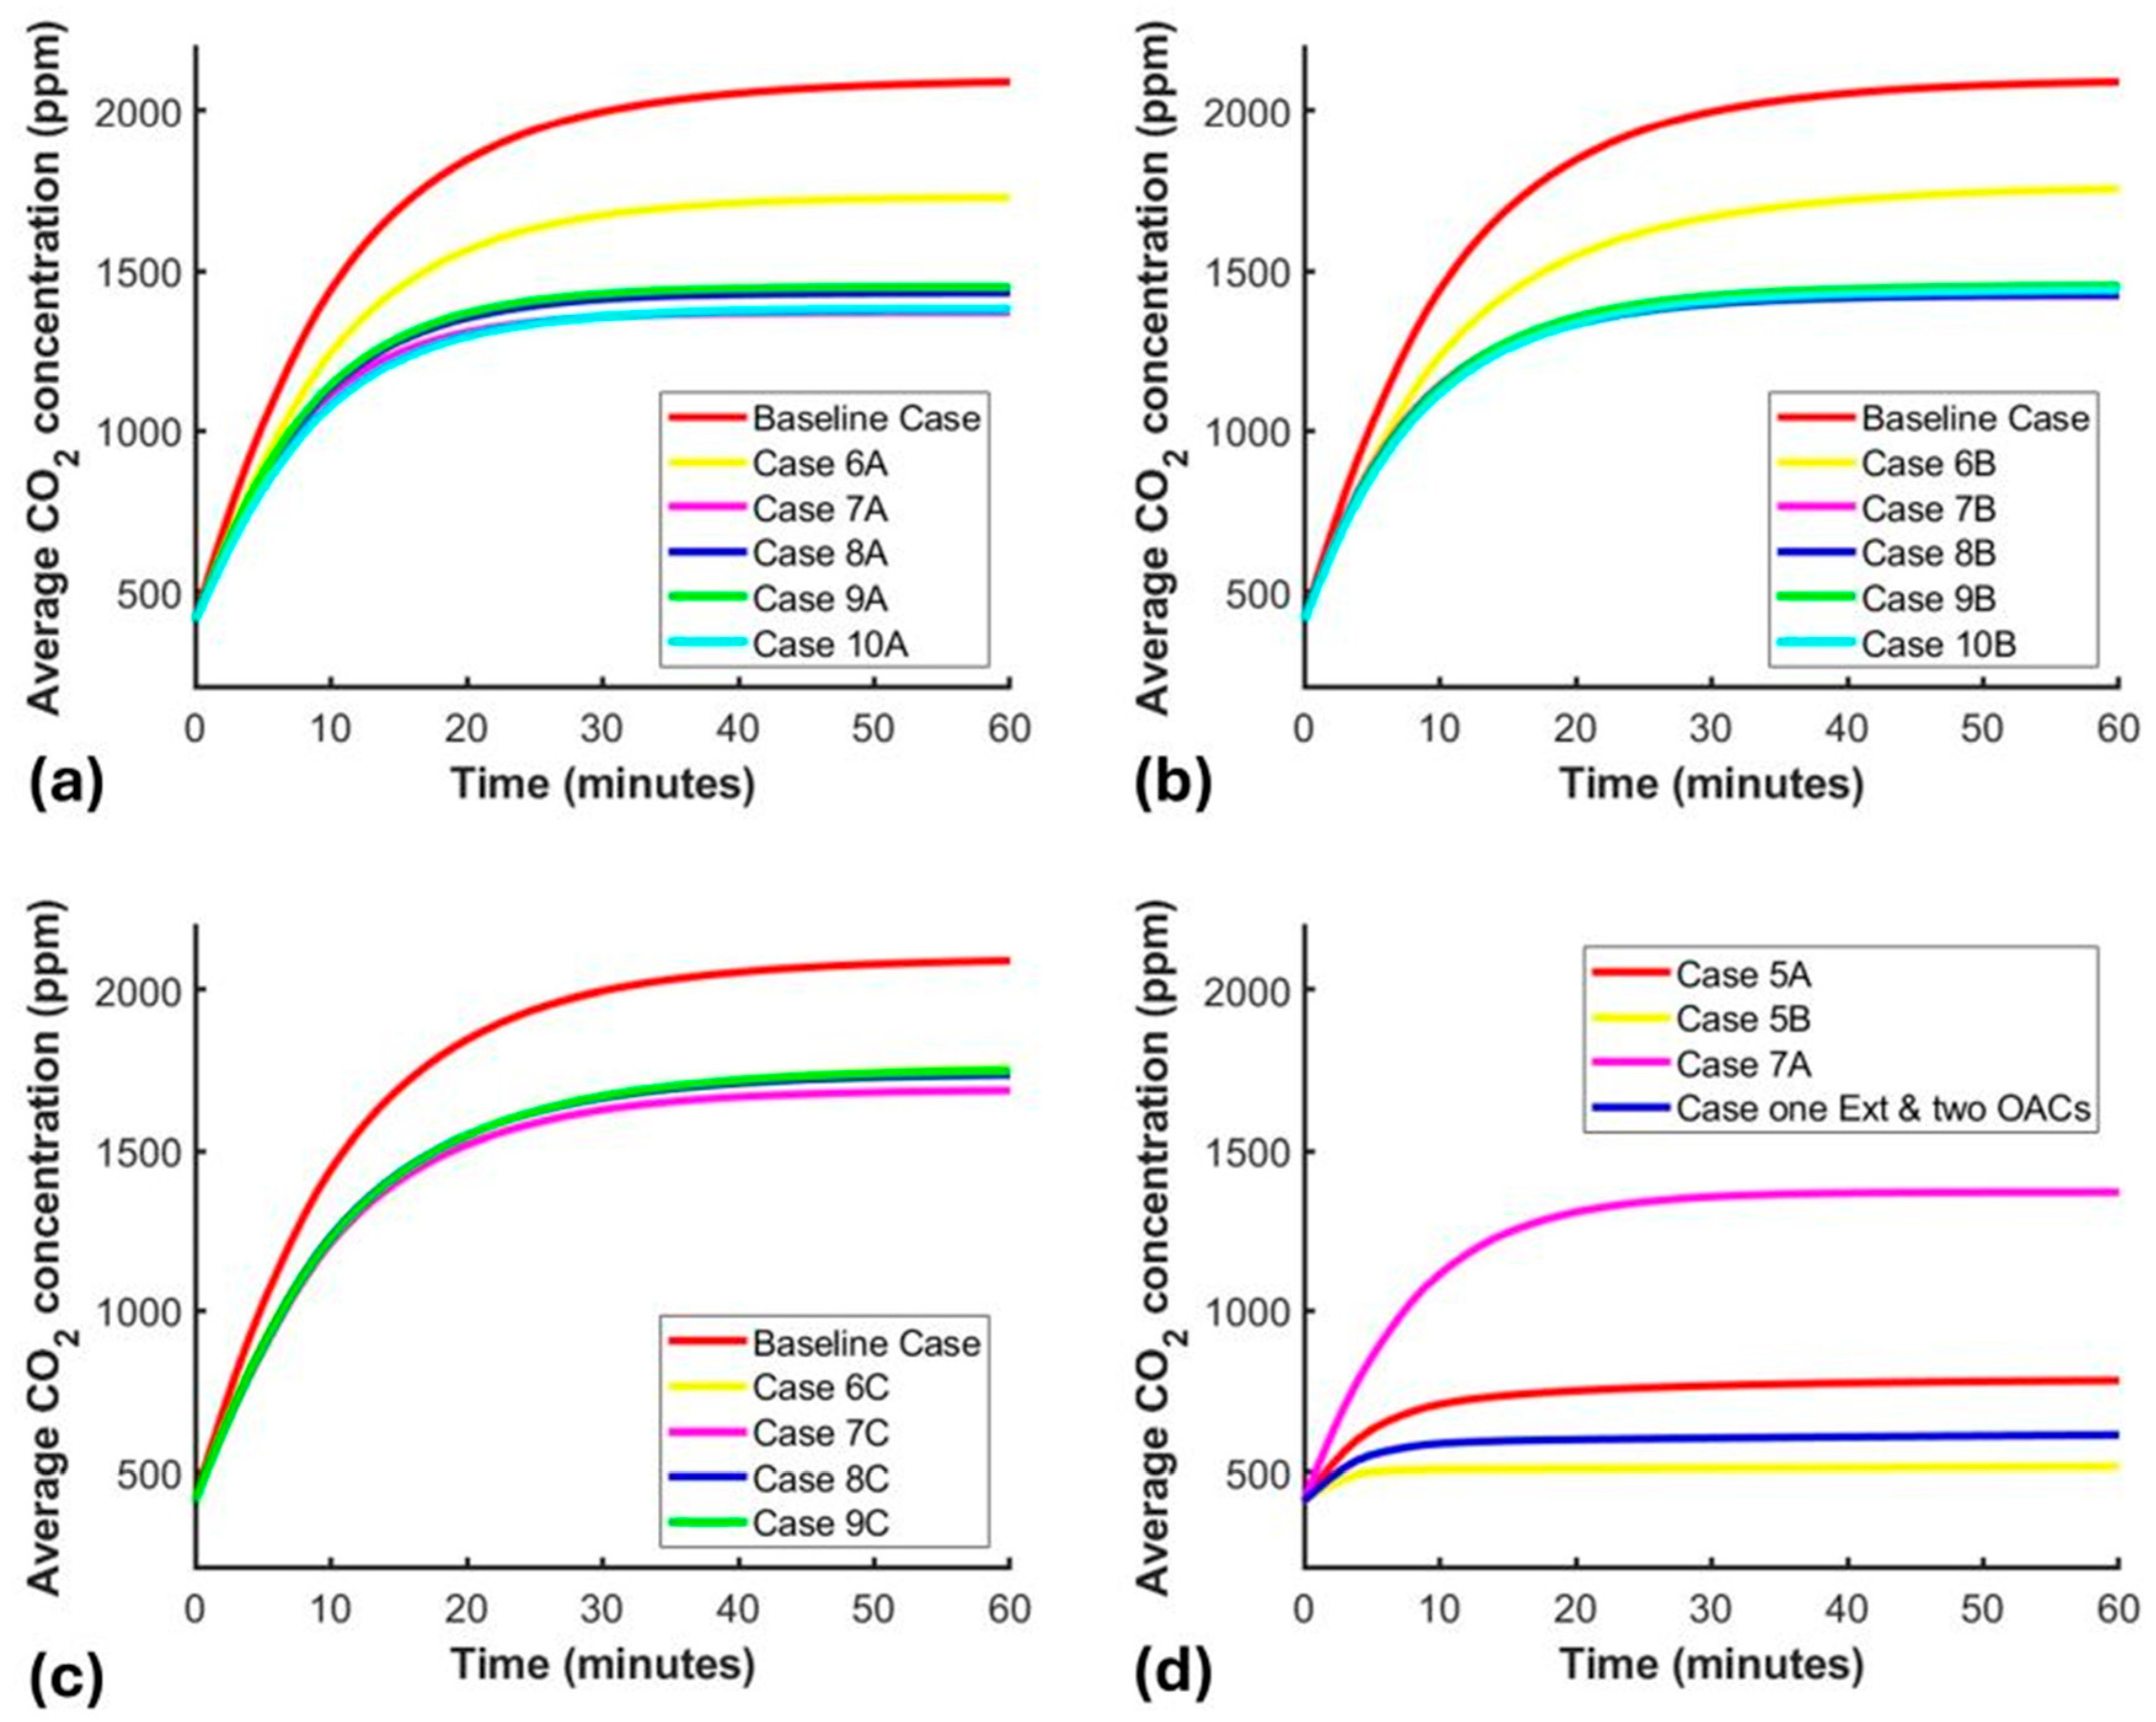
Figure 9a shows the average CO2 concentration inside the classroom as a function of time evaluating the five cases with an extractor shown in Table 1. The worst case, with the highest CO2 concentration, is the baseline case since there is no ventilation strategy in the classroom; in this scenario, the concentration is 2090 ppm after 60 min. In Case 1A, which uses an extractor with a flow of 13.92 m3/min, the average CO2 concentration inside the classroom is 1541.89 ppm after 60 min. In Case 2A, which uses an extractor with 16.24 m3/min, the CO2 concentration is reduced to 1130 ppm. From Case 3A to Case 5A, CO2 levels are below 1000 ppm. The best Case is 5A, which reduces the average CO2 level inside the classroom to 782.5 ppm.
Figure 9b presents the evolution of average CO2 concentration, comparing the five cases with two extractors. The worst scenario is the baseline case; after 60 min, the average concentration reaches 2090 ppm. In Case 1B, in which two extractors with a flow of 13.92 m3/min are used, the average CO2 concentration inside the classroom is 1370 after 60 min. In Cases 2B to 5B, CO2 levels are reduced below 1000 ppm; Case 5B is the best, with an average indoor CO2 level as low as 516 ppm.
As shown in Figure 9a,b, the cases that achieve the most significant reduction in CO2 levels are Case 5A (782.5 ppm) and Case 5B (516 ppm). Both cases use extractors with a flow rate of 23.20 m3/min. However, Case 5A with one extractor does not achieve a CO2 level reduction to allowable levels.

3.4. Reduction of Carbon Dioxide Levels by Implementing OACs in the Classroom

The cases presented in Table 2 are simulated to evaluate various alternatives for reducing CO2 levels in the classroom. The OACs are located at the farthest part of the air conditioner flow, specifically at the back of the classroom, between the last row of students and the wall. Three position configurations are analyzed: from Case 6A to Case 10A, the OACs are located at ground level; from Case 6B to Case 10B, they are placed at a 2 m height; finally, from Case 6C to Case 9C, they are centered at the back of the classroom, stacked in a column as in the study by [27].
Figure 10 shows the behavior of CO2 concentration when using five OACs at ground level (Case 10A). The concentration of CO2 starts to increase after 5 min due to the occupants’ exhalation (see Figure 10a). After 15 min (see Figure 10b), the CO2 levels increase, concentrating mainly around the occupants closest to the east and west walls of the classroom. Subsequently, after 45 min (see Figure 10c), the CO2 concentration in the classroom increases to 1378 ppm. On the other hand, after 60 min (see Figure 10d), the average concentration is 1380 ppm. When the OACs are located at a height of 2 m (Case 10B), the CO2 levels increase. After 45 min, the average CO2 concentration is 1432 ppm, whereas after 60 min, the concentration reaches 1439 ppm.
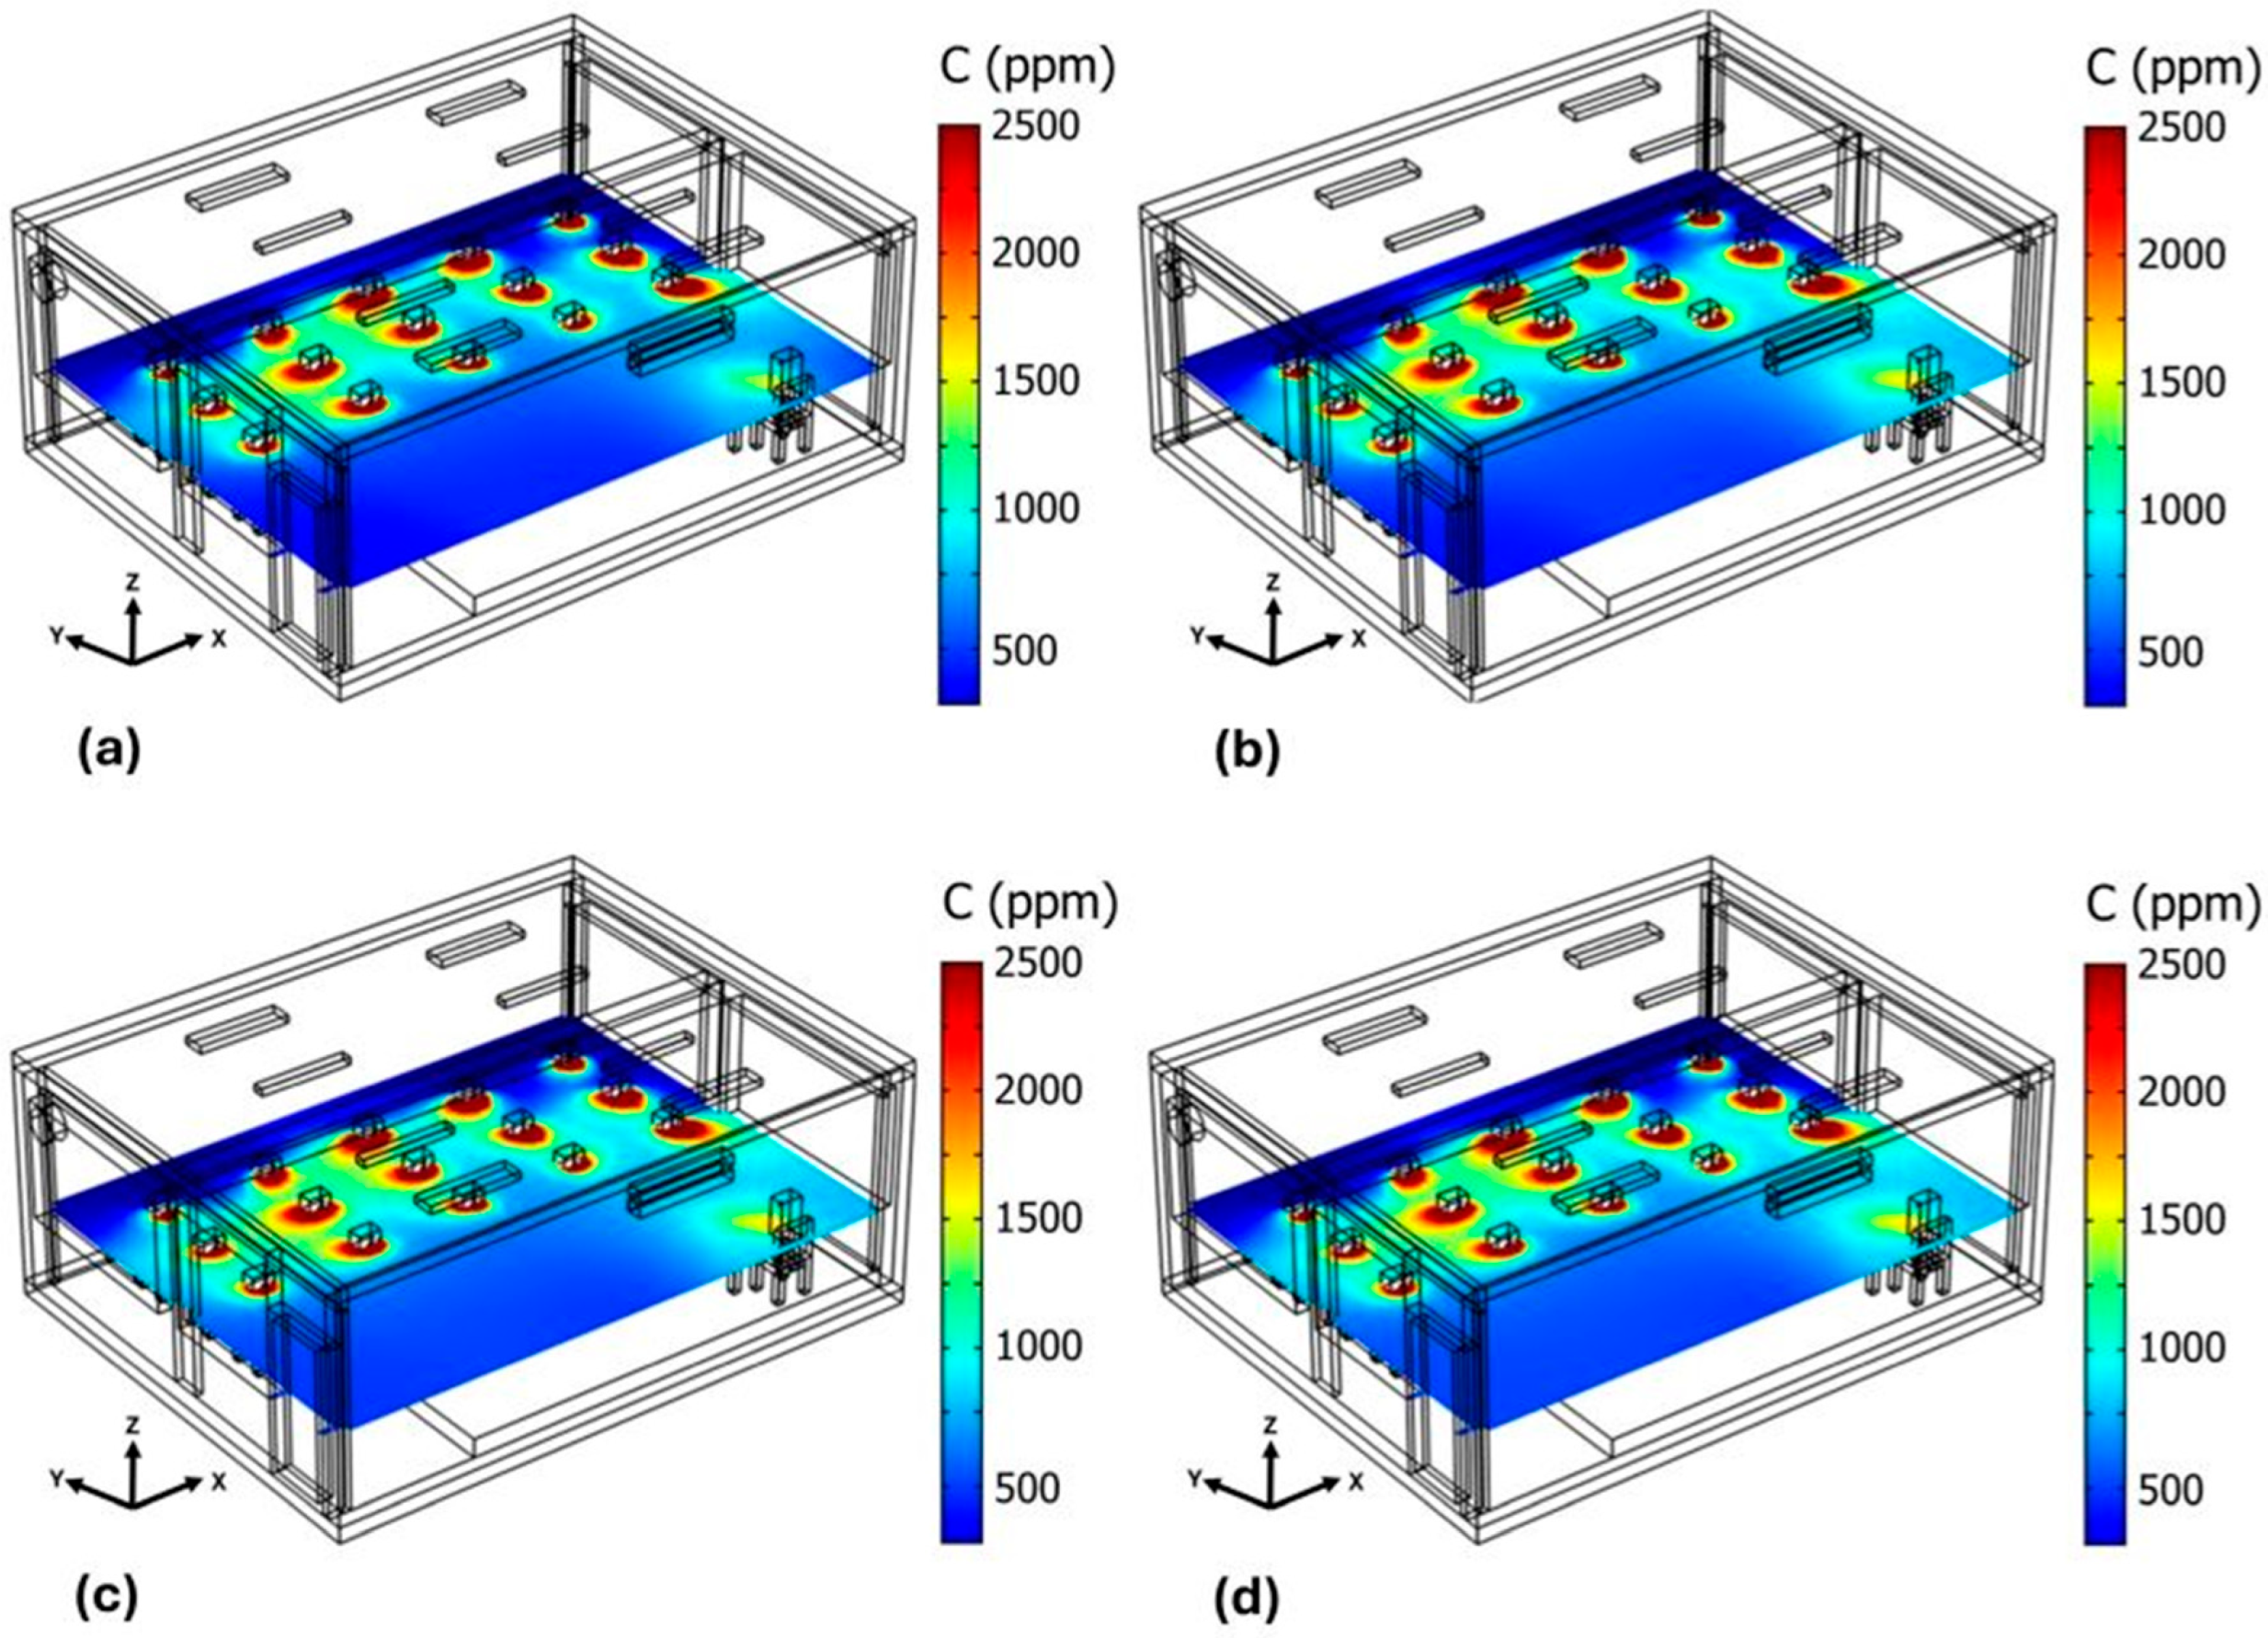
Figure 11 shows the behavior of CO2 concentration when four OACs are stacked at the back and center of the classroom (Case 9C). As time passes, the CO2 concentration increases. After 45 min (see Figure 11c), the average CO2 concentration in the classroom is 1731 ppm. After 60 min (see Figure 11d), the average concentration is 1747 ppm; by this time, high-CO2 level areas appear, predominantly in the southeast corner, the southwest corner, and the entire south wall of the classroom, except where the OACs are stacked.

3.5. Hybrid Proposal for CO2 Concentration Reduction

Implementing strategies such as using extractors reduces CO2 levels to permissible levels inside the classroom, specifically with the use of two extractors with a flow of 23.20 m3/min (Case 5B). However, this study aims to improve indoor air quality and maintain thermal comfort without increasing the classroom’s energy consumption and using two extractors with the aforementioned characteristics would require additional energy. Therefore, one extractor and two organic air cleaners with the configurations that most effectively reduce contaminant concentration are proposed. These configurations correspond to the extractor with a flow of 23.20 m3/min and to two OACs at ground level.
Figure 12 shows the average CO2 level behavior over time when implementing a single extractor and two organic air cleaners. After 5 min (see Figure 12a), the CO2 concentration starts to rise, specifically around the periphery of the occupants, due to their breathing. After 15 min (see Figure 12b), the CO2 levels remain stable, concentrating mainly around the occupants. After 45 min (see Figure 12c), the contaminant level in the classroom reaches 609 ppm. Subsequently, after 60 min (see Figure 12d), the average concentration inside the classroom is 613 ppm.
Figure 13a shows the average concentration of CO2 as a function of time inside the classroom when evaluating the five cases with OACs at ground level. In Case 6A, which uses one OAC, an average CO2 concentration of 1728 ppm is reached inside the classroom after 60 min. In Case 7A, two OACs are used, reducing the CO2 concentration to 1371 ppm. This is the best configuration because it results in a 719 ppm reduction compared to the baseline case (2090 ppm). From Case 8A to Case 10A, the CO2 concentration ranges between 1380 ppm and 1449 ppm. In Cases 6A to 10A, the average concentration of CO2 inside the classroom tends to rise rapidly during the first 30 min, and over the following 30 min, CO2 levels increase but remain almost constant.
Figure 13b shows the behavior of average CO2 concentration inside the classroom over time when evaluating the five cases with OACs placed at a 2 m height. In Case 6B, where one OAC is suspended at a height of 2 m, an average CO2 concentration of 1755 ppm is reached after 60 min. In Case 7B, where two OACs are placed 2 m above the ground, the CO2 concentration is reduced to 1423 ppm, achieving the greatest reduction among the cases with OACs suspended at a 2 m height. This represents a reduction of 667 ppm compared to the baseline case, which reaches 2090 ppm in 60 min. From Case 8B to Case 10B, the average CO2 concentration inside the classroom ranges between 1425 ppm and 1439 ppm. In Cases 7B to 10B, the average CO2 concentration is reduced to values below 1500 ppm.
Figure 13c shows the evolution of the average CO2 concentration as a function of time inside the classroom when evaluating the four cases using stacked OACs. In Case 6C, where one OAC is located at the center rear, an average CO2 concentration of 1755 ppm is reached after 60 min. In Case 7C, where two stacked OACs are implemented, the CO2 concentration is reduced to 1687 ppm; this configuration achieves the greatest reduction among the stacked OACs cases. Compared to the baseline case (2090 ppm), the reduction is 403 ppm. After 60 min, Cases 8C and 9C reach an average indoor CO2 concentration of 1736 ppm and 1747 ppm, respectively. Behavior is similar in Cases 6C, 8C, and 9C since none achieves concentrations below 1700 ppm.
It is important to note that even when the number of OACs placed at ground level or at a 2 m height is increased by as many as five OACs or when four OACs are stacked, the CO2 levels remain too high. On the other hand, the cases that allow the most significant reduction in CO2 levels are those with two OACs installed, regardless of their arrangement. That is, the best cases were 7A, 7B, and 7C. Of these three cases, the one with the greatest reduction (1371 ppm) is Case 7A, which uses two OACs at ground level.
Results indicate that using only OACs fails to achieve adequate air quality. On the other hand, air quality improves as a greater number of extractors are used, but the energy consumption required is also greater, as noted in [55,56,57]. Therefore, two different strategies (a single extractor and two OACs) for reducing the contaminant levels to permissible values (613 ppm) within the classroom are proposed (see Figure 13d).

3.6. CO2 Removal Effectiveness

To evaluate the impact of the different strategies implemented in the classroom, contaminant removal effectiveness (Ec) is used as an air quality indicator. This parameter quantifies how the contaminant is distributed inside the analyzed classroom and is calculated by Equation (20).
E c = C o u t C i n C A C i n
where Cout is the concentration at the output, Cin is the concentration at the intake and CA is the average concentration [41].
Figure 14 presents contaminant removal effectiveness as a function of time for the cases that achieve greater contaminant reduction. For the case with one extractor (Case 5A) and two extractors (Case 5B), a removal effectiveness peak occurs after 5 min because the classroom still has low CO2 levels, as seen in Figure 9a,b. The same occurs in the proposed case with one extractor and two OACs. Afterward, Ec decreases for 30 min and then remains over for the last 30 min; whereas for Case 7A, where only OACs are used, Ec increases slowly for 25 min, and then the value remains constant.
When using two extractors, contaminant removal effectiveness is better than when only one extractor is used. Contaminant removal effectiveness with a single extractor is 0.86, whereas when using two extractors, the value increases to 1.72. It is important to note that the proposed configuration of one extractor and two OACs has an effectiveness of 1.2. Although this value is lower than the effectiveness with two extractors, the proposal has the advantage that it only consumes energy from a single extractor because the OACs are passive cleaners.

4. Discussion

The study of airflow distribution, temperature, and CO2 concentration levels inside a classroom plays a crucial role in ensuring the success of students’ academic activities. This is even more relevant if the classroom is located in an area with hot weather all year round, and therefore, the space needs to remain closed all day with the air conditioner on.
The baseline case studied lacks a ventilation strategy, and the average temperature inside the classroom has minimal variations. The aforementioned behavior is due to the air conditioner acting directly on the temperature, adjusting it to the value previously set in the climate control system. However, air conditioning does not affect CO2 levels, which increase significantly inside the classroom, exceeding allowable levels. In this study, different extractors with different operating flows are implemented. In the first stage, five scenarios are configured with one extractor in the room’s southeast corner, creating stagnant air zones in the opposite corner. This directly affects CO2 dispersion and locally increases the contaminant’s levels. In the second stage, five cases are configured with two extractors, one in the southeast corner and another in the southwest corner. In this stage, several primary streams form and move around the classroom, promoting cold air displacement and ventilation and considerably reducing CO2 levels. In both stages, the extractor that achieves the most significant CO2 reduction operates at the highest extraction flow rate, which is consistent with what is reported in [55]. Airflow dynamics inside the classroom vary depending on the number of extractors and their interaction with the walls. Increasing the number of extractors increases the primary airflows that facilitate the displacement of contaminated air.
Implementing extractors results in higher energy consumption and can increase noise levels [55,56,57] or affect the air conditioner’s performance inside the room. Therefore, organic air cleaners [27] are used as an alternative to improve air quality. The effect of the number of installed OACs is evaluated, as well as three different locations: at ground level, at a 2 m height, and stacked, as proposed in [27]. When implementing OACs, CO2 concentration levels decreased due to their absorption effect of the OACs. It is important to point out that the cases with the greatest reduction in contaminants occurred when two OACs are installed because the airflow is not obstructed compared to cases where three to five OACs are installed. With two OACs, the airflow between each OAC is more uniform, increasing air contact on the plants’ leaves. This favors the stimulation of the plants and makes them more effective in absorbing CO2, which is consistent with [27]. Placing the OACs at the ground level achieved the most significant CO2 reduction, as there is better space for air distribution due to the absence of obstructions that hinder the air streams from the air conditioner. This allows for a higher airflow velocity and more contact with the plant, which can be compared with the results of [27].
Once the behavior of different extractors and OACs is analyzed, a ventilation strategy that requires the lowest possible energy consumption is proposed. The hybrid proposal was determined by combining the most effective individual strategies identified in the simulations. Although the use of two extractors achieved the highest CO2 reduction, the configuration selected combined the single extractor that demonstrated the greatest individual performance with the organic air cleaner (OAC) setup that yielded the best results. Therefore, the hybrid configuration aims to balance air quality improvement and energy efficiency, and other combinations were not considered within the scope of this study.
The hybrid configuration of an extractor and two OACs could reduce CO2 levels inside the classroom to permissible levels. By using plants as a CO2 reduction strategy, energy is required only for one extractor. Ventilation effectiveness can be measured through the contaminant removal index. In this study, Ec is calculated for the configurations that resulted in a greater reduction in contaminant levels, namely Cases 5A, 5B, and 7A, as well as the proposed configuration of a single extractor and two OACs. As expected, using two extractors results in the highest contaminant removal efficiency, followed by the proposed strategy of one extractor and two OACs.
This study shows that a completely enclosed classroom with occupants results in a high-CO2 environment over time. The number and location of extractors reduce, to a greater or lesser extent, the levels of pollutants inside a classroom, suggesting the existence of an optimal configuration for improving air quality. On the other hand, the use of OACs also reduces average contaminant levels, and specific configurations further decrease CO2 concentrations. For the above reasons, both strategies are proposed to improve indoor air quality, maintain thermal comfort, use energy efficiently, and foster a healthy environment for the occupants. On the other hand, as mentioned in [47], this analysis is of great importance for preventing infectious diseases in enclosed spaces since the analysis of airflow patterns can be used to assess the risk of airborne diseases such as influenza or COVID-19.
The installation of additional extractors would substantially improve pollutant dispersion. However, increasing the number of extractors to two or more increases electrical energy consumption. Based on our results, future studies should aim to improve CO2 absorption by plants, in such a way that energy consumption associated with the removal of pollutants in enclosed spaces is minimized, are most relevant.
Limitations of this work include the assumption of uniform CO2 generation per person, as well as a constant CO2 uptake rate by OACs. Other limitations are that the study considers only one type of plant and focuses exclusively on CO2, without analyzing other pollutants.

5. Conclusions

This work analyzes air quality behavior and thermal comfort using air extractors and organic air cleaners. The study is conducted in a classroom with the door and windows closed. The space is located in a city with a very hot climate, so air conditioning is necessary for the occupants’ activities. The aim is to help reduce CO2 concentrations and improve air quality while maintaining thermal comfort.
The most relevant findings of this study are
  • Implementing extractors in the classroom increases the primary streams that promote the displacement of contaminated air, reducing average CO2 concentrations and improving indoor air quality.
  • With one and two extractors, the average temperatures achieved fall within the thermal comfort values, ranging between 23 °C and 26 °C.
  • The hybrid ventilation strategy, which uses one extractor with a flow of 23.20 m3/min and two OACs, reduces contaminant levels to 613 ppm and keeps them within permissible levels.
This study demonstrates the possibility of improving indoor air quality and maintaining thermal comfort in classrooms located in hot climates by implementing hybrid ventilation strategies.

Author Contributions

Conceptualization, E.C.-O. and G.E.O.-C.; methodology, E.C.-O. and G.E.O.-C.; validation, A.R.-L. and S.L.O.-C.; formal analysis, E.C.-O., G.E.O.-C. and A.R.-L.; writing—original draft preparation, E.C.-O., G.E.O.-C. and S.L.O.-C.; writing—review and editing, G.E.O.-C., A.R.-L. and S.L.O.-C.; visualization, A.R.-L. and S.L.O.-C. All authors have read and agreed to the published version of the manuscript.

Funding

This research received no external funding.

Institutional Review Board Statement

Not applicable.

Informed Consent Statement

Not applicable.

Data Availability Statement

The original contributions presented in this study are included in the article. Further inquiries can be directed to the corresponding author.

Acknowledgments

The authors gratefully acknowledge the support provided by Tecnológico Nacional de México-Instituto Tecnológico de Veracruz and Tecnológico Nacional de México-Instituto Tecnológico de Tuxtla Gutiérrez. E.C.-O. thanks the scholarship awarded by SECIHTI (CONAHCyT).

Conflicts of Interest

The authors declare no conflicts of interest.

References

  1. Ge, Z.; Xu, G.; Poh, H.J.; Ooi, C.C.; Xing, X. CFD Simulations of thermal comfort for naturally ventilated school buildings. IOP Conf. Ser. Earth Environ. Sci. 2019, 238, 012073. [Google Scholar] [CrossRef]
  2. Ang, A.S.T.; Sia, C.C.V.; Yeu, Y.L.; Chong, K.H.; Chia, C.S.; Joseph, A. Natural ventilation and indoor air quality in domestic school building: CFD simulation and improvement strategies. CFD Lett. 2023, 16, 1–14. [Google Scholar] [CrossRef]
  3. Buratti, C.; Palladino, D.; Moretti, E. Prediction of indoor conditions and thermal comfort using CFD simulations: A case study based on experimental data. Energy Procedia 2017, 126, 115–122. [Google Scholar] [CrossRef]
  4. Kwong, Q.J.; Yang, J.Y.; Ling, O.H.L.; Edwards, R.; Abdullah, J. Thermal comfort prediction of air-conditioned and passively cooled engineering testing centres in a higher educational institution using CFD. Smart Sustain. Built Environ. 2020, 10, 18–36. [Google Scholar] [CrossRef]
  5. Husain, H.; Mohd Samidi, M.Z.; Meon, M.S. CFD analysis of thermal comfort in hospital operation room with different air distribution design and operative temperature. J. Appl. Eng. Des. Simul. 2021, 1, 59–73. [Google Scholar] [CrossRef]
  6. Alkhalaf, M.; Ilinca, A.; Hayyani, M.Y.; Martini, F. Impact of diffuser location on thermal comfort inside a hospital isolation room. Designs 2024, 8, 19. [Google Scholar] [CrossRef]
  7. Sobhi, M.; Khalil, E.E. CFD investigation of air flow patterns and thermal comfort in a room with diverse heating systems. Curr. Environ. Eng. 2019, 6, 150–158. [Google Scholar] [CrossRef]
  8. Noman, F.G.; Kamsah, N.; Mohamed Kamar, H. Improvement of thermal comfort inside a mosque building. J. Teknol. 2016, 78, 9–18. [Google Scholar] [CrossRef]
  9. Muhieldeen, M.W.; Kuang, Y.C. Saving energy costs by combining air-conditioning and aircirculation using CFD to achieve thermal comfort in the building. J. Adv. Res. Fluid Mech. Therm. Sci. 2019, 58, 84–99. [Google Scholar]
  10. Losi, G.; Bonzanini, A.; Aquino, A.; Poesio, P. Analysis of thermal comfort in a football stadium designed for hot and humid climates by CFD. J. Build. Eng. 2021, 33, 101599. [Google Scholar] [CrossRef]
  11. Essah, E.A.; Yao, R.; Short, A. Assessing stack ventilation strategies in the continental climate of Beijing using CFD simulations. Int. J. Vent. 2016, 16, 61–80. [Google Scholar] [CrossRef]
  12. Lim, T.; Kim, D.D. Thermal comfort assessment of the perimeter zones by using CFD simulation. Sustainability 2022, 14, 15647. [Google Scholar] [CrossRef]
  13. Palka Bayard de Volo, E.; Pulvirenti, B.; Jahanbin, A.; Guidorzi, P.; Semprini, G. Numerical analysis on the optimisation of thermal comfort levels in an office located inside a historical building. Appl. Sci. 2023, 13, 2954. [Google Scholar] [CrossRef]
  14. Daithankar, N.; Udawant, K.D.; Karanth, N.V. Prediction of thermal comfort inside a midibus passenger cabin using CFD and its experimental validation. SAE Tech. Pap. 2015, 26, 1–13. [Google Scholar] [CrossRef]
  15. Zhai, Z.J.; Xue, Y.; Chen, Q. Inverse design methods for indoor ventilation systems using CFD-based multi-objective genetic algorithm. Build. Simul. 2014, 7, 661–669. [Google Scholar] [CrossRef]
  16. Back, Y.; Kumar, P.; Bach, P.M.; Rauch, W.; Kleidorfer, M. Integrating CFD-GIS modelling to refine urban heat and thermal comfort assessment. Sci. Total Environ. 2023, 858, 159729. [Google Scholar] [CrossRef]
  17. Izadyar, N.; Miller, W.; Rismanchi, B.; Garcia-Hansen, V.; Matour, S. Balcony design and surrounding constructions effects on natural ventilation performance and thermal comfort using CFD simulation: A case study. J. Build. Perform. Simul. 2023, 16, 537–556. [Google Scholar] [CrossRef]
  18. Semprini, G.; Jahanbin, A.; Pulvirenti, B.; Guidorzi, P. Evaluation of thermal comfort inside an office equipped with a fan coil HVAC system: A CFD approach. Future Cities Environ. 2019, 5, 1–10. [Google Scholar] [CrossRef]
  19. Yau, Y.H.; Rajput, U.A. Thermal comfort assessment and design guidelines of a VRF-integrated stratum ventilation system for a large tropical building. Arab. J. Sci. Eng. 2022, 47, 16149–16170. [Google Scholar] [CrossRef]
  20. Zhang, L.; Mao, Y.; Tu, Q.; Wu, X.; Tan, L. Effects of supply parameters of stratum ventilation on energy utilization efficiency and indoor thermal comfort: A computational approach. Math. Probl. Eng. 2021, 2021, 6615148. [Google Scholar] [CrossRef]
  21. Yau, Y.H.; Chuah, K.H.; Siew, M.T. The study on thermal environment and airflow pattern in an UFAD system under a cooling mode. Arab. J. Sci. Eng. 2019, 45, 891–908. [Google Scholar] [CrossRef]
  22. Heidarinejad, G.; Shokrollahi, S.; Pasdarshahri, H. An investigation of thermal comfort, IAQ, and energy saving in UFAD systems using a combination of Taguchi optimization algorithm and CFD. Adv. Build. Energy Res. 2020, 15, 799–817. [Google Scholar] [CrossRef]
  23. Putra, J.C.P. A study of thermal comfort and occupant satisfaction in office room. Procedia Eng. 2017, 170, 240–247. [Google Scholar] [CrossRef]
  24. Yang, L.; Ye, M.; He, B.-J. CFD simulation research on residential indoor air quality. Sci. Total Environ. 2014, 472, 1137–1144. [Google Scholar] [CrossRef]
  25. Stevanovic, Z.; Ilic, G.; Vukic, M.; Zivkovic, P.; Blagojevic, B.; Banjac, M. CFD simulations of thermal comfort in naturally ventilated primary school classrooms. Therm. Sci. 2016, 20, 287–296. [Google Scholar] [CrossRef]
  26. Angeles-Rodríguez, L.; Celis, C. Numerical study and optimization of air-conditioning systems grilles used in indoor environments. Int. J. Energy Environ. Eng. 2021, 12, 787–804. [Google Scholar] [CrossRef]
  27. Istiadji, A.D.; Satwiko, P.; Suhodo, Y.P.; Sekarlangit, N.; Prasetya, A.; Silvia, I. The development of an organic air cleaner (OAC) to reduce CO2 level of air-conditioned rooms without fresh air supply. Int. J. Vent. 2020, 21, 195–212. [Google Scholar] [CrossRef]
  28. Jahanbin, A.; Semprini, G. Numerical study on indoor environmental quality in a room equipped with a combined HRV and radiator system. Sustainability 2020, 12, 10576. [Google Scholar] [CrossRef]
  29. Jahanbin, A. Efficacy of coupling heat recovery ventilation and fan coil systems in improving the indoor air quality and thermal comfort condition. Energy Built Environ. 2022, 3, 478–495. [Google Scholar] [CrossRef]
  30. Chen, Z.; Xin, J.; Liu, P. Air quality and thermal comfort analysis of kitchen environment with CFD simulation and experimental calibration. Build. Environ. 2020, 172, 106691. [Google Scholar] [CrossRef]
  31. Liu, S.; Cao, Q.; Zhao, X.; Lu, Z.; Deng, Z.; Dong, J.; Lin, X.; Qing, K.; Zhang, W.; Chen, Q. Improving indoor air quality and thermal comfort in residential kitchens with a new ventilation system. Build. Environ. 2020, 180, 107016. [Google Scholar] [CrossRef]
  32. Conceição, E.; Santiago, C.; Lúcio, M.; Awbi, H. Predicting the air quality, thermal comfort and draught risk for a virtual classroom with desk-type personalized ventilation systems. Buildings 2018, 8, 35. [Google Scholar] [CrossRef]
  33. Zhao, W.; Mustakallio, P.; Lestinen, S.; Kilpeläinen, S.; Jokisalo, J.; Kosonen, R. Numerical and experimental study on the indoor climate in a classroom with mixing and displacement air distribution methods. Buildings 2022, 12, 1314. [Google Scholar] [CrossRef]
  34. Al-Rawi, M.; Lazonby, A.; Wai, A.A. Assessing indoor environmental quality in a crowded low-quality built environment: A case study. Atmosphere 2022, 13, 1703. [Google Scholar] [CrossRef]
  35. Duan, Z.; Sun, Y.; Wang, M.; Hu, R.; Dong, X. Evaluation of mixed-mode ventilation thermal performance and energy saving potential from retrofitting a Beijing office building. Buildings 2022, 12, 793. [Google Scholar] [CrossRef]
  36. Staveckis, A.; Borodinecs, A. Impact of impinging jet ventilation on thermal comfort and indoor air quality in office buildings. Energy Build. 2021, 235, 110738. [Google Scholar] [CrossRef]
  37. Aryal, P.; Leephakpreeda, T. Effects of partition on thermal comfort, indoor air quality, energy consumption, and perception in air-conditioned buildings. J. Sol. Energy Eng. 2016, 138, 051005. [Google Scholar] [CrossRef]
  38. Aryal, P.; Leephakpreeda, T. CFD analysis on thermal comfort and indoor air quality affected by partitions in air-conditioned building. Appl. Mech. Mater. 2016, 836, 121–126. [Google Scholar] [CrossRef]
  39. Amini, R.; Ghaffarianhoseini, A.; Ghaffarianhoseini, A.; Berardi, U. Numerical investigation of indoor thermal comfort and air quality for a multi-purpose hall with various shading and glazing ratios. Therm. Sci. Eng. Prog. 2021, 22, 100812. [Google Scholar] [CrossRef]
  40. Pamonpol, K.; Areerob, T.; Prueksakorn, K. Indoor air quality improvement by simple ventilated practice and Sansevieria trifasciata. Atmosphere 2020, 11, 271. [Google Scholar] [CrossRef]
  41. Cao, S.-J.; Deng, H.-Y. Investigation of temperature regulation effects on indoor thermal comfort, air quality, and energy savings toward green residential buildings. Sci. Technol. Built Environ. 2019, 25, 309–321. [Google Scholar] [CrossRef]
  42. Li, K.; Xue, W.; Liu, G. Exploring the environment/energy Pareto optimal front of an office room using computational fluid dynamics-based interactive optimization method. Energies 2017, 10, 231. [Google Scholar] [CrossRef]
  43. El-Fil, B.; Ghaddar, N.; Ghali, K. Optimizing performance of ceiling-mounted personalized ventilation system assisted by chair fans: Assessment of thermal comfort and indoor air quality. Sci. Technol. Built Environ. 2016, 22, 412–430. [Google Scholar] [CrossRef]
  44. Mahdi, A.A.; Abbas, S. Investigating indoor air quality and thermal comfort using different ventilation systems under Iraqi climate. Iraqi J. Mech. Mater. Eng. 2018, 18, 422–435. [Google Scholar] [CrossRef]
  45. Ye, Y.; Aizezi, N.; Feng, J.; Han, B.; Li, X.; Su, Z.; Li, L.; Liu, Y. Advanced characterization of industrial smoke: Particle composition and size analysis with single particle aerosol mass spectrometry and optimized machine learning. Anal. Chem. 2025, 97, 5554–5562. [Google Scholar] [CrossRef] [PubMed]
  46. Alkhalaf, M.; Ilinca, A.; Hayyani, M.Y. CFD investigation of ventilation strategies to remove contaminants from a hospital room. Designs 2023, 7, 5. [Google Scholar] [CrossRef]
  47. Zhao, W.; Ejaz, M.F.; Kilpeläinen, S.; Jokisalo, J.; Kosonen, R. The potential of local exhaust combined with mixing and displacement ventilation systems to mitigate COVID-19 transmission risks. Build. Environ. 2024, 266, 112076. [Google Scholar] [CrossRef]
  48. Cui, D.; Liang, S.; Wang, D. Observed and projected changes in global climate zones based on Köppen climate classification. WIREs Clim. Change 2021, 12, e701. [Google Scholar] [CrossRef]
  49. ANSI/ASHRAE Standard 62.1-2019 ed.; ASHRAE, Ventilation for Acceptable Indoor Air Quality. ASHRAE: Atlanta, GA, USA, 2019.
  50. Glowinski, R. Numerical Methods for Fluids. Handbook of Numerical Analysis; Part, 3; Garlet, P.G., Lions, J.L., Eds.; Elsevier: Amsterdam, The Netherlands, 2003. [Google Scholar]
  51. Brenner, S.C.; Scott, L.R. The Mathematical Theory of Finite Element Methods, 3rd ed.; Springer: New York, NY, USA, 2008. [Google Scholar]
  52. Saury, D.; Rouger, N.; Djanna, F.; Penot, F. Natural convection in an air-filled cavity: Experimental results at large Rayleigh numbers. Int. Commun. Heat Mass Transf. 2011, 38, 679–687. [Google Scholar] [CrossRef]
  53. Ampofo, F.; Karayiannis, T.G. Experimental benchmark data for turbulent natural convection in an air-filled square cavity. Int. J. Heat Mass Transf. 2003, 46, 3551–3572. [Google Scholar] [CrossRef]
  54. ISO 7730; Ergonomics of the Thermal Environment—Analytical Determination and Interpretation of Thermal Comfort Using Calculation of the PMV and PPD Indices and Local Thermal Comfort Criteria. International Standardization Organization: Geneva, Switzerland, 2005.
  55. Hesaraki, A.; Myhren, J.A.; Holmberg, S. Influence of different ventilation levels on indoor air quality and energy savings: A case study of a single-family house. Sustain. Cities Soc. 2015, 19, 165–172. [Google Scholar] [CrossRef]
  56. Wani, M.; Swain, A.; Ukil, A.; Ploder, M.; Koole, R. Optimizing the overall performance of forced extraction systems: A multi-objective framework. Build. Environ. 2022, 221, 109214. [Google Scholar] [CrossRef]
  57. Sanchez, M.; Toutant, A.; Bataille, F. Numerical simulations and analysis of a low consumption hybrid air extractor. J. Fluids Eng. 2017, 139, 121103. [Google Scholar] [CrossRef]
Figure 1. (a) XY plane view of the studied classroom. (b) Daily maximum temperature in Veracruz, Mexico, in May 2024.
Atmosphere 16 00727 g001
Figure 2. (a) Comparison of the Nusselt number for the convection problem in a rectangular cavity reported in [52]. (b) Comparison of the average temperature for the convection problem in a square cavity reported by [53]. The asterisk denotes dimensionless quantities.
Atmosphere 16 00727 g002
Figure 3. Streamlines inside the classroom. (a) Baseline case. (b) Case 1A. (c) Case 1B. (d) Case 10A.
Atmosphere 16 00727 g003
Figure 4. Temperature fields inside the classroom over 60 min. (a) 5 min. (b) 15 min. (c) 45 min. (d) 60 min.
Atmosphere 16 00727 g004
Figure 5. Temperature fields inside the classroom at t = 60 min. (a) Case 1A (b) Case 1B.
Atmosphere 16 00727 g005
Figure 6. CO2 concentration fields for baseline case over 60 min. (a) 5 min. (b) 15 min. (c) 45 min. (d) 60 min.
Atmosphere 16 00727 g006
Figure 7. CO2 concentration fields for Case 1A over 60 min. (a) 5 min. (b) 15 min. (c) 45 min. (d) 60 min.
Atmosphere 16 00727 g007
Figure 8. CO2 concentration fields for Case 1B over 60 min. (a) 5 min. (b) 15 min. (c) 45 min. (d) 60 min.
Atmosphere 16 00727 g008
Figure 9. Average CO2 concentration over 60 min for the cases with (a) one extractor, (b) two extractors.
Atmosphere 16 00727 g009
Figure 10. CO2 concentration fields for Case 10A over 60 min. (a) 5 min. (b) 15 min. (c) 45 min. (d) 60 min.
Atmosphere 16 00727 g010
Figure 11. CO2 concentration fields for the Case 9C over 60 min. (a) 5 min. (b) 15 min. (c) 45 min. (d) 60 min.
Atmosphere 16 00727 g011
Figure 12. CO2 concentration fields for the proposed configuration using one extractor and two OACs at ground level and rear part of the classroom over 60 min. (a) 5 min. (b) 15 min. (c) 45 min. (d) 60 min.
Atmosphere 16 00727 g012
Figure 13. Average CO2 concentration over 60 min for cases with OACs located: (a) at ground level, (b) at a 2 m height, (c) stacked, and (d) average CO2 concentration over 60 min for the best cases.
Atmosphere 16 00727 g013
Figure 14. Contaminant removal effectiveness for the best cases over 60 min.
Atmosphere 16 00727 g014
Table 1. Case studies with extractors.
CasesNo. of ExtractorsFlow (m3/min)
A = 1 ExtractorB = 2 Extractors
Baseline caseN/AN/AN/A
Case 1AB13.9
Case 2AB16.2
Case 3AB18.5
Case 4AB20.8
Case 5AB23.2
Table 2. Cases studied with OACs and their locations within the room.
CasesOACs Coordinates in Meters (x, y, z)No. OACs
OACs placed at ground level
Case 6A--(4.0,5.55,0.0)--1
Case 7A(7.0,5.55,0.0)---(1.0,5.55,0.0)2
Case 8A(7.0,5.55,0.0)-(4.0,5.55,0.0)-(1.0,5.55,0.0)3
Case 9A(7.0,5.55,0.0)(5.5,5.55,0.0)-(2.5,5.55,0.0)(1.0,5.55,0.0)4
Case 10A(7.0,5.55,0.0)(5.5,5.55,0.0)(4.0,5.55,0.0)(2.5,5.55,0.0)(1.0,5.55,0.0)5
OACs placed at 2 m height
Case 6B--(4.0,5.55,2.0)--1
Case 7B(7.0,5.55,2.0)---(1.0,5.55,2.0)2
Case 8B(7.0,5.55,2.0)-(4.0,5.55,2.0)-(1.0,5.55,2.0)3
Case 9B(7.0,5.55,2.0)(5.5,5.55,2.0)-(2.5,5.55,2.0)(1.0,5.55,2.0)4
Case 10B(7.0,5.55,2.0)(5.5,5.55,2.0)(4.0,5.55,2.0)(2.5,5.55,2.0)(1.0,5.55,2.0)5
OACs stacked in central part of room
Case 6C(4.0,5.55,0.0)----1
Case 7C(4.0,5.55,0.0)(4.0,5.55,0.7)---2
Case 8C(4.0,5.55,0.0)(4.0,5.55,0.7)(4.0,5.55,1.4)--3
Case 9C(4.0,5.55,0.0)(4.0,5.55,0.7)(4.0,5.55,1.4)(4.0,5.55,2.1)-4
Table 3. Study of mesh convergence for average CO2 concentration in the baseline case.
Number of Nodes20 min40 min
Ca (ppm)Ca (ppm)
350,4001623.01740.2
682,0471798.21932.8
912,8431897.02050.9
1,250,3621849.31995.2
1,565,0141828.22035.1
1,740,2201845.62054.8
1,923,4611842.22050.3
Table 4. Comparison of measured and simulated CO2 concentrations for the baseline case in three different positions of the classroom.
TimePAPBPC
15 min
Simulated (ppm)232711681603
Measure (ppm)233511701601
Error (%)0.340.170.12
30 min
Simulated (ppm)248512591735
Measure (ppm)250012521733
Error (%)0.600.550.12
45 min
Simulated (ppm)249812661745
Measure (ppm)248312841736
Error (%)0.601.420.52
60 min
Simulated (ppm)249812661746
Measure (ppm)250512771736
Error (%)0.280.860.57
Disclaimer/Publisher’s Note: The statements, opinions and data contained in all publications are solely those of the individual author(s) and contributor(s) and not of MDPI and/or the editor(s). MDPI and/or the editor(s) disclaim responsibility for any injury to people or property resulting from any ideas, methods, instructions or products referred to in the content.