
Short-Term Exposure to Air Pollution Associated with an Increased Risk of ST-Elevation and Non-ST-Elevation Myocardial Infarction Hospital Admissions: A Case-Crossover Study from Beijing (2013–2019), China

 ,
,
Abstract
1. Introduction
2. Materials and Methods
2.1. Health Data Collection
2.2. Environmental Data Collection
2.3. Study Design
2.4. Statistical Analyses
+ factor(heating) + factor(stratum) + intercept
2.5. Sensitivity Analysis
3. Results
4. Discussion
5. Conclusions
Supplementary Materials
Author Contributions
Funding
Institutional Review Board Statement
Informed Consent Statement
Data Availability Statement
Conflicts of Interest
References
- Roth, G.A.; Mensah, G.A.; Johnson, C.O.; Addolorato, G.; Ammirati, E.; Baddour, L.M.; Barengo, N.C.; Beaton, A.Z.; Benjamin, E.J.; Benziger, C.P.; et al. Global Burden of Cardiovascular Diseases and Risk Factors, 1990–2019: Update From the GBD 2019 Study. J. Am. Coll. Cardiol. 2020, 76, 2982–3021. [Google Scholar] [CrossRef] [PubMed]
- de Bont, J.; Jaganathan, S.; Dahlquist, M.; Persson, Å.; Stafoggia, M.; Ljungman, P. Ambient air pollution and cardiovascular diseases: An umbrella review of systematic reviews and meta-analyses. J. Intern. Med. 2022, 291, 779–800. [Google Scholar] [CrossRef]
- Al-Kindi, S.G.; Brook, R.D.; Biswal, S.; Rajagopalan, S. Environmental determinants of cardiovascular disease: Lessons learned from air pollution. Nat. Rev. Cardiol. 2020, 17, 656–672. [Google Scholar] [CrossRef] [PubMed]
- Mannucci, P.M.; Harari, S.; Franchini, M. Novel evidence for a greater burden of ambient air pollution on cardiovascular disease. Haematologica 2019, 104, 2349–2357. [Google Scholar] [CrossRef]
- Gardner, B.; Ling, F.; Hopke, P.K.; Frampton, M.W.; Utell, M.J.; Zareba, W.; Cameron, S.J.; Chalupa, D.; Kane, C.; Kulandhaisamy, S.; et al. Ambient fine particulate air pollution triggers ST-elevation myocardial infarction, but not non-ST elevation myocardial infarction: A case-crossover study. Part. Fibre Toxicol. 2014, 11, 1. [Google Scholar] [CrossRef] [PubMed]
- Milojevic, A.; Wilkinson, P.; Armstrong, B.; Bhaskaran, K.; Smeeth, L.; Hajat, S. Short-term effects of air pollution on a range of cardiovascular events in England and Wales: Case-crossover analysis of the MINAP database, hospital admissions and mortality. Heart 2014, 100, 1093–1098. [Google Scholar] [CrossRef]
- Butland, B.K.; Atkinson, R.W.; Milojevic, A.; Heal, M.R.; Doherty, R.M.; Armstrong, B.G.; MacKenzie, I.A.; Vieno, M.; Lin, C.; Wilkinson, P. Myocardial infarction, ST-elevation and non-ST-elevation myocardial infarction and modelled daily pollution concentrations: A case-crossover analysis of MINAP data. Open Heart 2016, 3, e000429. [Google Scholar] [CrossRef]
- Mohammadian-Khoshnoud, M.; Habibi, H.; Manafi, B.; Safarpour, G.; Soltanian, A.R. Effects of Air Pollutant Exposure on Acute Myocardial Infarction. Heart Lung Circ. 2023, 32, 79–89. [Google Scholar] [CrossRef]
- Rus, A.A.; Mornoş, C. The Impact of Meteorological Factors and Air Pollutants on Acute Coronary Syndrome. Curr. Cardiol. Rep. 2022, 24, 1337–1349. [Google Scholar] [CrossRef]
- Kuzma, L.; Pogorzelski, S.; Struniawski, K.; Bachorzewska-Gajewska, H.; Dobrzycki, S. Exposure to air pollution-a trigger for myocardial infarction? A nine-year study in Bialystok-the capital of the Green Lungs of Poland (BIA-ACS registry). Int. J. Hyg. Environ. Health 2020, 229, 113578. [Google Scholar] [CrossRef]
- Wang, X.; Kindzierski, W.; Kaul, P. Air Pollution and Acute Myocardial Infarction Hospital Admission in Alberta, Canada: A Three-Step Procedure Case-Crossover Study. PLoS ONE 2015, 10, e0132769. [Google Scholar] [CrossRef] [PubMed]
- Hu, J.; Tang, M.; Zhang, X.; Ma, Y.; Li, Y.; Chen, R.; Kan, H.; Cui, Z.; Ge, J. Size-fractionated particulate air pollution and myocardial infarction emergency hospitalization in Shanghai, China. Sci. Total Environ. 2020, 737, 140100. [Google Scholar] [CrossRef]
- Naess, O.; Nafstad, P.; Aamodt, G.; Claussen, B.; Rosland, P. Relation between concentration of air pollution and cause-specific mortality: Four-year exposures to nitrogen dioxide and particulate matter pollutants in 470 neighborhoods in Oslo, Norway. Am. J. Epidemiol. 2007, 165, 435–443. [Google Scholar] [CrossRef] [PubMed]
- Alexeeff, S.E.; Deosaransingh, K.; Liao, N.S.; Van Den Eeden, S.K.; Schwartz, J.; Sidney, S. Particulate Matter and Cardiovascular Risk in Adults with Chronic Obstructive Pulmonary Disease. Am. J. Respir. Crit. Care Med. 2021, 204, 159–167. [Google Scholar] [CrossRef]
- Russo, M.; Rinaldi, R.; Camilli, M.; Bonanni, A.; Caffè, A.; Basile, M.; Salzillo, C.; Colucci, M.; Torre, I.; Sanna, T.; et al. Air pollution and plaque healing in acute coronary syndromes. Eur. Heart J. 2023, 44, 2403–2405. [Google Scholar] [CrossRef] [PubMed]
- Stewart, J.C.; Chalupa, D.C.; Devlin, R.B.; Frasier, L.M.; Huang, L.S.; Little, E.L.; Lee, S.M.; Phipps, R.P.; Pietropaoli, A.P.; Taubman, M.B.; et al. Vascular effects of ultrafine particles in persons with type 2 diabetes. Environ. Health Perspect. 2010, 118, 1692–1698. [Google Scholar] [CrossRef]
- Akbarzadeh, M.A.; Khaheshi, I.; Sharifi, A.; Yousefi, N.; Naderian, M.; Namazi, M.H.; Safi, M.; Vakili, H.; Saadat, H.; Alipour Parsa, S.; et al. The association between exposure to air pollutants including PM(10), PM(2.5), ozone, carbon monoxide, sulfur dioxide, and nitrogen dioxide concentration and the relative risk of developing STEMI: A case-crossover design. Environ. Res. 2018, 161, 299–303. [Google Scholar] [CrossRef]
- Zhang, Y.; Liu, X.; Kong, D.; Fu, J.; Liu, Y.; Zhao, Y.; Lian, H.; Zhao, X.; Yang, J.; Fan, Z. Effects of Ambient Temperature on Acute Exacerbations of Chronic Obstructive Pulmonary Disease: Results from a Time-Series Analysis of 143318 Hospitalizations. Int. J. Chronic Obstr. Pulm. Dis. 2020, 15, 213–223. [Google Scholar] [CrossRef]
- Tripathi, B.; Kumar, V.; Kalra, A.; Gupta, T.; Sawant, A.C.; Sharma, P.; Arora, S.; Panhwar, M.S.; Gopalan, R.; Deshmukh, A.; et al. Influence of Influenza Infection on In-Hospital Acute Myocardial Infarction Outcomes. Am. J. Cardiol. 2020, 130, 7–14. [Google Scholar] [CrossRef]
- Garcia-Lledo, A.; Rodriguez-Martin, S.; Tobias, A.; Garcia-de-Santiago, E.; Ordobas-Gavin, M.; Ansede-Cascudo, J.C.; Alonso-Martin, J.; de Abajo, F.J. Relationship Between Influenza, Temperature, and Type 1 Myocardial Infarction: An Ecological Time-Series Study. J. Am. Heart Assoc. 2021, 10, e019608. [Google Scholar] [CrossRef]
- Zhao, Y.; Kong, D.; Fu, J.; Zhang, Y.; Chen, Y.; Liu, Y.; Chang, Z.; Liu, Y.; Liu, X.; Xu, K.; et al. Increased Risk of Hospital Admission for Asthma in Children From Short-Term Exposure to Air Pollution: Case-Crossover Evidence From Northern China. Front. Public Health 2021, 9, 798746. [Google Scholar] [CrossRef] [PubMed]
- Carracedo-Martinez, E.; Taracido, M.; Tobias, A.; Saez, M.; Figueiras, A. Case-crossover analysis of air pollution health effects: A systematic review of methodology and application. Environ. Health Perspect. 2010, 118, 1173–1182. [Google Scholar] [CrossRef]
- Tobias, A.; Kim, Y.; Madaniyazi, L. Time-stratified case-crossover studies for aggregated data in environmental epidemiology: A tutorial. Int. J. Epidemiol. 2024, 53, dyae020. [Google Scholar] [CrossRef] [PubMed]
- Armstrong, B.G.; Gasparrini, A.; Tobias, A. Conditional Poisson models: A flexible alternative to conditional logistic case cross-over analysis. BMC Med. Res. Methodol. 2014, 14, 122. [Google Scholar] [CrossRef]
- Figueiras, A.; Cadarso-Suarez, C. Application of nonparametric models for calculating odds ratios and their confidence intervals for continuous exposures. Am. J. Epidemiol. 2001, 154, 264–275. [Google Scholar] [CrossRef] [PubMed]
- Altman, D.G.; Bland, J.M. Interaction revisited: The difference between two estimates. BMJ 2003, 326, 219. [Google Scholar] [CrossRef]
- Dominici, F.; Peng, R.D.; Barr, C.D.; Bell, M.L. Protecting human health from air pollution: Shifting from a single-pollutant to a multipollutant approach. Epidemiology 2010, 21, 187–194. [Google Scholar] [CrossRef]
- Farhadi, Z.; Abulghasem Gorgi, H.; Shabaninejad, H.; Aghajani Delavar, M.; Torani, S. Association between PM(2.5) and risk of hospitalization for myocardial infarction: A systematic review and a meta-analysis. BMC Public Health 2020, 20, 314. [Google Scholar] [CrossRef]
- Lee, K.K.; Spath, N.; Miller, M.R.; Mills, N.L.; Shah, A.S.V. Short-term exposure to carbon monoxide and myocardial infarction: A systematic review and meta-analysis. Environ. Int. 2020, 143, 105901. [Google Scholar] [CrossRef]
- Kim, A.; Jung, J.; Hong, J.; Yoon, S.J. Time series analysis of meteorological factors and air pollutants and their association with hospital admissions for acute myocardial infarction in Korea. Int. J. Cardiol. 2021, 322, 220–226. [Google Scholar] [CrossRef]
- Zhou, X.; Gao, Y.; Wang, D.; Chen, W.; Zhang, X. Association Between Sulfur Dioxide and Daily Inpatient Visits With Respiratory Diseases in Ganzhou, China: A Time Series Study Based on Hospital Data. Front. Public Health 2022, 10, 854922. [Google Scholar] [CrossRef] [PubMed]
- Mustafic, H.; Jabre, P.; Caussin, C.; Murad, M.H.; Escolano, S.; Tafflet, M.; Perier, M.C.; Marijon, E.; Vernerey, D.; Empana, J.P.; et al. Main air pollutants and myocardial infarction: A systematic review and meta-analysis. JAMA 2012, 307, 713–721. [Google Scholar] [CrossRef]
- Jiang, Y.; Huang, J.; Li, G.; Wang, W.; Wang, K.; Wang, J.; Wei, C.; Li, Y.; Deng, F.; Baccarelli, A.A.; et al. Ozone pollution and hospital admissions for cardiovascular events. Eur. Heart J. 2023, 44, 1622–1632. [Google Scholar] [CrossRef] [PubMed]
- Kuźma, Ł.; Dąbrowski, E.J.; Kurasz, A.; Święczkowski, M.; Jemielita, P.; Dobrzycki, S.; Lip, G.Y.H. Short and mid-term impact of ozone on myocardial infarction incidence in Poland. Lancet Reg. Health Eur. 2024, 43, 100982. [Google Scholar] [CrossRef]
- Evans, K.A.; Hopke, P.K.; Utell, M.J.; Kane, C.; Thurston, S.W.; Ling, F.S.; Chalupa, D.; Rich, D.Q. Triggering of ST-elevation myocardial infarction by ambient wood smoke and other particulate and gaseous pollutants. J. Expo. Sci. Environ. Epidemiol. 2017, 27, 198–206. [Google Scholar] [CrossRef]
- Joseph, P.M. Paradoxical ozone associations could be due to methyl nitrite from combustion of methyl ethers or esters in engine fuels. Environ. Int. 2007, 33, 1090–1106. [Google Scholar] [CrossRef]
- Rinaldi, R.; Russo, M.; Bonanni, A.; Camilli, M.; Caffè, A.; Basile, M.; Salzillo, C.; Animati, F.M.; Trani, C.; Niccoli, G.; et al. Short-term air pollution exposure and mechanisms of plaque instability in acute coronary syndromes: An optical coherence tomography study. Atherosclerosis 2024, 390, 117393. [Google Scholar] [CrossRef]
- Robertson, S.; Miller, M.R. Ambient air pollution and thrombosis. Part. Fibre Toxicol. 2018, 15, 1. [Google Scholar] [CrossRef] [PubMed]
- Libby, P.; Pasterkamp, G.; Crea, F.; Jang, I.K. Reassessing the Mechanisms of Acute Coronary Syndromes. Circ. Res. 2019, 124, 150–160. [Google Scholar] [CrossRef]
- Crea, F.; Libby, P. Acute Coronary Syndromes: The Way Forward From Mechanisms to Precision Treatment. Circulation 2017, 136, 1155–1166. [Google Scholar] [CrossRef]
- Rich, D.Q.; Kipen, H.M.; Zhang, J.; Kamat, L.; Wilson, A.C.; Kostis, J.B. Triggering of transmural infarctions, but not nontransmural infarctions, by ambient fine particles. Environ. Health Perspect. 2010, 118, 1229–1234. [Google Scholar] [CrossRef] [PubMed]
- Kuzma, L.; Wanha, W.; Kralisz, P.; Kazmierski, M.; Bachorzewska-Gajewska, H.; Wojakowski, W.; Dobrzycki, S. Impact of short-term air pollution exposure on acute coronary syndrome in two cohorts of industrial and non-industrial areas: A time series regression with 6,000,000 person-years of follow-up (ACS—Air Pollution Study). Environ. Res. 2021, 197, 111154. [Google Scholar] [CrossRef] [PubMed]
- Xie, W.; Li, G.; Zhao, D.; Xie, X.; Wei, Z.; Wang, W.; Wang, M.; Li, G.; Liu, W.; Sun, J.; et al. Relationship between fine particulate air pollution and ischaemic heart disease morbidity and mortality. Heart 2015, 101, 257–263. [Google Scholar] [CrossRef] [PubMed]
- McManus, D.D.; Gore, J.; Yarzebski, J.; Spencer, F.; Lessard, D.; Goldberg, R.J. Recent trends in the incidence, treatment, and outcomes of patients with STEMI and NSTEMI. Am. J. Med. 2011, 124, 40–47. [Google Scholar] [CrossRef]
- Puymirat, E.; Simon, T.; Cayla, G.; Cottin, Y.; Elbaz, M.; Coste, P.; Lemesle, G.; Motreff, P.; Popovic, B.; Khalife, K.; et al. Acute Myocardial Infarction: Changes in Patient Characteristics, Management, and 6-Month Outcomes Over a Period of 20 Years in the FAST-MI Program (French Registry of Acute ST-Elevation or Non-ST-Elevation Myocardial Infarction) 1995 to 2015. Circulation 2017, 136, 1908–1919. [Google Scholar] [CrossRef]
- Pope, C.A.; Muhlestein, J.B.; Anderson, J.L.; Cannon, J.B.; Hales, N.M.; Meredith, K.G.; Le, V.; Horne, B.D. Short-Term Exposure to Fine Particulate Matter Air Pollution Is Preferentially Associated With the Risk of ST-Segment Elevation Acute Coronary Events. J. Am. Heart Assoc. 2015, 4, e002506. [Google Scholar] [CrossRef]
- Pan, H.Y.; Cheung, S.M.; Chen, F.C.; Wu, K.H.; Cheng, S.Y.; Chuang, P.C.; Cheng, F.J. Short-Term Effects of Ambient Air Pollution on ST-Elevation Myocardial Infarction Events: Are There Potentially Susceptible Groups? Int. J. Environ. Res. Public Health 2019, 16, 3760. [Google Scholar] [CrossRef]
- Ho, A.F.W.; Zheng, H.; Earnest, A.; Cheong, K.H.; Pek, P.P.; Seok, J.Y.; Liu, N.; Kwan, Y.H.; Tan, J.W.C.; Wong, T.H.; et al. Time-Stratified Case Crossover Study of the Association of Outdoor Ambient Air Pollution With the Risk of Acute Myocardial Infarction in the Context of Seasonal Exposure to the Southeast Asian Haze Problem. J. Am. Heart Assoc. 2019, 8, e011272. [Google Scholar] [CrossRef]
- Clougherty, J.E. A growing role for gender analysis in air pollution epidemiology. Environ. Health Perspect. 2010, 118, 167–176. [Google Scholar] [CrossRef]
- Sato, Y.; Kawakami, R.; Sakamoto, A.; Cornelissen, A.; Mori, M.; Kawai, K.; Ghosh, S.; Romero, M.E.; Kolodgie, F.D.; Finn, A.V.; et al. Sex Differences in Coronary Atherosclerosis. Curr. Atheroscler. Rep. 2022, 24, 23–32. [Google Scholar] [CrossRef]
- Cepelis, A.; Brumpton, B.M.; Laugsand, L.E.; Dalen, H.; Langhammer, A.; Janszky, I.; Strand, L.B. Asthma, asthma control and risk of acute myocardial infarction: HUNT study. Eur. J. Epidemiol. 2019, 34, 967–977. [Google Scholar] [CrossRef]
- Guarnieri, M.; Balmes, J.R. Outdoor air pollution and asthma. Lancet 2014, 383, 1581–1592. [Google Scholar] [CrossRef] [PubMed]
- Chatkin, J.; Correa, L.; Santos, U. External Environmental Pollution as a Risk Factor for Asthma. Clin. Rev. Allergy Immunol. 2022, 62, 72–89. [Google Scholar] [CrossRef]
- Nuvolone, D.; Balzi, D.; Chini, M.; Scala, D.; Giovannini, F.; Barchielli, A. Short-term association between ambient air pollution and risk of hospitalization for acute myocardial infarction: Results of the cardiovascular risk and air pollution in Tuscany (RISCAT) study. Am. J. Epidemiol. 2011, 174, 63–71. [Google Scholar] [CrossRef] [PubMed]
- Heinrich, J.; Schikowski, T. COPD Patients as Vulnerable Subpopulation for Exposure to Ambient Air Pollution. Curr. Environ. Health Rep. 2018, 5, 70–76. [Google Scholar] [CrossRef]
- Goedemans, L.; Bax, J.J.; Delgado, V. COPD and acute myocardial infarction. Eur. Respir. Rev. 2020, 29, 190139. [Google Scholar] [CrossRef]
- Goldman, G.T.; Mulholland, J.A.; Russell, A.G.; Strickland, M.J.; Klein, M.; Waller, L.A.; Tolbert, P.E. Impact of exposure measurement error in air pollution epidemiology: Effect of error type in time-series studies. Environ. Health 2011, 10, 61. [Google Scholar] [CrossRef]
- Zeger, S.L.; Thomas, D.; Dominici, F.; Samet, J.M.; Schwartz, J.; Dockery, D.; Cohen, A. Exposure measurement error in time-series studies of air pollution: Concepts and consequences. Environ. Health Perspect. 2000, 108, 419–426. [Google Scholar] [CrossRef] [PubMed]
- Peters, A.; von Klot, S.; Berglind, N.; Hormann, A.; Lowel, H.; Nyberg, F.; Pekkanen, J.; Perucci, C.A.; Stafoggia, M.; Sunyer, J.; et al. Comparison of different methods in analyzing short-term air pollution effects in a cohort study of susceptible individuals. Epidemiol. Perspect. Innov. 2006, 3, 10. [Google Scholar] [CrossRef]
- Fung, K.Y.; Krewski, D.; Chen, Y.; Burnett, R.; Cakmak, S. Comparison of time series and case-crossover analyses of air pollution and hospital admission data. Int. J. Epidemiol. 2003, 32, 1064–1070. [Google Scholar] [CrossRef]
- Zhang, X.; Javidi, B.; Ng, M.K. Automatic regularization parameter selection by generalized cross-validation for total variational Poisson noise removal. Appl. Opt. 2017, 56, D47–D51. [Google Scholar] [CrossRef] [PubMed]


| Total AMI | STEMI | NSTEMI | |
|---|---|---|---|
| Total, n (mean ± SD) | 149,632 (59 ± 14) | 70,730 (28 ± 7) | 69,594 (27 ± 9) |
| Age, n (%) | |||
| <65 | 69,231 (46.27) | 39,359 (55.65) | 26,893 (38.64) |
| ≥65 | 80,401 (53.73) | 31,371 (44.35) | 42,701 (61.36) |
| Gender, n (%) | |||
| Male | 103,706 (69.31) | 52,870 (74.75) | 45,002 (64.66) |
| Female | 45,926 (30.69) | 17,860 (25.25) | 24,592 (35.34) |
| Comorbidities, n (%) | |||
| Asthma | 970 (0.65) | 413 (0.58) | 482 (0.69) |
| COPD | 2675 (1.79) | 900 (1.27) | 1490 (2.14) |
| Hypertension | 75,687 (50.58) | 34,234 (48.40) | 37,394 (53.73) |
| Diabetes | 39,360 (26.30) | 17,864 (25.26) | 19,245 (27.65) |
| CKD | 8850 (5.91) | 2768 (3.91) | 5182 (7.45) |
| CVD history, n (%) | |||
| OMI | 17,705 (11.83) | 5395 (7.63) | 11,285 (16.22) |
| PCI/CABG history | 19,259 (12.87) | 7544 (10.67) | 10,697 (15.37) |
| Stroke | 15,250 (10.19) | 6015 (8.50) | 7786 (11.19) |
| Mean ± SD | Min | P25 | P50 | P75 | Max | IQR | |
|---|---|---|---|---|---|---|---|
| PM2.5 (μg/m3) | 67.61 ± 60.81 | 3.88 | 25.34 | 49.69 | 88.67 | 475.43 | 63.33 |
| PM10 (μg/m3) | 97.91 ± 71.07 | 7.08 | 49.92 | 80.5 | 124.15 | 956.13 | 74.23 |
| SO2 (μg/m3) | 12.34 ± 16.05 | 1.94 | 3.25 | 6.28 | 13.55 | 138.37 | 10.30 |
| NO2 (μg/m3) | 46.06 ± 22.82 | 6.68 | 29.88 | 40.92 | 56.79 | 156.08 | 26.91 |
| CO (mg/m3) | 1.07 ± 0.85 | 0.19 | 0.56 | 0.84 | 1.23 | 8.04 | 0.67 |
| O3 (μg/m3) | 67.87 ± 49.76 | 2.18 | 32.09 | 57.86 | 90.41 | 331.08 | 58.32 |
| Tmean (°C) | 13.78 ± 11.23 | −14.3 | 2.9 | 15.2 | 24.2 | 32.6 | - |
| RH (%) | 51.45 ± 19.87 | 8 | 35 | 52 | 67 | 99 | - |
| AP (hPa) | 1012.9 ± 10.2 | 990 | 1004.2 | 1013 | 1021.1 | 1040 | - |
| Total AMI | STEMI | NSTEMI | ||||
|---|---|---|---|---|---|---|
| PM2.5 | lag0 | 1.002 (1.001, 1.003) * | lag0 | 1.003 (1.001, 1.004) * | lag1 | 1.002 (1.000, 1.003) * |
| lag01 | 1.003 (1.002, 1.004) * | lag01 | 1.003 (1.002, 1.005) * | lag04 | 1.003 (1.000, 1.006) * | |
| PM10 | lag0 | 1.002 (1.001, 1.003) * | lag0 | 1.002 (1.001, 1.003) * | lag1 | 1.002 (1.000, 1.003) * |
| lag01 | 1.003 (1.001, 1.004) * | lag01 | 1.002 (1.001, 1.004) * | lag05 | 1.003 (1.001, 1.006) * | |
| SO2 | lag1 | 1.011 (1.004, 1.017) * | lag0 | 1.009 (1.000, 1.017) * | lag1 | 1.013 (1.004, 1.023) * |
| lag01 | 1.014 (1.006, 1.022) * | lag01 | 1.012 (1.002, 1.022) * | lag05 | 1.020 (1.002, 1.039) * | |
| NO2 | lag1 | 1.007 (1.003, 1.010) * | lag0 | 1.007 (1.003, 1.012) * | lag1 | 1.005 (1.000, 1.010) * |
| lag01 | 1.009 (1.005, 1.013) * | lag01 | 1.009 (1.004, 1.015) * | lag02 | 1.007 (1.001, 1.014) * | |
| CO | lag0 | 1.019 (1.010, 1.029) * | lag0 | 1.021 (1.009, 1.034) * | lag1 | 1.017 (1.004, 1.031) * |
| lag01 | 1.025 (1.014, 1.036) * | lag01 | 1.025 (1.011, 1.040) * | lag02 | 1.023 (1.005, 1.041) * | |
| O3 | lag2 | 1.001 (0.998, 1.003) | lag4 | 0.996 (0.993, 0.999) * | lag2 | 1.002 (0.998, 1.005) |
| lag03 | 1.000 (0.997, 1.004) | lag05 | 0.996 (0.990, 1.002) | lag03 | 1.001 (0.996, 1.007) | |
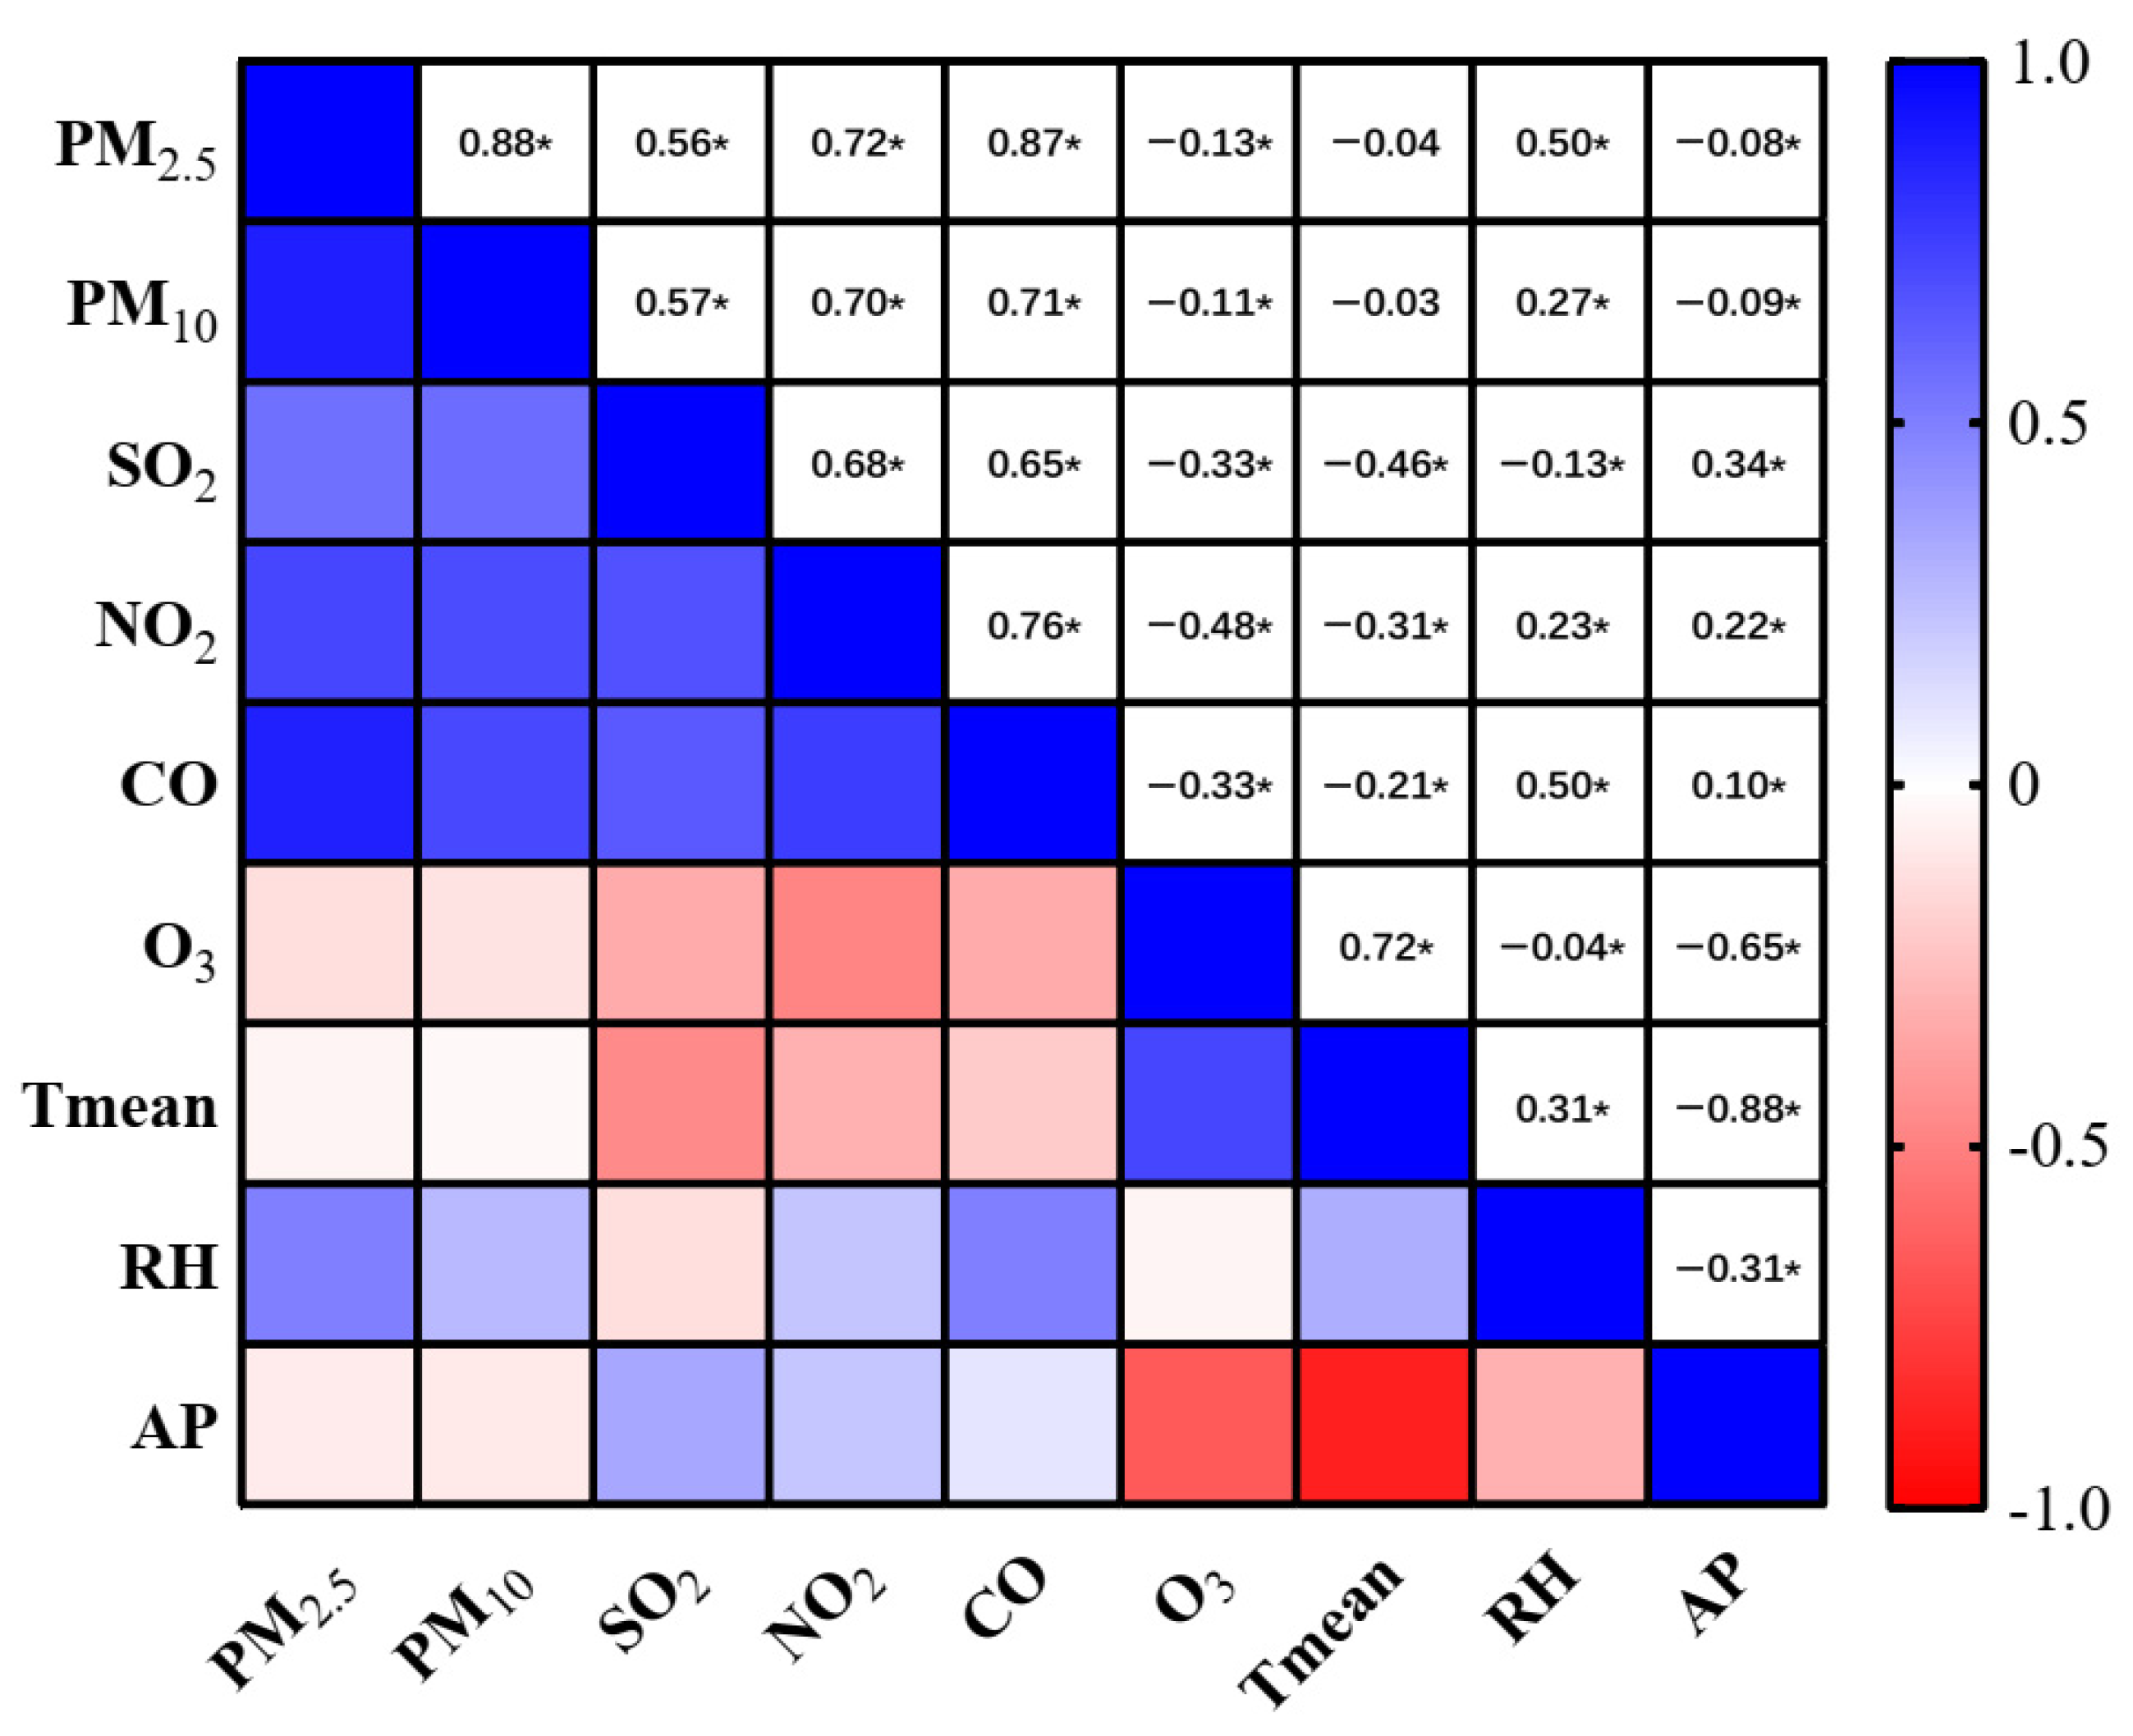
| Air Pollutants | Model | RR (95%CI) | Spearman Correlation |
|---|---|---|---|
| PM2.5 | unadjusted | 1.002 (1.001, 1.003) * | - |
| +SO2 | 1.002 (1.001, 1.004) * | 0.56 | |
| +O3 | 1.002 (1.001, 1.004) * | −0.13 | |
| PM10 | unadjusted | 1.002 (1.001, 1.003) * | - |
| +SO2 | 1.002 (1.001, 1.003) * | 0.57 | |
| +O3 | 1.002 (1.001, 1.003) * | −0.11 | |
| SO2 | unadjusted | 1.011 (1.004, 1.017) * | - |
| +PM2.5 | 1.007 (1.000, 1.014) * | 0.56 | |
| +PM10 | 1.007 (1.000, 1.014) * | 0.57 | |
| +NO2 | 1.008 (1.001, 1.014) * | 0.68 | |
| +CO | 1.007 (1.000, 1.014) | 0.65 | |
| +O3 | 1.011 (1.004, 1.017) * | −0.33 | |
| NO2 | unadjusted | 1.007 (1.003, 1.010) * | - |
| +SO2 | 1.006 (1.002, 1.009) * | 0.68 | |
| +O3 | 1.006 (1.003, 1.010) * | −0.48 | |
| CO | unadjusted | 1.019 (1.010, 1.029) * | - |
| +SO2 | 1.019 (1.007, 1.031) * | 0.65 | |
| +O3 | 1.020 (1.011, 1.030) * | −0.33 | |
| O3 | unadjusted | 1.001 (0.998, 1.003) | - |
| +PM2.5 | 1.001 (0.998, 1.003) | −0.13 | |
| +PM10 | 1.001 (0.998, 1.003) | −0.11 | |
| +SO2 | 1.001 (0.998, 1.003) | −0.33 | |
| +NO2 | 1.001 (0.999, 1.004) | −0.48 | |
| +CO | 1.001 (0.998, 1.003) | −0.33 |
Disclaimer/Publisher’s Note: The statements, opinions and data contained in all publications are solely those of the individual author(s) and contributor(s) and not of MDPI and/or the editor(s). MDPI and/or the editor(s) disclaim responsibility for any injury to people or property resulting from any ideas, methods, instructions or products referred to in the content. |
© 2025 by the authors. Licensee MDPI, Basel, Switzerland. This article is an open access article distributed under the terms and conditions of the Creative Commons Attribution (CC BY) license (https://creativecommons.org/licenses/by/4.0/).
Share and Cite
Zhao, Y.; Chen, Y.; Liu, Y.; Tang, S.; Han, Y.; Fu, J.; Chang, Z.; Zhao, X.; Zhuang, Y.; Lei, J.; et al. Short-Term Exposure to Air Pollution Associated with an Increased Risk of ST-Elevation and Non-ST-Elevation Myocardial Infarction Hospital Admissions: A Case-Crossover Study from Beijing (2013–2019), China. Atmosphere 2025, 16, 715. https://doi.org/10.3390/atmos16060715
Zhao Y, Chen Y, Liu Y, Tang S, Han Y, Fu J, Chang Z, Zhao X, Zhuang Y, Lei J, et al. Short-Term Exposure to Air Pollution Associated with an Increased Risk of ST-Elevation and Non-ST-Elevation Myocardial Infarction Hospital Admissions: A Case-Crossover Study from Beijing (2013–2019), China. Atmosphere. 2025; 16(6):715. https://doi.org/10.3390/atmos16060715
Chicago/Turabian StyleZhao, Yakun, Yuxiong Chen, Yanbo Liu, Siqi Tang, Yitao Han, Jia Fu, Zhen’ge Chang, Xinlong Zhao, Yuansong Zhuang, Jinyan Lei, and et al. 2025. "Short-Term Exposure to Air Pollution Associated with an Increased Risk of ST-Elevation and Non-ST-Elevation Myocardial Infarction Hospital Admissions: A Case-Crossover Study from Beijing (2013–2019), China" Atmosphere 16, no. 6: 715. https://doi.org/10.3390/atmos16060715
APA StyleZhao, Y., Chen, Y., Liu, Y., Tang, S., Han, Y., Fu, J., Chang, Z., Zhao, X., Zhuang, Y., Lei, J., & Fan, Z. (2025). Short-Term Exposure to Air Pollution Associated with an Increased Risk of ST-Elevation and Non-ST-Elevation Myocardial Infarction Hospital Admissions: A Case-Crossover Study from Beijing (2013–2019), China. Atmosphere, 16(6), 715. https://doi.org/10.3390/atmos16060715