Article

Chemical Composition and Mixing States of Individual Particles in Indoor and Outdoor Atmospheres

School of Resources and Environmental Engineering, Hefei University of Technology, Hefei 230009, China
*
Author to whom correspondence should be addressed.
Atmosphere 2025, 16(6), 707; https://doi.org/10.3390/atmos16060707
Submission received: 28 April 2025 / Revised: 6 June 2025 / Accepted: 6 June 2025 / Published: 11 June 2025
(This article belongs to the Section Aerosols)

Abstract

:
Understanding the chemical composition and mixing states of individual particles in indoor/outdoor environments is important for assessing daily human exposure. In this study, the chemical composition and mixing states of micron-sized individual particles in university classrooms, dwellings, and corresponding outdoor atmospheres collected between November 2024 and January 2025 were analyzed using micro-Raman spectroscopy. Inorganics and carbonaceous matter were identified in the individual particles; inorganics included CaCO3, CaMg(CO3)2, Ca(NO3)2, CaSO4, CaSO4•2H2O, Mg(NO3)2, Na2SO4, SiO2, NH4NO3, and (NH4)2SO4, and carbonaceous matter included soot and organics. This study found significant differences in the chemical composition of indoor and outdoor particles. For example, the percentage of particles containing CaSO4 was higher in university classrooms than in corresponding outdoor atmospheres, which may be related to the use of chalk. Particles containing organics in the dwelling accounted for more than 80% of the total, which was significantly higher than those found in the corresponding outdoor atmospheres. This may be due to indoor cooking and cleaning activities. Internally mixed CaSO4/NH4NO3 particles and internally mixed CaSO4•2H2O/NH4NO3/(NH4)2SO4 particles were identified in the indoor atmospheres, indicating the complexity of indoor particle formation. In addition, soot and organics were primarily internally mixed with inorganics in individual particles in both indoor and outdoor atmospheres. This study offers new insights for understanding the formation mechanisms and sources of individual atmospheric particles.

1. Introduction

Atmospheric aerosol particles have attracted much attention because of their risk to human health and their impact on the environment, both indoors and outdoors [1,2,3,4]. In the past, researchers have focused mainly on outdoor atmospheric particulate matter exposure studies. Outdoor particulate matter has been extensively studied in terms of chemical composition, mixing state, phase state, different seasons, and different regions (including Beijing and Myanmar, etc.) [5,6,7,8,9,10,11]. Compared to the outdoor environment, the knowledge of indoor particles remains limited. Although some studies have focused on aerosols in specific workplaces, non-occupational indoor environments are the norm for people’s living, and understanding of these indoor particles is still limited [12,13]. What is the chemical composition of indoor particles? What are the differences in chemical composition between indoor and outdoor particles? And how do chemical and physical processes indoors modify the chemical composition of outdoor particles after they enter the indoor environment?
Research shows that people spend 80–90% of their time indoors [14]. Another fact worth highlighting is that according to the World Health Organization, indoor air pollution is responsible for 3.8 million premature deaths each year [15]. Buildings provide partial protection from outdoor pollution but also increase the potential for exposure to indoor particulate matter and other gases. Indoor particles are a mixture of outdoor particles and particles produced indoors by everyday human activities [2]. Atmospheric particulate matter is the main component of indoor air pollution. Indoor pollutants come from a wide range of sources, including cooking, smoking, and hazardous substances released from renovation materials [16,17]. These pollutants not only pose a direct threat to human health but may also generate secondary pollutants through complex chemical reactions, further aggravating the deterioration of the indoor environments [17]. Prolonged exposure to high levels of PM2.5 not only affects the health of the lung and heart but can also have adverse effects on the central nervous system [4,18]. The House Observations of Microbial and Environmental Chemistry (HOMEChem) campaign revealed that cooking released hundreds of organic compounds and was a major source of indoor particulate matter in residential homes [19]. Cooking activities can also influence the formation of secondary organic aerosols by releasing semi-volatile organic compounds (SVOCs) that participate in secondary chemical reactions [20]. The HOMEChem experiment showed that indoor PM2.5 concentrations were significantly elevated during cooking activities, with peak levels reaching over 250 μg/m3 [19]. These particles continue to affect indoor air quality long after cooking has ended, and their dynamic processes have important implications for human health exposures, which are further moderated by factors such as ventilation conditions and the chemical nature of the particles [19,21]. In addition, studies of particulate matter in indoor environments have been conducted in subways, barbecue restaurants, hot pot restaurants, hospitals, and offices [18,22,23]. These indoor environments are more specialized and can be affected by specific pollutants. And people usually spend more time at school and at home.
The composition and sources of particulate matter in school and residential environments have been reported. For example, Oeder et al. found that there were differences in the composition of indoor and outdoor PM10 in Munich elementary schools, with indoor particles dominated by silicates and organics and outdoor particles dominated by calcium sulfate [14]. Indoor particles in elementary schools also showed significant cytotoxicity [14]. PM10 was dominated by soil particles and organics in the classrooms at the University of Rome, and by sulfate and nitrate outdoors [24]. Both elementary and university classrooms had higher PM10 concentrations indoors than outdoors [14,24]. Organic components and inorganic elements have been identified in indoor particles using high-resolution mass spectrometry, and a large number of soot particles have also been detected during kitchen cooking [25]. In addition, by analyzing the concentration of chemical components of indoor particulate matter in vacant dwellings, it was found that the concentration of ammonium nitrate indoors was higher than outdoors, which can be affected by temperature and ventilation rate [26]. These studies have focused more on the elemental composition and mass concentration of indoor particles, whereas there are few studies on the chemical composition and mixing states of indoor particles. Recent advances in micro-Raman spectroscopy have demonstrated its potential for analyzing the chemical composition and mixing states of individual particles [10,27]. However, its application in indoor particulate analysis has not yet been fully explored.
In this study, individual particles were collected from university classrooms and corresponding outdoor atmospheres, as well as from residences and corresponding outdoor atmospheres in November, December 2024, and January 2025. The chemical composition and mixing states of indoor and outdoor particles were analyzed by micro-Raman spectroscopy. This study helps to understand the physicochemical formation of indoor particles, provides insight into the transport and transformation of outdoor particles indoors, and provides a theoretical basis for improving indoor air quality.

2. Experimental

2.1. Sampling of Individual Particles

The research of the classroom was conducted in two five-story buildings located on the Tunxi Road Campus of Hefei University of Technology (30.84° N, 117.30° E), in Hefei, China. There are roads and residential areas near the campus, but no industrial areas. The residential study was conducted in a nine-story apartment building in Hefei, China. Sampling was performed outdoors, in the middle of the open space in front of the building, and indoors, in three different locations: a classroom (the West Second Teaching Building, on the fourth floor, around 120 m3), another classroom (the Main Teaching Building, on the second floor, around 88 m3), and a living room (a residential building, on the fourth floor, around 70 m3).
The sampling campaign was conducted at multiple locations between November 2024 and January 2025. Indoor samples were collected from two academic buildings during class break periods: the West Second Teaching Building on 4 and 12 November 2024 (labeled ID1104 and ID1112, respectively), and the Main Teaching Building on 19 November and 12 December 2024 (labeled ID1119 and ID1212, respectively). The corresponding outdoor samples were labeled as OD1104, OD1112, OD1119, and OD1212, respectively. Additional paired indoor-outdoor samples were collected at the residential building on 24 and 27 December 2024, and 2 January 2025, with indoor samples labeled ID1224, ID1227, and ID0102, and outdoor samples labeled OD1224, OD1227, and OD0102, respectively. Continuous and regular indoor activity is maintained inside the residence. Under normal conditions, classrooms and the residential building were naturally ventilated by opening windows and doors. However, during sampling periods, all windows, doors, and air-conditioning systems remained closed. In all indoor environments, samplers were placed 1.5 m from windows/doors and maintained at the same height as human breathing (approximately 1.5 m) to minimize the direct effects of airflow. In addition, hourly concentrations of pollutants and real-time weather parameters at the time of sampling were obtained from the Department of Ecology and Environment of Anhui Province (https://sthjt.ah.gov.cn) (accessed on 2 January 2025) and the China Meteorological Administration (https://www.cma.gov.cn) (accessed on 2 January 2025), and these data are compiled in Table S1. The corresponding sampling locations for each sample are summarized in Table S2.
A homemade single-stage impact sampler, connected to a mass flow controller, collects atmospheric aerosol particles (Figure S1). The diameter of the impact nozzle was 0.5 mm. The principle of the sampler has been described in detail by Wang et al. [10]. The particles were carried by an airflow at a flow rate of 1.0 L/min and deposited onto a commercially available gold-plated silicon wafer by inertial impaction. The substrate (film thickness: 100 nm, size: 8 × 8 mm) was commercially sourced from Shunsheng Electronic Technology, Foshan, China. We cleaned the blank substrate without particles using ethanol before sampling to remove possible dirt on the substrate surface. The Raman spectrum of the blank substrate without particles is shown in Figure S3. There were no obvious Raman characteristic peaks in the range of 200–4000 cm−1. Assuming a particle density of 2 g/cm3, the impactor achieves 50% collection efficiency for particles with an aerodynamic diameter of 0.3 µm and 100% collection efficiency for particles with an aerodynamic diameter of 0.5 µm. The sampling time for each substrate was 1–3 min. By using this sampling approach, it could be confirmed that the particles measured in this study were individual particles (Figure S2).

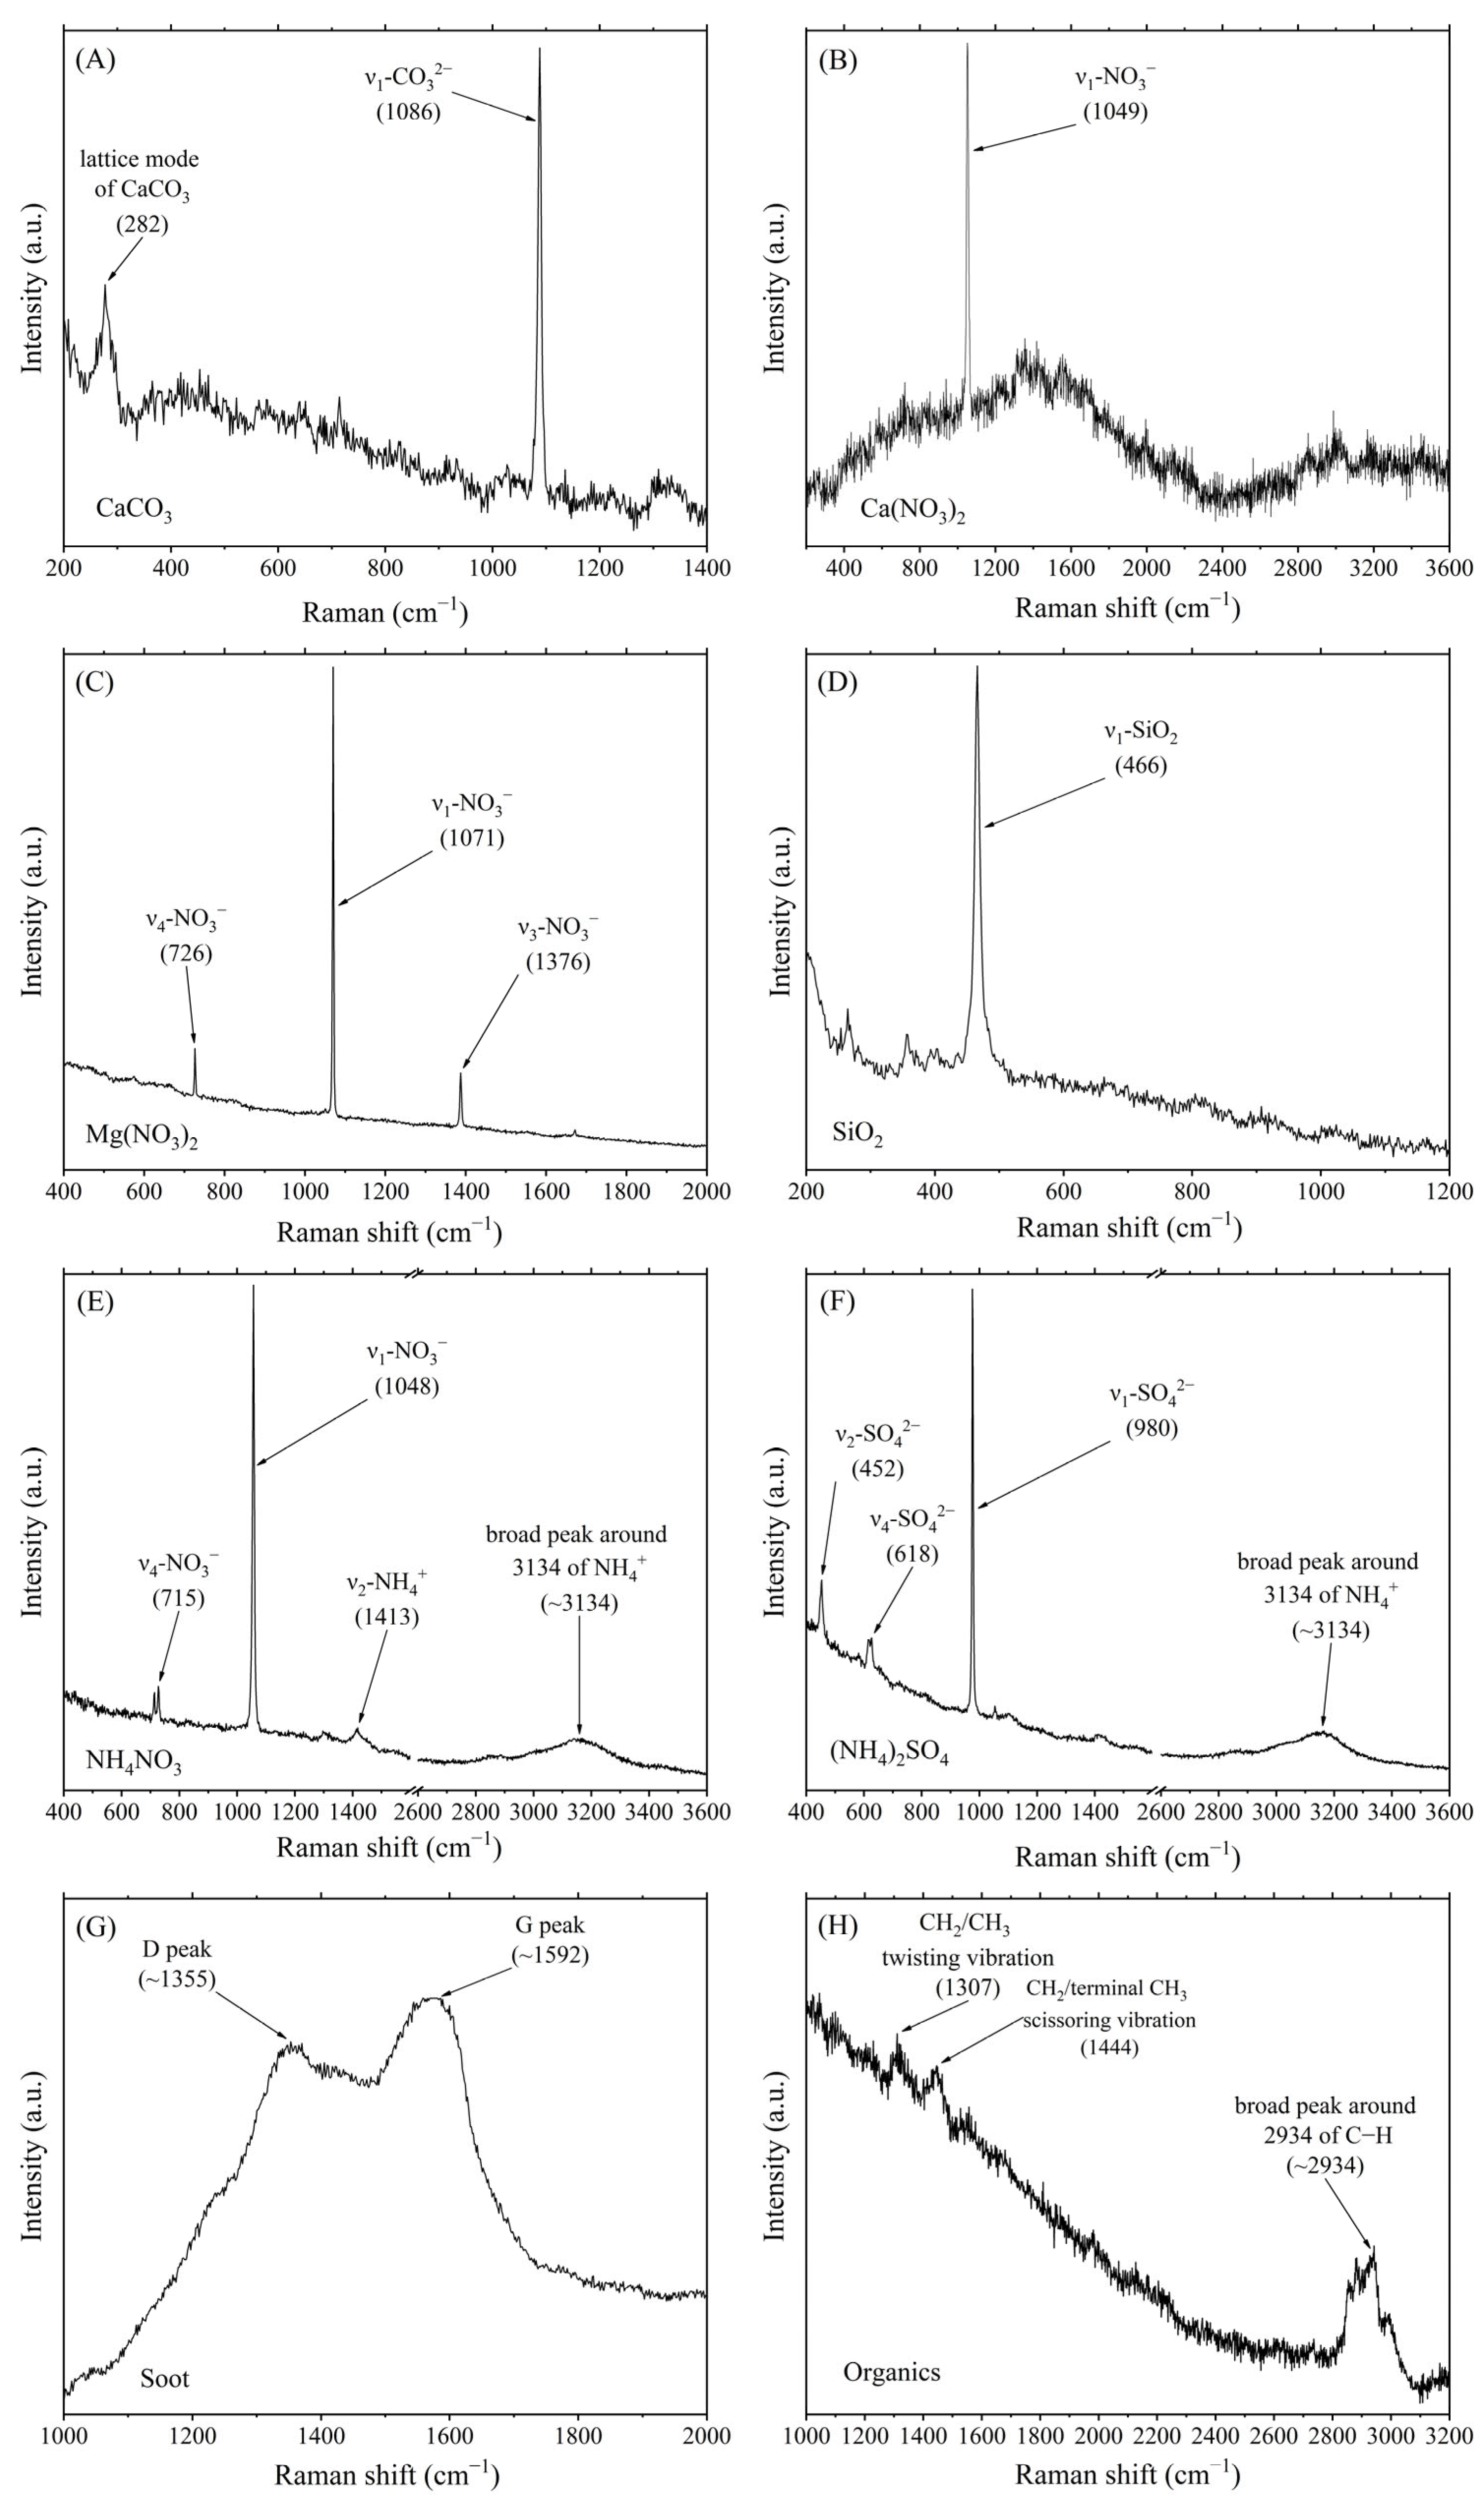
2.2. Raman Spectroscopy Measurements

This study was conducted using a confocal micro-Raman spectrometer (LabRAM HR Evolution, Horiba Jobin Yvon, Paris, France) at the Instrumental Analysis Center of Hefei University of Technology. The instrument was equipped with a long-working-distance objective lens (Olympus, Tokyo, Japan, 50×, NA = 0.75) for focusing the laser beam onto individual particles. 532 nm and 633 nm lasers were available for laser excitation. The laser power can be adjusted between 5 mW and 20 mW, depending on sample requirements. Prior to measurements, the spectrometer was calibrated using a silicon wafer. The spectral acquisition range was set from 200 cm−1 to 4000 cm−1. The accumulation time was 10 s, and each spectrum was accumulated once. Environmental conditions, including laboratory temperature and relative humidity, were recorded for each measurement, as shown in Table S2. The laser beam is focused on selected particles, and the scattered light passes through a grating and is detected by a charge-coupled device (CCD) detector. Since Raman scattering signals from individual particles smaller than 1 µm were not very good, particles with diameters ≥ 1 µm were randomly selected for Raman measurements in this study. The measured particles had a geometric size range of 1.0 to 7.5 μm, based on optical micrograph estimation; 91% of the particles were within the 1.0−4.5 μm size range (Figure S4). The raw spectra were baseline corrected and noise reduced using Labspec 5. The laboratory environment during Raman characterization exhibited temperatures between 16 and 20 °C, accompanied by relative humidity levels of 25–60%.

3. Results and Discussion

3.1. Composition of Individual Particles Indoors and Outdoors

Fourteen samples were analyzed offline using micro-Raman spectroscopy, with 120 individual particles selected for each sample. A total of 1680 individual particles were measured, from which 1680 Raman spectra were collected. The chemical composition of individual particles was determined by matching their Raman spectral data (peak positions and intensity patterns) with Raman data of known chemical species reported in the literature. As summarized in Table S3, the analysis of 1680 individual particles revealed the presence of 12 chemical species. All comparative references are explicitly cited in Table S3. These chemical species were categorized into two groups: inorganics and carbonaceous matter. Inorganics include CaCO3, CaMg(CO3)2, Ca(NO3)2, CaSO4, CaSO4•2H2O, Mg(NO3)2, SiO2, NH4NO3, (NH4)2SO4 and Na2SO4. Carbonaceous matter includes soot and organics (i.e., Raman signals of functional groups of organics in individual particles). The number of atmospheric individual particles containing inorganics with different mixing states in each sample indoors and outdoors is recorded in Table 1; the number of atmospheric individual particles containing carbonaceous matter with different mixing states in each sample indoors and outdoors is recorded in Table 2.
CaCO3 and CaMg(CO3)2 can be sourced mainly from mineral and soil dusts. The presence of both is confirmed by their strong Raman bands at 1086 cm−1 and 1098 cm−1, which are CO3 symmetric stretching vibrations(ν1) in the CaCO3 and CaMg(CO3)2, respectively [10,28]. Only four Raman spectra of individual particles were identified as CaCO3 particles (as shown in Figure 1A), and no individual CaMg(CO3)2 particles were identified. Both are usually present as mixed particles, indicating that calcium-containing mineral particles readily react with atmospheric SO2 and NOx, which is consistent with the findings of Geng et al. [29]. Of 1680 measured particles, 29 contained CaCO3 (1.7% of the total), with more indoors (17) than outdoors (12), probably related to indoor emissions from building materials. Three individual particles contained CaMg(CO3)2, which accounted for 0.2% of the total measured particles. In addition, internally mixed CaMg(CO3)2/Ca(NO3)2 particles and internally mixed CaMg(CO3)2/Ca(NO3)2/CaSO4 particles were detected in this study. Where mixed CaMg(CO3)2/Ca(NO3)2 particles were detected indoors, suggesting that the mixing state of individual particles indoors can be influenced by the outdoor atmosphere.
Na2SO4 could be sourced from sea salt and mineral dust, and its presence is confirmed by a strong Raman characteristic peak at 992 cm−1 [30,31]; 19 particles containing Na2SO4 were detected in indoor atmospheres, compared to 41 detected in outdoor atmospheres. As shown in Figure 2, the Raman peaks of Na2SO4 and other substances were observed in the same individual particle, confirming that Na2SO4 was internally mixed with other substances in an individual particle. The Raman spectra of individual particles showing only a characteristic peak at 992 cm−1 were not observed in this study, suggesting that Na2SO4 exists mainly in the form of internal mixing.
Calcium sulfate was identified frequently in this study, distinguishing between CaSO4 and CaSO4•2H2O by characteristic peaks in the Raman spectra at 1010 and 1015 cm−1 (symmetric telescoping vibration of SO42−), respectively [30,32]. Of the 1680 individual particles, 362 particles contained calcium sulfate, of which three particles only had the characteristic peak of calcium sulfate (without the characteristic peaks of other substances), suggesting that calcium sulfate usually exists in an internally mixed state in individual particles. Dust and building materials are natural sources of calcium sulfate [33]. In addition to natural sources, calcium sulfate can be produced by the reaction of an alkaline substance (e.g., CaCO3) with SO2. Similarly, CaCO3 reacts with NO2 to form Ca(NO3)2, confirmed by their strong Raman bands at 1049 cm−1 (Figure 1B). Among the total measured particles, there were 256 particles containing Ca(NO3)2 (15.2% of the total). Additionally, the reaction of CaMg(CO3)2 with NO2 and SO2 can produces Ca(NO3)2, CaSO4, and Mg(NO3)2. Mg(NO3)2 was detected by the characteristic peak of the Raman spectra at 1071 cm−1 (Figure 1C), with 115 particles containing Mg(NO3)2 identified.
Silicates were not detected in this study, but an individual SiO2 particle was identified in OD1227 with a characteristic Raman band at 466 cm−1 (Figure 1D) [33]. A study using electron probe X-ray microanalysis (EPMA) in combination with micro-Raman spectroscopy detected silicates in Asian sand dust particles and stated that it was difficult to determine the presence of silicate minerals by micro-Raman spectroscopy alone [30].
Secondary inorganics, including NH4NO3 and (NH4)2SO4, are formed mainly through the reaction of nitrogen-containing and sulfur-containing gases with NH3. Both can be confirmed by the Raman bands at 1048 cm−1 and 980 cm−1, which are symmetric telescopic vibrations of NO3 and SO42− in NH4NO3 and (NH4)2SO4 (Figure 1E,F), respectively [34,35]. In addition, the presence of NH4+ in NH4NO3 and (NH4)2SO4 was confirmed by the broad peaks around 3134 cm−1 [34]. Of the total measured particles, only one was identified as (NH4)2SO4 particles, and 832 were identified as NH4NO3 particles. Both were either present alone or mixed internally in the individual particles. The number of particles containing NH4NO3 in the university classrooms (422) was higher than in the corresponding outdoor atmospheres (402). Likewise, the number of particles containing NH4NO3 in dwellings (244) was higher than the corresponding outdoor atmospheres (231). And the number of particles containing (NH4)2SO4 in dwellings (23) was higher than the corresponding outdoor atmospheres (16). These results indicate significantly higher amounts of NH4NO3 than (NH4)2SO4 indoors and outdoors. In addition, the number of particles containing NH3-salt was higher indoors than outdoors, possibly related to differences in ammonia emission sources.
Soot, as the main carbonaceous matter, was frequently detected in this study. It was confirmed by the broad peaks around 1355 cm−1 at the D band and 1592 cm−1 at the G band (Figure 1G) [36]. Soot is mainly produced by incomplete combustion, including diesel combustion, gasoline combustion, coal combustion, and biomass combustion [36]. Of the total measured particles, 12 particles were identified as soot; 244 particles contained both soot and other substances, suggesting that soot was predominantly in an internally mixed form in individual particles.
In this study, organics were confirmed by the C-H symmetric/asymmetric stretching vibration corresponding to the broad overlapping Raman peak at ∼2924 cm−1 (Figure 1H) [30]. In addition, peaks at 1444 cm−1 (CH2/terminal CH3 scissoring vibration) and 1660 cm−1 (C=C stretching vibration) were also observed in the Raman spectra of individual particles [37]. The presence of these characteristic Raman peaks was also found in the atmospheric single-particle study of Wang et al. [10]. It was found that 306 particles containing organics were detected in dwellings, while only 246 were detected in corresponding outdoor atmospheres, indicating a partial difference in the distribution of individual particles containing organics between indoors and outdoors. It may be related to anthropogenic activities indoors, as will be discussed in more detail in Section 3.2.
This study primarily analyzed particles larger than 1 μm; in fact, the presence of <1 μm particles in indoor atmospheres is also important, and these particles may have different chemical compositions, sources, and health effects. Future studies could consider combining multiple analytical techniques to cover a wider range of particle sizes to more accurately assess the health effects of indoor particles.

3.2. Comparison of Individual Particle Chemical Composition

Ca(NO3)2, Mg(NO3)2, and CaSO4 were frequently detected in individual particles indoors and outdoors. The percentage of particles containing Ca(NO3)2 and Mg(NO3)2 in total measured particles for each sample indoors and outdoors is shown in Figure 3. The percentage of particles containing Ca(NO3)2 in classrooms (6.7%, 2.5%, 2.5%, and 1.7%) and dwellings (7.5%, 32.5%, and 15.8%) was in most cases significantly lower than corresponding outdoor particles (classroom outdoors: 8.3%, 6.7%, 6.7%, and 6.7%; dwelling outdoors: 16.7%, 35.8%, and 12.5%) (Figure 3A,B). The particles containing Mg(NO3)2 followed a similar trend, showing a higher percentage in outdoor samples (Figure 3C,D). This difference may be related to the fact that the outdoor environment is more affected by mineral dust, while the protective effect of the building on the indoor environment can effectively block some of the penetration of outdoor mineral dust. In contrast to the trend of Ca(NO3)2 and Mg(NO3)2, the percentages of individual particles containing CaSO4 in the classroom were 16.7%, 18.3%, 61.7%, and 32.5%, respectively, which were significantly higher than the percentage of individual particles containing CaSO4 in corresponding outdoor atmospheres (14.2%, 12.5%, 34.2%, and 24.2%) (Figure 4). This may be related to the use of chalk in the classroom. CaSO4 is the main component of chalk, and chalk dust is suspended in the air to form aerosolized particles [38].
The percentage of particles containing nitrate indoors (including classrooms and dwellings) was generally high, reaching more than 80% in most samples, and in some cases even exceeding 90%, suggesting that nitrate is a major component of the chemical composition of individual indoor particles (Table 1 and Table 2). In addition, more than 80% of the nitrate-containing particles were NH4NO3. In the classroom sampling on 19 November and 12 December, and the residential sampling on 24 December and 27 December, the percentage of individual particles containing NH4NO3 in the indoor atmospheres was higher than that in the corresponding outdoor atmospheres (Figure 5). This result differs from the study by Lunden et al. and may be related to the difference in experimental conditions; the previous study was conducted in vacant dwellings, whereas the dwellings in the present study had continuous normal anthropogenic activity [39]. Long-term exposure to NH4NO3 aerosols may have chronic effects on respiratory health, such as an increased risk of respiratory disease [39]. Ammonia can be released from the use of cleaning agents, while low indoor ventilation rates in fall and winter can result in the production of ammonia and nitric acid that cannot be expelled in a timely manner [17].
The percentage of particles containing organics in dwellings was above 80%, higher than the corresponding outdoor particles (Figure 6), suggesting that organics are the dominant component of the chemical composition of individual indoor particles. Prolonged exposure to organic aerosols may cause respiratory and cardiovascular diseases [40]. Although it is difficult to distinguish between primary and secondary organic aerosols using micro-Raman spectroscopy, it has been demonstrated through the use of other analytical techniques that the increase of particles containing organics indoors is influenced by the air-particle partitioning of indoor SVOCs [41]. This process is influenced by both outdoor air pollution infiltration and the daily activities of residents (e.g., cooking or cleaning) [19,42]. In the absence of significant indoor activity, SVOCs are predominantly present in the gaseous phase, while cooking significantly increases the percentage of SVOCs in the particulate phase [41]. It was observed that cooking activities occurred daily in the dwellings during the sampling period of this study. Notably, organics from cooking are significantly affected by the type of food: foods with a high fat content have a higher emission rate compared to low-fat foods [42]. Different cooking methods also contribute to the differences in emissions: western cooking (dominated deep-frying, roasting, and stewing) tends to produce saturated fatty acids such as palmitic acid and stearic acid, while Chinese cooking (dominated stir-frying, steaming, and stewing) is more likely to produce unsaturated fatty acids such as oleic acid and linoleic acid [42]. The Raman characteristic peaks of the individual particles containing organics observed in this study are shown in Figure 7. The Raman peaks at 3005 cm−1 (=C-H stretching vibration), 1660 cm−1, and 1444 cm−1 were identified in individual particles, and these characteristic peaks also appeared in the Raman spectra of oleic acid and palmitoleic acid standard samples [37]. In addition, the Raman shift at ~2934 cm−1 was detected, which was also found in the standard spectra of palmitoleic acid. In particular, the Raman signal at the 2800–3100 cm−1 was detected more frequently in particles collected in the kitchen, further suggesting the influence of cooking activities on organics in individual particles [43].
Other indoor activities may also cause an increase in indoor organics. For example, smoking may produce the volatile substance nicotine, pesticide use may produce N,N-diethyl-3-methylbenzamide (DEET), and cleaning agent use may produce volatile organic compounds (VOCs) such as limonene and phthalates [41]. It was observed that there was no pesticide use or smoking habits in the residences during the sampling period of this study, so indoor organics may be less affected by smoking and pesticides. However, detergents were used, so the increase of particles containing organics indoors may be influenced by the use of detergents.
The effect of temperature on organics indoors has also been of interest. During the measurement of SVOCs, although the temperature did not show a significant correlation with the particle fraction of SVOCs, it may still have some effect on their partitioning behavior in a specific volatility range. In the case of diethylhexyl phthalate (DEHP), for example, lower temperatures are more favorable for its partitioning in the particulate phase, but this temperature effect is much less significant than that of the particle concentration [44]. When the PM2.5 concentration exceeded 3 μg/m3, DEHP existed mainly in the particulate state, and the content of low volatile organic compounds (LVOCs) was significantly and positively correlated with the particulate concentration [44,45]. During the sampling period, the dwelling was not completely enclosed (windows and doors were kept closed on the day of sampling, and no tape was used to seal gaps). Outdoor particulate matter concentrations are used as a reference. The data showed that the hourly outdoor PM2.5 concentrations were 49 μg/m3 and 44 μg/m3 at the time of sampling on December 24th and 27th, respectively, which were both above 3 μg/m3. This suggests that particulate matter concentrations may influence the percentage of organic matter in indoor particles.
Although it is difficult to distinguish secondary organic aerosols (SOA) by Raman spectroscopy, it has been shown that the increase of particles containing organics indoors may be closely related to the oxidative process of particles and the formation of SOA [20]. For example, (NH4)2SO4 aerosol can act as a condensation nucleus to promote the condensation of LVOCs, thus accelerating SOA production [26]. Mixed inorganic and organic particles were observed in this study, as in Figure 2.

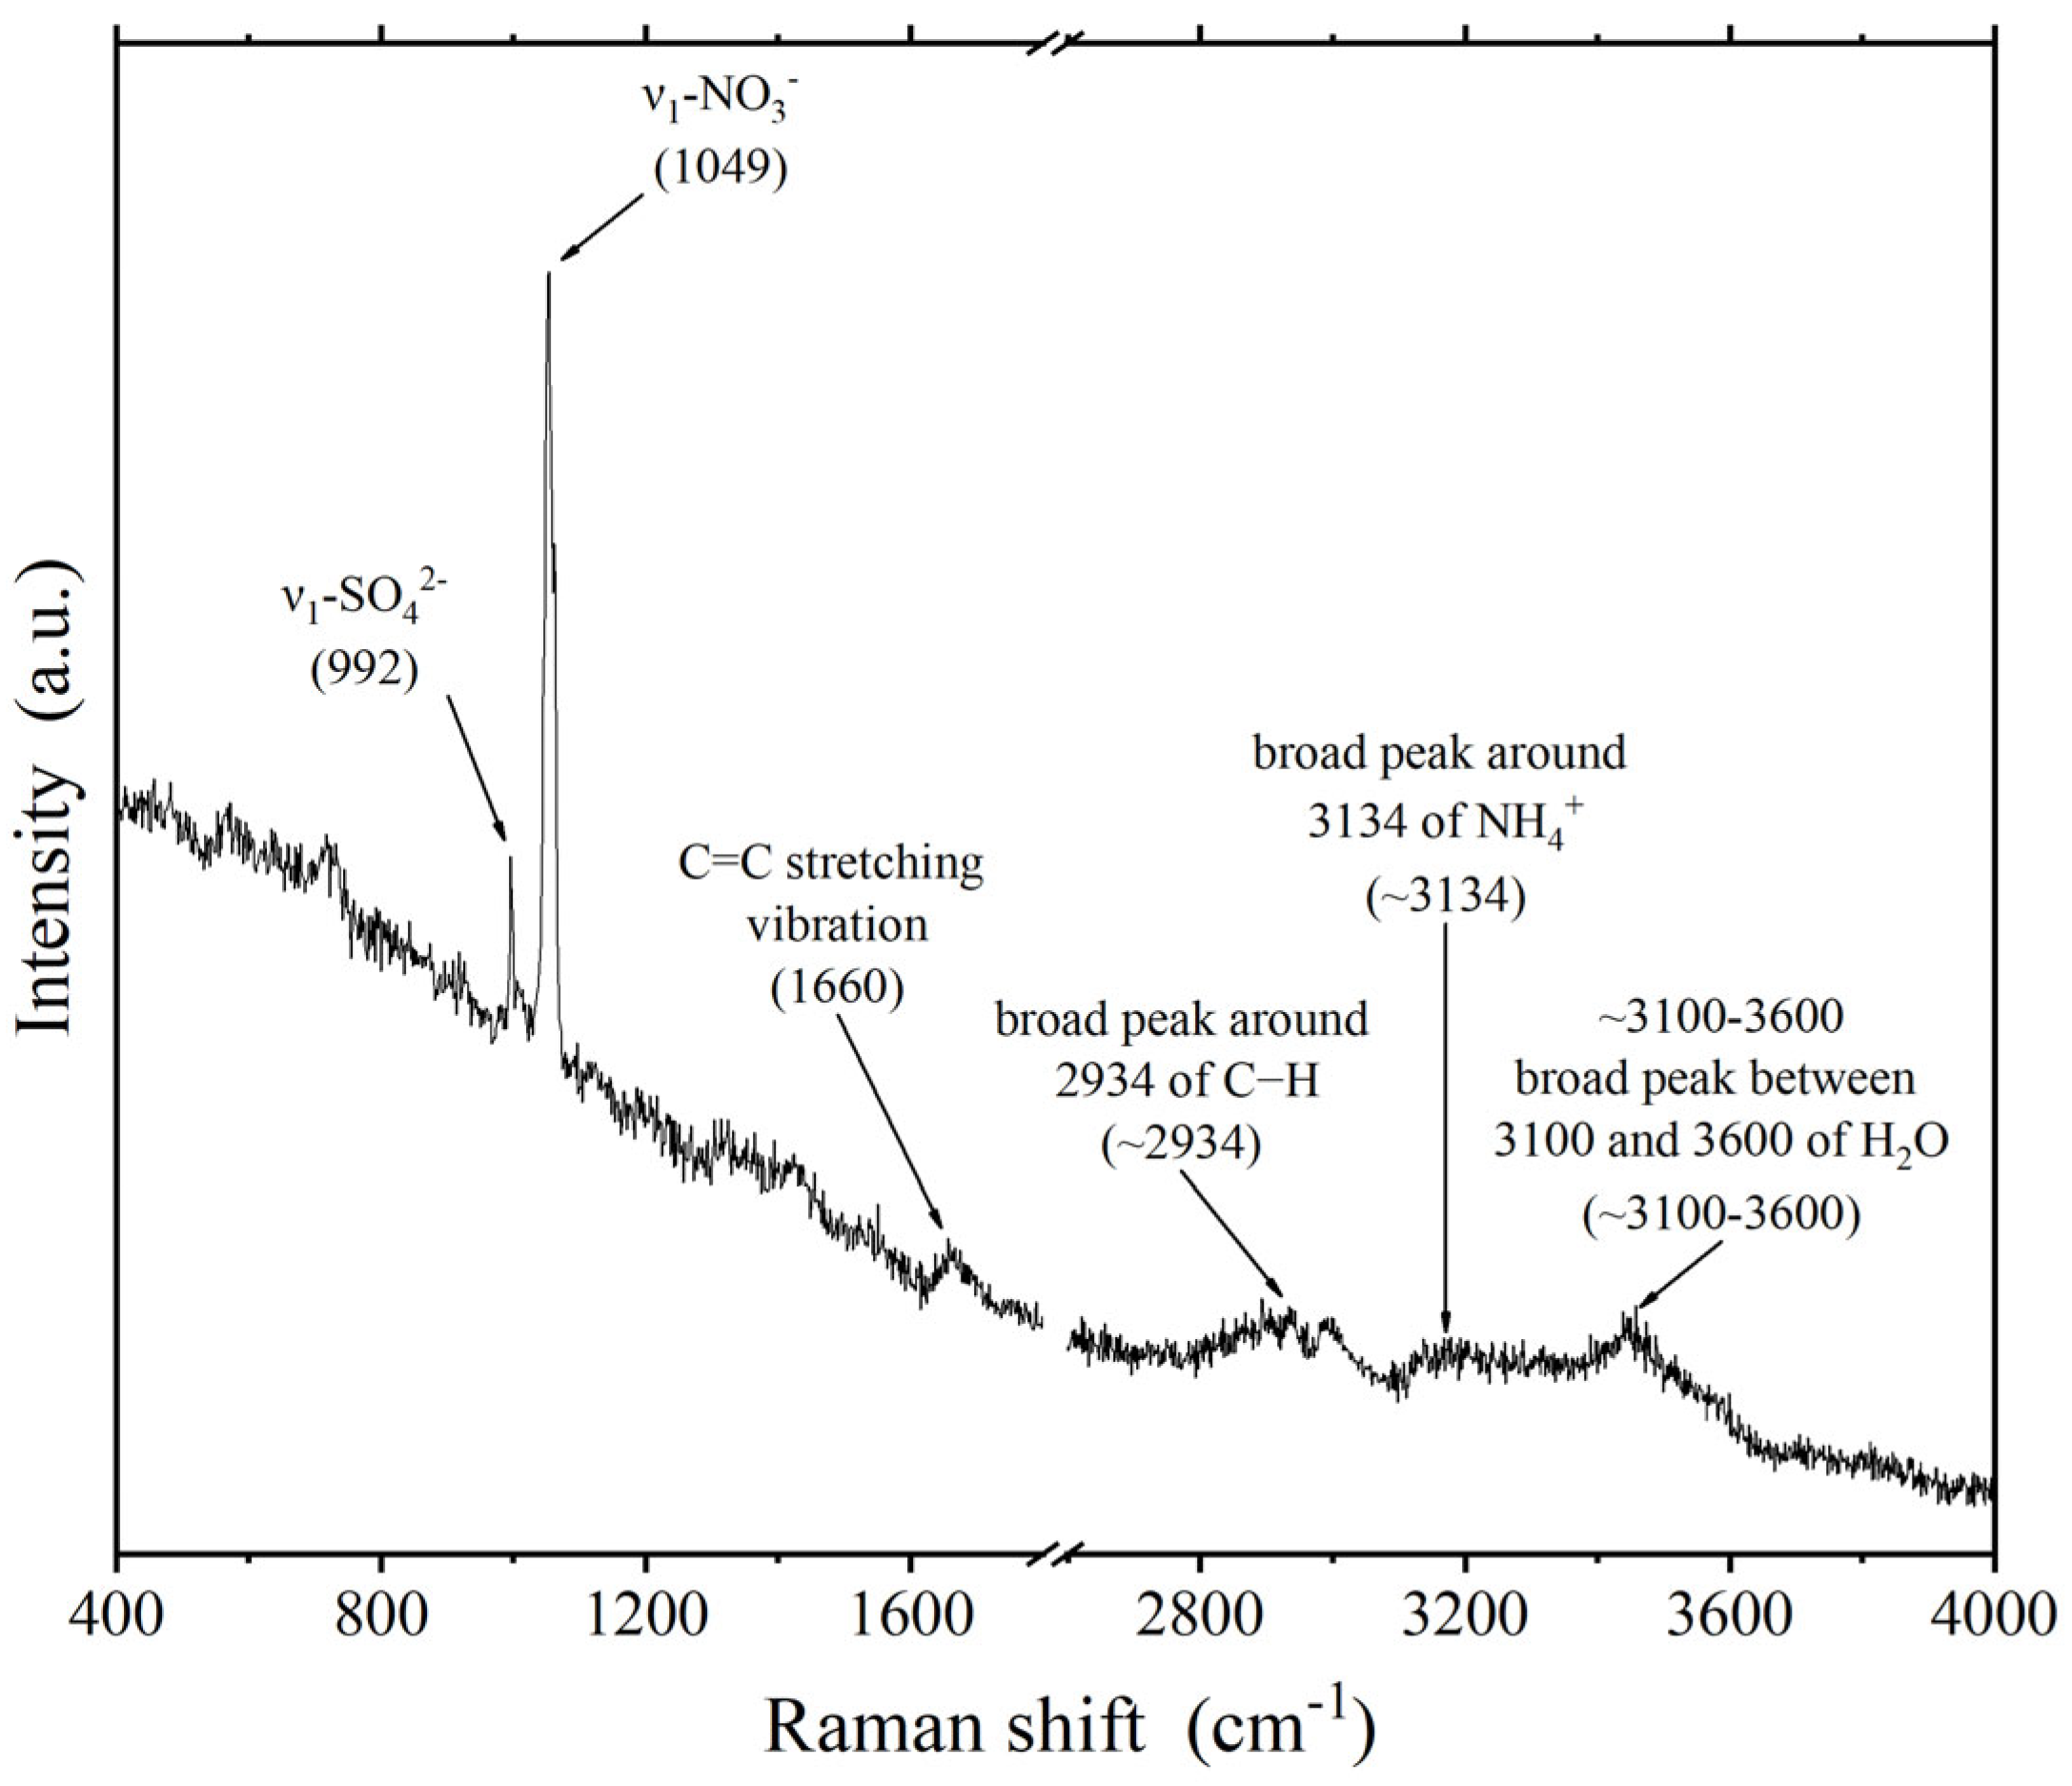
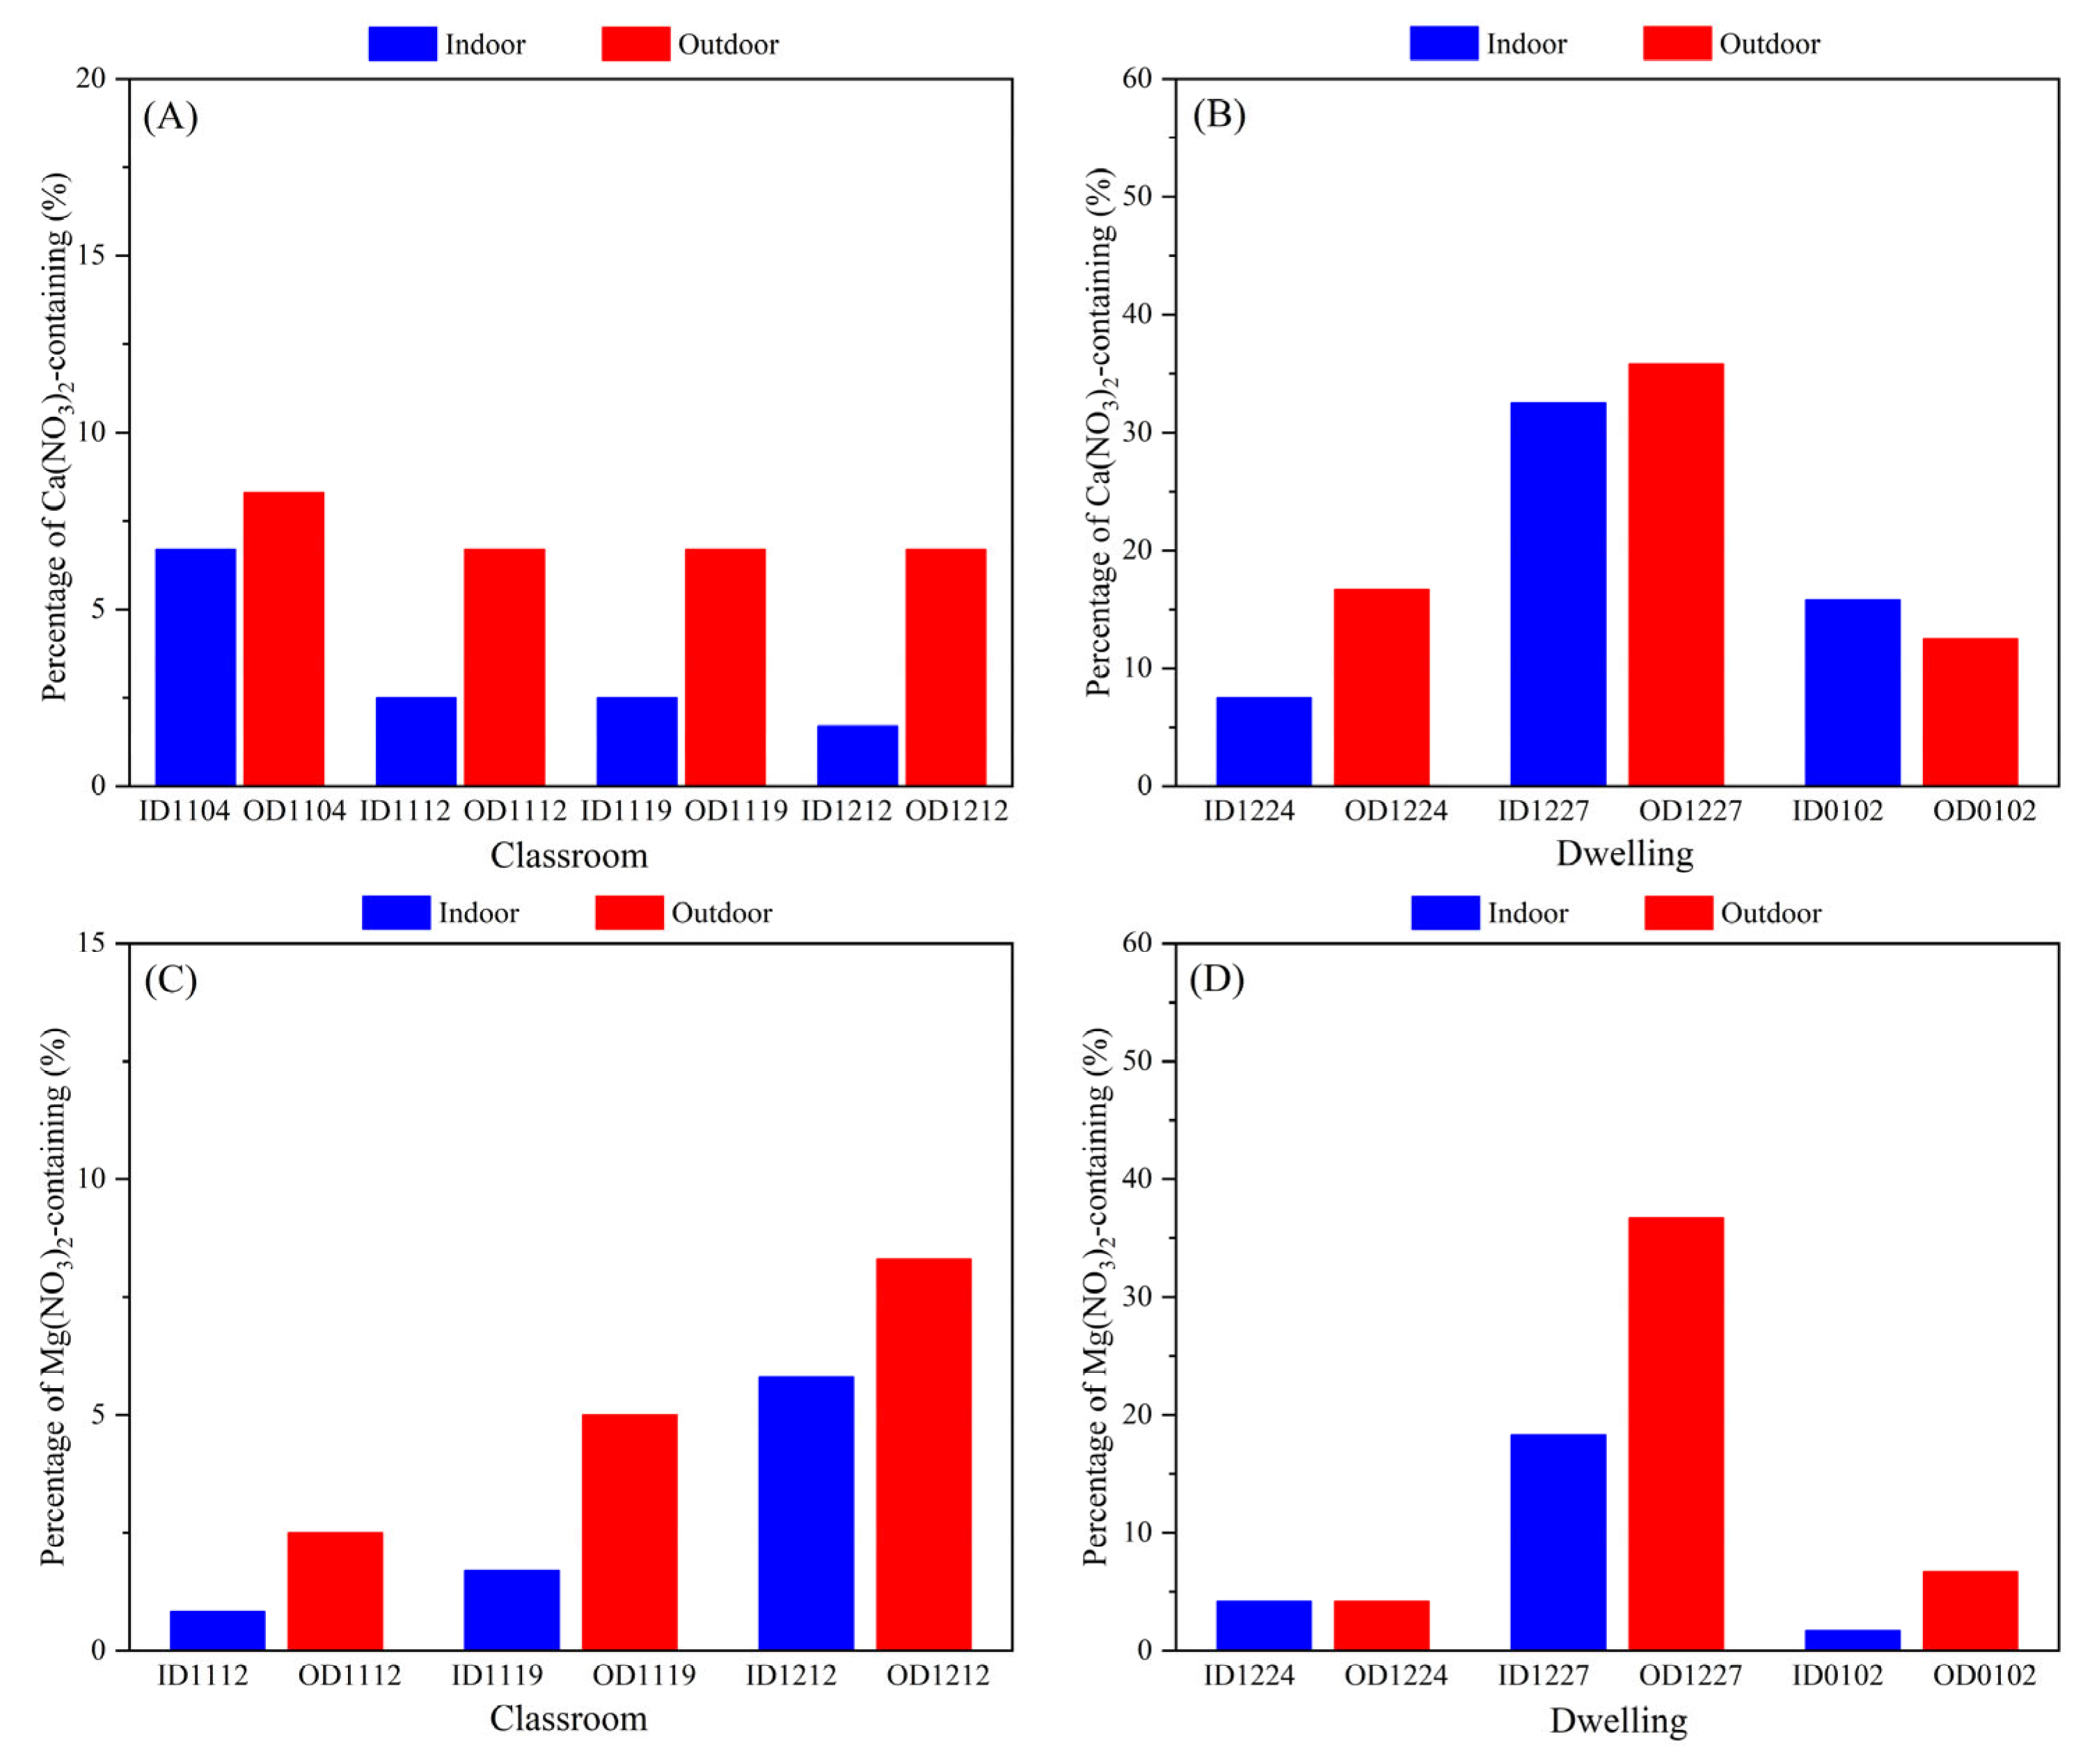
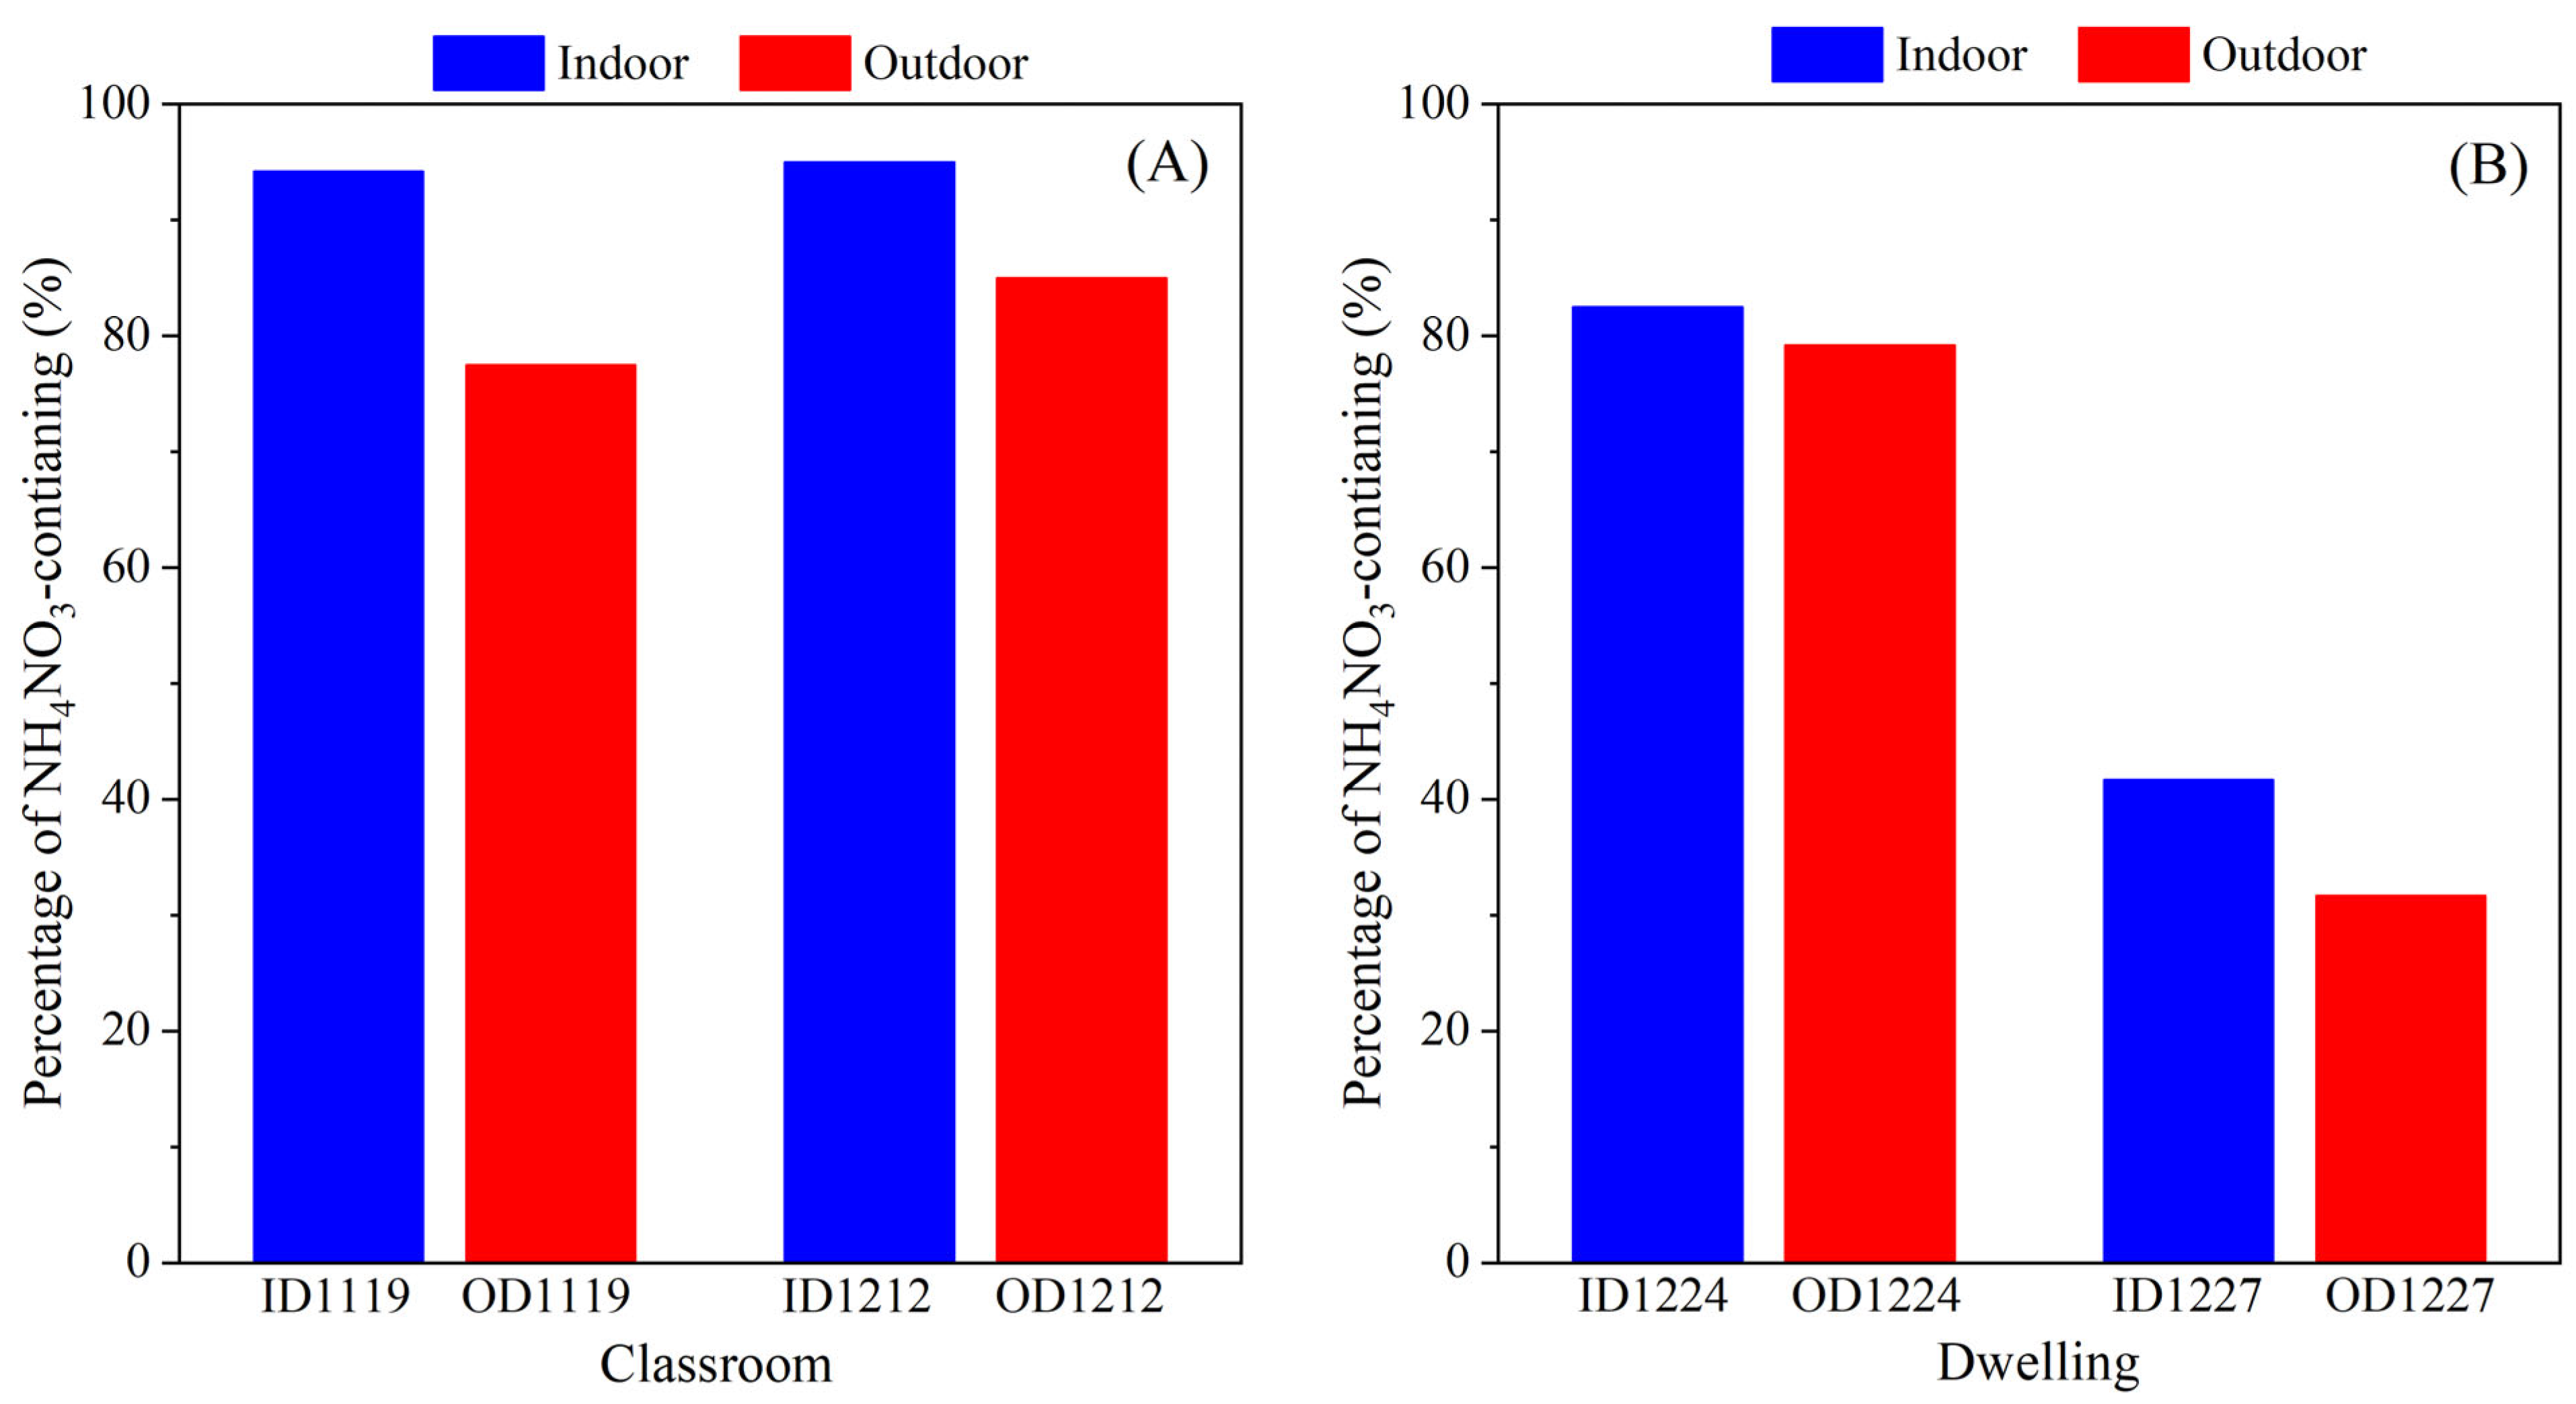
3.3. Inorganics with Different Mixing States

If the individual particle contains more than one chemical species, it is an internally mixed particle. Nitrate, sulfate, and carbonate were either present in individual particles alone, in pairs, or all three together in an individual particle. Figure S5 shows mixed inorganic particles found in individual particles indoors and outdoors. These mixed particles were also detected in the study on outdoor individual particles by Wang et al. [10]. In addition to these typically internally mixed particles, a large number of Ca2+-salt and NH3-salts were found mixed in individual particles in the indoor environment. These included internally mixed CaCO3/NH4NO3 particles, internally mixed CaCO3/CaSO4/NH4NO3 particles, internally mixed CaSO4/NH4NO3 particles, and internally mixed CaSO4•2H2O/NH4NO3/(NH4)2SO4 particles. The number of particles containing these mixing states in indoor particles was higher than in the corresponding outdoor particles. The formation of these mixed particles may be associated with particle coalescence, coagulation, and surface adsorption, indicating the complexity of indoor particle sources and formation processes.
Internally mixed CaSO4/NH4NO3 particles were frequently detected in indoor environments (Figure 8A), especially in classrooms. Possible reasons for the formation of these mixed particles are guessed to be the following: (1) collision-coalescence of particles: Gypsum in suspended chalk dust may collide with NH4NO3 already produced indoors, which then coalesces within the same particles to form internal mixing. (2) chemical reaction: Acid gases (e.g., gaseous nitric acid) and NH3 are first adsorbed on the surface of gypsum, followed by a chemical reaction to form NH4NO3, which in turn forms internal mixed particles [46]; (3) photolysis of nitrate: Under indoor light conditions, the nitrate adsorbed on the surface may undergo photolysis to produce NO2 and other intermediate products, which may further react with water molecules on the surface of the gypsum to produce NH4NO3 [47,48]. (4) Temperature fluctuations may influence the stability of NH4NO3 [39]. For example, at lower temperatures, NH4NO3 is more likely to crystallize and adsorb on the gypsum surface.
Raman characteristic peaks at 1048, 980, and 1010 cm−1 were detected in the same individual particle, confirming the presence of internally mixed CaSO4•2H2O/NH4NO3/(NH4)2SO4 particles (Figure 8B). The presence of the complex salt (NH4)2Ca(SO4)2·H2O was detected in other studies, confirmed by Raman shifts at 994 cm−1 and 978 cm−1 [1]. In our study, no Raman shifts proving the presence of complex salts were found in the spectra of internally mixed CaSO4•2H2O/NH4NO3/(NH4)2SO4 particles. This could be attributed to the lower relative humidity at the time of laboratory measurements in this study [1].

3.4. Carbonaceous Matter with Different Mixing States

In indoor environments, soot can be present alone or mixed with inorganics in individual particles. Of the particles containing soot in the classroom, 5.8% were mixed soot/organics particles, 25.0% were mixed soot/inorganics particles, and 67.6% were mixed soot/organics/inorganics particles; of the particles containing soot in the dwelling, 6.7% were mixed soot/organics particles, 8.3% were mixed soot/inorganics particles, and 76.7% were mixed soot/organics/inorganics particles. Soot and inorganic particles may undergo atmospheric condensation and coagulation, forming internally mixed soot/inorganic particles [10]. Internally mixed soot/inorganics particles may be formed by adsorption and coalescence of soot, organic, and inorganic particles [49]. This indicates that soot is mainly internally mixed. Our study focused on single-particle analysis in the 1–10 µm range, whereas submicron soot may exhibit different mixing states, which can be further explored in future studies by other single-particle analysis techniques (e.g., single-particle aerosol mass spectrometry (SPAMS)).
Raman peaks for C-H groups and inorganics were detected in individual particles (Figure 2). This suggests that organics and inorganics can mix internally in individual particles. Organics can be present alone or mixed internally with inorganics in an individual particle; 99% of the particles containing organics in the classroom also contained inorganics, including nitrates, sulfates, and carbonates; 96% of the particles containing organics in the dwelling also contained inorganics, indicating that organics in individual particles are almost entirely mixed with inorganics.
Mixed (NH4)2SO4/organics particles and mixed NH4NO3/(NH4)2SO4/organics particles were detected in indoor mixed organics/inorganics particles, which were also observed in a previous study using TEM-EDX [29]. Organics may attach to the surface of inorganic particles such as (NH4)2SO4 by adsorption. For example, a study on indoor emissions released (NH4)2SO4 particles indoors and found that indoor organics concentrations decreased while the mass of (NH4)2SO4 particles increased, suggesting that the increase in the mass of (NH4)2SO4 particles may be related to organics [26]. Additionally, the presence of amino acids was found in mixed organics/inorganics within the classroom. As shown in Figure 9, the characteristic Raman peak in blue font in the figure corresponds to the characteristic Raman peak of alanine [50]. This may originate from human skin or hair.

4. Conclusions

In this study, the chemical composition and mixing state of individual particles in the classroom, residential, and corresponding outdoor environments were systematically analyzed using micro-Raman spectroscopy. A total of 1680 individual particles were examined, and significant differences in the chemical composition of indoor and outdoor particles were found. Due to human activities such as the use of chalk and cooking, the percentage of particles containing calcium sulfate in classrooms and the percentage of particles containing organics in dwellings were higher than the corresponding outdoor environments. It was also found that calcium and ammonium salts often exist in internally mixed forms in the indoor environment, such as internally mixed CaSO4/NH4NO3 particles, the formation of which may be related to particle collisions, surface adsorption, and chemical reactions. These reveal the complexity of indoor particle sources and formation. In university classrooms and residential indoor environments, 67.6% and 76.7% of particles containing soot also contained organics and inorganics, respectively, suggesting that soot is mixed primarily with organics and inorganics. Furthermore, 99% and 96% of the particles containing organics also included inorganics in university classrooms and residential indoor environments.

Supplementary Materials

The following supporting information can be downloaded at: https://www.mdpi.com/article/10.3390/atmos16060707/s1, Figure S1: Atmospheric samplers and sampling heads; Figure S2: Optical images of an area of ID1119. The plotting scales in images are 2 μm; Figure S3: Raman spectrum of the blank gold-coated silicon wafers (without particles) at 532 nm laser; Figure S4: The number percentages of individual particles in each size range; Figure S5: Raman spectra of (A) internally mixed NH4NO3/(NH4)2SO4 particle, (B) internally mixed CaCO3/Ca(NO3)2 particle, (C) internally mixed Ca(NO3)2/CaSO4 particle, (D) internally mixed Ca(NO3)2/Mg(NO3)2 particle identified in this study, respectively; Table S1: Hourly concentrations of pollutants and meteorological parameters during the sampling period; Table S2: End time of sampling and Raman measurements for each sample, sampling locations, and experimental condition at the time of measurement; Table S3: Raman peaks of the measured individual atmospheric particles indoors and outdoors and the corresponding chemical substances identified.

Author Contributions

Conceptualization, M.W.; methodology, Y.H. and Q.L.; validation, J.W. and L.Y.; formal analysis, Y.H., J.W. and L.Y.; investigation, Q.L., L.Z. and P.X.; data curation, Y.H.; writing—original draft preparation, Y.H.; writing—reviewing and editing, Y.H., Q.L., J.W., L.Y., L.Z., P.X. and M.W.; visualization, Y.H.; supervision, M.W.; project administration, Q.L.; funding acquisition, M.W. All authors have read and agreed to the published version of the manuscript.

Funding

This research was funded by the Ministry of Science and Technology of the People’s Republic of China, grant number 2022YFC3900802.

Institutional Review Board Statement

Not applicable.

Informed Consent Statement

Not applicable.

Data Availability Statement

The raw data supporting the conclusions of this article will be made available by the authors upon reasonable request.

Acknowledgments

The authors would like to thank the anonymous reviewers, whose comments have improved the quality of this paper.

Conflicts of Interest

The authors declare no conflicts of interest. The funders had no role in the design of this study; in the collection, analyses, or interpretation of data; in the writing of this manuscript; or in the decision to publish the results.

References

  1. Jentzsch, P.V.; Bolanz, R.M.; Ciobota, V.; Kampe, B.; Rosch, P.; Majzlan, J.; Popp, J. Raman spectroscopic study of calcium mixed salts of atmospheric importance. Vib. Spectrosc. 2012, 61, 206–213. [Google Scholar] [CrossRef]
  2. Azimi, P.; Stephens, B. A framework for estimating the US mortality burden of fine particulate matter exposure attributable to indoor and outdoor microenvironments. J. Expo. Sci. Environ. Epidemiol. 2018, 30, 271–284. [Google Scholar] [CrossRef] [PubMed]
  3. Chen, X.; Han, Y.Q.; Chen, W.; Wang, Y.W.; Qiu, X.H.; Li, W.J.; Hu, M.; Wu, Y.S.; Wang, Q.; Zhang, H.X.Y.; et al. Respiratory inflammation and short-term ambient air pollution exposures in adult Beijing residents with and without prediabetes: A panel study. Environ. Health Perspect. 2020, 128, 067004. [Google Scholar] [CrossRef]
  4. Block, M.L.; Calderón-Garciduenas, L. Air pollution: Mechanisms of neuroinflammation and CNS disease. Trends Neurosci. 2009, 32, 506–516. [Google Scholar] [CrossRef]
  5. Zhang, J.K.; Su, Y.F.; Chen, C.Y.; Fu, X.Y.; Long, Y.H.; Peng, X.X.; Huang, X.J.; Wang, G.H.; Zhang, W. Insights into the seasonal characteristics of single particle aerosols in Chengdu based on SPAMS. J. Environ. Sci. 2025, 149, 431–443. [Google Scholar] [CrossRef]
  6. Zhang, N.; Maung, M.W.; Win, M.S.; Feng, J.L.; Yao, X.H. Carbonaceous aerosol and inorganic ions of PM2.5 in Yangon and Mandalay of Myanmar: Seasonal and spatial variations in composition and sources. Atmos. Pollut. Res. 2022, 13, 101444. [Google Scholar] [CrossRef]
  7. Xiong, C.; Chen, X.Y.; Ding, X.L.; Kuang, B.Y.; Pei, X.Y.; Xu, Z.N.; Yang, S.K.; Hu, H.; Wang, Z.B. Reconsideration of surface tension and phase state effects on cloud condensation nuclei activity based on the atomic force microscopy measurement. Atmos. Chem. Phys. 2022, 22, 16123–16135. [Google Scholar] [CrossRef]
  8. Moorchilot, V.S.; Aravind, U.K.; Menacherry, S.P.M.; Aravindakumar, C.T. Single-particle analysis of atmospheric aerosols: Applications of Raman spectroscopy. Atmosphere 2022, 13, 1779. [Google Scholar] [CrossRef]
  9. Wang, W.H.; Shao, L.Y.; Zhang, D.Z.; Li, Y.W.; Li, W.J.; Liu, P.J.; Xing, J.P. Mineralogical similarities and differences of dust storm particles at Beijing from deserts in the north and northwest. Sci. Total Environ. 2022, 803, 149980. [Google Scholar] [CrossRef]
  10. Wang, M.J.; Zheng, N.; Zhao, D.F.; Shang, J.; Zhu, T. Using micro-Raman spectroscopy to investigate chemical composition, mixing states, and heterogeneous reactions of individual atmospheric particles. Environ. Sci. Technol. 2021, 55, 10243–10254. [Google Scholar] [CrossRef]
  11. Xu, L.; Liu, L.; Zhang, J.; Zhang, Y.; Ren, Y.; Wang, X.; Li, W. Morphology, composition, and mixing state of individual aerosol particles in northeast China during wintertime. Atmosphere 2017, 8, 47. [Google Scholar] [CrossRef]
  12. Ibrahim, F.; Samsudin, E.Z.; Ishak, A.R.; Sathasivam, J. Hospital indoor air quality and its relationships with building design, building operation, and occupant-related factors: A mini-review. Front. Public Health 2022, 10, 1067764. [Google Scholar] [CrossRef] [PubMed]
  13. Vance, M.E.; Pegues, V.; Van Montfrans, S.; Leng, W.; Marr, L.C. Aerosol Emissions from Fuse-Deposition Modeling 3D Printers in a Chamber and in Real Indoor Environments. Environ. Sci. Technol. 2017, 51, 9516–9523. [Google Scholar] [CrossRef]
  14. Oeder, S.; Dietrich, S.; Weichenmeier, I.; Schober, W.; Pusch, G.; Jörres, R.A.; Schierl, R.; Nowak, D.; Fromme, H.; Behrendt, H.; et al. Toxicity and elemental composition of particulate matter from outdoor and indoor air of elementary schools in Munich, Germany. Indoor Air 2012, 22, 148–158. [Google Scholar] [CrossRef] [PubMed]
  15. Lin, L.Y.; Lee, C.Y.; Zhang, Y.R.; Bai, H.L. Aerosol-assisted deposition of Mn-Fe oxide catalyst on TiO2 for superior selective catalytic reduction of NO with NH3 at low temperatures. Catal. Commun. 2018, 111, 36–41. [Google Scholar] [CrossRef]
  16. Hu, Y.; Zhao, B. Indoor sources strongly contribute to exposure of Chinese urban residents to PM2.5 and NO2. J. Hazard. Mater. 2022, 426, 127829. [Google Scholar] [CrossRef]
  17. Goldstein, A.H.; Nazaroff, W.W.; Weschler, C.J.; Williams, J. How do indoor environments affect air pollution exposure? Environ. Sci. Technol. 2020, 55, 100–108. [Google Scholar] [CrossRef]
  18. Raju, S.; Woo, H.; Koehler, K.; Fawzy, A.; Liu, C.; Putcha, N.; Balasubramanian, A.; Peng, R.D.; Lin, C.T.; Lemoine, C.; et al. Indoor air pollution and impaired cardiac autonomic function in chronic obstructive pulmonary disease. Am. J. Respir. Crit. Care Med. 2023, 207, 721–730. [Google Scholar] [CrossRef]
  19. Masoud, C.G.; Li, Y.; Wang, D.S.; Katz, E.F.; DeCarlo, P.F.; Farmer, D.K.; Vance, M.E.; Shiraiwa, M.; Hildebrandt Ruiz, L. Molecular composition and gas-particle partitioning of indoor cooking aerosol: Insights from a FIGAERO-CIMS and kinetic aerosol modeling. Aerosol Sci. Technol. 2022, 56, 1156–1173. [Google Scholar] [CrossRef]
  20. Pothier, M.A.; Boedicker, E.; Pierce, J.R.; Vance, M.; Farmer, D.K. From the HOMEChem frying pan to the outdoor atmosphere: Chemical composition, volatility distributions and fate of cooking aerosol. Environ. Sci. Process. Impacts 2023, 25, 314–325. [Google Scholar] [CrossRef]
  21. Patel, S.; Sankhyan, S.; Boedicker, E.K.; DeCarlo, P.F.; Farmer, D.K.; Goldstein, A.H.; Katz, E.F.; Nazaroff, W.W.; Tian, Y.; Vanhanen, J.; et al. Indoor Particulate Matter during HOMEChem: Concentrations, Size Distributions, and Exposures. Environ. Sci. Technol. 2020, 54, 7107–7116. [Google Scholar] [CrossRef]
  22. Zhang, M.Y.; Shao, L.Y.; Jones, T.; Feng, X.L.; Ge, S.Y.; Yang, C.X.; Cao, Y.X.; BeruBe, K.; Zhang, D.Z. Atmospheric iron particles in PM2.5 from a subway station, Beijing, China. Atmos. Environ. 2022, 283, 119175. [Google Scholar] [CrossRef]
  23. Yan, L.; Cheng, Y.; Wu, F.; Chang, H.; Liu, S.; Wang, Y.L.; Yu, C.W.; Zhang, Y.W. Microscopic morphology and elemental composition of atmospheric particles from seven micro-environments in Xi’an. Indoor Built Environ. 2019, 28, 1237–1253. [Google Scholar] [CrossRef]
  24. Li, J.Y.; Xu, W.Q.; Li, Z.J.; Duan, M.Z.; Ouyang, B.; Zhou, S.; Lei, L.; He, Y.; Sun, J.X.; Wang, Z.F.; et al. Real-time characterization of aerosol particle composition, sources and influences of increased ventilation and humidity in an office. Indoor Air 2021, 31, 1364–1376. [Google Scholar] [CrossRef]
  25. Perrino, C.; Pelliccioni, A.; Tofful, L.; Canepari, S. Indoor PM10 in university classrooms: Chemical composition and source behavior. Atmos. Environ. 2022, 287, 119260. [Google Scholar] [CrossRef]
  26. Sheu, R.; Fortenberry, C.F.; Walker, M.J.; Eftekhari, A.; Stonner, C.; Bakker, A.; Peccia, J.; Williams, J.; Morrison, G.C.; Williams, B.J.; et al. Evaluating indoor air chemical diversity, indoor-to-outdoor emissions, and surface reservoirs using high-resolution mass spectrometry. Environ. Sci. Technol. 2021, 55, 10255–10267. [Google Scholar] [CrossRef]
  27. Xing, F.Y.; Xu, X.M.; Hu, Z.M.; Wen, X.; Duan, W.M.; Pang, X.B.; Fan, M.K. Characterization of PM2.5 composition and mixing state during haze events in Chengdu using Micro-Raman spectroscopy. Atmos. Pollut. Res. 2025, 16, 102411. [Google Scholar] [CrossRef]
  28. Zhao, D.F.; Zhu, T.; Chen, Q.; Liu, Y.J.; Zhang, Z.F. Raman micro-spectrometry as a technique for investigating heterogeneous reactions on individual atmospheric particles. Sci. China Chem. 2011, 54, 154–160. [Google Scholar] [CrossRef]
  29. Geng, H.; Jin, C.S.; Zhang, D.P.; Wang, S.R.; Xu, X.T.; Wang, S.R.; Xu, X.T.; Wang, X.R.; Zhang, Y.; Wu, L.; et al. Characterization of size-resolved urban haze particles collected in summer and winter at Taiyuan City, China using quantitative electron probe X-ray microanalysis. Atmos. Res. 2017, 190, 29–42. [Google Scholar] [CrossRef]
  30. Eom, H.J.; Gupta, D.; Cho, H.R.; Hwang, H.J.; Do Hur, S.; Gim, Y.; Ro, C.U. Single-particle investigation of summertime and wintertime Antarctic Sea spray aerosols using low-Z particle EPMA, Raman microspectrometry, and ATR-FTIR imaging techniques. Atmos. Chem. Phys. 2016, 16, 13823–13836. [Google Scholar] [CrossRef]
  31. Deng, C.H.; Brooks, S.D.; Vidaurre, G.; Thornton, D.C.O. Using Raman microspectroscopy to determine chemical composition and mixing state of airborne marine aerosols over the Pacific Ocean. Aerosol Sci. Technol. 2013, 48, 193–206. [Google Scholar] [CrossRef]
  32. Yu, T.; Zhao, D.F.; Song, X.J.; Zhu, T. NO2-initiated multiphase oxidation of SO2 by O2 on CaCO3 particles. Atmos. Chem. Phys. 2018, 18, 6679–6689. [Google Scholar] [CrossRef]
  33. Sobanska, S.; Hwang, H.; Choel, M.; Jung, H.J.; Eom, H.J.; Kim, H.; Barbillat, J.; Ro, C.U. Investigation of the chemical mixing state of individual Asian dust particles by the combined use of electron probe X-ray microanalysis and Raman microspectrometry. Anal. Chem. 2012, 84, 3145–3154. [Google Scholar] [CrossRef]
  34. Guo, X.; Tan, S.H.; Shang, Z.J.; Guo, Y.C.; Zhang, Y.H. Confocal Raman spectroscopy studies on the interactions between NH4+, NO3 and H2O in supersaturated NH4NO3 droplets. Acta Phys.-Chim. Sin. 2012, 28, 766–772. [Google Scholar] [CrossRef]
  35. Chu, Y.X.; Chan, C.K. Reactive uptake of dimethylamine by ammonium sulfate and ammonium sulfate-sucrose mixed particles. J. Phys. Chem. A 2016, 121, 206–215. [Google Scholar] [CrossRef]
  36. Feng, Y.Q.; Liu, L.; Yang, Y.; Deng, Y.; Li, K.J.; Cheng, H.Y.; Dong, X.; Li, W.J.; Zhang, L.W. The application of Raman spectroscopy combined with multivariable analysis on source apportionment of atmospheric black carbon aerosols. Sci. Total Environ. 2019, 685, 189–196. [Google Scholar] [CrossRef]
  37. Czamara, K.; Majzner, K.; Pacia, M.Z.; Kochan, K.; Kaczor, A.; Baranska, M. Raman spectroscopy of lipids: A review. J. Raman Spectrosc. 2014, 46, 4–20. [Google Scholar] [CrossRef]
  38. Mbazima, S.J.; Moolla, R.; Joseph, J.S. Release and health outcomes of exposure to chalk particles in classrooms: A systematic literature review. Int. J. Environ. Health Res. 2024, 34, 3515–3539. [Google Scholar] [CrossRef]
  39. Lunden, M.M.; Revzan, K.L.; Fischer, M.L.; Thatcher, T.L.; Littlejohn, D.; Hering, S.V.; Brown, N.J. The transformation of out-door ammonium nitrate aerosols in the indoor environment. Atmos. Environ. 2003, 37, 5633–5644. [Google Scholar] [CrossRef]
  40. Kumar, S.; Dwivedi, S.K. Chemical and biological components of atmospheric particulate matter and their impacts on human health and crops: A review. Aerobiologia 2022, 38, 287–327. [Google Scholar] [CrossRef]
  41. Kristensen, K.; Lunderberg, D.M.; Liu, Y.J.; Misztal, P.K.; Tian, Y.L.; Arata, C.; Nazaroff, W.W.; Goldstein, A.H. Gas-Particle partitioning of semivolatile organic compounds in a residence: Influence of particles from candles, cooking, and outdoors. Environ. Sci. Technol. 2023, 57, 3260–3269. [Google Scholar] [CrossRef] [PubMed]
  42. Abdullahi, K.L.; Delgado-Saborit, J.M.; Harrison, R.M. Emissions and indoor concentrations of particulate matter and its spe-cific chemical components from cooking: A review. Atmos. Environ. 2013, 71, 260–294. [Google Scholar] [CrossRef]
  43. Fankhauser, A.M.; Butman, J.L.; Cooke, M.E.; Fyodorova, Y.; Liu, Y.D.L.; O’Brien, R.E.; Mcneill, V.F.; Geiger, F.M.; Grassian, V.H.; Ault, A.P. Indoor surface chemistry variability: Microspectroscopic analysis of deposited particles in dwellings across the United States. Environ. Sci. Process. Impacts 2025. [Google Scholar] [CrossRef] [PubMed]
  44. Lunderberg, D.M.; Kristensen, K.; Liu, Y.J.; Misztal, P.K.; Tian, Y.L.; Arata, C.; Wernis, R.; Kreisberg, N.; Nazaroff, W.W.; Goldstein, A.H. Characterizing airborne phthalate concentrations and dynamics in a normally occupied residence. Environ. Sci. Technol. 2019, 53, 7337–7346. [Google Scholar] [CrossRef]
  45. Lunderberg, D.M.; Kristensen, K.; Tian, Y.L.; Arata, C.; Misztal, P.K.; Liu, Y.J.; Kreisberg, N.; Katz, E.F.; DeCarlo, P.F.; Patel, S.; et al. Surface emissions modulate indoor SVOC concentrations through volatility-dependent partitioning. Environ. Sci. Technol. 2020, 54, 6751–6760. [Google Scholar] [CrossRef]
  46. Nazaroff, W.W.; Weschler, C.J. Indoor acids and bases. Indoor Air 2020, 30, 559–644. [Google Scholar] [CrossRef]
  47. Pandit, S.; Mora Garcia, S.L.M.; Grassian, V.H. HONO production from gypsum surfaces following exposure to NO2 and HNO3,Roles of relative humidity and light source. Environ. Sci. Technol. 2021, 55, 9761–9772. [Google Scholar] [CrossRef]
  48. Cao, Y.Q.; Ma, Q.X.; Chu, B.W.; He, H. Homogeneous and heterogeneous photolysis of nitrate in the atmosphere: State of the science, current research needs, and future prospects. Front. Environ. Sci. Eng. 2022, 17, 48. [Google Scholar] [CrossRef]
  49. Dong, Z.W.; Qin, D.H.; Li, K.M.; Kang, S.C.; Wei, T.; Lu, J.F. Spatial variability, mixing states and composition of various haze particles in atmosphere during winter and summertime in northwest China. Environ. Pollut. 2019, 246, 79–88. [Google Scholar] [CrossRef]
  50. Rygula, A.; Majzner, K.; Marzec, K.M.; Kaczor, A.; Pilarczyk, M.; Baranska, M. Raman spectroscopy of proteins: A review. J. Raman Spectrosc. 2013, 44, 1061–1076. [Google Scholar] [CrossRef]
Figure 1. Raman spectra of (A) CaCO3 particle, (B) Ca(NO3)2 particle, (C) Mg(NO3)2 particle, (D) SiO2 particle, (E) NH4NO3 particle, (F) (NH4)2SO4 particle, (G) soot particle, (H) organic particle identified in this study.
Atmosphere 16 00707 g001
Figure 2. Raman spectra of mixed Na2SO4/NH4NO3/organics particles identified in this study.
Atmosphere 16 00707 g002
Figure 3. Percentage of (A) Ca(NO3)2-containing individual particles in classroom atmospheres and corresponding outdoor atmospheres, (B) Ca(NO3)2-containing in residential atmospheres and corresponding outdoor atmospheres, (C) Mg(NO3)2-containing in classroom atmospheres and corresponding outdoor atmospheres and (D) Mg(NO3)2-containing particles in residential atmospheres and corresponding outdoor atmospheres for each sample.
Atmosphere 16 00707 g003
Figure 4. Percentage of particles containing CaSO4 in classroom atmospheres and corresponding outdoor atmospheres for each sample.
Atmosphere 16 00707 g004
Figure 5. Percentage of particles containing NH4NO3 (A) in classroom atmospheres and corresponding outdoor atmospheres, and (B) in residential atmospheres and corresponding outdoor atmospheres for each sample.
Atmosphere 16 00707 g005
Figure 6. Percentage of particles containing organics in residential atmospheres and corresponding outdoor atmospheres for each sample.
Atmosphere 16 00707 g006
Figure 7. Raman spectra of mixed organics/inorganics particles identified in this study.
Atmosphere 16 00707 g007
Figure 8. Raman spectra of (A) mixed CaSO4/NH4NO3 particle and (B) mixed CaSO4•2H2O/NH4NO3/(NH4)2SO4 particle identified in this study.
Atmosphere 16 00707 g008
Figure 9. Raman spectra of mixed organics/inorganics particles identified in this study. The blue line indicates the Raman peak of the alanine.
Atmosphere 16 00707 g009
Table 1. The number of individual particles containing inorganics with different mixing states in each sample.
ID
1104 3
OD
1104
ID
1112
OD
1112
ID
1119
OD
1119
ID
1212
OD
1212
ID
1224
OD
1224
ID
1227
OD
1227
ID
0102
OD
0102
Total
Ca-Salt Particles
Ca(NO3)2 2241741 3 12252 61
CaSO4 1 1 1 3
CaCO3 121 4
Ca(NO3)2/CaSO4683424124152211147103
CaCO3/Ca(NO3)2 121 2 1 1224116
CaCO3/Ca(NO3)2/CaSO4 1 1 1 3
GaMg-Salt and SiO2 Particles
Mg(NO3)2 1112 1 17132130
CaMg(CO3)2/Ca(NO3)2 1 1
CaMg(CO3)2/Ca(NO3)2/CaSO4 1 1 2
Ca(NO3)2/Mg(NO3)2 211 4231324 757
CaSO4/Mg(NO3)2 2 1 3
Ca(NO3)2/Mg(NO3)2//CaSO4 2 21125 13
SiO2 1 1
NH3-Salt Particles
(NH4)2SO4 1 1
NH4NO35269605824406154867444298497832
NH4NO3/(NH4)2SO41383239311098105491152
Ca-NH3-Salt Particles
CaCO3/NH4NO321 11 5
CaSO4/CaCO3/NH4NO3 1 1
CaSO4/NH4NO313818972343523511 2 230
CaSO4/NH4NO3/(NH4)2SO41 2 12 1 7
Mg-NH3-Salt Particles
Mg(NO3)2/NH4NO3 173 1 12
Na-NH3-Salt Particles
Na2SO4/NH4NO3 11527112 31 60
Total measured particles1201201201201201201201201201201201201201201680
1 CaCO3/Ca(NO3)2 indicates that CaCO3 and Ca(NO3)2 were internally mixed in an individual particle. 2 The inorganic particles are classified without accounting for carbonaceous matter, despite some containing such species. 3 The sample numbers in the first row are ID (Indoors) + xx (month) + xx (date) and OD (Outdoors) + xx (month) + xx (date).
Table 2. The number of individual particles containing carbonaceous matter with different mixing states in each sample.
ID
1104 2
OD
1104
ID
1112
OD
1112
ID
1119
OD
1119
ID
1212
OD
1212
ID
1224
OD
1224
ID
1227
OD
1227
ID
0102
OD
0102
Total
Soot11 1 31 12212
Soot/inorganics431042 3225211 39
Soot/organics3 1112 151116
Soot/organics/inorganics17141042 1716121214172034189
Organics 1 2 11 65 117
Organics/inorganics 176635376989683857438845891751050
Total measured particles1201201201201201201201201201201201201201201680
1 Organics/inorganics indicates that organics and inorganics were internally mixed in an individual particle. Neither organics nor inorganics include soot. 2 The sample numbers in the first row are ID (Indoors) + xx (month) + xx (date) and OD (Outdoors) + xx (month) + xx (date).
Disclaimer/Publisher’s Note: The statements, opinions and data contained in all publications are solely those of the individual author(s) and contributor(s) and not of MDPI and/or the editor(s). MDPI and/or the editor(s) disclaim responsibility for any injury to people or property resulting from any ideas, methods, instructions or products referred to in the content.

