Review

Observation of Multilayer Clouds and Their Climate Effects: A Review

1
School of Emergency Management, Nanjing University of Information Science & Technology, Nanjing 210044, China
2
China Meteorological Administration Training Centre, Beijing 100081, China
3
College of Intelligent Science and Control Engineering, Jinling Institute of Technology, Nanjing 211169, China
4
Department of Atmospheric Sciences, School of Environmental Studies, China University of Geosciences, Wuhan 430074, China
*
Author to whom correspondence should be addressed.
Atmosphere 2025, 16(6), 692; https://doi.org/10.3390/atmos16060692
Submission received: 13 April 2025 / Revised: 3 June 2025 / Accepted: 5 June 2025 / Published: 7 June 2025
(This article belongs to the Special Issue Application of Emerging Methods in Aerosol Research)

Abstract

Multilayer clouds, comprising vertically stacked cloud layers with distinct microphysical characteristics, constitute a critical yet complex atmospheric phenomenon influencing regional to global climate patterns. Advances in observational techniques, particularly the application of high-resolution humidity vertical profiling via radiosondes, have significantly enhanced multilayer cloud detection capabilities. Multilayer clouds are widely distributed around the world, showing significant regional differences. Many studies have been carried out on the formation mechanism of multilayer clouds, and observational evidence indicates a close relationship between multilayer cloud development and water vapor supply, updraft, atmospheric circulation, as well as wind shear; however, a unified and comprehensive theoretical framework has not yet been constructed to fully explain the underlying mechanism. In addition, the unique vertical structure of multilayer clouds exhibits different climate effects when compared with single-layer clouds, affecting global climate patterns by regulating precipitation processes and radiative energy budgets. This article reviews the research progress related to multilayer cloud observations and their climate effects and looks forward to the research that needs to be carried out in the future.

1. Introduction

Clouds, as a widespread and critical atmospheric phenomenon, cover over half of Earth’s surface, directly reflecting the complex interactions and equilibria of physical and chemical processes in the atmosphere [1]. As a fundamental meteorological element, the formation and phase transitions of clouds significantly influence the distribution and variability of water vapor and radiative energy in the atmosphere [2,3,4,5]. Early studies of cloud vertical structure have been constrained by observational limitations and data scarcity, often focusing on single-layer clouds. This constraint remains evident in climate model simulations, where accurate representation of cloud overlap features persists as a significant challenge [6]. Furthermore, reliance on single-layer cloud parameterization schemes in most climate models introduces substantial biases in simulated cloud properties [7,8,9]. Recent advancements in observational technologies and numerical modeling have redirected scientific attention toward multilayer cloud systems characterized by vertically overlapping cloud types [10,11,12]. Compared to single-layer clouds, multilayer clouds demonstrate more intricate formation and maintenance mechanisms, frequently developing complex vertical architectures under intense convective conditions. These systems exhibit reduced shortwave radiation reflection at the top of the atmosphere while enhancing radiative energy transmission to the surface, thereby exerting a disproportionate influence on Earth’s energy balance [13].
Quantitative analyses consistently show similar trends in multilayer cloud occurrence. For example, Mace et al. [14] conducted a global analysis of total cloud cover using Cloud Profiling Radar (CPR) data during the summer of 2006, revealing that multilayer clouds accounted for 17% of global cloud cover. Additionally, Li et al. [13] demonstrated that single-layer and double-layer clouds constituted 51.6% and 25.8% of global cloud cover, respectively. Based on CloudSat data from 2007 to 2010, Li et al. [15] conducted a statistical analysis of global multilayer cloud distribution, revealing a mean global multilayer cloud fraction of 25–28%. Subrahmanyam and Kumar [16] further confirmed these findings, indicating occurrence frequencies of 53% and 20% for single-layer and double-layer clouds, respectively, with three or more layers being relatively rare. These results align with the global cloud distribution study by Wang et al. [17], which highlighted the relatively high occurrence frequency of multilayer clouds, particularly double-layer structures, on a global scale.
Recent studies have also demonstrated that the unique vertical structure of multilayer clouds can play a critical role in modulating radiation transfer, cloud microphysical processes, precipitation efficiency, and interactions with other meteorological elements. Consequently, multilayer clouds are widely recognized as a key component of weather systems, but their complex structure, inter-layer interactions, and temporal variability pose significant challenges to understanding and simulating their climate effects, making them a major source of uncertainty in climate modeling and weather forecasting parameterization. Therefore, a comprehensive investigation into the structural characteristics of multilayer clouds is essential. Leveraging technological advancements in remote sensing and computational modeling, extensive research has emerged on multilayer cloud systems. Through integrated satellite observations, ground-based measurements, and numerical simulations, researchers have systematically characterized their spatiotemporal distributions, formation mechanisms, and impacts on weather systems. These studies not only enhance our understanding of the microphysical evolution of multilayer clouds and their interactions with the environment but also provide critical insights into the role of multilayer clouds as a key feedback mechanism in the climate system.

2. Multilayer Clouds Detection Technology

In essence, the observation of multilayer clouds is the detection of cloud vertical structures. The observation of multilayer clouds relies on a multi-scale approach encompassing “space, sky, and ground” methodologies, utilizing a variety of instruments to study the vertical structure of clouds. These approaches have enabled more accurate characterization of multilayer clouds.

2.1. Ground-Based Observation of Multilayer

Ground-based observations primarily depend on fixed facilities such as millimeter-wave radar (MMWCR), lidar, and laser ceilometers. These instruments offer stable, long-term continuous monitoring capabilities, high-precision measurements, and the ability to simultaneously monitor multiple meteorological parameters, providing comprehensive ground data for studying cloud vertical structures. A significant advantage of ground-based observations is their exceptional temporal continuity, allowing for continuous monitoring of atmospheric conditions and dynamic processes at instrument deployment sites [18]. The MMWCR exhibits superior detection accuracy in determining cloud base heights of mid- and high-level clouds, while its performance is significantly constrained when monitoring low-level stratiform clouds with weak reflectivity signals [19]. This limitation has been previously explained by the presence of a blind zone below 2.1 km in high-sensitivity observation modes, which hinders the effective observation of low-level clouds [20]. Additionally, cloud radar is susceptible to ground clutter, mixed-phase clouds, and liquid clouds, leading to radar echo attenuation and an underestimation of high-level cloud occurrence probabilities [21,22,23,24]. Lidar instruments have better performance in detecting ground-visible cloud layers, particularly low clouds, with superior accuracy compared to cloud radar [20]. However, due to their short wavelengths, lidar is easily affected by aerosols, thus its detection capabilities can be substantially reduced during fog and haze conditions [25,26]. Moreover, laser attenuation in cloud layers is severe, making it difficult to accurately obtain cloud top height information for multilayer clouds with high optical thickness [18]. Furthermore, the synergistic observation of cloud radar and lidar is constrained by inherent discrepancies in their measurement principles and spatial-temporal sampling. This mismatch leads to sampling biases when characterizing cloud systems with vertical heterogeneity, such as mixed-phase clouds or precipitating layers, where radar may miss thin ice layers aloft while lidar fails to profile through dense water clouds below [25]. Beyond instrumental limitations, another challenge in ground-based observations is the uneven distribution of observation sites, making it difficult to achieve comprehensive monitoring of cloud vertical structures over large areas using ground-based methods alone [9].

2.2. Space- and Airborne-Based Observation

Space-based observations, acquired through satellites equipped with various active or passive sensors, provide monitoring of global cloud distribution, thickness, type, and vertical structure. Space-based observation can be categorized into polar-orbiting and geostationary satellites. Polar-orbiting satellites are widely used but are limited in their ability to provide continuous monitoring of specific regions due to their orbital characteristics and high-elevation tracking loss issues [27,28,29]. In contrast, geostationary satellites enable continuous observation of their coverage areas but rely predominantly on passive remote sensing, which limits their capacity to retrieve cloud base heights and low-cloud information—thereby posing significant challenges for detecting multilayer clouds [18,30,31,32]. Passive satellite sensors, notably the Moderate Resolution Imaging Spectroradiometer (MODIS), have been shown to be particularly susceptible to aerosols in heavily polluted regions, where they frequently misclassify aerosols as clouds [33,34,35]. Moreover, in the Arctic, the prevalence of mixed-phase clouds and extreme environmental conditions further complicate the detection of multilayer clouds, as passive sensors struggle to differentiate between ice and liquid phases, while active sensors face reduced signal penetration through thick ice layers [36]. Despite these limitations, satellite data still remain one of the most commonly used approaches for studying cloud vertical structures. It is worth noting that recent advances in multi-sensor fusion techniques have enabled synergistic analysis of active and passive satellite observations, significantly advancing the characterization of three-dimensional cloud morphology and associated radiative transfer processes across spatial scales spanning from regional to hemispheric and global climate domains [3,9,37,38].
Airborne observations have effectively addressed the limitations of space-based and ground-based observations. These observations are conducted using platforms such as aircraft, balloons, and drones equipped with high-precision sensors and automated data acquisition systems to collect real-time meteorological data at high altitudes. For example, aircraft observations can provide the vertical internal structure of clouds with high flexibility and also enable direct observation of morphological changes and microphysical properties at various atmospheric heights. This provides valuable real-time data for understanding the formation, development, and dissipation processes of multilayer clouds. By using aircraft and drone-based observations, researchers can obtain key parameters such as liquid water content (LWC), ice water content (IWC), and particle number concentration in multilayer clouds [39,40]. These in-situ measurements can be combined with radar echo data and satellite cloud imagery for comprehensive studies of multilayer clouds [41]. For example, Marinou et al. [40] utilized unmanned aerial vehicles (UAVs) equipped with in-situ sensors to collect ice-nucleating particle (INP) samples and characterize aerosol size distributions during the Cyprus experiment. Notably, due to the unique role of aircraft in weather modification, recent studies have reported the use of aircraft observations to study the microphysical characteristics of multilayer clouds following artificial seeding operations [42]. In parallel, scholars have advanced this field by deploying unmanned aerial vehicles (UAVs) equipped with seeding agents to inject ice-nucleating particles into supercooled stratus clouds [43]. While airborne cloud physics detection devices can accurately capture the spectral distribution and size information of various solid and liquid particles in clouds, these observation techniques are associated with relatively high costs and stringent flight operation conditions [44]. Additionally, they are constrained by strict flight route limitations [39]. These constraints significantly limit the frequency and geographic coverage of aircraft observations.

2.3. Radiosounding Observations and Identification of Multilayer Clouds

In addition to aircraft, weather balloons equipped with observation instruments can serve as a key method for studying cloud vertical structures. Compared to aircraft observations, sounding devices exhibit unique advantages, including high precision, rapid response, low measurement lag, and relatively low cost [45]. These advantages have led to the widespread use of balloon-sounding devices in the field of multilayer cloud detection. For cloud detection, the sounding technology itself does not directly observe cloud layers but focuses on detecting atmospheric humidity conditions. To identify cloud layers, specific algorithms need to be employed to indirectly infer cloud presence by analyzing humidity data. Therefore, the accuracy of cloud layer identification using sounding data highly depends on the appropriate selection of relative humidity thresholds in certain algorithms. Poore et al. [46] used the difference between dew point temperature and temperature profiles obtained from soundings to determine cloud base and cloud top heights, a method known as the “PWR95” method. Wang and Rossow [47] later improved the “PWR95” method, naming the new approach “WR95”. The core principle of this method is that a cloud layer is identified when the maximum relative humidity within the cloud exceeds 87%, the minimum relative humidity exceeds 84%, and the humidity jump at the cloud top and base is greater than 3%. Additionally, the method specifies that when the temperature is above 0 °C, the relative humidity threshold corresponds to water saturation at that temperature; when the temperature is below 0 °C, the threshold corresponds to ice saturation. This method has been continuously refined and widely applied over a long period. Zhou and Ou [48] analyzed the vertical structure of cloud layers using the WR95 method based on L-band (1–2 GHz) sounding data from China’s meteorological sounding network. The study utilized vertical profiles of relative humidity, temperature, and pressure obtained from these balloon-borne measurements. The results were validated against cloud radar observations from the CloudSat satellite, confirming the scientific validity and effectiveness of using relative humidity thresholds to define cloud layers. Zhang et al. [49] further improved the “WR95” method by suggesting the use of different relative humidity thresholds based on the altitude of the observation site. In their study, choosing Shouxian, Anhui Province as an example, they set the minimum cloud base height at 280 m and specified a minimum distance of 300 m between cloud layers and minimum thicknesses for different cloud types. This improvement significantly expanded the applicability of the “WR95” method in different regions. Reddy et al. [50] used the refined cloud identification method to identify multilayer clouds over the tropical station Gadank. By considering the typical height characteristics of clouds at tropical sites, they excluded wet layers with base heights below 500 m and cloud layers with thicknesses less than 100 m. They validated the results against lidar observations, demonstrating that the improved “WR95” method by Zhang et al. [49] is applicable at tropical sites and achieves high accuracy in identifying multilayer clouds. Cai et al. [51] further optimized the relative humidity thresholds in their research by segmenting the thresholds and linearly fitting them to obtain humidity threshold profiles at different altitudes. Li et al. [52] used the improved humidity threshold profiles to analyze the distribution characteristics of multilayer clouds across China and validated the consistency between cloud top heights identified by soundings and those derived from FY-4A satellite products, confirming the feasibility of the improved “WR95” method by Cai et al. [51].
Beyond the widely used “WR95” method, other cloud layer identification methods have been proposed. For example, Chernykh and Eskridge [53] introduced the CE96 method, which uses the second derivatives of temperature and humidity profiles obtained from soundings to determine cloud layers. Specifically, a cloud layer boundary is identified when the second derivative of temperature is ≥0 and the second derivative of humidity is ≤0. Additionally, Minnis et al. [54] proposed setting different relative humidity (RH) thresholds for different temperature values to calculate the probability of cloud detection. Jin et al. [38] later referred to this method as “MN05”. They suggested that 253 K is the midpoint between the ice point and homogeneous ice nucleation temperature. When the temperature is ≤253 K, the relative humidity with respect to water (RHW) is converted to the relative humidity with respect to ice (RHI). They also set the optimal RH cut-off values for the upper troposphere (100–400 hPa) at 130% inside clouds and 140% outside clouds, defined as the thresholds for frequency distributions of RHW/RHI. However, the “MN05” method was later found to be unsuitable for environments with temperatures below −40 °C. Jin et al. [38] improved the “MN05” method using data from the Canadian Arctic Shelf Exchange Study (CASES) and lidar ceilometer observations over the Arctic. They recommended setting the optimal RH cut-off values for the upper troposphere at 170% inside clouds and 200% outside clouds in polar regions.
It is noteworthy that significant progress has been made in recent years in the technical methods for observing cloud vertical structures, as well as the detection of multilayer clouds. On one hand, ground-based instruments such as cloud radar and lidar, as well as space-based detectors, have seen substantial technological advancements, including improvements in multi-band observation, signal-to-noise ratio enhancement, and clutter removal [55]. On the other hand, satellite remote sensing and sounding techniques have become more common and efficient tools for detecting cloud vertical structures. The retrieval algorithms for satellite remote sensing data and sounding data have also been continuously updated, enabling better performance in regions that were previously difficult to observe, such as polar and plateau areas [56,57]. In recent years, with the diversification of observation methods, there has been an increasing trend toward using multi-source observation data for three-dimensional studies. By leveraging the complementary strengths of different observation techniques, higher precision and frequency in multilayer cloud detection have been achieved [32,58,59].

3. Distribution and Structure of Multilayer Clouds

Due to the complex internal interactions within multilayer cloud systems and the diversity of external influencing factors, in-depth exploration of the distribution characteristics of multilayer clouds holds significant theoretical and practical value for revealing cloud system evolution patterns, uncovering the formation mechanisms of multilayer clouds, and understanding climate change mechanisms. With the rapid development of observation technologies and the continuous improvement of numerical models, many researchers have conducted extensive studies on the distribution of multilayer clouds by integrating satellite remote sensing data and numerical simulations from both horizontal and vertical dimensions, achieving notable progress.

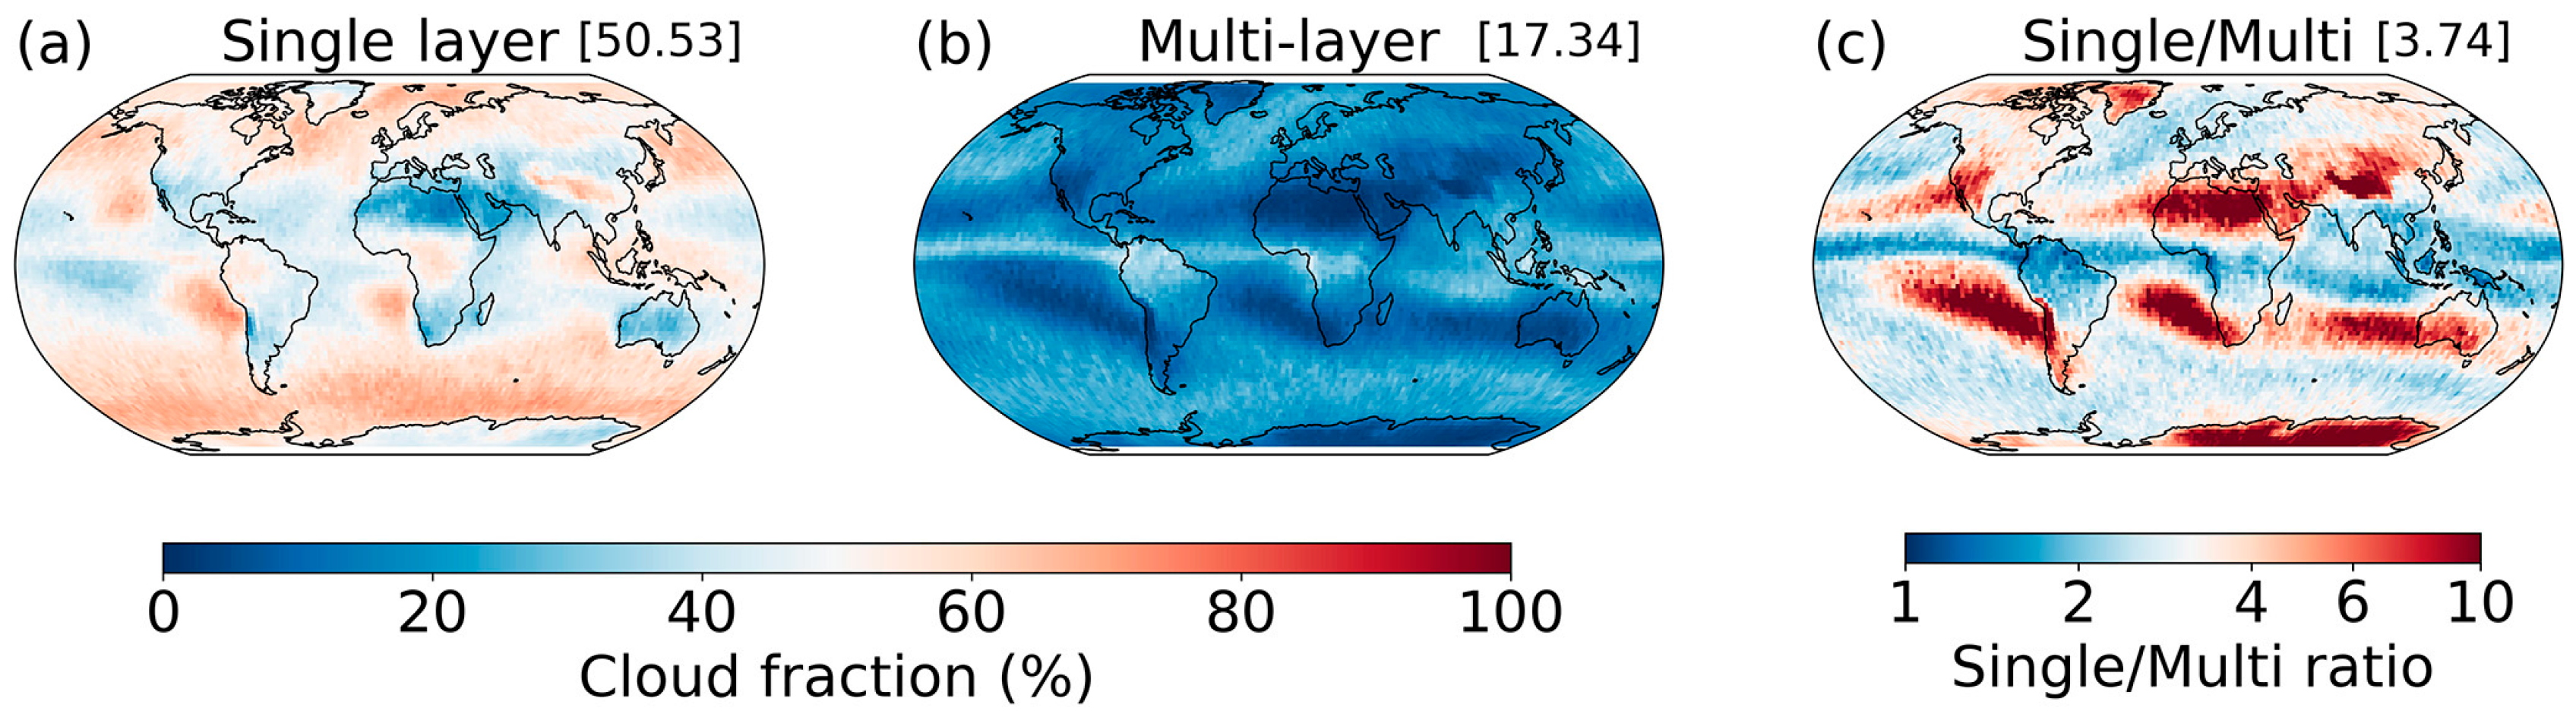
3.1. Horizontal Distribution

From a global perspective, the distribution of single-layer and multilayer clouds varies significantly with latitude, exhibiting distinct zonal characteristics (Figure 1 and Figure 2). Both cloud types are particularly frequent in the equatorial region and around the 60° latitude belts in both hemispheres [13,15,16,60]. Additionally, the distribution of multilayer clouds exhibits regional characteristics. Studies have shown that cloud layers over the oceans in the Northern Hemisphere tend to aggregate more frequently at lower altitudes, with the occurrence of multilayer clouds being approximately 2% higher over the oceans [17]. Other research suggests that double-layer clouds are more common over land rather than ocean, especially in the low-latitude equatorial zone [13]. Quantitative statistics on cloud types in the East Asian monsoon region, Indian monsoon region, and Northwest Pacific monsoon region reveal that multilayer clouds account for 29.1%, 43.0%, and 44.5% of the total cloud cover, respectively [61]. During the summer monsoon at the Gadanki site in India, single-layer, double-layer, and triple-layer clouds account for 40.80%, 30.71%, and 19.68% of the total cloud cover, respectively, indicating more complex cloud structures in tropical monsoon regions [50]. In another study of precipitation cloud characteristics in the South Asian and East Asian monsoon regions, Li et al. [62] found that precipitation clouds in the East Asian monsoon region are dominated by single-layer clouds, accounting for over 60%, while in the South Asian monsoon region, precipitation clouds consist of both single-layer (45%) and double-layer (30%) clouds.
In addition to low-latitude regions, the Arctic is also a ‘hotspot’ for multilayer clouds. Early studies found that multilayer mixed-phase cloud structures frequently occur over the Arctic during summer [63,64,65]. These observations have led to extensive scientific research on multilayer mixed-phase clouds in this region. Based on data from the Mixed-Phase Arctic Cloud Experiment (M-PACE) under the U.S. Department of Energy’s Atmospheric Radiation Measurement (ARM) Program, conducted from 27 September to 22 October 2004 at the North Slope of Alaska (NSA) sites, Luo et al. [39] identified mixed-phase clouds over the Arctic, observing that single-layer and double-layer clouds dominate, accounting for 66% and 34% of the total, respectively. Using high spatiotemporal resolution radiosonde data from April 2017 to September 2019 to study the vertical structure of clouds over the central Arctic, Wang et al. [24] found that the probability of multilayer clouds in the Arctic is as high as 70%. They noted that single-layer and double-layer clouds alternate frequently in the Arctic, contrasting sharply with the dominance of single-layer clouds in tropical and subtropical regions. Compared to the Arctic, the total cloud cover of multilayer clouds observed in mid- and low-latitude regions during summer is significantly smaller (approximately 46.56%), with double-layer and triple-layer cloud systems contributing 8.26% and 1.40%, respectively. Studies summarizing the patterns of multilayer cloud occurrence have found that regions with high multilayer cloud cover are primarily concentrated in areas with active convection, while regions with low cloud cover generally correspond to areas controlled by subtropical high-pressure systems. In regions with active summer convection (e.g., near the Intertropical Convergence Zone (ITCZ), the high-latitude regions of the North Pacific and North Atlantic, and the central African and Asian monsoon regions), the cloud cover of double-layer and triple-layer cloud systems exceeds 14% and 3%, respectively. In contrast, regions controlled by descending airflows under subtropical high-pressure systems (e.g., the North Pacific High, North Atlantic High, and North African High) exhibit only half the cloud cover of multilayer cloud systems compared to convectively active regions [66].
Previous research has revealed a strong correlation between the frequency of multilayer clouds and seasonal variations. Globally, the formation frequency of multilayer clouds is higher in summer than in winter, particularly in the mid- and low-latitude regions of the Northern Hemisphere [17]. In tropical monsoon regions, the frequency of single-layer clouds initially decreases and then increases with seasonal changes, peaking in spring. In contrast, multilayer clouds, especially double-layer clouds, show an opposite trend, reaching their highest frequency in summer. Compared to other regions, the Indian subcontinent and its adjacent maritime areas exhibit a significant increase in the frequency of double-layer cloud structures during summer. The frequency of multilayer clouds in the Indian Ocean monsoon region is notably higher in summer than in winter, with a maximum absolute difference of up to 60%, and this higher frequency persists into autumn [3,16]. In high-latitude regions of the Northern Hemisphere, the seasonal variation in the frequency of multilayer clouds is less pronounced, which may be attributed to the complex atmospheric circulation patterns and intra-seasonal variability in these regions. In the Southern Hemisphere, high-latitude regions experience frequent multilayer clouds in winter and a significant reduction in summer, whereas low-latitude regions show the highest frequency of multilayer clouds in summer and the lowest in winter [16,17]. It is believed that seasonal changes in temperature and humidity, driven by seasonal transitions, influence the formation and maintenance of cloud layers. However, due to significant regional differences in these seasonal variations, further detailed mechanistic investigations are needed.
China is located in the Asian monsoon region, spanning mid- to low-latitude zones, and is influenced by both the East Asian and South Asian monsoons. Overall, the occurrence frequency of multilayer clouds in China is relatively low, ranging between 15% and 25%, with notable regional differences. Satellite observations reveal a pronounced meridional variation in multilayer cloud, exhibiting enhanced occurrence frequencies within the subtropical belt south of 30° N, while showing marked suppression over the Mongolian Plateau’s extratropical latitudes [67,68]. Recent studies have found that the probability of single-layer clouds over the Tibetan Plateau is approximately 73%, significantly higher than that of multilayer clouds, which only account for 10~15% [69].

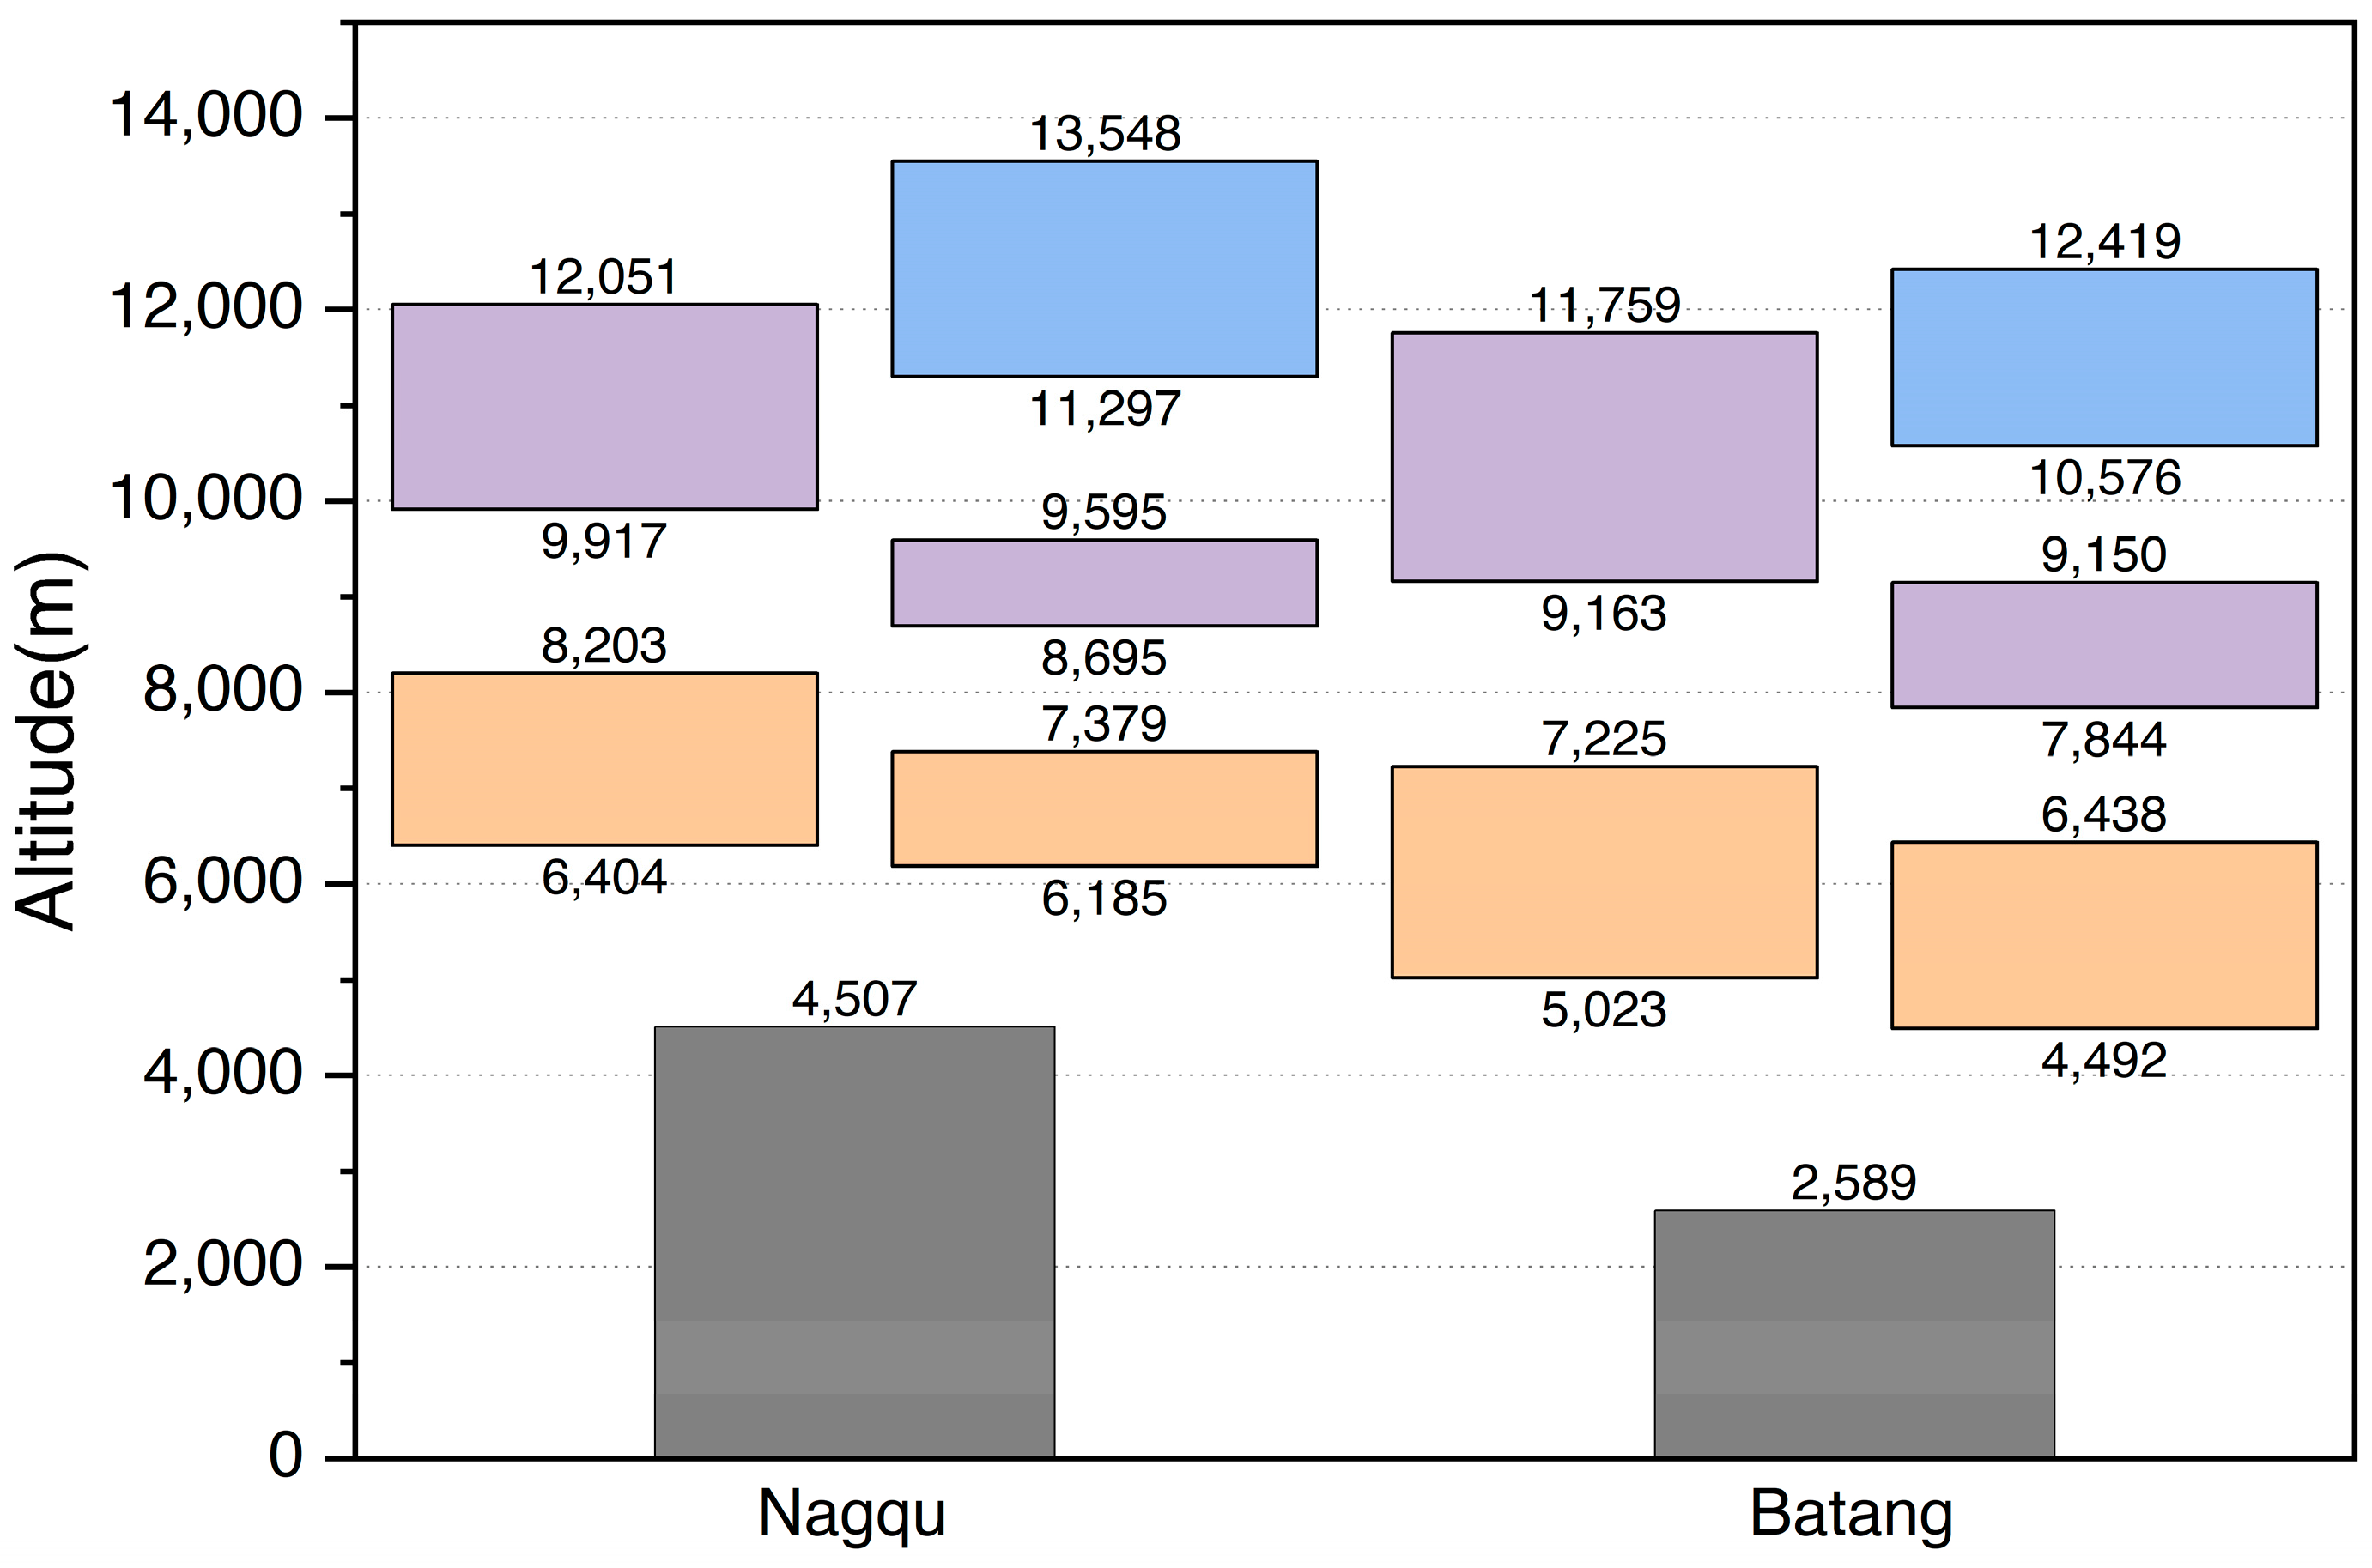
3.2. Vertical Structure

Compared to the unique geographical and seasonal variations observed in the horizontal distribution of multilayer clouds, the vertical distribution characteristics of multilayer clouds reveal another dimension of complexity. This vertical structure not only involves the stacking and interleaving of cloud layers in the vertical space but also reflects the vertical variations in temperature, humidity, and airflow. Such diversity in vertical structure profoundly influences the formation, maintenance, and dissipation processes of cloud layers. Wang et al. [17] found that the vertical structure of clouds plays a more significant role in influencing atmospheric circulation compared to their horizontal distribution. They identified three critical parameters characterizing cloud vertical structure: cloud top height, number of cloud layers, and the thickness of the interlayer between multilayer clouds (Table 1).
Wang et al. [17] analyzed global radiosonde data from 1976 to 1995 and found that the average annual cloud layer thickness of multilayer cloud systems globally is approximately 1.6 km, with an average distance of 2.2 km between adjacent cloud layers. The base height of the lowest cloud layer is typically around 1.2 km above sea level, mostly within the atmospheric boundary layer. In the Arctic region, Luo et al. [39] observed that the base height of the lower layer in double-layer mixed-phase clouds is approximately 0.625 km, with the cloud top at 1.125 km, and 93% of these cloud layers have a thickness of less than 750 m (Table 1). The second layer of clouds is primarily concentrated between 1 and 4 km, with most cloud layers being less than 500 m thick. Studies have shown that clouds occur most frequently at heights between 1 and 2 km. In the 7–11 km altitude range, cloud occurrence frequency exhibits significant seasonal variation, with the lowest frequency in spring and the highest in autumn, consistent with the seasonal changes in tropopause height [24]. When analyzing cloud vertical structure by cloud type, it was found that in the Arctic, the base height of low clouds is generally below 500 m, with 66.5% of low clouds having a top height of no more than 1500 m. Among these, 54.7% of the cloud layers were observed to have a thickness of less than 500 m. The top height of middle clouds is uniformly distributed between 1.8 km and 4 km, with 68% of middle clouds having a top height between 2 km and 5 km. The occurrence frequency of high clouds gradually decreases with increasing altitude in the 5–8 km range. Additionally, 41% of high clouds have anomalously high base heights, distributed between 9 km and 11.5 km [38].
Based on long-term observational data of multilayer clouds in the Northern Hemisphere, researchers have revealed a correlation between cloud top height and the intensity of convective activity. Specifically, regions with vigorous convection tend to have higher cloud amounts at upper levels and correspondingly higher cloud tops [61,70,71] (Table 1). For example, in the tropical regions of the Northern Hemisphere, the peak cloud amount (60–70%) in the Indian monsoon region occurs near 15 km, while the Northwest Pacific monsoon region exhibits high cloud amounts between 11 and 17 km [61]. Das et al. [71] found that cloud top heights in tropical regions often exceed 14 km, consistent with the statistical analysis by Tan et al. [70] on double- and triple-layer clouds in Northern Hemisphere summer convection zones. Analysis of observational data further reveals a distinct descending order of cloud top heights: upper-layer (triple) > upper-layer (double) > single-layer > middle-layer (triple) > lower-layer (double) > lower-layer (triple). The order of cloud base heights aligns with that of cloud top heights [52,70,72,73,74]. Additionally, during the Northern Hemisphere summer, the ranking of cloud base heights in multilayer clouds matches that of cloud top heights. On average, the base heights of the upper layers in triple-layer and double-layer clouds are above 8.5 km, the middle layer of triple-layer clouds is primarily between 4 and 7.2 km, and the base heights of the lowest layers in both double-layer and triple-layer clouds are below 4 km, with a peak below 2 km in tropical regions [70,71].
It is worth noting that, unlike horizontal distribution characteristics, the vertical structure of multilayer clouds exhibits not only seasonal variations but also diurnal changes. On a seasonal scale, the maximum cloud top heights and thicknesses of single-layer and multilayer clouds in tropical monsoon regions occur during the monsoon season [50]. However, in mid- and high-latitude regions, cloud layers tend to be thicker in winter, closely related to seasonal atmospheric circulation and temperature gradient changes. Notably, in specific regions over Southeast Asia, cloud layers are relatively thinner in winter [17]. On a diurnal scale, the cloud top height of multilayer clouds reaches its lowest point in the morning. As solar radiation intensifies, the heating of the lower cloud base provides lifting energy, pushing the cloud layers to higher altitudes in the afternoon. At night, the release of surface latent heat slows, and the energy lost through longwave radiation exceeds the shortwave solar radiation absorbed during the day. These combined effects maintain the cloud top height at a relatively high level, forming a unique diurnal variation pattern in multilayer cloud top heights [49,52].
Compared to other regions, multilayer clouds in China exhibit some unique structural characteristics. Studies show that double-layer clouds dominate multilayer cloud systems in China, and the probability of cloud occurrence decreases as the number of layers increases. For example, in North China, single-layer clouds account for 41.25%, double-layer clouds for 15.58%, and multilayer clouds for 0.45%, respectively. In the Jianghuai region, single-layer clouds account for 42.77%, double-layer clouds for 18.91%, and multilayer clouds for 0.88% [75]. The cloud base height of multilayer clouds decreases from west to east, and the base height of single-layer clouds is generally higher than that of multilayer clouds. The thickness of multilayer clouds shows a gradual thinning trend from the southeastern coast to the northwestern inland. Except for the upper layers of double-layer and triple-layer clouds over the Tibetan Plateau, the cloud layer thickness in Central, Southwest, and South China is greater than that in northern regions [52,72]. As the number of cloud layers increases, the average thickness of each layer decreases, while the overall cloud thickness gradually increases [11,74]. Many studies have found that in double-layer cloud configurations, the upper layer is thicker than the lower layer, while in triple-layer structures, the top layer is the thickest, followed by the bottom layer, with the middle layer being the thinnest [49,52,74]. The interlayer thickness of multilayer clouds is also greater in the south than in the north, and in triple-layer clouds, the clear-sky thickness between the top and middle layers is greater than that between the middle and bottom layers [73]. The interlayer thickness of multilayer clouds in various regions of China is most likely around 0.35 km (over 45%), and the probability of interlayer thickness exceeding 10 km is also high in Central, Southwest, and South China [72]. The cloud top and base heights of multilayer clouds in China generally reach their maximum in summer and minimum in winter, while the interlayer thickness shows no significant seasonal variation [73].
Although the occurrence frequency of multilayer clouds over the Tibetan Plateau is not high, previous scientific research has revealed that multilayer clouds in this region can influence the climate of the Tibetan Plateau and surrounding areas through radiative processes; thus clouds in this area have attracted widespread attention [69,76]. In the cloud configuration over the Tibetan Plateau, the “high cloud + high cloud” double-layer configuration exceeds 80%, and the “high cloud + high cloud + high cloud” triple-layer configuration occurs with a probability of over 60% [77]. Additionally, the vertical distribution of cloud base and top heights in multilayer clouds often exhibits a bimodal pattern [19]. Due to the high altitude of the Tibetan Plateau, mostly above 3 km, and the effects of plateau topography and dynamic and thermal lifting, the base and top heights of the lower layer in double-layer clouds and the middle layer in triple-layer clouds are all above 3 km [70]. Wang et al. [61] found that clouds over the plateau are mainly located in the middle troposphere, between 4 and 11 km. In terms of cloud thickness, in double-layer configurations, the upper layer is significantly thicker than the lower layer, while in triple-layer configurations, the thickness decreases in the order of the top layer, bottom layer, and middle layer [69,73,74]. In double-layer structures, the average thickness of the upper layer is 2.5 km, significantly greater than the lower layer’s average thickness of 2.2 km. For triple-layer structures, the average thickness of the top layer is 2.2 km, and the bottom layer is 1.7 km, both exceeding the middle layer’s average thickness of 1.0 km [69]. Notably, due to the unique topography and climate conditions of the Tibetan Plateau, the plateau may “compress” cloud thickness and the number of layers, exhibiting a distinct cloud compression phenomenon [19,69,78]. As shown in Figure 3, in higher-altitude regions, both cloud base and top heights are relatively lower, at 1964 m and 6126 m above the surface, respectively, and the cloud thickness is also relatively thin. The more layers a cloud has, the more pronounced the compression effect, directly reflected in the reduction of average cloud thickness. Compared to East China, the higher altitude of the Tibetan Plateau, influenced by spatial and topographic factors, results in overall higher cloud heights [73]. Therefore, the latitudinal distribution characteristics of cloud vertical structures in China can be summarized as follows: the southwestern region, centered on the Tibetan Plateau, exhibits higher cloud base heights and relatively thinner cloud thicknesses due to its significant average altitude [3,73], while the southeastern coastal region shows lower cloud bases and thicker cloud layers [52].
In summary, the spatial distribution of multilayer clouds exhibits significant regional differences and latitudinal variations, with distinct characteristics among different cloud layers. Within multilayer cloud systems, double-layer clouds dominate in occurrence probability. Further analysis of the vertical structure of multilayer clouds reveals a clear hierarchy: the cloud base heights of multilayer clouds are generally lower than those of single-layer clouds, while their cloud top heights are significantly higher.

4. Formation of Multilayer Clouds

Multilayer clouds are not isolated climate phenomena but rather the result of the interplay of various factors such as moisture supply, wind field, and atmospheric circulation. Under specific conditions, these factors drive complex physical and chemical processes that cause water vapor to condense or sublimate at different altitudes, thereby forming distinct cloud layers. These processes collectively determine the formation, development, and dissipation of multilayer clouds.

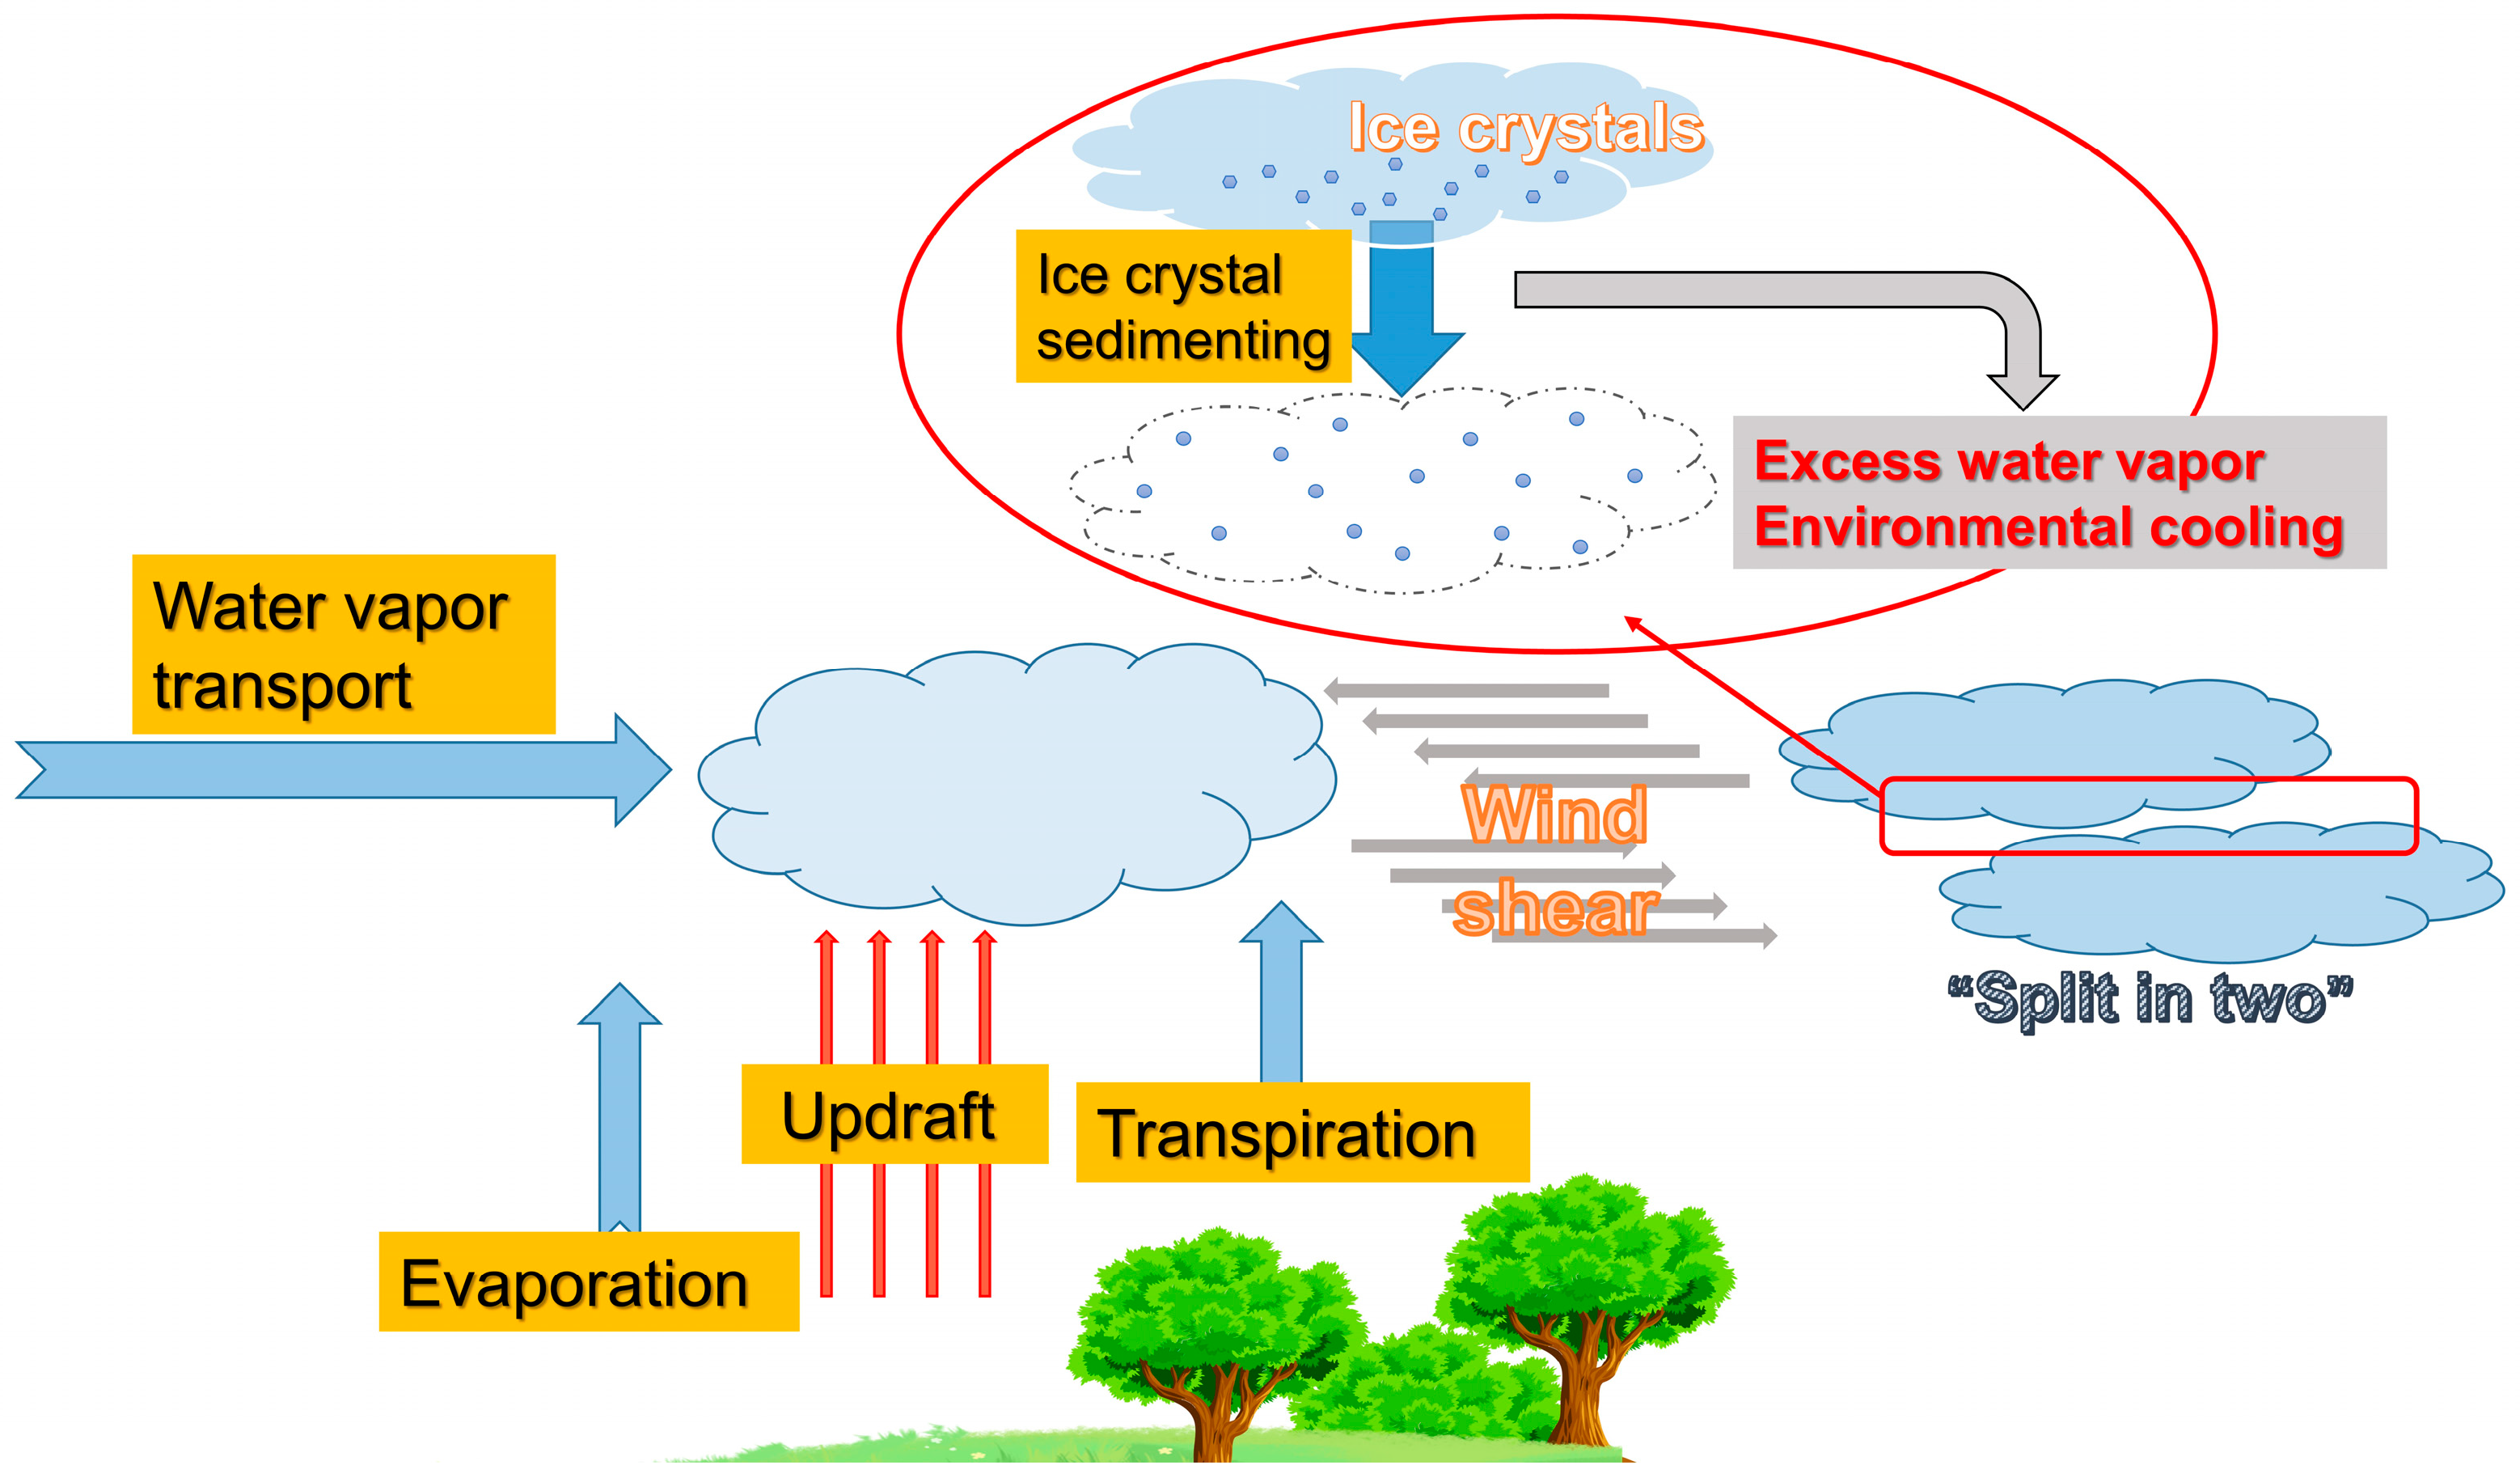
4.1. Moisture Conditions

Water vapor is an essential requirement for cloud formation and significantly influences the formation, development, and dissipation of cloud layers [1]. The tropical region exhibits abundant water vapor and a high frequency of cloud occurrence [13,79,80]. Research on multilayer clouds in this region has revealed extremely high ice relative humidity (RHi > 80%) near the tropopause [81]. During the Northern Hemisphere summer, regions with vigorous convection exhibit an average ice water path (IWP) exceeding 380 g/m2, with IWP values for the upper layers of double-layer and triple-layer clouds and the middle and lower layers of triple-layer clouds ranging from 10–260 g/m2 and around 100 g/m2, respectively [70]. This moist environment facilitates the growth of ice crystals, coinciding with a distinct peak in ice water content observed in tropical monsoon regions at approximately 8–10 km altitude, where the effective radius also reaches its maximum [50,71]. Furthermore, the presence of the Tropical Easterly Jet (TEJ) transports moisture from the Bay of Bengal and the South China Sea towards southern India (Kattankulathur), supplying ample water vapor for cirrus cloud formation, particularly within multilayer clouds [82]. Additionally, previous studies have found that as the number of cloud layers increases, the average IWP also increases. In multilayer clouds, the average IWP of lower layers is smaller than that of upper layers. Tan et al. [70] suggested that this phenomenon is likely due to the efficient lifting of water vapor to colder regions by strong updrafts in convective zones, increasing the IWP in the upper troposphere. This explanation aligns with observations that the cloud top heights of multilayer clouds in low-latitude regions often exceed 10 km. In contrast, the East Asian monsoon region, located at relatively higher latitudes, exhibits lower average IWP values (around 206 g m−3) compared to tropical monsoon regions, explaining the thinner and sparser high clouds observed over this area [71].
In the unique low-temperature environment of the Arctic, multilayer cloud systems are often dominated by ice crystals. As cold air flows over the open Arctic Ocean, the relatively large sea–air temperature difference, combined with intense surface turbulent sensible and latent heat fluxes, generates strong boundary layer updrafts and high relative humidity. These conditions facilitate the condensation of water vapor into ice crystals at higher altitudes, promoting cloud formation and maintenance [83,84]. Additionally, mid-level moisture transported by low-pressure systems near the polar regions provides favorable conditions for the formation of ice clouds. In Arctic multilayer clouds, ice crystals from upper layers may settle into lower layers through the Bergeron–Findeisen process, reducing LWC in the lower layers via deposition and riming processes. This leads to a decrease in the liquid water path (LWP) and an increase in the IWP, thereby altering the structure and phase of the cloud layers. As ice crystals descend through clear-sky gaps between cloud layers, they may sublimate, affecting the number and size of ice crystals and potentially modifying local static stability, which can sometimes result in the formation of a second cloud layer at lower altitudes [85]. Through a numerical simulation study of Arctic mixed-phase clouds, Luo et al. [39] found that in single-layer mixed-phase clouds, LWC increases with altitude due to the adiabatic growth of liquid droplets in updrafts [39]. Within the 400–1.6 km altitude range, the average LWC is approximately 0.05 g m−3, while the total IWC between 0.4 and 1.5 km (0.05–0.1 g m−3) exhibits higher mean values and standard deviations compared to higher altitudes (<0.05 g m−3). This indicates that ice crystals are more abundant in the lower layers of multilayer clouds, supporting the mechanism proposed by Harrington et al. [85] that ice production and sedimentation can contribute to the formation of a second lower cloud layer (as illustrated in Figure 4) [85].
Notably, the Tibetan Plateau, often referred to as the “Third Pole”, shares similarities with the Arctic as both are located in the Northern Hemisphere and are considered highly sensitive to climate change [86]. These regions exhibit similar climate characteristics, enduring prolonged periods of low temperatures, strong winds, and dry conditions [87,88,89]. The overall moisture content over the Tibetan Plateau is relatively low, with less water vapor in winter and increased moisture during summer due to monsoon influences. Consequently, the probability of multilayer clouds forming over the plateau is higher in summer [77,90,91,92]. The southern Tibetan Plateau during summer is a region of high LWP, with average values exceeding 250 g/m2 [70]. Due to the onset of the South Asian summer monsoon, frequent convective activities transport ice crystals to higher altitudes, leading to a significant increase in ice crystal concentrations between 10 and 15 km [69,93]. In a comparative study by Yan et al. [93], they found that the maximum concentration of ice crystals occurs near the −20 °C temperature level in both the Arctics and Tibetan Plateau regions. However, notable differences were also found: over the Tibetan Plateau, the peak concentration of liquid particles is observed between 5 and 8 km (where ambient temperatures are below 0 °C), whereas, in the Arctic, the maximum liquid particle concentration is found between 1 and 2 km (where ambient temperatures are above 0 °C). Furthermore, during the Northern Hemisphere summer, the content of cloud water particles, particularly supercooled liquid water and ice particles in mixed-phase clouds, is more abundant over the Tibetan Plateau when compared to the Arctic, and the sizes of these particles are also larger. However, comparative studies on the vertical structures and microphysical properties of clouds in these two regions remain limited, leaving our understanding of potential commonalities in their multilayer cloud formation mechanisms incomplete.

4.2. Updrafts and Vertical Wind Shear

While abundant water supply is critical for cloud formation, it is not the sole determinant of multilayer cloud development. A previous study indicates that the vertical structure of clouds does not always align with the vertical distribution of water vapor, as atmospheric dynamics and control mechanisms also play a significant role in shaping cloud vertical structures [17]. For instance, in the study of multilayer cloud formation mechanisms over the Tibetan Plateau, Ma et al. [69] found that Nyingchi, located near the Yarlung Tsangpo River Gorge, has adequate water vapor and the highest cloud cover among several observation sites. However, the proportion of multilayer clouds in this region is lower than in the drier eastern parts of the Tibetan Plateau.
Additionally, updrafts are fundamental to cloud formation and significantly influence cloud thickness [94]. However, although strong updrafts can drive the formation of single-layer clouds, they may be insufficient to create multilayer cloud structures. In the formation mechanism of multilayer clouds, updrafts primarily transport moisture from the lower atmosphere to higher altitudes. However, current research indicates that the final formation of multilayer clouds relies on the effects of wind shear, which involves significant changes in wind speed and direction at different altitude levels [69,95].
Studies on multilayer clouds over the Tibetan Plateau reveal significant variations in meridional and zonal winds, with vertical wind shear increasing alongside the number of cloud layers. This intensification of vertical wind shear and dynamic adjustments in upper-tropospheric wind direction represent the primary mechanism for splitting upper cloud layers into distinct parts (as illustrated in Figure 4). In-depth studies of the East Asian monsoon system have observed the frequent occurrence of multilayer clouds over this region, revealing significant zonal and meridional wind shear characteristics during their formation within the summer monsoon, further emphasizing wind shear’s role [96]. Examining tilted cloud structures in the East Asian monsoon region, Sun [5] found that enhanced lower-tropospheric meridional winds drive the summer monsoon’s northward movement, while increased negative meridional winds in the upper troposphere indicate the southward movement of high-level cloud systems. Accelerated vertical airflow at the convective center promotes moisture transport to higher altitudes, while upper-level divergence on its southern flank, combined with northerly airflow, facilitates both the southward movement of cloud layers and the formation of tilted structures. This study validates the hypothesis proposed by Ma et al. [69] regarding cloud layer stratification.

4.3. Atmospheric Circulation

Atmospheric circulation, as a macroscopic and complex flow pattern within the Earth’s atmospheric system, plays an indispensable role in the formation of multilayer clouds. It provides the essential dynamic and material conditions for cloud formation and largely determines the structure and evolution of clouds [5]. The three-cell circulation model, comprising the Hadley, Ferrel, and Polar cells, lies at the core of atmospheric circulation. The tropical updrafts associated with the Hadley cell provide abundant moisture and dynamic conditions for cloud formation, fostering the development of tropical cloud systems. The westerlies in the Ferrel cell promote the formation of frontal systems, which are key sources of clouds and precipitation in mid-latitude regions. Meanwhile, the Polar cell, through systems such as the polar vortex, affects the distribution and characteristics of polar clouds [97,98,99,100]. Additionally, through horizontal air transport, atmospheric circulation facilitates the exchange of moisture, heat, and other meteorological elements across different regions, further enriching the environmental conditions necessary for cloud formation.
Research has shown that low-latitude regions with a high frequency of multilayer clouds often correspond to the ascending branches of the three-cell circulation, while areas with lower frequencies align with the descending branches of the Hadley cell [16]. The maximum cloud cover in the upper troposphere occurs near the equator and its adjacent regions, extending from 0° N to 10° N during the Northern Hemisphere summer and from 0° S to 30° S during the Southern Hemisphere summer. These regions coincide with the ITCZ and the ascending branches of the Hadley cell [14,17]. Both single-layer and multilayer clouds exhibit high frequencies at the equator and around 60° latitude in both hemispheres, aligning with the ascending branches of the Hadley and Ferrel cells [13]. In these regions, vertical atmospheric motion plays a critical role by effectively transporting water vapor from the surface and lower atmosphere to higher altitudes, creating favorable conditions for cloud formation and promoting the development of cumulus and deep convective clouds. As deep convective clouds evolve, their anvils may separate and rise to form cirrus clouds, while the main body sinks to lower levels, eventually transforming into mid-level clouds [101,102,103]. In contrast, descending air currents, through adiabatic processes, lead to increased air temperature and decreased relative humidity, both of which are unfavorable for the initial formation and maintenance of cloud layers, particularly the complex conditions required for multilayer clouds, thereby limiting their development in these regions [16].
While the three-cell circulation is the most significant atmospheric circulation on a global scale, regional-scale monsoon circulations serve as crucial bridges connecting tropical and mid-to-high-latitude climate systems. During summer, the intense convective activity driven by monsoon circulations provides ample moisture and upward motion for cloud formation. By lifting warm, moist air and promoting internal condensation, monsoon circulations effectively facilitate the formation and development of various cloud types. Prior to the onset of the monsoon, the atmospheric stratification exhibits significant potential instability. As the monsoon system approaches, convective activity intensifies, and the moist air carried by the monsoon from the lower troposphere rapidly ascends, promoting the concentrated release of unstable energy [104]. Additionally, the thickness of cloud layers in monsoon regions exhibits seasonal fluctuations, thickening in summer and thinning in winter, a pattern attributed to the strong updrafts and abundant moisture brought by the summer monsoon, which promotes the formation of deep cloud layers [61,71].
During the Northern Hemisphere summer, monsoon circulations not only transport abundant moisture but also drive complex atmospheric dynamics, creating favorable conditions for the formation and persistence of multilayer cloud structures [5,105]. Studies on multilayer clouds in the Asian monsoon region have found that in June, both high-level cloud cover and deep convective cloud cover in the upper troposphere show significant increases, along with a higher probability of multilayer cloud occurrence [61,106]. Beyond moisture, wind shear generated by monsoon circulation is considered another critical factor influencing the formation of multilayer clouds during monsoon onset [16,96,107]. For example, the Indian summer monsoon system is characterized by two major jet streams: a low-level westerly jet at approximately 1–2 km, carrying warm, moist air from the southwest, and a tropical easterly jet in the upper troposphere at 14–16 km. The interaction between these jets creates significant wind shear in the lower and upper troposphere over the Indian subcontinent [107]. In the South Asian monsoon region, the presence of westerlies at lower levels and easterlies at upper levels forms an easterly shear, which may promote the formation of multilayer clouds [108]. The vertical structure of zonal winds in the East Asian monsoon region is more complex. South of 25° N, westerlies dominate the lower troposphere, while easterlies prevail in the upper troposphere, creating vertical easterly shear. In contrast, north of 25° N, westerlies in the lower troposphere intensify significantly in the upper troposphere, resulting in vertical westerly shear [96]. However, the influence of meridional winds on multilayer cloud formation remains unclear.
In summary, while moisture supply is a fundamental prerequisite for cloud formation, the development of multilayer clouds is also heavily influenced by atmospheric dynamics, particularly wind shear and updrafts. These factors interact to shape the vertical structure of clouds, leading to the complex and stratified patterns observed in multilayer cloud systems. However, to date, there is still some controversy regarding the research results on the formation mechanism of multi-layer clouds. For instance, Harrington et al. [85] proposed a mechanism for multilayer cloud formation in the Arctic, suggesting that ice production and sedimentation in upper cloud layers contribute to the formation of a second lower cloud layer. Meanwhile, Ma et al. [69] emphasized the necessity of significant wind shear at high altitudes for multilayer cloud formation, noting that wind shear can split existing cloud layers, ultimately leading to the emergence of multilayer structures [69]. While some studies have proposed possible mechanisms for multilayer cloud formation in specific regions, these mechanisms are often based on inference rather than direct experimental results, leaving the full range of influencing factors incompletely understood. Furthermore, current discussions on multilayer cloud formation mechanisms have yet to incorporate other relevant factors such as radiation and aerosols. As a result, a universally accepted theoretical framework for the formation mechanisms of multilayer clouds has not yet been established, and this field of research remains in a phase of deep exploration and continuous refinement.

5. Climate Effects of Multilayer Clouds

5.1. Multilayer Precipitation Clouds and the “Seeding-Feeding” Mechanism
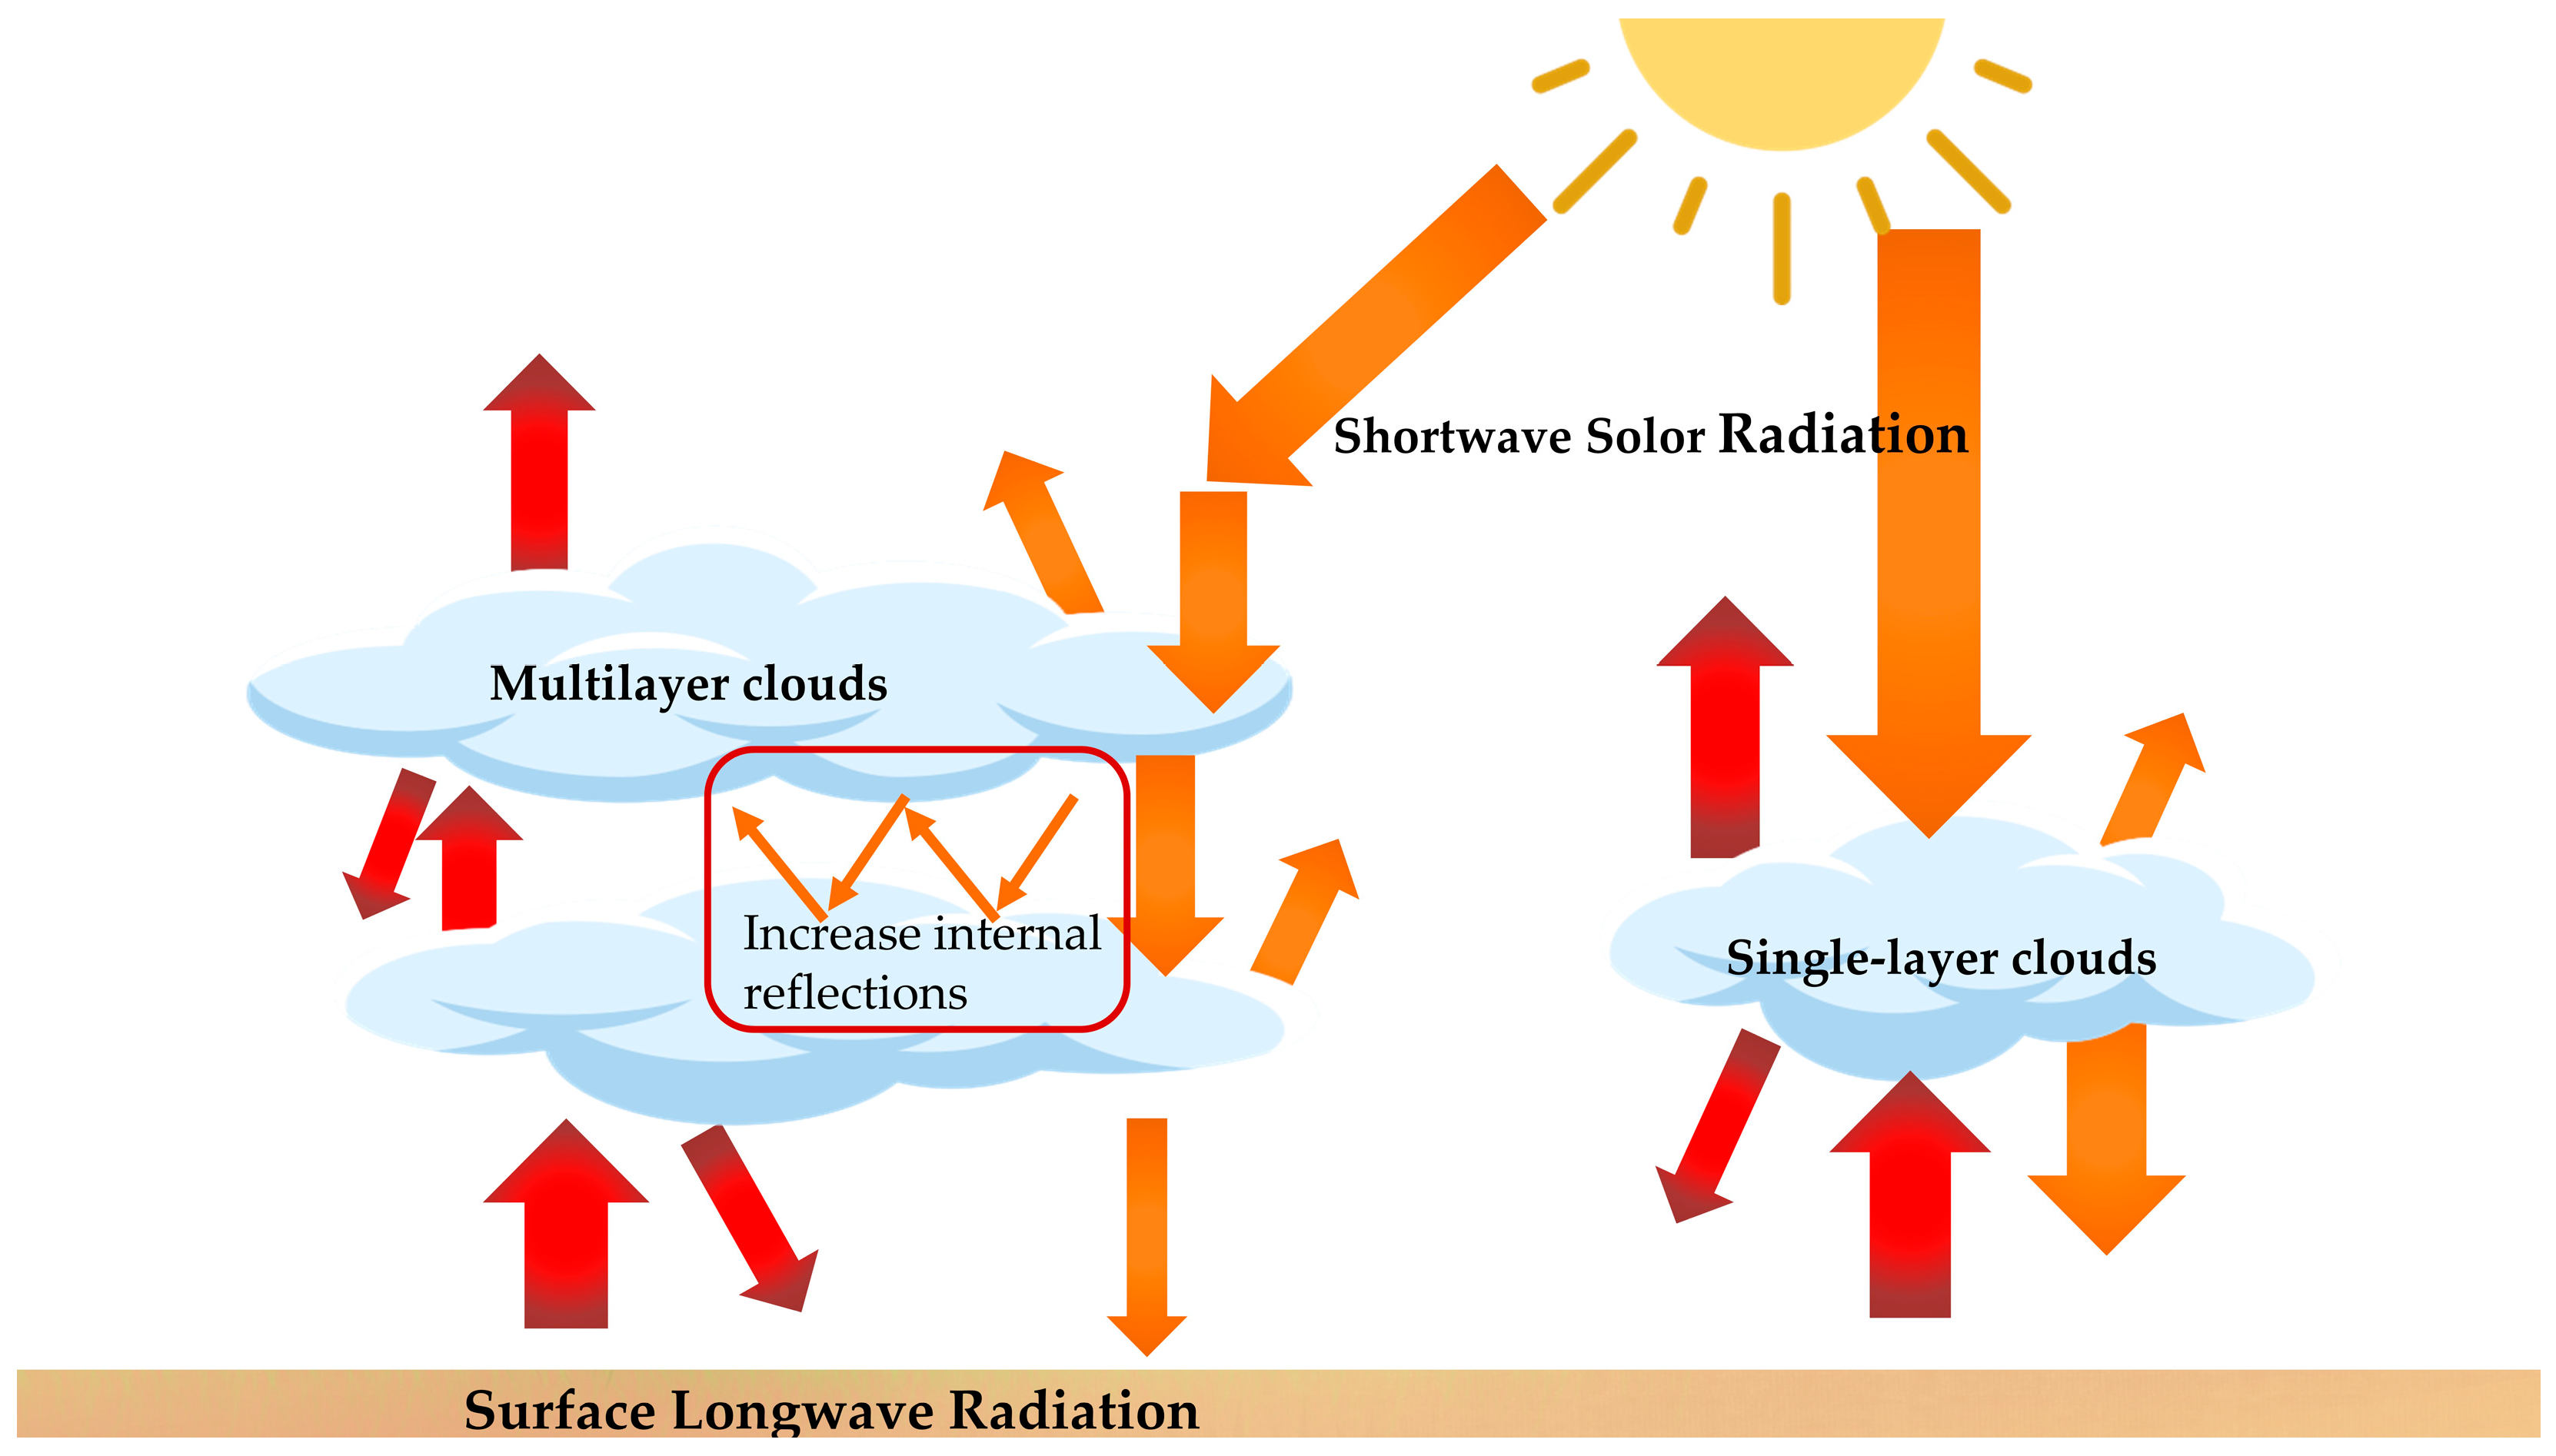
Multilayer cloud systems typically composed of overlapping cloud layers at different altitudes and of varying types, interact with each other to regulate atmospheric moisture cycles and energy transport [37,109]. This complex cloud structure can enhance the number of condensation nuclei within clouds, promoting the condensation of water vapor into cloud droplets, and it can further promote precipitation through microphysical processes such as coalescence growth and ice crystal formation [110,111]. The presence of multilayer clouds can also extend the lifecycle of precipitation systems, making the precipitation process more sustained and stable [112]. From a climate perspective, the regulation of precipitation by multilayer clouds is crucial. They not only increase the frequency and intensity of precipitation events but also influence regional climate by altering the temporal and spatial distribution of precipitation [112,113,114].
In the monsoon region, previous studies have identified correlations between multilayer cloud cover, cloud types, cloud thickness, and precipitation intensity. For example, in the South Asian monsoon region, precipitation peaks during summer and drops to minimal levels in winter [62]. This phenomenon reflects the enhancement of convective activity during monsoon season, significantly influencing the regional convective patterns and leading to conversion in dominant precipitation cloud types, which in turn affect precipitation intensity [115]. In the East Asian monsoon region, single-layer clouds dominate precipitation, while in the South Asian monsoon region, precipitation clouds are primarily single-layer and double-layer, with double-layer clouds accounting for 30% of precipitation clouds [62]. In the East Asian monsoon system, precipitation double-layer clouds exhibit mixed characteristics of cumulus and stratocumulus, while in the South Asian monsoon system, nimbostratus, cumulus, and deep convective clouds contribute equally to precipitation. Regardless of whether the cloud layers are single or multilayer, observational data show that the highest probability of precipitation and freezing precipitation occurs in the cloud layer closest to the surface, revealing that precipitation activity primarily occurs in the lowest cloud layer [41,62,116]. This phenomenon is also observed in studies of precipitation clouds in Northeast China, where double-layer precipitation clouds typically consist of high-low or mid-low clouds, both of which are cold clouds with ice crystals in the upper layers and abundant supercooled water in the lower layers, facilitating natural precipitation [116].
From the perspective of mechanisms by which multilayer clouds influence precipitation, their vertical structure enables a unique “seeding-feeding” mechanism. This mechanism involves ice-phase particles from upper ice clouds acting as “seeds” that descend into lower liquid-phase clouds, which serve as “feeding” zones, providing the moisture necessary for the growth of ice-phase particles [117]. Numerous studies have extensively validated the scientific validity of this mechanism [118,119,120,121]. The “seeding-feeding” mechanism impacts precipitation in two main ways: 1. enhancing precipitation amounts, and 2. improving precipitation efficiency. He et al. [120] found that the strongest “seeding-feeding” interactions between cumulus and stratiform clouds coincide with the peak intensity of precipitation. In aircraft observations of multilayer clouds, Wang et al. [42] observed a rapid increase in ice crystal numbers following artificial seeding. Specifically, when seeding was conducted in upper cloud layers, the droplet spectrum widened significantly, with a notable increase in droplets larger than 12 µm. As ice crystals from the upper layers fell into the lower layers, the lower clouds, acting as “feeding” clouds, also exhibited a broadening of the droplet spectrum, particularly with an increase in ice crystals larger than 20 µm, accelerating the initiation of precipitation. Similarly, Li et al. [111] observed that the “seeding-feeding” mechanism significantly increased the number of large ice crystals in double-layer stratiform clouds, shortening the time required for precipitation initiation.
However, studies have observed that the presence of interlayers in some multilayer precipitation clouds can significantly inhibit the “seeding-feeding” mechanism, thereby affecting precipitation efficiency. Specifically, interlayers contain minimal liquid water and low relative humidity. As the thickness of the interlayer increases, raindrops or ice crystals descending from upper layers evaporate or sublimate within the interlayer, effectively interrupting the normal growth process of ice crystals and suppressing precipitation intensity. Thus, the thickness of interlayers directly influences cloud and precipitation development [41,122,123]. This phenomenon is also observed in studies of the vertical structure of precipitation clouds. In double-layer cloud systems, when the base height of the lower cloud is low, its thickness is substantial and the interlayer is thin, abundant supercooled water is maintained within the cloud, and the upper layer’s seeding effect on the lower layer facilitates precipitation [116]. Liu et al. [114] also noted that in interactions between mid-low and high clouds, high clouds play a seeding role, promoting increased precipitation and making the precipitation process more robust.
Beyond the “seeding-feeding” mechanism, the distribution, thickness, and vertical microphysical structure of multilayer clouds also influence precipitation characteristics. Consequently, many studies focus on the vertical structure of multilayer precipitation clouds, aiming to identify the specific conditions under which multilayer clouds are more likely to trigger precipitation events. In the North China–Jianghuai region, the thickness of multilayer precipitation clouds is primarily 2–4 km, with cloud base heights mostly below 2 km. In the Jianghuai region, interlayer thickness is concentrated between 1 and 2 km, while in North China, interlayer thickness is typically 2–3 km. Multilayer clouds in the Jianghuai region are more prone to precipitation [123,124]. In central Inner Mongolia, multilayer precipitation clouds with interlayer thicknesses below 1 km and a first-layer thickness of around 2 km are more conducive to precipitation [29]. However, as the number of cloud layers increases, the average thickness of each layer decreases, leading to insufficient vertical development of the cloud system. This structural change reduces the likelihood of precipitation, meaning that an increase in the number of cloud layers does not directly correlate with higher precipitation probability. Instead, a thinner layer cloud reduces the chances of effective precipitation [11,116]. This finding was validated in a study by Wang et al. [41] on the vertical structure of a multilayer cloud system, where the presence of four interlayers caused ice crystals or raindrops descending from upper layers to sublimate or evaporate, significantly reducing the number of particles reaching lower layers and triggering ground-level precipitation.
In addition to multilayer clouds affecting precipitation efficiency, the precipitation process also influences the formation of multi-layer clouds. When precipitation occurs in upper cloud layers, the evaporation of raindrops or snow crystals during their fall increases humidity and induces cooling in the underlying air [81]. This evaporative cooling effect enhances vertical turbulent mixing within the boundary layer, promoting the re-condensation of water vapor into stratocumulus fractus in the lower atmosphere [125]. Meanwhile, the base of precipitating cloud layers undergoes longwave radiative cooling, causing the air near the cloud base to cool below the dew point and directly condense into stratocumulus fractus [126,127].
In summary, recent research has suggested that the “seeding-feeding” mechanism plays a crucial role in the formation of precipitation in multilayer clouds, not only increasing precipitation amounts but also potentially enhancing precipitation efficiency. In-depth exploration of this mechanism will provide important theoretical foundations for weather modification. Among the primary cloud types influencing precipitation, both single-layer and double-layer clouds hold significant importance, while precipitation from multilayer clouds is influenced by a combination of complex factors, including cloud thickness, cloud base height, the number of cloud layers, and interlayer thickness. However, research in this field remains relatively superficial, with most studies on multilayer precipitation clouds focusing on macroscopic structural characteristics, while investigations into microphysical processes within clouds are insufficiently detailed and comprehensive.

5.2. Radiation

Previous studies have investigated the radiative effects of clouds with different types and altitudes. For instance, high-level clouds (e.g., cirrus) are highly transparent to solar shortwave radiation but reduce outgoing longwave radiation, exacerbating atmospheric warming [12]. In contrast, low-level clouds reflect more solar radiation back into the atmosphere, exerting a cooling effect [1,128]. For multilayer clouds, research has sought to answer the critical question, “Do multilayer clouds exhibit the same radiative effects as single-layer clouds?” through experiments aimed at revealing the differences and similarities in radiative effects between multilayer and single-layer clouds.
As shown in Figure 5, multilayer clouds exhibit significantly more complex radiative effects than single-layer clouds. Globally, multilayer clouds exert net radiative forcing of approximately −40.9 W m−2 at the top of the atmosphere (TOA), −49.6 W m−2 at the surface, and +8.7 W m−2 within the atmosphere [129]. Regionally over the tropical western Pacific (τ = 15, high cloud top pressure = 200 hPa), multilayer clouds display cloud radiative effect (CRE) values ranging from −180.55 to 45.64 W m−2—contrasting sharply with single-layer clouds’ −2.00 W m−2 [130]. This complexity arises from overlapping cloud layers increasing atmospheric heating rate complexity and distinct cloud radiative heating rate (CRH): shortwave heating peaks at 7.5 km for multilayer clouds versus 9.75 km for single-layer clouds, while longwave cooling maxima occur at 8 km (multilayer clouds) versus 2 km (single-layer clouds) [127,129]. Multilayer cloud radiative behavior depends critically on microphysical properties, type, coverage, top height, and thickness [131]. Elevated cloud tops enhance shortwave cooling (magnitude study-dependent) and drive latitude-dependent CRE differences: +120 W m−2 in the tropics decreasing to −30 W m−2 at high latitudes [13]. This pattern reflects reduced TOA reflection enabling greater surface energy absorption, particularly in the tropics. However, multilayer configurations also enhance tropospheric shortwave absorption through inter-layer reflections, reducing surface radiation and amplifying cooling effects [132]. Vertical heterogeneity is pronounced over the Tibetan Plateau: net heating peaks at ~1.3 K/d within cloud layers versus near-zero in interlayer regions [133]. Generally, high thin clouds (e.g., cirrus) show stronger multilayer cloud cooling than single-layer clouds, while thick clouds (e.g., deep convection) exhibit comparable strong cooling. Notably, high-over-cumulus systems demonstrate enhanced cooling versus isolated cumulus, likely due to increased optical depth [132].
Research indicates that upper-level clouds in multilayer systems significantly alter lower-layer clouds’ longwave radiative effects. Consequently, multilayer clouds generally reduce TOA longwave radiation except in tropical regions where they increase it [13]. Christensen et al. [127] observed that upper-level clouds in the free troposphere increase the net longwave radiative flux above lower-level boundary layer clouds at 3.5 km by approximately 30 W/m2. Specifically, during the day, upper-level cirrus clouds block most solar radiation from reaching the tops of lower-level stratocumulus clouds, exerting a cooling effect. At night, upper-level clouds significantly suppress the radiative cooling rate at the tops of lower-level stratocumulus clouds (4.1 K/d). Subsequent studies have provided a more detailed analysis of this phenomenon. When clouds with relatively weak longwave radiative forcing (e.g., stratocumulus, cumulus) overlap with high-level clouds to form multilayer clouds, the longwave heating effect on the surface–atmosphere system is enhanced, whereas for clouds with relatively strong longwave radiative forcing (e.g., deep convective clouds, nimbostratus, altostratus), the overlapping with high-level clouds weakens this effect [132]. Similar to shortwave radiative effects, the longwave radiative effects of multilayer clouds also exhibit significant vertical differences. Over the Tibetan Plateau, the tops of upper-level clouds in multilayer systems show strong radiative cooling effects, with cooling rates reaching up to 2 K/d, while the bases of lower-level clouds exhibit some heating, with heating rates around 0.3 K/d [134].
Notably, the interaction between multilayer clouds and longwave radiation is bidirectional, i.e., longwave radiation also plays an important role in the formation and maintenance of multilayer clouds. Luo et al. [39] found that the maintenance of multilayer cloud systems depends on longwave radiation. The longwave cooling effect near cloud tops causes environmental water vapor to reach supersaturation while generating stronger upward motion. Additionally, the warming effect at the base of upper-level clouds stabilizes the interlayer between the two cloud layers. Christensen et al. [127] observed that in multilayer systems with “high clouds + low clouds”, the warming effect at the base of upper-level clouds weakens the longwave radiative cooling at the tops of lower-level clouds, reducing turbulent mixing in the boundary layer at night and limiting the vertical development of lower-level clouds. In another study conducted by Lv [132], this characteristic was also validated.
In summary, the radiative effects of multilayer clouds can vary significantly depending on their physical properties. For instance, the shortwave radiative effects of multilayer clouds may exhibit opposite trends across different regions, while their longwave radiative effects show distinct vertical variations. Furthermore, numerous studies have found that the development and maintenance of multilayer clouds themselves are also influenced by longwave radiation. However, it is noteworthy that due to technical limitations, most research to date has primarily focused on the radiative effects of multilayer clouds at the surface or top of the atmosphere, and comparative studies on radiative effects within multilayer clouds or between multilayer and single-layered clouds remain relatively scarce. Additionally, the lack of observational data has led to considerable discrepancies among climate models in simulating the radiative effects of multilayer clouds.

6. Conclusions and Recommendations for Future Studies

Generally speaking, substantial advancements have been achieved in elucidating the spatiotemporal distribution, three-dimensional morphology, genesis mechanisms, and climate effects of multilayer clouds to date. In recent years, observational techniques have undergone continuous improvement in studying the horizontal distribution and vertical structure of clouds. Satellite remote sensing, aircraft observations, and radiosounding techniques have become widely used and efficient tools for detecting the vertical structures of clouds. Nevertheless, persistent uncertainties complicate measurements. While passive sensors restrict vertical profiling capabilities due to limited penetration through optically thick clouds, the synergistic observation of cloud radar and lidar is constrained by inherent discrepancies in measurement principles and spatiotemporal sampling, leading to sampling biases in characterizing vertically heterogeneous cloud systems. Furthermore, the complex interplay of mixed-phase clouds and extreme environmental factors in polar regions imposes unique challenges on observation instruments for multilayer cloud identification. Analysis of observational data demonstrates that globally prevalent multilayer clouds exhibit distinct horizontal distribution patterns with regional variations, particularly showing heightened frequencies in convectively active regions. These clouds typically demonstrate characteristic vertical configurations where double-layer clouds predominate, with vertical thickness decreasing from upper to lower layers and reaching minimal values at middle levels. Many studies proposed that the vertical structure shows significant seasonal variability, as intensified surface heating during summer seasons produces stronger updrafts capable of maintaining simultaneous cloud systems across multiple atmospheric layers.
The formation mechanisms of multilayer clouds are complex and vary significantly across different regions. For example, in the Arctic, the formation of multilayer clouds may be closely related to the generation of ice crystals in upper cloud layers and their downward sedimentation. In monsoon regions, vertical wind shear plays a more critical role in the formation of multilayer clouds. Additionally, the formation of multilayer clouds is believed to be closely associated with atmospheric circulation. Studies demonstrate that the unique “seeding-feeding” mechanism in multilayer clouds can significantly affect precipitation amounts and efficiency, representing a key climate effect of these systems. In terms of radiation, the shortwave and longwave radiative effects of multilayer clouds exhibit notable regional and vertical differences. Furthermore, parameters such as cloud type, cloud top height, and cloud layer thickness can significantly influence specific climate effects.
As our understanding of multilayer clouds deepens, it has become increasingly evident that their formation mechanisms may be far more complex than currently understood, and their climate effects may vary considerably due to multiple influencing factors. However, current knowledge in these areas remains limited, and even existing studies present some controversial findings. Therefore, to further clarify the formation mechanisms of multilayer clouds in different regions and their interactions with climate, future research can focus on the following aspects:
(1)
More Precise Long-Term Observations: To enhance our understanding of the complex structures of multilayer clouds and expand global monitoring capabilities, it is essential to strengthen observational efforts. Specifically, the frequency of aircraft observations should be significantly increased, more intensive-sounding observation programs should be implemented, and advanced instruments should be deployed at more locations. Additionally, integrating data from multiple observational sources to create high-precision, high spatiotemporal resolution three-dimensional datasets will provide a comprehensive understanding of the dynamic changes in multilayer clouds across different time scales and larger spatial ranges.
(2)
Deeper Mechanistic Analysis: To date, our understanding of the formation mechanisms of multi-layer clouds remains relatively limited, particularly regarding factors such as aerosol effects. Aerosols play an important role in cloud formation and may also be crucial in the formation of multilayer clouds. Furthermore, significant differences in aerosol composition across different geographical regions add complexity to investigating their influence on multilayer cloud formation. Therefore, it is hoped that more researchers will focus on the effects and mechanisms of aerosols in the formation of multilayer clouds. Additionally, further exploration is needed to understand how factors at different scales and regions collectively influence the formation of multilayer clouds and the complex coupling mechanisms among them.
(3)
More Comprehensive Interdisciplinary Research: Previous studies have shown that although multilayer clouds occur with limited frequency, they involve complex regions and conditions. Many analyses of their formation mechanisms and climate effects rely heavily on assumptions, necessitating more interdisciplinary research using integrated approaches. In the future, observational data should be fully utilized and combined with laboratory simulations to deepen our understanding of the microphysical processes within multilayer clouds. Furthermore, leveraging numerical models and artificial intelligence technologies will enable a more detailed exploration of the formation mechanisms of multilayer clouds in different regions and provide a more comprehensive understanding of their interactions with global climate change.
By addressing these research directions, our knowledge of multilayer clouds can be advanced, climate models can be improved, and our ability to predict and mitigate the impacts of multilayer clouds on weather and climate systems can be enhanced.

Author Contributions

Conceptualization, C.Y. and J.X.; methodology, C.Y. and Y.H.; validation, Y.Q.; writing—original draft preparation, J.X.; writing—review and editing, C.Y.; visualization, Y.Q. and Y.H.; supervision, C.Y.; project administration, C.Y. All authors have read and agreed to the published version of the manuscript.

Funding

This research was funded by the National Natural Science Foundation of China (grant numbers 42030606, 42305203, 42005085, and 42030611), and the National Key R&D Program of China (grant number 2023YFC3007502).

Conflicts of Interest

The authors declare no conflicts of interest.

References

  1. Zhang, H.; Wang, F.; Wang, F.; Li, J.; Chen, X.; Wang, Z.; Li, J.; Zhou, X.; Wang, Q.; Wang, H.; et al. Advances in cloud radiative feedbacks in global climate change. Sci. Sin. 2022, 52, 400–417. (In Chinese) [Google Scholar] [CrossRef]
  2. Trenberth, K.E.; Fasullo, J.T.; Kiehl, J. Earth’s global energy budget. Bull. Am. Meteorol. Soc. 2009, 90, 311–324. [Google Scholar] [CrossRef]
  3. Wang, S.; Han, Z.; Yao, Z.; Zhao, Z.; Xiang, J. Statistical analysis of cloud vertical structure in China and surrounding areas based on CloudSat data. Plateau Meteor 2011, 5, 38–52. (In Chinese) [Google Scholar] [CrossRef]
  4. Ding, X.; Huang, J.; Li, J.; Wang, T.; Huang, Z. Study on Cloud Vertical Structure Feature over Northwest China Based on Active Satellite Remote Sensing and Its Influence on Precipitation Enhancement. J. Arid. Meteorol. 2012, 4, 529–538. Available online: https://qikan.cqvip.com/Qikan/Article/Detail?id=44440654 (accessed on 4 June 2025). (In Chinese).
  5. Sun, G. A Study of the Interaction Between East Asian Summer Monsoon Activity and Cloud Vertical Structure. Ph.D. Dissertation, National University of Defense Technology, Changsha, China, 2021. (In Chinese). [Google Scholar]
  6. Lv, Q.; Zhang, Y.; Li, J. Radiative characteristics of various cloud types over southern mid-high latitudes. Acta Meteorol. Sin. 2017, 75, 596–606. (In Chinese) [Google Scholar] [CrossRef]
  7. Rossow, W.B.; Schiffer, R.A. ISCCP cloud data products. Bull. Am. Meteorol. Soc. 1991, 72, 2–20. [Google Scholar] [CrossRef]
  8. Wind, G.; Platnick, S.; King, M.D.; Hubanks, P.A.; Pavolonis, M.J.; Heidinger, A.K.; Yang, P.; Baum, B.A. Multilayer cloud detection with the MODIS near-infrared water vapor absorption band. J. Appl. Meteorol. Climatol. 2010, 49, 2315–2333. [Google Scholar] [CrossRef]
  9. Li, J. Cloud Vertical Structures by Combined Active and Passive Satellite Data. Ph.D. Dissertation, Lanzhou University, Lanzhou, China, 2012. (In Chinese). [Google Scholar]
  10. Wang, L.; Dessler, A.E. Instantaneous cloud overlap statistics in the tropical area revealed by ICESat/GLAS data. Geophys. Res. Lett. 2006, 33, 2005GL024350. [Google Scholar] [CrossRef]
  11. Peng, J.; Zhang, H.; Shen, X. Analysis of Vertical Structure of Clouds in East Asia with CloudSat Data. Chin. J. Atmos. Sci. 2013, 37, 91–100. (In Chinese) [Google Scholar] [CrossRef]
  12. Yuan, T.; Oreopoulos, L. On the global character of overlap between low and high clouds. Geophys. Res. Lett. 2013, 40, 5320–5326. [Google Scholar] [CrossRef]
  13. Li, J.; Yi, Y.; Minnis, P.; Huang, J.; Yan, H.; Ma, Y.; Wang, W.; Kirk Ayers, J. Radiative effect differences between multi-layered and single-layer clouds derived from CERES, CALIPSO, and CloudSat data. J. Quant. Spectrosc. Radiat. Transf. 2011, 112, 361–375. [Google Scholar] [CrossRef]
  14. Mace, G.G.; Marchand, R.; Zhang, Q.; Stephens, G. Global hydrometeor occurrence as observed by CloudSat: Initial observations from summer 2006. Geophys. Res. Lett. 2007, 34, 2006GL029017. [Google Scholar] [CrossRef]
  15. Li, J.; Huang, J.; Stamnes, K.; Wang, T.; Lv, Q.; Jin, H. A global survey of cloud overlap based on CALIPSO and CloudSat measurements. Atmos. Chem. Phys. 2015, 15, 519–536. [Google Scholar] [CrossRef]
  16. Subrahmanyam, K.V.; Kumar, K.K. CloudSat observations of multi layered clouds across the globe. Clim. Dyn. 2017, 49, 327–341. [Google Scholar] [CrossRef]
  17. Wang, J.; Rossow, W.B.; Zhang, Y. Cloud Vertical Structure and Its Variations from a 20-Yr Global Rawinsonde Dataset. J. Clim. 2000, 13, 3041–3056. [Google Scholar] [CrossRef]
  18. Wang, Z.; Wang, Z.; Cao, X. Consistency analysis for cloud vertical structure derived from millimeter cloud radar and radiosonde profiles. Acta Meteorol. Sin. 2016, 5, 815–826. (In Chinese) [Google Scholar] [CrossRef]
  19. Wan, X.; Xu, G.; Wan, R.; Wang, B.; Ren, J.; Luo, C. Vertical structure of non-precipitation cloud obtained from cloud radar observation at Ganzi in the eastern Qinghai-Tibet Plateau. Torrential Rain Disasters 2020, 39, 442–450. Available online: http://www.byzh.org.cn/cn/article/doi/10.3969/j.issn.1004-9045.2020.05.002 (accessed on 4 June 2025). (In Chinese).
  20. Wu, C.; Liu, L.; Zhai, X. The Comparison of Cloud Base Observations with Ka-Band Solid-State Transmitter-Based Millimeter Wave Cloud Radar and Ceilometer in Summer over Tibetan Plateau. Chin. J. Atmos. Sci. 2017, 41, 659–672. (In Chinese) [Google Scholar] [CrossRef]
  21. Marchand, R.T.; Ackerman, T.P.; King, M.D.; Moroney, C.; Davies, R.; Muller, J.P.A.L.; Gerber, H. Multiangle observations of Arctic clouds from FIRE ACE: June 3, 1998, case study. J. Geophys. Res. Atmos. 2001, 106, 15201–15214. [Google Scholar] [CrossRef]
  22. Blanchard, Y.; Pelon, J.; Eloranta, E.W.; Moran, K.P.; Delanoë, J.; Sèze, G. A synergistic analysis of cloud cover and vertical distribution from A-Train and ground-based sensors over the high Arctic station EUREKA from 2006 to 2010. J. Appl. Meteorol. Climatol. 2014, 53, 2553–2570. [Google Scholar] [CrossRef]
  23. Zhang, J.; Xia, X.; Chen, H. A comparison of cloud layers from ground and satellite active remote sensing at the Southern Great Plains ARM site. Adv. Atmos. Sci. 2017, 34, 347–359. [Google Scholar] [CrossRef]
  24. Wang, D.; Guo, J.; Xu, H.; Li, J.; Lv, Y.; Solanki, R.; Guo, X.; Han, Y.; Chen, T.; Ding, M.; et al. Vertical structures of temperature inversions and clouds derived from high-resolution radiosonde measurements at Ny-Ålesund, Svalbard. Atmos. Res. 2021, 254, 105530. [Google Scholar] [CrossRef]
  25. Bertrand, L.; Kay, J.E.; Haynes, J.; De Boer, G. A global gridded dataset for cloud vertical structure from combined CloudSat and CALIPSO observations. Earth Syst. Sci. Data 2024, 16, 1301–1316. [Google Scholar] [CrossRef]
  26. Liu, X.; He, T.; Sun, L.; Xiao, X.; Liang, S.; Li, S. Analysis of Daytime Cloud Fraction Spatiotemporal Variation over the Arctic from 2000 to 2019 from Multiple Satellite Products. J. Clim. 2022, 35, 7595–7623. [Google Scholar] [CrossRef]
  27. Xie, S.; Hao, C.; Zou, B.; Sheng, X.; Zhang, C.; Jing, Q.; Liao, X. A new type of shipboard meteorological satellite receiving-processing system. Haiyang Xuebao 2000, 4, 31–40. (In Chinese) [Google Scholar] [CrossRef]
  28. Liu, H.; Qiao, J. Design of Servo Control System Based on AET Pedestal for Tracking Remote Sensing Satellites. Radio Eng. 2011, 41, 32–35. (In Chinese) [Google Scholar] [CrossRef]
  29. Su, L.; Zheng, X.; Wang, K.; Yu, S.; Wang, X. Analysis on Climatological Characteristics of Cloud and Vertical Structure Characteristics of Rain Cloud in Inner Mongolia. Meteorol. J. Inn. Mong. 2017, 2, 3–8. (In Chinese) [Google Scholar] [CrossRef]
  30. Liu, Y.; Key, J.R.; Ackerman, S.A. Arctic cloud macrophysical characteristics from CloudSat and CALIPSO. Remote Sens. Environ. 2012, 124, 159–173. [Google Scholar] [CrossRef]
  31. Sourdeval, O.; C.-Labonnote, L.; Baran, A.J.; Mülmenstädt, J.; Brogniez, G. A methodology for simultaneous retrieval of ice and liquid water cloud properties. Part 2: Near-global retrievals and evaluation against A-Train products. Q. J. R. Meteorol. Soc. 2016, 142, 3063–3081. [Google Scholar] [CrossRef]
  32. Qi, L.; Liu, Q.; Wei, J.; Ding, Y.; Deng, S. Spatial distribution sand vertical structures of multilevel warm cloud systems over global oceans. J. Univ. Sci. Technol. China 2018, 12, 1012–1021. (In Chinese) [Google Scholar] [CrossRef]
  33. Zhang, X.; Wang, H.; Che, H.-Z.; Tan, S.-C.; Shi, G.-Y.; Yao, X.-P. The impact of aerosol on MODIS cloud detection and property retrieval in seriously polluted East China. Sci. Total Environ. 2020, 711, 134634. [Google Scholar] [CrossRef]
  34. Tan, S.; Zhang, X.; Wang, H.; Chen, B.; Shi, G.; Shi, C. Comparisons of cloud detection among four satellite sensors on severe haze days in eastern China. Atmos. Ocean. Sci. Lett. 2018, 11, 86–93. [Google Scholar] [CrossRef]
  35. Ackerman, S.A.; Strabala, K.I.; Menzel, W.P.; Frey, R.A.; Moeller, C.C.; Gumley, L.E. Discriminating clear sky from clouds with MODIS. J. Geophys. Res. Atmos. 1998, 103, 32141–32157. [Google Scholar] [CrossRef]
  36. Romano, F.; Cimini, D.; Nilo, S.T.; Di Paola, F.; Ricciardelli, E.; Ripepi, E.; Viggiano, M. The Role of Emissivity in the Detection of Arctic Night Clouds. Remote Sens. 2017, 9, 406. [Google Scholar] [CrossRef]
  37. Zhang, H.; Peng, J.; Jing, X.; Li, J. Vertical overlap characteristics of clouds in East Asia and their impact on cloud radiative forcing. Sci. Sin. 2013, 43, 523–535. (In Chinese) [Google Scholar] [CrossRef]
  38. Jin, X.; Hanesiak, J.; Barber, D. Detecting cloud vertical structures from radiosondes and MODIS over Arctic first-year sea ice. Atmos. Res. 2007, 83, 64–76. [Google Scholar] [CrossRef]
  39. Luo, Y.; Xu, K.M.; Morrison, H.; McFarquhar, G.M.; Wang, Z.; Zhang, G. Multi-layer arctic mixed-phase clouds simulated by a cloud-resolving model: Comparison with ARM observations and sensitivity experiments. J. Geophys. Res. Atmos. 2008, 113, D12208. [Google Scholar] [CrossRef]
  40. Marinou, E.; Tesche, M.; Nenes, A.; Ansmann, A.; Schrod, J.; Mamali, D.; Tsekeri, A.; Pikridas, M.; Baars, H.; Engelmann, R.; et al. Retrieval of ice-nucleating particle concentrations from lidar observations and comparison with UAV in situ measurements. Atmos. Chem. Phys. 2019, 19, 11315–11342. [Google Scholar] [CrossRef]
  41. Wang, W.; Dong, X.; Shi, L.; Liu, J.; Liu, P.; Zhang, S. Study on Vertical Microphysical Structure of Cloud for a Multi-layer Cloud System. Plateau Meteorol. 2011, 4, 1368–1375. Available online: https://kns.cnki.net/kcms2/article/abstract?v=tMRSZR5ycIulE4PNt1VkY80KDPOsIHgGrw4k9reCvyDfKHTvQFaTw_CUdnd90-W_23Y00Dj1PfDBKVorV5ZTvfP7l2Z7ilpF7R4q1qjAfiwKzYHhFea3R4UFqVZZaxiDZSE2icKZweC6UXVB-Hy7GD8Gi6esz5fD0wuOiuAoO66deNAFOSpKLWAt0M7FPLYE&uniplatform=NZKPT&language=CHS (accessed on 4 June 2025). (In Chinese).
  42. Wang, Z.; Wang, H.; Dong, X.; Yang, Y.; Ke, Y.; Liu, S.; Cui, Y.; Cui, K.; Wu, Z.; Lin, W. Aircraft observation of aerosol and mixed-phase cloud microphysical over the North China Plain, China: Vertical distribution, size distribution, and effects of cloud seeding in two-layered clouds. Atmos. Res. 2024, 312, 107758. [Google Scholar] [CrossRef]
  43. Henneberger, J.; Ramelli, F.; Spirig, R.; Omanovic, N.; Miller, A.J.; Fuchs, C.; Zhang, H.; Bühl, J.; Hervo, M.; Kanji, Z.A.; et al. Seeding of Supercooled Low Stratus Clouds with a UAV to Study Microphysical Ice Processes: An Introduction to the CLOUDLAB Project. Bull. Am. Meteorol. Soc. 2023, 104, E1962–E1979. [Google Scholar] [CrossRef]
  44. Zhai, W.; Ma, J.; Gu, Q.; Li, H. Operational risks and prevention of weather modification aircraft construction projects. China Saf. Sci. J. 2022, 32, 103–107. (In Chinese) [Google Scholar] [CrossRef]
  45. Qiu, H.; Fang, W.; Wang, X.; Lin, H. Applications of GPS Radiosondes and Aircrafts for a Precipitation Analysis in Zhangjiakou Region during the Spring of 2009. Acta Sci. Nat. Univ. Pekin. 2011, 47, 619–626. (In Chinese) [Google Scholar] [CrossRef]
  46. Poore, K.D.; Wang, J.; Rossow, W.B. Cloud layer thicknesses from a combination of surface and upper-air observations. J. Clim. 1995, 8, 550–568. [Google Scholar] [CrossRef]
  47. Wang, J.; Rossow, W.B. Determination of cloud vertical structure from upper-air observations. J. Appl. Meteorol. Climatol. 1995, 34, 2243–2258. [Google Scholar] [CrossRef]
  48. Zhou, Y.; Ou, J. The Method of Cloud Vertical Structure Analysis Using Rawinsonde Observation and Its Applied Research. Meteorol. Mon. 2010, 36, 50–58. (In Chinese) [Google Scholar]
  49. Zhang, J.; Chen, H.; Li, Z.; Fan, X.; Peng, L.; Yu, Y.; Cribb, M. Analysis of cloud layer structure in Shouxian, China using RS92 radiosonde aided by 95 GHz cloud radar. J. Geophys. Res. Atmos. 2010, 115, 2010JD014030. [Google Scholar] [CrossRef]
  50. Reddy, N.N.; Ratnam, M.V.; Basha, G.; Ravikiran, V. Cloud vertical structure over a tropical station obtained using long-term high-resolution radiosonde measurements. Atmos. Chem. Phys. 2018, 18, 11709–11727. [Google Scholar] [CrossRef]
  51. Cai, M.; Ou, J.; Zhou, Y.; Yang, Q.; Cai, Z. Discriminating Cloud Area by Using L-Band Sounding Data. Chin. J. Atmos. Sci. 2014, 38, 213–222. (In Chinese) [Google Scholar] [CrossRef]
  52. Li, Q.; Cai, M.; Zhou, Y.; Tang, Y.; Ou, J. Characteristics of Cloud Vertical Distribution Based on Cloud Identification by Radiosonde. Chin. J. Atmos. Sci. 2021, 45, 1161–1172. (In Chinese) [Google Scholar] [CrossRef]
  53. Chernykh, I.V.; Eskridge, R.E. Determination of cloud amount and level from radiosonde soundings. J. Appl. Meteorol. Climatol. 1996, 35, 1362–1369. [Google Scholar] [CrossRef]
  54. Minnis, P.; Yi, Y.; Huang, J.; Ayers, K. Relationships between radiosonde and RUC-2 meteorological conditions and cloud occurrence determined from ARM data. J. Geophys. Res. Atmos. 2005, 110, 2005JD006005. [Google Scholar] [CrossRef]
  55. Ge, J.; Hu, X.; Wang, C.; Dong, Z.; Du, J. A Novel Bilateral Filter Hydrometeor Detection Method for Microwave Radar. Adv. Earth Sci. 2020, 35, 1256–1269. (In Chinese) [Google Scholar] [CrossRef]
  56. Wang, F. Research on 3D Cloud Radar Reflectivity Inversion Technology for MODIS Cloud Observation Based on CGAN Deep Learning. Master’s Thesis, Nanjing University of Information Science and Technology, Nanjing, China, 2024. (In Chinese). [Google Scholar]
  57. Tan, Z.; Ma, S.; Liu, C.; Ai, W.; Ye, T.; Zhao, X.; Hu, S.; Li, B.; Zhang, M.; Yan, W. Research Progress in Cloud Base Height Retrieval Algorithms Based on Satellite Multi-Spectral Radiometer Imagers. Acta Opt. Sin. 2024, 44, 1–10. (In Chinese) [Google Scholar] [CrossRef]
  58. Huang, Q.; Yin, X.; Wang, Z.; Yao, S. Study on cloud macro and micro characteristics in China based on multi-source satellite data.Journal of the Meteorological Sciences. J. Meteorol. Sci. 2023, 43, 143–154. (In Chinese) [Google Scholar] [CrossRef]
  59. Zhao, W.; Wang, Y.; Bi, Y.; Wu, X.; Tian, Y.; Wu, L.; Luo, J.; Hu, X.; Qi, Z.; Li, J.; et al. Unveiling Cloud Vertical Structures over the Interior Tibetan Plateau through Anomaly Detection in Synergetic Lidar and Radar Observations. Adv. Atmos. Sci. 2024, 41, 2381–2398. [Google Scholar] [CrossRef]
  60. Luo, H.; Quaas, J.; Han, Y. Examining cloud vertical structure and radiative effects from satellite retrievals and evaluation of CMIP6 scenarios. Atmos. Chem. Phys. 2023, 23, 8169–8186. [Google Scholar] [CrossRef]
  61. Wang, H.; Luo, Y.; Zhang, R. Analyzing Seasonal Variation of Clouds over the Asian Monsoon Regions and the Tibetan Plateau Region using CloudSat/CALIPSO Data. Chin. J. Atmos. Sci. 2011, 35, 1117–1131. (In Chinese) [Google Scholar] [CrossRef]
  62. Li, C.; Wang, T.; Lu, Q.; Li, J. Characteristics of precipitating cloud over East and South Asian monsoon region based on CloudSat. J. Lanzhou Univ. 2018, 54, 345–355. (In Chinese) [Google Scholar] [CrossRef]
  63. Herman, G.; Goody, R. Formation and Persistence of Summertime Arctic Stratus Clouds. J. Atmos. Sci. 1976, 33, 1537–1553. [Google Scholar] [CrossRef]
  64. Tsay, S.-C.; Jayaweera, K. Physical Characteristics of Arctic Stratus Clouds. J. Appl. Meteorol. Climatol. 1984, 23, 584–596. [Google Scholar] [CrossRef]
  65. Curry, J.A.; Ebert, E.E.; Herman, G.F. Mean and turbulence structure of the summertime Arctic cloudy boundary layer. Q. J. R. Meteorol. Soc. 1988, 114, 715–746. [Google Scholar] [CrossRef]
  66. Tan, R. Characteristics of Multi-Layer Clouds in Summer over the Tibetan Plateau and Eastearn China Based on CPR Measurements. Ph.D. Dissertation, University of Science and Technology of China, Hefei, China, 2018. (In Chinese). [Google Scholar]
  67. Pan, Z.; Gong, W.; Mao, F.; Li, J.; Wang, W.; Li, C.; Min, Q. Macrophysical and optical properties of clouds over East Asia measured by CALIPSO. J. Geophys. Res. Atmos. 2015, 120, 11653–11668. [Google Scholar] [CrossRef]
  68. Cai, H.; Feng, X.; Chen, Q.; Sun, Y.; Wu, Z.; Tie, X. Spatial and Temporal Features of the Frequency of Cloud Occurrence over China Based on CALIOP. Adv. Meteorol. 2017, 2017, 4548357. [Google Scholar] [CrossRef]
  69. Ma, J.; Yao, X.; Yuan, C. Characteristics and Formation Mechanism of the Cloud Vertical Structure Over the Southeastern Tibetan Plateau in Summer. Earth Space Sci. 2023, 10, e2022EA002811. [Google Scholar] [CrossRef]
  70. Tan, R.; Xian, T.; Fu, Y. Structures of Multi-layer Clouds in Boreal Summer Based on CPR Radar Measurements. Clim. Environ. Res. 2018, 23, 124–138. (In Chinese) [Google Scholar] [CrossRef]
  71. Das, S.K.; Golhait, R.B.; Uma, K.N. Clouds vertical properties over the Northern Hemisphere monsoon regions from CloudSat-CALIPSO measurements. Atmos. Res. 2017, 183, 73–83. [Google Scholar] [CrossRef]
  72. Li, J.; Huang, J.; Yi, Y.; Lv, D. Analysis of Vertical Distribution of Cloud in East Asia by Space-Based Lidar Data. Chin. J. Atmos. Sci. 2009, 33, 698–707. (In Chinese) [Google Scholar] [CrossRef]
  73. Han, D.; Yan, W.; Lu, W.; Liu, H. Research of cloud vertical structure around China based on COSMIC occultation data. Prog. Geophys. 2013, 28, 36–48. (In Chinese) [Google Scholar] [CrossRef]
  74. Chen, C.; Meng, H.; Jin, R.; Wang, Z. Cloud Macroscopic Characteristics over North China Based on CloudSat data. Meteorol. Sci. Technol. 2014, 2, 294–301. (In Chinese) [Google Scholar] [CrossRef]
  75. Liu, Y. Study of Aerosol Effects on Warm Cloud Macrophysical and Microphysical Characteristics over Eastern China. Ph.D. Dissertation, Institute of Remote Sensing and Digital Earth, Chinese Academy of Sciences, Beijing, China, 2017. (In Chinese). [Google Scholar]
  76. Duan, A.; Wu, G. Change of cloud amount and the climate warming on the Tibetan Plateau. Geophys. Res. Lett. 2006, 33, 217–234. [Google Scholar] [CrossRef]
  77. Feng, X.; Cai, H.; Heng, Z. Spatial and Temporal Distribution Characteristics of Vertical Structure of Multilayer Clouds in China and Surrounding Areas. Plateau Mt. Meteorol. Res. 2021, 3, 9–16. (In Chinese) [Google Scholar] [CrossRef]
  78. Yan, Y.; Liu, Y.; Lu, J. Cloud vertical structure, precipitation, and cloud radiative effects over Tibetan Plateau and its neighboring regions. J. Geophys. Res. Atmos. 2016, 121, 5864–5877. [Google Scholar] [CrossRef]
  79. Schoeberl, M.R.; Jensen, E.J.; Pfister, L.; Ueyama, R.; Wang, T.; Selkirk, H.; Avery, M.; Thornberry, T.; Dessler, A.E. Water Vapor, Clouds, and Saturation in the Tropical Tropopause Layer. J. Geophys. Res. Atmos 2019, 124, 3984–4003. [Google Scholar] [CrossRef] [PubMed]
  80. Nazaryan, H.; McCormick, M.P.; Menzel, W.P. Global characterization of cirrus clouds using CALIPSO data. J. Geophys. Res. Atmos. 2008, 113, D16211. [Google Scholar] [CrossRef]
  81. D’Alessandro, J.J.; McFarquhar, G.M.; Stith, J.L.; Diao, M.; Demott, P.J.; McCluskey, C.S.; Hill, T.C.J.; Roberts, G.C.; Sanchez, K.J. An Evaluation of Phase, Aerosol-Cloud Interactions and Microphysical Properties of Single- and Multi-Layer Clouds Over the Southern Ocean Using in Situ Observations From SOCRATES. J. Geophys. Res. Atmos. 2023, 128, e2023JD038610. [Google Scholar] [CrossRef]
  82. Ali, S.; Mehta, S.K.; Ananthavel, A.; Reddy, T.V.R. Temporal and vertical distributions of the occurrence of cirrus clouds over a coastal station in the Indian monsoon region. Atmos. Chem. Phys. 2022, 22, 8321–8342. [Google Scholar] [CrossRef]
  83. Morrison, A.L.; Kay, J.E.; Frey, W.R.; Chepfer, H.; Guzman, R. Cloud Response to Arctic Sea Ice Loss and Implications for Future Feedback in the CESM1 Climate Model. J. Geophys. Res. Atmos. 2019, 124, 1003–1020. [Google Scholar] [CrossRef]
  84. Zhou, R.; Li, Y.; Lu, C. Macroscopic Characteristics and Formation Mechanisms of Arctic Clouds Based on CloudSat-CALIPSO Data. Clim. Environ. Res. 2022, 27, 630–642. (In Chinese) [Google Scholar] [CrossRef]
  85. Harrington, J.Y.; Reisin, T.; Cotton, W.R.; Kreidenweis, S.M. Cloud resolving simulations of Arctic stratus: Part II: Transition-season clouds. Atmos. Res. 1999, 51, 45–75. [Google Scholar] [CrossRef]
  86. Rangwala, I.; Sinsky, E.; Miller, J.R. Amplified warming projections for high altitude regions of the northern hemisphere mid-latitudes from CMIP5 models. Environ. Res. Lett. 2013, 8, 024040. [Google Scholar] [CrossRef]
  87. Yin, Y. Climate of the Arctic and the South Pole. Liaoning Meteor. 1990, 1, 56. Available online: https://kns.cnki.net/kcms2/article/abstract?v=JSKsj9h_wsLoYE4_k6bdl8wNTF1inj1TVAkeCX2jyKPgAOuUxlXsh9Eu9JN3Gep8kgocSe8fNu-TNPJCtaozm2_6h0_RxUw3YTDYL0W3E6z4xs0bneP-PaBRwVbk-fRVV8V_cISidIANOKqrb0lNj--ZC0frTr7CpsKWXK20VMswJ8ZJxkanjdtKlo_44Zxt&uniplatform=NZKPT&language=CHS (accessed on 4 June 2025). (In Chinese).
  88. Kang, S.; Yao, T.; Qin, D.; Yan, Y. Characteristics of Climatic Change in Svalbard in the Arctic and Comparison with the Qinghai-Xizang Platea. Geogr. Sci. 1998, 4, 21–28. (In Chinese) [Google Scholar] [CrossRef]
  89. Li, F.; Gao, Y.; Wan, X.; Li, Q.; Guo, D.; Wang, P.; Li, H. Earth’s “three-poles” climate change under global warming. Trans. Atmos. Sci. 2021, 44, 1–11. (In Chinese) [Google Scholar] [CrossRef]
  90. Cai, Y.; Qian, Z.; Wu, T.; Liang, X.; Song, M. Distribution, Changes of Atmospheric Precipitable Water over Qinghai-Xizang Plateau and Its Surroundings and Their Changeable Precipitation Climate. Plateau Meteor. 2004, 1, 1–10. (In Chinese) [Google Scholar] [CrossRef]
  91. Wang, X.; Gong, Y.; Cen, S. Characteristics of the Moist Pool and Its Moisture Transports over Qinghai-Xizang Plateau in Summer Half Year. Acta Geogr. Sin. 2009, 64, 601–608. (In Chinese) [Google Scholar] [CrossRef]
  92. Gao, Y. Analyses and Numerical Simulations on the Vertical Structure and Microphysics Feature of Precipitating Cloud Along the Latitude Zone of Tibetan Plateau over China. Ph.D. Dissertation, Chinese Academy of Meteorological Sciences, Beijing, China, 2014. (In Chinese). [Google Scholar]
  93. Yan, Y.; Liu, Y.; Liu, X.; Wang, X. Effects of cloud microphysics on the vertical structures of cloud radiative effects over the Tibetan Plateau and the Arctic. Remote Sens. 2021, 13, 2651. [Google Scholar] [CrossRef]
  94. Zhang, J. Cloud formation. Meteorol. Mon. 1980, 10, 31–34. (In Chinese) [Google Scholar] [CrossRef]
  95. Jakob, C. Ice Clouds in Numerical Weather Prediction Models: Progress, Problems, and Prospects; Oxford University Press: Oxford, UK, 2002. [Google Scholar] [CrossRef]
  96. Huang, R.; Gu, L.; Chen, J.; Huang, G. Recent Progresses in Studies of the Temporal-Spatial Variations of the East Asian Monsoon System and Their Impacts on Climate Anomalies in China. Chin. J. Atmos. Sci. 2008, 32, 691–719. (In Chinese) [Google Scholar] [CrossRef]
  97. Wang, J.; Rossow, W.B. Effects of Cloud Vertical Structure on Atmospheric Circulation in the GISS GCM. J. Clim. 1998, 11, 3010–3029. [Google Scholar] [CrossRef]
  98. Wang, Z.; Stephens, G.; Deshler, T.; Trepte, C.; Parish, T.; Vane, D.; Winker, D.; Liu, D.; Adhikari, L. Association of Antarctic polar stratospheric cloud formation on tropospheric cloud systems. Geophys. Res. Lett. 2008, 35, L13806. [Google Scholar] [CrossRef]
  99. Cheon, W.G.; Park, Y.-G.; Yeh, S.-W.; Kim, B.M. Atmospheric impact on the northwestern Pacific under a global warming scenario. Geophys. Res. Lett. 2012, 39, L16709. [Google Scholar] [CrossRef]
  100. Bony, S.; Stevens, B.; Frierson, D.M.W.; Jakob, C.; Kageyama, M.; Pincus, R.; Shepherd, T.G.; Sherwood, S.C.; Siebesma, A.P.; Sobel, A.H.; et al. Clouds, circulation and climate sensitivity. Nat. Geosci. 2015, 8, 261–268. [Google Scholar] [CrossRef]
  101. Wu, G.; Stefano, T. Roles of the mean meridional circulation in atmospheric budgets of angular momentum and sensible heat. Chin. J. Atmos. Sci. 1988, 12, 8–17. (In Chinese) [Google Scholar] [CrossRef]
  102. Trenberth, K.; Solomon, A. The global heat balance: Heat transports in the atmosphere and ocean. Clim. Dyn. 1994, 10, 107–134. [Google Scholar] [CrossRef]
  103. Liu, C.; Zipser, E.J. Global distribution of convection penetrating the tropical tropopause. J. Geophys. Res. Atmos. 2005, 110, D23104. [Google Scholar] [CrossRef]
  104. Liu, Y.; Ding, Y. Analysis of The Basic Features of The Onset of Asian Summer Monsoon. Acta Meteorol. Sin. 2007, 4, 511–526. (In Chinese) [Google Scholar] [CrossRef]
  105. Long, J.; Feng, Z.; Wang, Y. Impact of low-level monsoon circulation over the South China Sea on the temporal-spatial distribution of low clouds. Trans. Oceanol. Limnol. 2021, 43, 23–30. (In Chinese) [Google Scholar] [CrossRef]
  106. Ding, Y. Seasonal March of the East-Asian Summer Monsoon. In World Scientific Series on Asia-Pacific Weather and Climate; World Scientific: Singapore, 2004; Volume 2, pp. 3–53. [Google Scholar] [CrossRef]
  107. Sathiyamoorthy, V.; Pal, P.K.; Joshi, P.C. Influence of the Upper-Tropospheric Wind Shear upon Cloud Radiative Forcing in the Asian Monsoon Region. J. Clim. 2004, 17, 2725–2735. [Google Scholar] [CrossRef]
  108. Chen, J.; Huang, R. The Comparison of Climatological Characteristics Among Asian and Australian Monsoon Subsystems. Part Ⅰ. The Wind Structure of Summer Monsoon. Chin. J. Atmos. Sci. 2006, 30, 1091–1102. (In Chinese) [Google Scholar] [CrossRef]
  109. Zhou, Y.; Cai, M.; Ou, J.; Cai, Z.; Shi, A. Correlation between cloud characteristic parameters and precipitation. Trans. Atmos. Sci. 2011, 34, 641–652. (In Chinese) [Google Scholar] [CrossRef]
  110. Sun, H.; Li, P.; Yan, S.; Jin, L.; Shen, D.; Feng, Q.; Li, Y. Analysis of Cloud Physical Characteristics and Precipitation Mechanisms in Stratiform Cloud Development Stage. Chin. Agric. Sci. Bull. 2015, 31, 179–193. (In Chinese) [Google Scholar] [CrossRef]
  111. Li, Y.; Shen, D.; Ren, G. Analysis the precipitation mechanism and the microphysics structures of stratiform cloud over Shanxi Province. Sci. Technol. Innov. 2017, 2, 39–42. (In Chinese) [Google Scholar] [CrossRef]
  112. Meng, X. Dissipative structure theory of multilayer cloud precipitation. J. Qufu Norm. Univ. 1994, S2, 15–16. Available online: https://kns.cnki.net/kcms2/article/abstract?v=JSKsj9h_wsIsSYP4MCrZB3t0VoULAC0XhMH6rF3SK5M1EgLPi9dNE2hfNWzU8qOIT04Z9J3XXUM2BIDf1lM2shNB3YDSPZl3yPSCy5B51q93tRb81d9reNfJIOfCsjEP_iaJBIimy2w2VmNDGbKswNW_SrRI24EFEqp-7R9SpyU0dOZ12H--BtpNIMA-kzX7&uniplatform=NZKPT&language=CHSComparing (accessed on 4 June 2025). (In Chinese).
  113. Huang, M.; Hong, Y.; Xu, H.; Zhou, H. The Effect of the Existence of Stratiform Cloud on the Development of Cumulus Cloud and Its Precipitation. Acta Meteorol. Sin. 1987, 1, 72–77. (In Chinese) [Google Scholar] [CrossRef]
  114. Liu, G.; Yu, X.; Jia, L.; Yue, Z.; Da, ij. Satellite Observation on Rainfall Enhancement in Stratiform Clouds over Shaanxi Province in Spring 2009. Arid. Zone Res. 2011, 28, 699–704. (In Chinese) [Google Scholar] [CrossRef]
  115. Xia, J.; Fu, Y. The Vertical Characteristics of Temperature and Humidity Inside Convective and Stratiform Precipitating Clouds in the East Asian Summer Monsoon Region and Indian Summer Monsoon Region. Chin. J. Atmos. Sci. 2016, 40, 563–580. (In Chinese) [Google Scholar] [CrossRef]
  116. Liu, Y.; Zhao, S.; Cai, B.; Sun, L. Comparison of Vertical Structure Between Precipitation Cloud and Non-Precipitation Cloud Based on CloudSat Data over Northeast China. Meteorol. Mon. 2017, 43, 1374–1382. (In Chinese) [Google Scholar] [CrossRef]
  117. Rutledge, S.A.; Hobbs, P. The Mesoscale and Microscale Structure and Organization of Clouds and Precipitation in Midlatitude Cyclones. VIII: A Model for the “Seeder-Feeder” Process in Warm-Frontal Rainbands. J. Atmos. Sci. 1983, 40, 1185–1206. [Google Scholar] [CrossRef]
  118. Gu, Z. Physical Basis of Cloud and Fog Precipitation; Science Press: Beijing, China, 1980. (In Chinese) [Google Scholar]
  119. Hou, T.; Hu, Z.; Lei, H. A study of the structure and microphysical processes of a precipitating stratiform cloud in Jilin. Acta Meteorol. Sin. 2011, 3, 508–520. (In Chinese) [Google Scholar] [CrossRef]
  120. He, H.; Gao, Q.; Liu, X.; Zhou, W.; Jia, X. Numerical Simulation of the Structural Characteristics and Precipitation Mechanism of Stratiform Clouds with Embedded Convections. Chin. J. Atmos. Sci. 2015, 39, 315–328. (In Chinese) [Google Scholar] [CrossRef]
  121. Thomas, J.; Barrett, A.; Hoose, C. Temperature and cloud condensation nuclei (CCN) sensitivity of orographic precipitation enhanced by a mixed-phase seeder–feeder mechanism: A case study for the 2015 Cumbria flood. Atmos. Chem. Phys. 2023, 23, 1987–2002. [Google Scholar] [CrossRef]
  122. Li, S.; Wang, G.; Liu, W. A Case Study of Micro-Structure of Precipitable Stratiform Clouds. Meteorol. Mon. 2001, 27, 17–21. (In Chinese) [Google Scholar] [CrossRef]
  123. Shang, B. Research on Vertical Structure of Cloud and Precipitation Feature of Cloudsat Data in HuaBei and JiangHuai. Master’s Thesis, Nanjing University of Information Science and Technology, Nanjing, China, 2011. (In Chinese). [Google Scholar]
  124. Shang, B.; Zhou, Y.; Liu, J.; Huang, Y. Comparing vertical structure of precipitation cloud and non-precipitation cloud using Cloudsat. J. Appl. Meteorol. Sci. 2012, 23, 1–9. Available online: https://kns.cnki.net/kcms2/article/abstract?v=JSKsj9h_wsI6MvPKX86OQDjbiL9q3VGBL-34l6KlQlPyZsji3U1gWRsUcdKs4atseS1OJNPt8cu250wUwryCwpo37DPbGQYIOHn-LX8w-u9y4KP131P4gURJM-jrF8qyYg3OcQATMmp0M7non_EOT5S7V-9yqnea8uxWC4fnWWUj0gkFJKy05ZZmHAt8xvF5&uniplatform=NZKPT&language=CHS (accessed on 4 June 2025). (In Chinese).
  125. Tao, W.K.; Chen, J.P.; Li, Z.; Wang, C.; Zhang, C. Impact of aerosols on convective clouds and precipitation. Rev. Geophys. 2012, 50, RG2001. [Google Scholar] [CrossRef]
  126. Cairo, F.; Di Liberto, L.; Dionisi, D.; Snels, M. Understanding Aerosol–Cloud Interactions through Lidar Techniques: A Review. Remote Sens. 2024, 16, 2788. [Google Scholar] [CrossRef]
  127. Christensen, M.W.; Carrió, G.G.; Stephens, G.L.; Cotton, W.R. Radiative impacts of free-tropospheric clouds on the properties of marine stratocumulus. J. Atmos. Sci. 2013, 70, 3102–3118. [Google Scholar] [CrossRef]
  128. Chen, T.; Rossow, W.B.; Zhang, Y. Radiative effects of cloud-type variations. J. Clim. 2000, 13, 264–286. [Google Scholar] [CrossRef]
  129. Lü, Q.; Li, J.; Wang, T.; Huang, J. Cloud radiative forcing induced by layered clouds and associated impact on the atmospheric heating rate. J. Meteorol. Res. 2015, 29, 779–792. [Google Scholar] [CrossRef]
  130. Kang, H.; Choi, Y.-S.; Hwang, J.; Kim, H.-S. On the cloud radiative effect for tropical high clouds overlying low clouds. Geosci. Lett. 2020, 7, 7. [Google Scholar] [CrossRef]
  131. Waliser, D.E.; Li, J.L.F.; Woods, C.P.; Austin, R.T.; Bacmeister, J.; Chern, J.; Del Genio, A.; Jiang, J.H.; Kuang, Z.; Meng, H.; et al. Cloud ice: A climate model challenge with signs and expectations of progress. J. Geophys. Res. Atmos. 2009, 114, 2008JD010015. [Google Scholar] [CrossRef]
  132. Lv, Q. Satellite Detection of Multi-Layer Clouds and Associated Radiative Effects. Ph.D. Dissertation, Lanzhou University, Lanzhou, China, 2018. (In Chinese). [Google Scholar]
  133. Ma, Y. Analysis of Radiative Forcing of Cloud over Tibetan Plateau by Cloudsat Data. Master’s Thesis, Lanzhou University, Lanzhou, China, 2011. (In Chinese). [Google Scholar]
  134. Ma, Y.; Huang, J.; Liu, Y. Impact of clouds on radiative fluxes in summer over the Tibetan plateau from Cloudsat data. J. Lanzhou Univ. 2011, 47, 48–54. (In Chinese) [Google Scholar] [CrossRef]
Figure 1. (a) The global distribution (2° × 2° grid boxes) of annually averaged multilayer cloud fraction. (b) The zonal distributions of seasonal, averaged multilayer cloud fraction (reproduced from Li et al. [15], A global survey of cloud overlap based on CALIPSO and CloudSat measurements; published by Copernicus Publications on behalf of the European Geosciences Union, 2015; available under a CC BY license).
Atmosphere 16 00692 g001
Figure 2. Spatial distributions of the 4-year (2007–2010) average: (a) single-layer cloud fraction, (b) multi-layer cloud fraction, and (c) the ratio of time-averaged single-layer cloud fraction to the multi-layer cloud fraction. The value above each subfigure indicates the area-weighted global 4-year average (reproduced from Luo et al. [60], Examining cloud vertical structure and radiative effects from satellite retrievals and evaluation of CMIP6 scenarios; published by Copernicus Publications on behalf of the European Geosciences Union, 2023; available under a CC BY license).
Atmosphere 16 00692 g002
Figure 3. Altitude distribution and vertical height distribution of multilayer clouds at two locations on the Tibet Plateau, with gray denoting terrain elevation at radiosonde locations, orange for low-level clouds, purple for mid-level clouds, and blue for high-level clouds (data sourced from Ma et al. [69]).
Atmosphere 16 00692 g003
Figure 4. Diagram of the formation mechanism of multilayer clouds. Arrows illustrate key processes in multi—layer cloud formation, including water—vapor transport, updraft—driven lifting, ice—crystal sedimentation, and environmental influences, with each arrow representing a distinct atmospheric dynamic or phase—change mechanism.
Atmosphere 16 00692 g004
Figure 5. Schematic representation of radiative processes in single-layer versus multilayer clouds (orange arrows: shortwave radiation; red arrows: longwave radiation).
Atmosphere 16 00692 g005
Table 1. Global average statistical results of vertical structures in multilayer cloud systems (unit: km).
Multilayer Cloud TypeLocationLayerCloud Top HeightCloud Base HeightCloud Layer ThicknessInterlayer DistanceReference
Double-Layer CloudsGlobalUpper6.24.41.82.2Wang et al. [17]
Lower1.60.80.8
ArcticUpper1~4<0.75/Luo et al. [39]
Lower1.1250.625 /
Northern Hemisphere Convective Active RegionsUpper>11>8.62~3.8/Tan et al. [70]
Lower5.5~8.5<4/
Triple-Layer CloudsGlobalUpper6.45.31.12.2Wang et al. [17]
Middle3.42.70.7
Lower1.10.50.6
Northern Hemisphere Convective Active RegionsUpper>11>92~3.8/Tan et al. [70]
Middle6~94~7.2<1.8/
Lower<5<4/
Disclaimer/Publisher’s Note: The statements, opinions and data contained in all publications are solely those of the individual author(s) and contributor(s) and not of MDPI and/or the editor(s). MDPI and/or the editor(s) disclaim responsibility for any injury to people or property resulting from any ideas, methods, instructions or products referred to in the content.

