Article

Independent Component Analysis-Based Composite Drought Index Development for Hydrometeorological Analysis

1
Department of Civil Engineering, Gyeongsang National University, 501 Jinju-daero, Jinju 52828, Republic of Korea
2
Department of Civil Engineering, Joongbu University, Goyang 10279, Republic of Korea
*
Author to whom correspondence should be addressed.
Atmosphere 2025, 16(6), 688; https://doi.org/10.3390/atmos16060688
Submission received: 23 April 2025 / Revised: 20 May 2025 / Accepted: 21 May 2025 / Published: 6 June 2025
(This article belongs to the Section Meteorology)

Abstract

Drought is a complex and interconnected natural phenomenon, involving multiple drought types that mutually influence each other. To capture this complexity, various composite drought indices have been developed using diverse methodologies. Traditionally, Principal Component Analysis (PCA) has served as the primary method for extracting index weights, predominantly capturing linear relationships among variables. This study proposes an innovative approach by employing Independent Component Analysis (ICA) to develop an ICA-based Composite Drought Index (ICDI), capable of addressing both linear and nonlinear interdependencies. Three drought indices—representing meteorological, hydrological, and agricultural droughts—were integrated. Specifically, the Standardized Precipitation Index (SPI) was adopted as the meteorological drought indicator, whereas the Standardized Reservoir Supply Index (SRSI) was utilized to represent both hydrological (SRSI(H)) and agricultural (SRSI(A)) droughts. The ICDI was derived by extracting optimal weights for each drought index through ICA, leveraging the optimization of non-Gaussianity. Furthermore, constraints (referred to as ICDI-C) were introduced to ensure all index weights were positive and normalized to unity. These constraints prevented negative weight assignments, thereby enhancing the physical interpretability and ensuring that no single drought index disproportionately dominated the composite. To rigorously assess the performance of ICDI, a PCA-based Composite Drought Index (PCDI) was developed for comparative analysis. The evaluation was carried out through three distinct performance metrics: difference, model, and alarm performance. The difference performance, calculated by subtracting composite index values from individual drought indices, indicated that PCDI and ICDI-C outperformed ICDI, exhibiting comparable overall performance. Notably, ICDI-C demonstrated a superior preservation of SRSI(H) values, yielding difference values closest to zero. Model performance metrics (Root Mean Square Error (RMSE), Mean Absolute Error (MAE), and correlation) highlighted ICDI’s comparatively inferior performance, characterized by lower correlations and higher RMSE and MAE. Conversely, PCDI and ICDI-C exhibited similar performance across these metrics, though ICDI-C showed notably higher correlation with SRSI(H). Alarm performance evaluation (False Alarm Ratio (FAR), Probability of Detection (POD), and Accuracy (ACC)) further confirmed ICDI’s weakest reliability, with notably high FAR (up to 0.82), low POD (down to 0.13), and low ACC (down to 0.46). PCDI and ICDI-C demonstrated similar results, although PCDI slightly outperformed ICDI-C as meteorological and agricultural drought indicators, whereas ICDI-C excelled notably in hydrological drought detection (SRSI(H)). The results underscore that ICDI-C is particularly adept at capturing hydrological drought characteristics, rendering it especially valuable for water resource management—a critical consideration given the significance of hydrological indices such as SRSI(H) in reservoir management contexts. However, ICDI and ICDI-C exhibited limitations in accurately capturing meteorological (SPI(6)) and agricultural droughts (SRSI(A)) relative to PCDI. Thus, while the ICA-based composite drought index presents a promising alternative, further refinement and testing are recommended to broaden its applicability across diverse drought conditions and management contexts.

1. Introduction

Drought is a natural disaster resulting from precipitation deficiency over a long period. Due to climate change, the frequency and intensity has increased globally [1,2]. In Northern and Eastern Europe, drought frequency and severity were the highest from the early 1950s to the mid-1970s. Europe witnessed the most intense and extensive drought in the 1950s, particularly with meteorological and hydrological droughts [3]. During 1999/2000, Jordan experienced the worst drought, which caused a 60% reduction in crop yield and production [4]. Owing to this, different drought studies including monitoring, assessing, analyzing, and forecasting have been conducted using various indices to mitigate and prevent such phenomena [5]. These drought studies were conducted using drought indices constructed using drought indicators such as precipitation, temperature, streamflow, groundwater reservoir levels, soil moisture, and snowpack. The selection of an index is fundamental and vital when conducting a drought study, as it determines the accuracy of the results. The drought indices, which represents the drought conditions, can be classified in terms of types such as meteorological, hydrological, agricultural, and socioeconomical [6,7,8,9,10].
Meteorological drought results from low precipitation over an extended period, resulting in water resource deficiency [2,8,11,12]. The meteorological drought indices include the Standardized Precipitation Index (SPI) [13], Standardized Precipitation Evapotranspiration Index (SPEI) [14], Palmer Drought Severity Index (PDSI) [15], and Z-index [15]. Another drought type, hydrological, results from reduced streamflow and low reservoir storage [16]. Commonly used hydrological drought indices include Palmer Hydrological Drought Index (PHDI) [15], Standardized Reservoir Supply Index (SRSI), Streamflow Drought Index (SDI) [17], and Surface Water Supply Index (SWSI). Agricultural drought, which results from soil moisture deficiency [7], can be represented by indices such as the Soil Moisture Index (SMI), the Standardized Soil Moisture Index (SSI) [18], and the Standardized Reservoir Supply Index (SRSI).
According to Balint, et al. [19], meteorological drought results from reduced precipitation. This leads to soil moisture deficiency, which is referred to as agricultural drought. Rainfall deficiency, which is a characteristic of meteorological drought, also affects hydrological drought. It causes reductions in streamflow, as well as inflow into reservoirs, lakes and ponds. In this way, all drought types are related and affect each other. However, most drought studies have been conducted on a single type of drought. As all drought types are related and drought is a complex phenomenon, the development of an index comprising different types of drought has become necessary.
Currently, composite drought indices are being developed with different names, such as Aggregate Drought Index (ADI), Combined Drought Index (CDI), and Composite Drought Index. Keyantash and Dracup [20] developed ADI comprising meteorological, hydrological, and agricultural droughts. Six indicators including precipitation, evapotranspiration, streamflow, reservoir storage, soil moisture content, and snow water content were used, and Principle Component Analysis (PCA) was selected for weight extraction. The ADI was further compared with PDSI to describe two important droughts in California, and the results show that the ADI provides a clear approach to describing the intensity of drought, which could further be adapted to characterize drought. Barua, et al. [21] conducted a comparative drought assessment in Australia. They adopted precipitation, evapotranspiration, streamflow, surface reservoir storage, and soil moisture content as indicators to develop, and used PCA to determine the importance of the variables. ADI was further compared with PN, deciles, SPI and SWSI, and showed a better agreement in detecting historical droughts. CDI was developed by Balint, Mutua, Muchiri and Omuto [19], and also comprises three indices. Precipitation Drought Index (PDI), Vegetation Drought Index (VDI), and Temperature Drought Index (TDI) were first calculated using rainfall, temperature, and NDVI data, respectively. The weights were assigned subjectively as 50% for PDI and 25% for the others. However, they mentioned that in cases of missing data for either temperature or NDVI, a weight of 67% can be assigned for PDI, and 33% for the others. The results show that CDI clearly traces the footprints of droughts in Kenya, and has potential use in climate change analysis. Al Bakri and Rakonczai [22] correlated barley yield with single indices such as PDI, VDI, TDI, and the composite index CDI. The highest annual correlation was shown with CDI, indicating that CDI could be more powerful compared to the single indices.
Another study correlating crop yield with both single drought index and composite drought index was conducted by Al-Bakri, Alnaimat, Al-Karablieh and Qaryouti [4]. They selected SPI as a single drought index, and CDI as a composite drought index. Further correlation analyses between crop yield were conducted with SPI and CDI, and the results show that CDI had a higher correlation with crop yield than SPI, indicating that the composite index summarizing different drought characteristics is more appropriate in drought studies than a single index.
Although different composite indices have been developed recently, most drought studied are being conducted with an index focusing on a single type of drought. As this type of disaster is a complex phenomenon, the proposal of novel indices comprising different types of drought is essential, and can enhance the results of various drought studies. With increases in the necessity of composite drought index development, different countries are testing and developing various composite drought indices such as the Multi-Indicator Drought Index (MIDI), which has been developed and experimentally tested by NOAA NIDIS.
Owing to this, the current study intends to propose a new method for developing a composite drought index. The construction of a composite drought index has generally been undertaken using various weighting methods including Principle Component Analysis (PCA), Analytic Hierarchy Process (AHP), entropy, and subjective weighting. However, as the indices are independent, a method treating the indices as independent seemed appropriate to extract the weights. For this reason, the current study adopts the famous dimensionality reduction method, Independent Component Analysis (ICA), instead of the widely used PCA. While ICA is being adopted in various fields for feature extraction [23,24], the method has not been applied for composite drought index development, indicating its novelty. Three drought indices for the types meteorological, hydrological, and agricultural were selected. SPI was applied to represent meteorological drought, and SRSI was used to express both hydrological and agricultural droughts. Through the weight extraction of indices using ICA, the composite drought index was further developed into an Independent Component Analysis-based Composite Drought Index (ICDI).

2. Study Area and Data Description
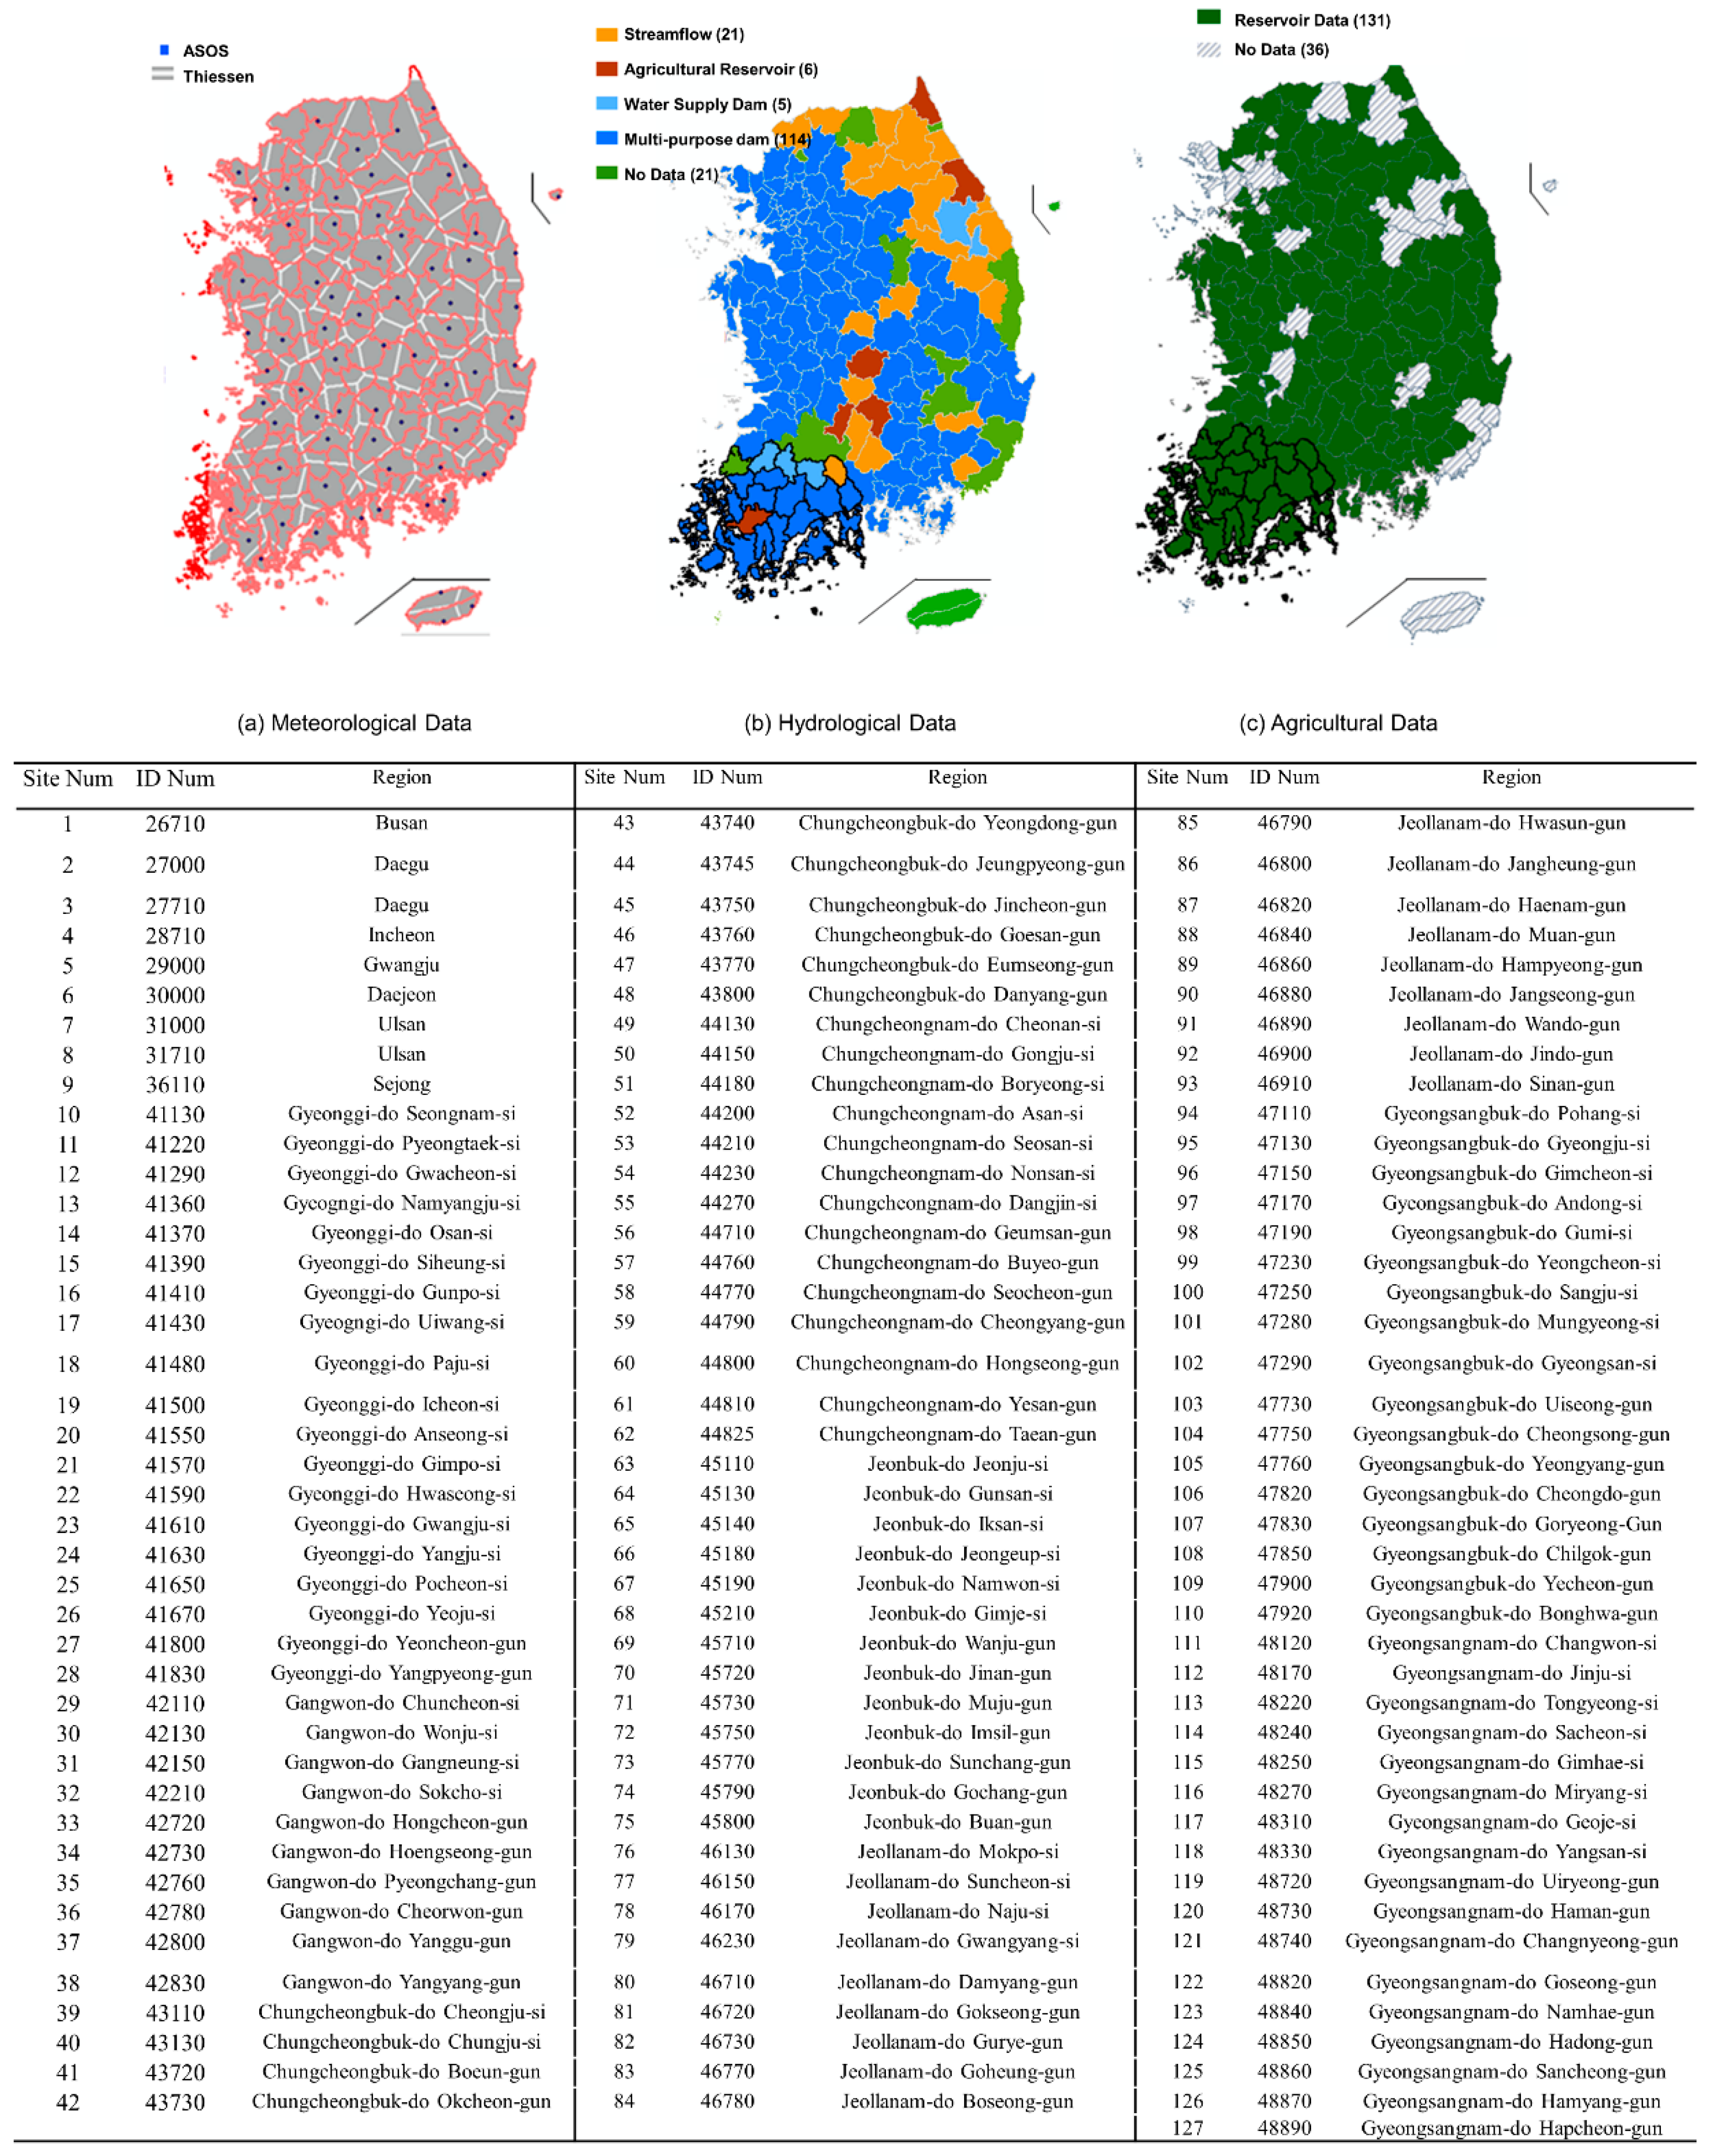
2.1. Study Area

The study area was selected as South Korea, which is located 35° 50′ N, 127° 00′ W [25,26], as the country grows various crops and is highly affected when a drought occurs. Due to global warming and climate change, drought intensity is increasing globally, which is becoming a major issue in South Korea. The study area has been experiencing water deficiencies, especially in recent years [27,28], and the occurrence of drought is expected to increase significantly in the future [25,29].
Some regions in the country experienced severe drought for more than three years [30,31]. To manage water resources efficiently, many dams and reservoirs have been constructed. They are being supervised and controlled according to the drought alarms for each type of meteorological, agricultural, residential and industrial drought. Issuing separate alarms for each type of drought may provide specific information relating to each drought type. However, a region is affected by more than one type of drought, and a comprehensive drought index summarizing different types of drought seems vital in the country.

2.2. Data

Three indices for meteorological, hydrological, and agricultural droughts were adopted in the 127 governmental sectors. The 127 sectors have been represented as 127 sites, and the related ID numbers are indicated in Figure 1. To represent meteorological drought, SPI is the most accepted and widely used index [32,33], and so was adopted in the current study. The 6-month Standardized Precipitation Index, SPI(6), was adopted as it is currently used for drought prediction in South Korea. SPI(6) was estimated with the observed data from 1991. 02 to 2023. 06. The Standardized Reservoir Supply Index (SRSI) was adopted for hydrological and agricultural droughts for the same period, and is available from the National Drought Information Portal (www.drought.go.kr). SRSI was selected, and the SRSI data can be applied to evaluate the hydrological and agricultural drought conditions in South Korea, and are also being widely adopted in the hydrological field [34].
As the current study adopted SRSI for both hydrological and agricultural droughts, the hydrological SRSI was expressed as SRSI(H), and the agricultural SRSI was denoted as SRSI(A) to avoid confusion. Monthly multipurpose and water supply dam data, reservoir data, and streamflow data were employed and further standardized, like, SPI to derive SRSI(H). The data used to derive SRSI(H) were classified and selected according to the primary water source information for each site, provided by the National Drought Information Portal. SRSI(A) was estimated using reservoirs constructed for agricultural purposes, and was calculated by standardizing the monthly reservoir volume into a normal variate.
The drought condition can be categorized according to the SPI and SRSI values as extreme wet, severe wet, moderate wet, near normal, moderate drought, severe drought, and extreme drought. The drought categories and the corresponding values (according to McKee, Doesken and Kleist [13]) are shown in Table 1.

3. Study Procedure and Methods

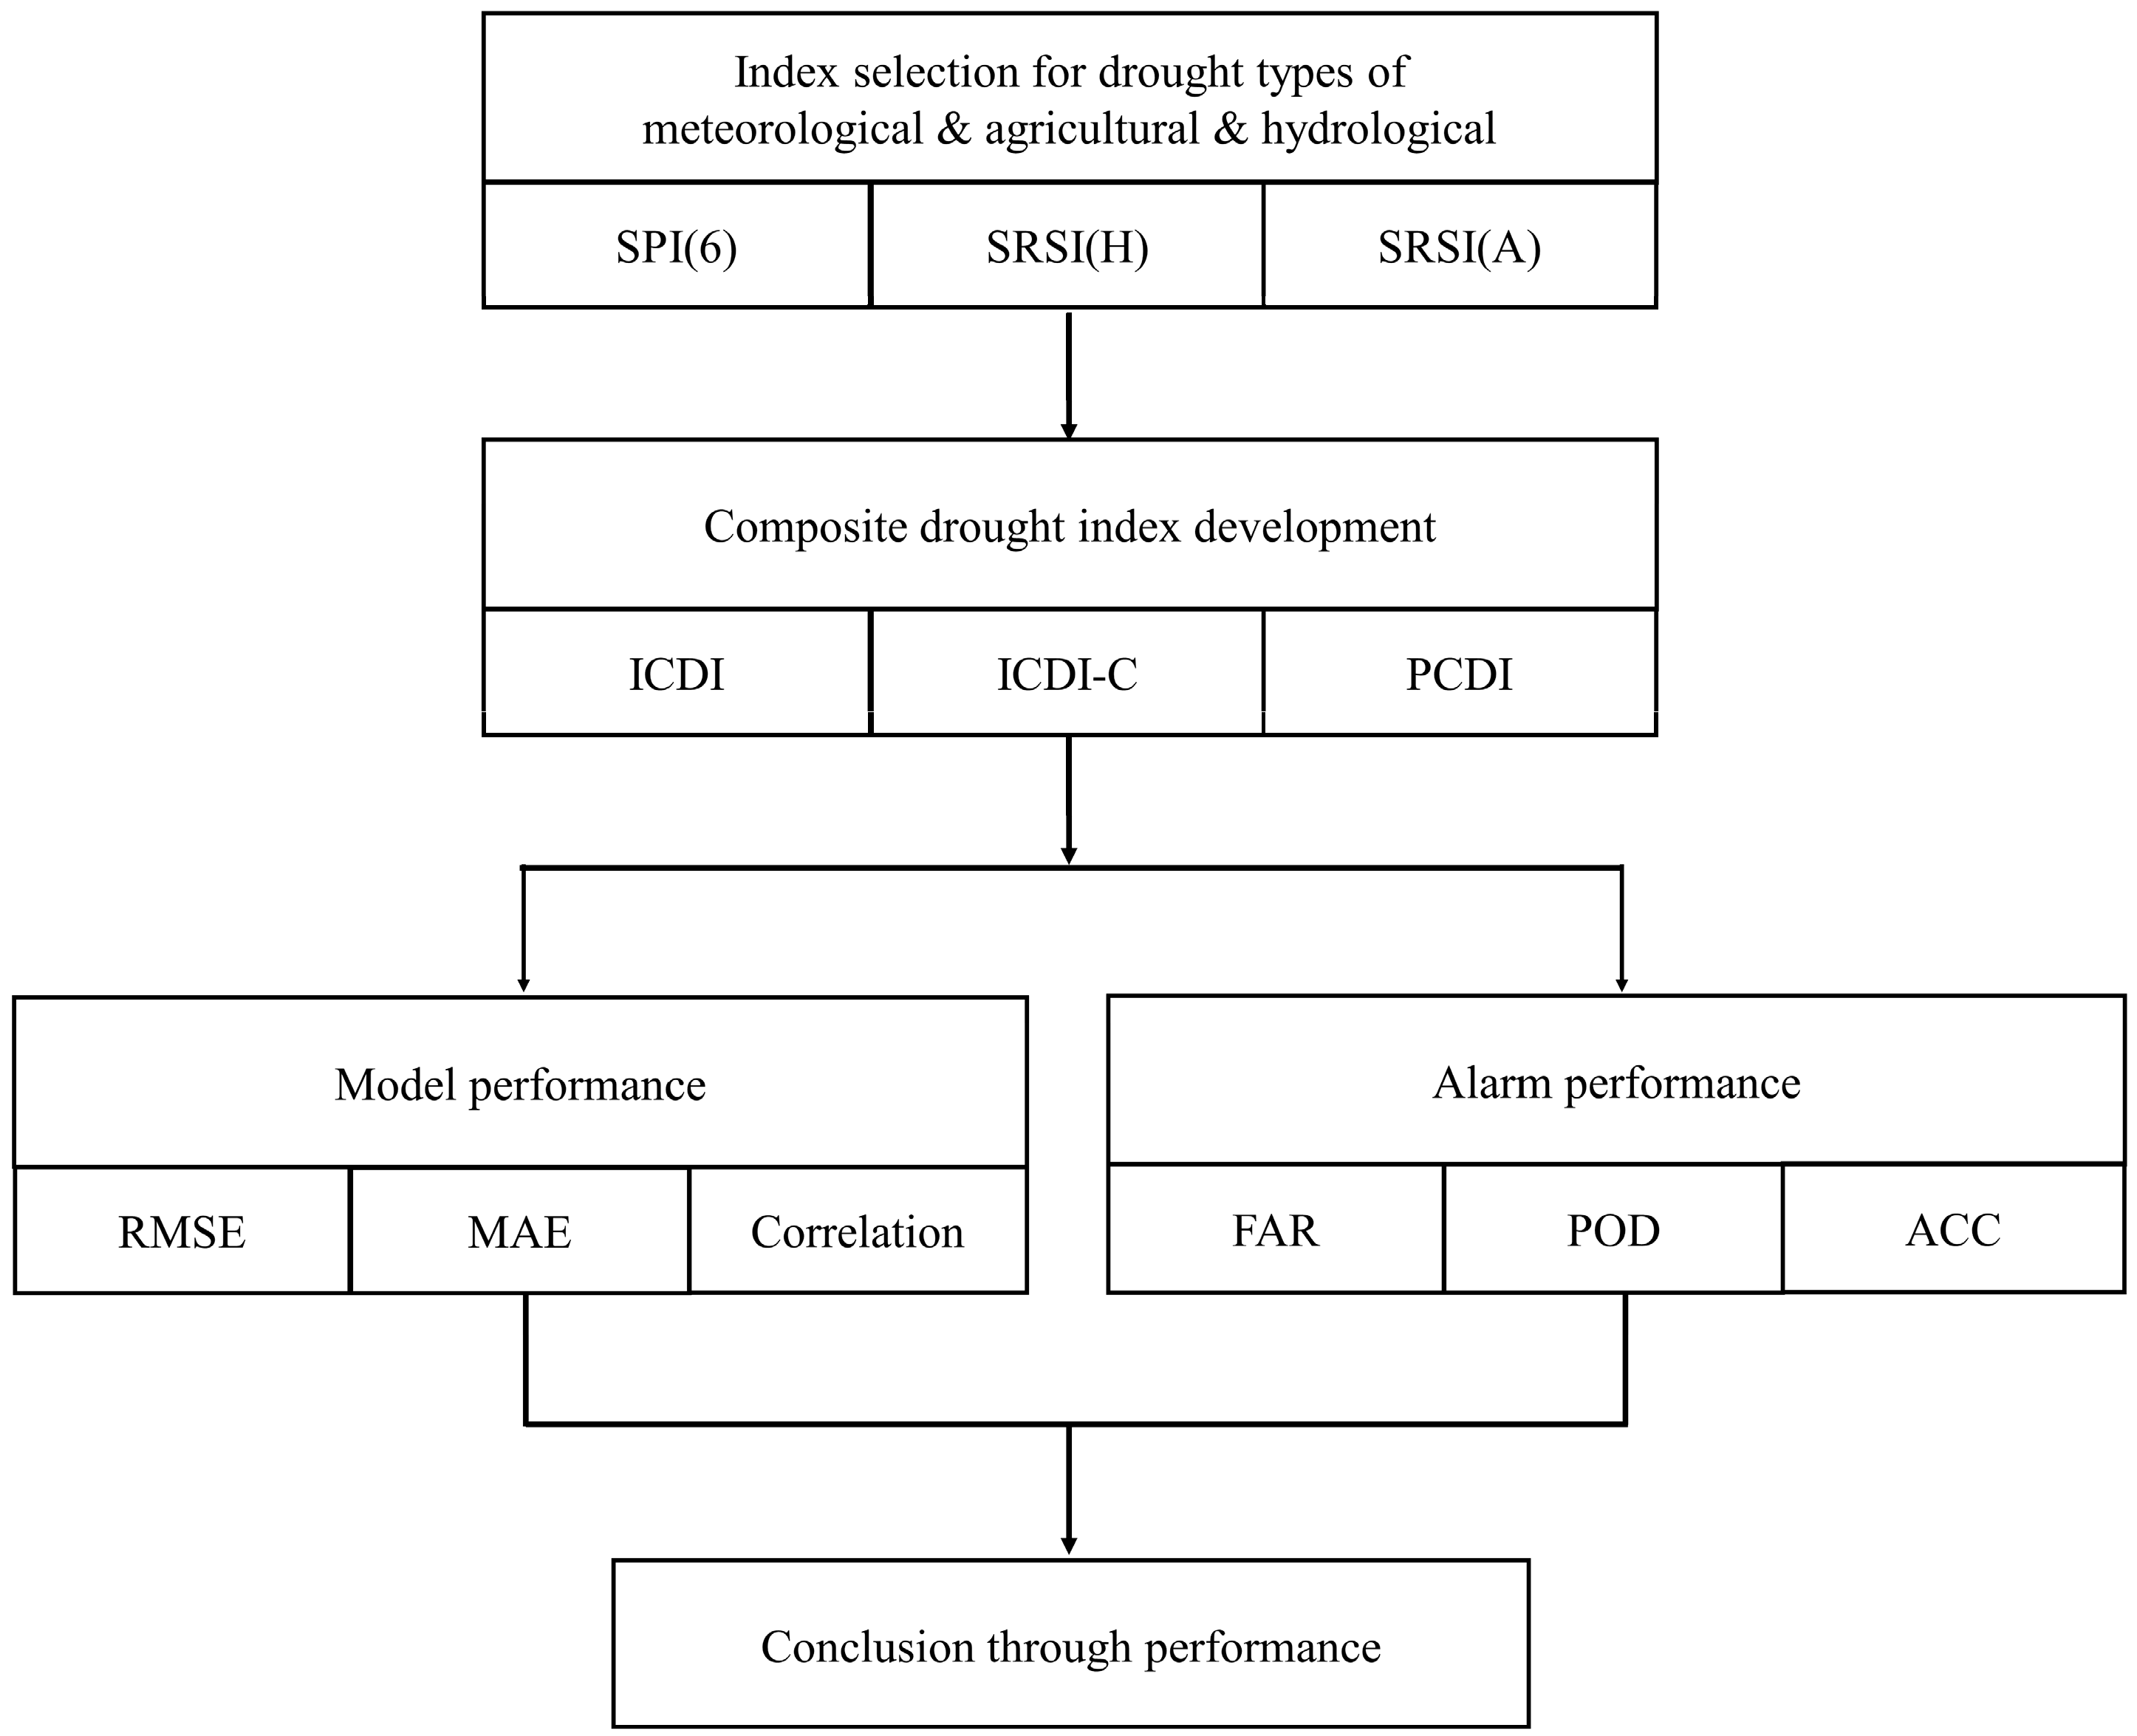
3.1. Procedure of the Current Study

The procedure of the current study is indicated in Figure 2, and the detailed workflow is as follows: (1) deriving three drought indices of different drought types (i.e., meteorological, hydrological, and agricultural) as SPI(6), SRSI(H) and SRSI(A); (2) extracting the weights of each index using ICA; (3) constructing an ICA-based Composite Drought Index (ICDI) and further developing the ICDI with constraints as the ICDI-C; (4) conducting a comparison of the ICDI-, ICDI-C- and PCA-based Composite Drought Index (PCDI) with performance measurement metrics of RMSE, MAE, and correlation; (5) assessing the alarm performance of PCDI, ICDI, and ICDI-C with FAR, POD, and ACC. (1) SPI(6) was selected for meteorological drought index development, and SRSI was used for both hydrological and agricultural drought indices; (2) the composite drought index was developed into ICDI, ICDI-C, and PCDI; (3) model and alarm performance comparisons were conducted with RMSE, MAE and correlation and FAR, POD and ACC, respectively. (4) The conclusion was derived from the performance results.

3.2. Model Development Method

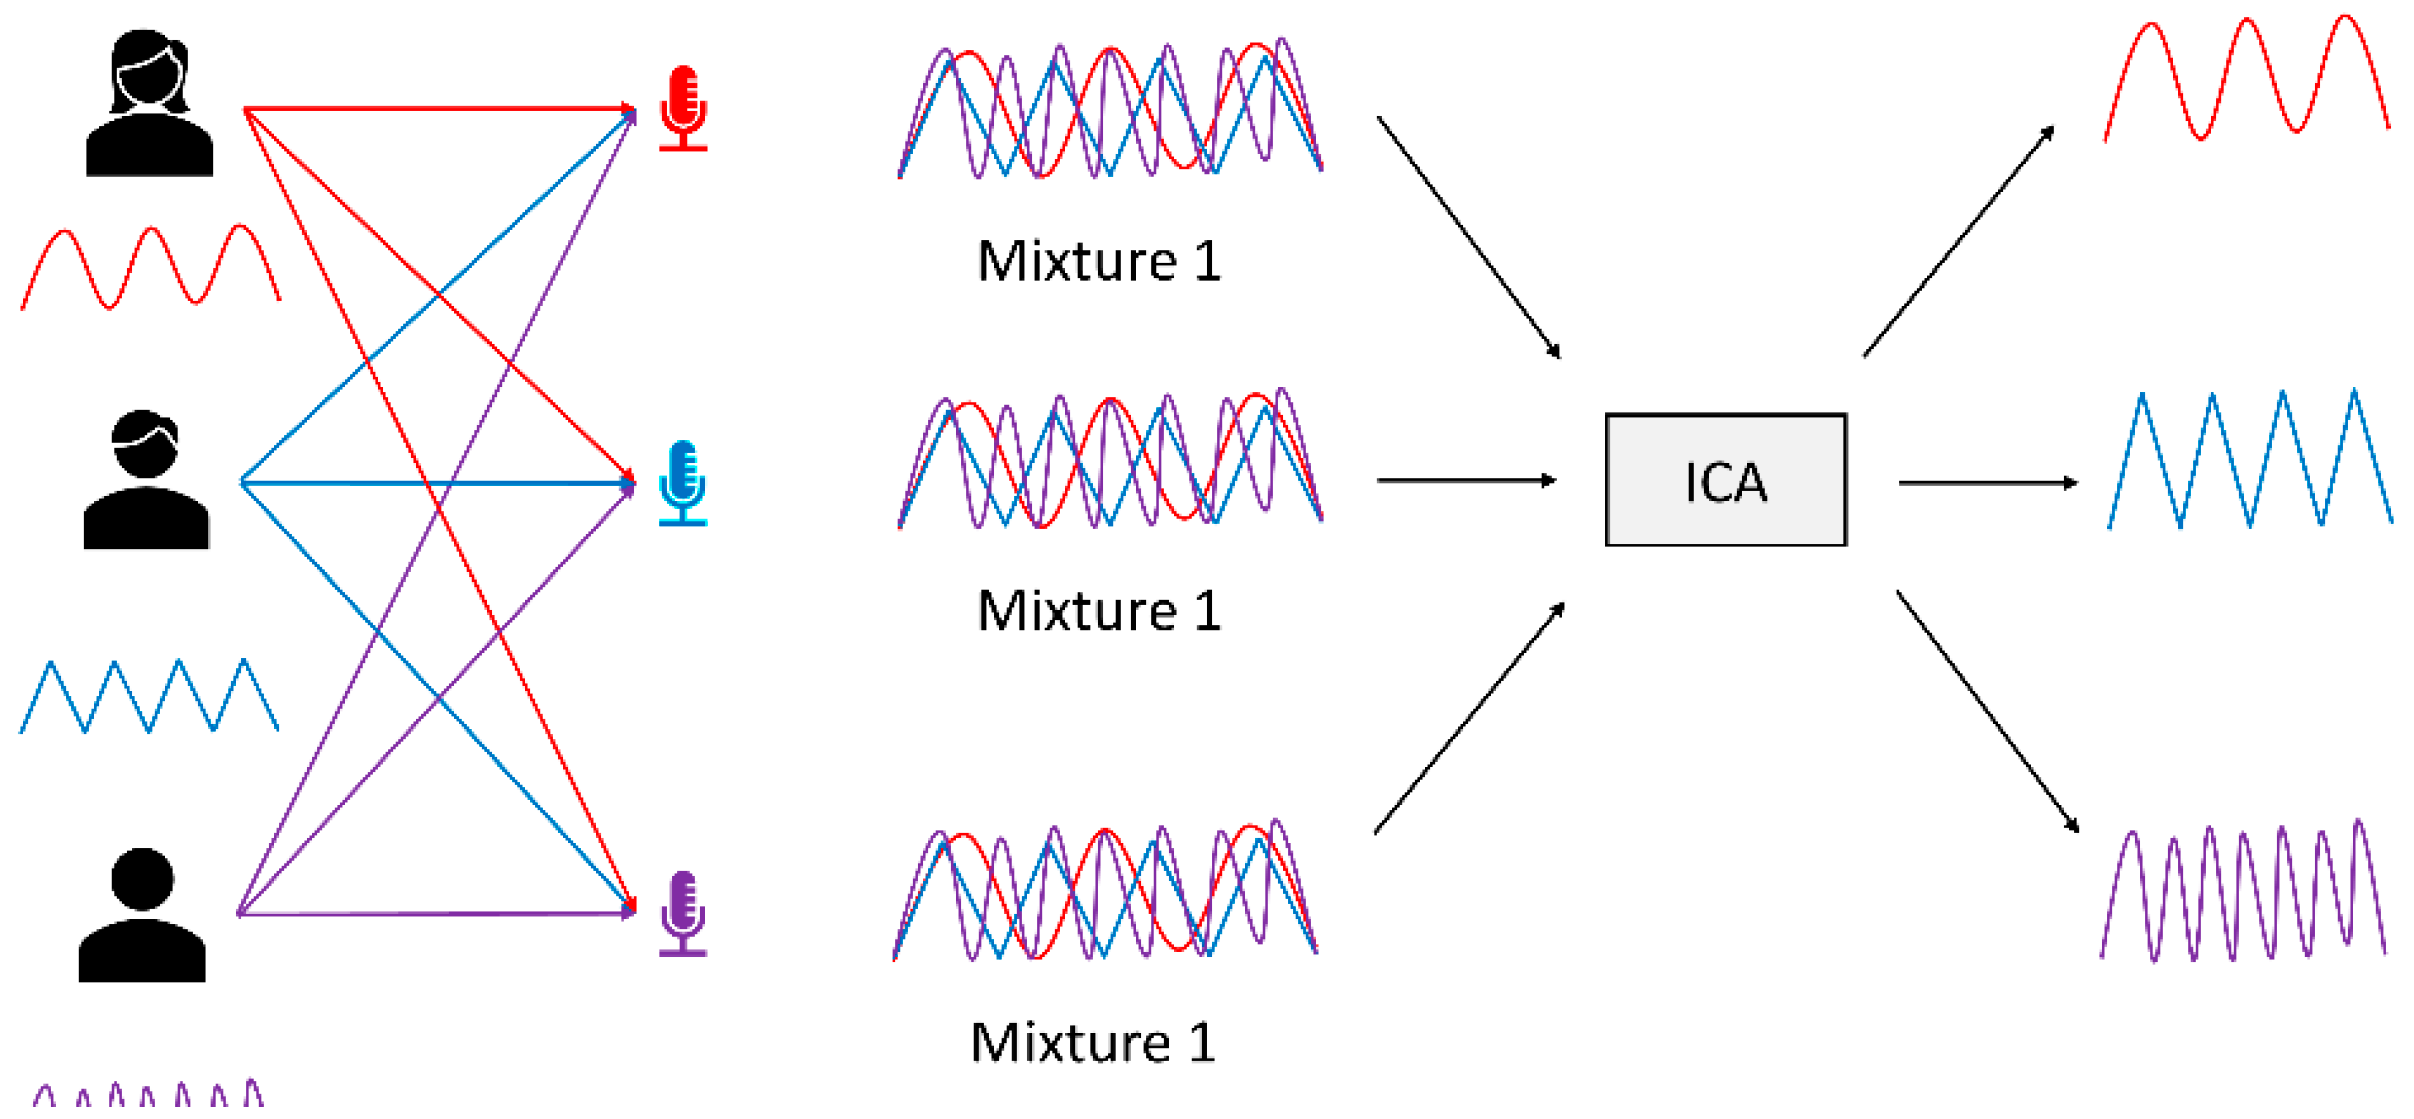
3.2.1. Independent Component Analysis (ICA)

Different feature extraction methods have been developed including PCA, nonlinear PCA, and ICA [35]. Independent Component Analysis [36,37] is a method used for extracting individual signals from mixture signals. While PCA aims at the reprojection error from compressed data, ICA aims to minimize the dependence between the variables [38]. ICA is based on two major assumptions.
The first assumption is that the sources are statistically independent, and second, it uses a non-Gaussian structure [39,40], which distinguishes ICA from PCA. This can be important when recovering the independent variables that created the data. The schematic diagram is illustrated in Figure 3. In the ICA algorithm, it is assumed that n independent sources exist as
X = A S
where matrix X is the observed signal, and S is the independent signal for both n × m matrices. m is the sample of n , and A is the mixing matrix n × n . The algorithm further finds matrix A with signal X by calculating the demixing matrix A 1 as
S = A 1 X
Out of various sorts of ICAs, the current study applied the fastICA algorithm. The procedure of fastICA is as follows:
Centering—the mean of each data point is subtracted from the raw data to make its mean zero as
x c e n = x i E X
where x c e n is the centered data of x i , and x i ¯ is the mean value.
Whitening—the covariance matrix is calculated and decomposed as
C o v = E X ¯ T X ¯ = E D E T
where X ¯ is the matrix containing zero-mean signals, E is the matrix of eigenvectors, and D is the diagonal matrix of the eigenvalues. Through E and D , the whitening matrix Z can be estimated as
Z = D 1 2 E T X ¯

3.2.2. ICA-Based Composite Drought Index (ICDI)

To develop the ICDI, first, weights of each meteorological, hydrological, and agricultural index (i.e., SPI(6), SRSI(H), and SRSI(A)) were extracted using ICA. Second, the extracted weights were multiplied with each index values, and third, they were summed together. The equation for ICDI is
I C D I = S P I 6 · w S P I ( 6 ) + S R S I H · w S R S I ( H ) + S R S I A · w S R S I ( A )

3.2.3. ICA-Based Composite Drought Index with Constraints (ICDI-C)

ICDI-C was developed by giving a simple constraint for extracting the weights only when all three weight values for each drought index all had positive values. If not, the step of extracting weights would be conducted again. Then, when the condition that all weights should be positive is satisfied, each weight is divided with the sum value of all weights via
w i = w i * w s u m
where w s u m is the sum value of all index weights, w i * is the weight value of each index before unity, and w i is the final weight value of each index, the sum of which is unity.

3.3. Model Comparison Method

Comparing and analyzing the performances of drought indices derived from different methodologies was considered essential and was conducted using three approaches. First, the differences between observed data and the composite indices were assessed using simple subtraction and visualized through boxplots and timeseries. Subsequently, model performance was evaluated by quantifying differences between the observed data of three individual indices and the composite drought index. This evaluation utilized three statistical metrics—Root Mean Square Error (RMSE), Mean Absolute Error (MAE), and correlation analysis. RMSE and MAE were adopted as they are used in various fields including meteorology and climate research [41] to evaluate models [42]. The formulae for RMSE and MAE are
R M S E = i = 1 n x i x ^ i 2 n
M A E = i = 1 n x i x ^ i n
Here, n represents the number of observations, x i denotes the observed values of the three indices, and x ^ i signifies the composite drought index value. The correlation coefficient, another well-known method for comparing the original data with predicted data, was also tested using the following formula
C o r r e l a t i o n = C o v ( x , y ) σ x σ y
The variance of x and y is C o v ( x , y ) , and the standard deviations of x and y are σ x and σ y , respectively. Along with the conducting of model performance measurements, alarm performance was also tested for comparison. First, the alarm conditions were set as true positive (TP), true negative (TN), false positive (FP), and false negative (FN). In this study, TP was defined as the scenario wherein the estimated ICDI value fell below a preset alarm threshold, and at least one of the three observed values also dropped below the warning level. The alarm performances were further estimated with FAR, POD, and ACC, and their equations are presented as Equation (11), Equation (12), and Equation (13), respectively.
F A R = F P T P + F P
P O D = T P T P + F P
A C C = T P + T N T P + F P + T N + F N
The smaller FAR indicates a better model, and larger POD and ACC illustrate a better performance.

4. Results

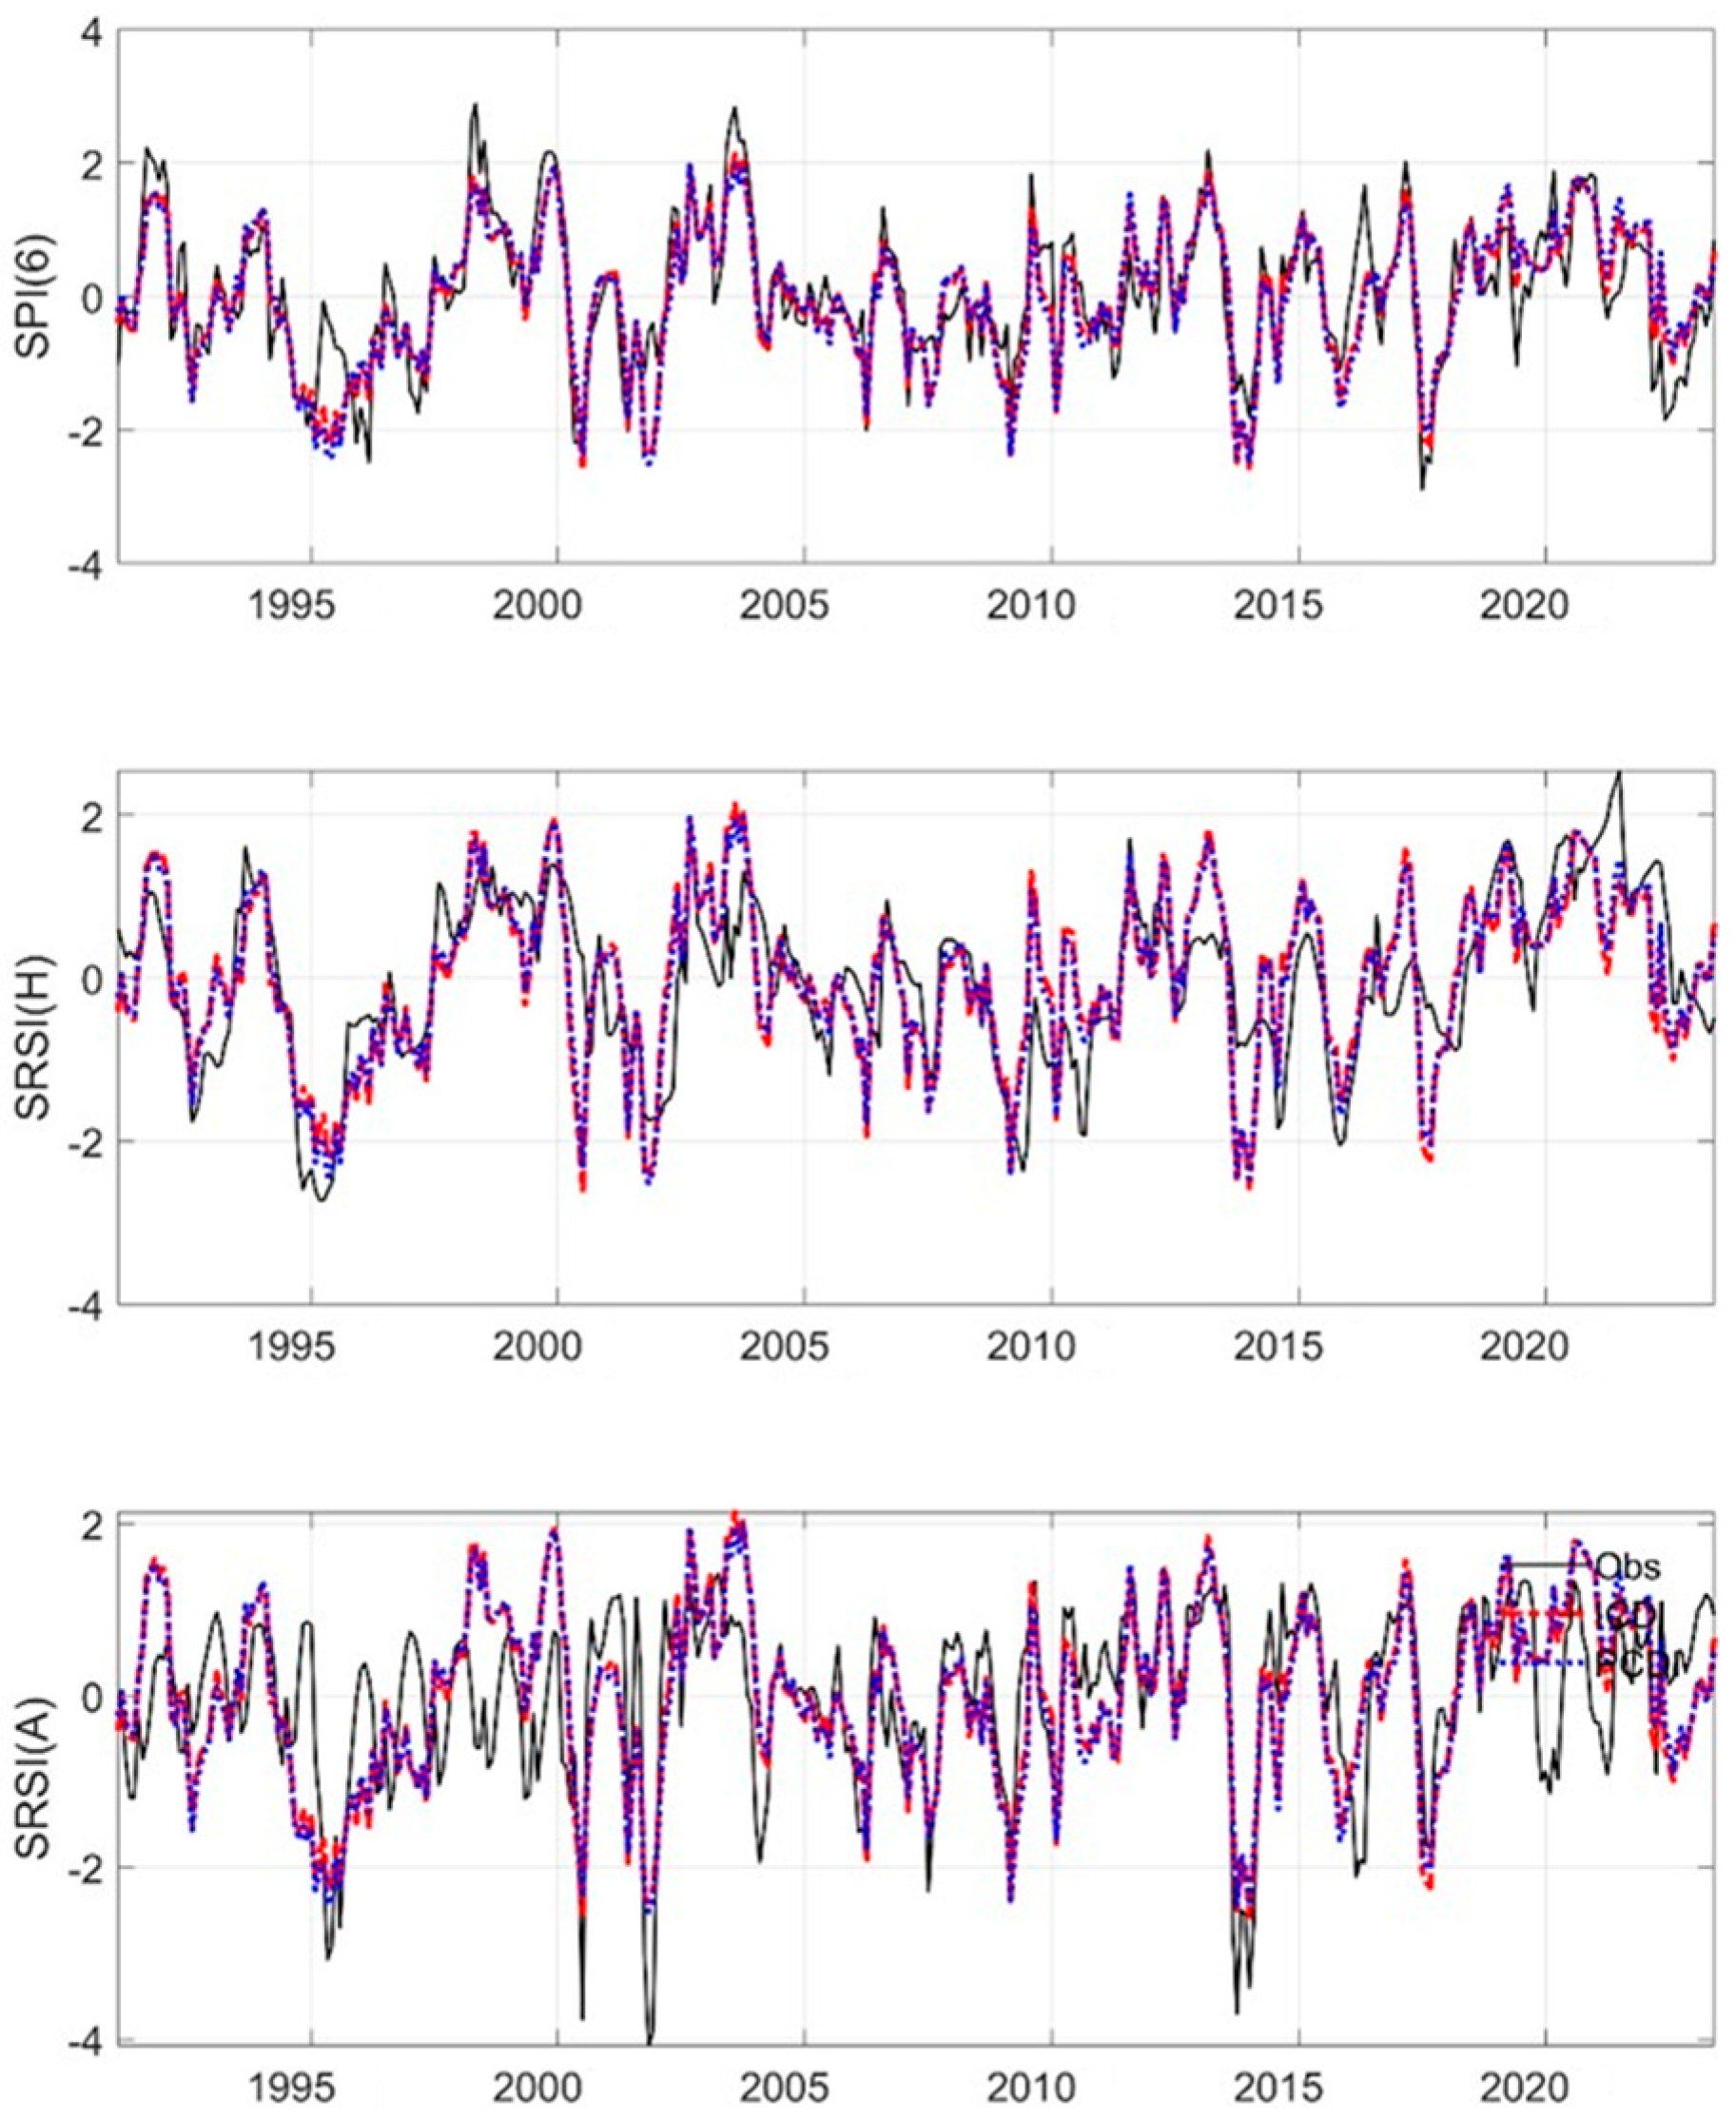
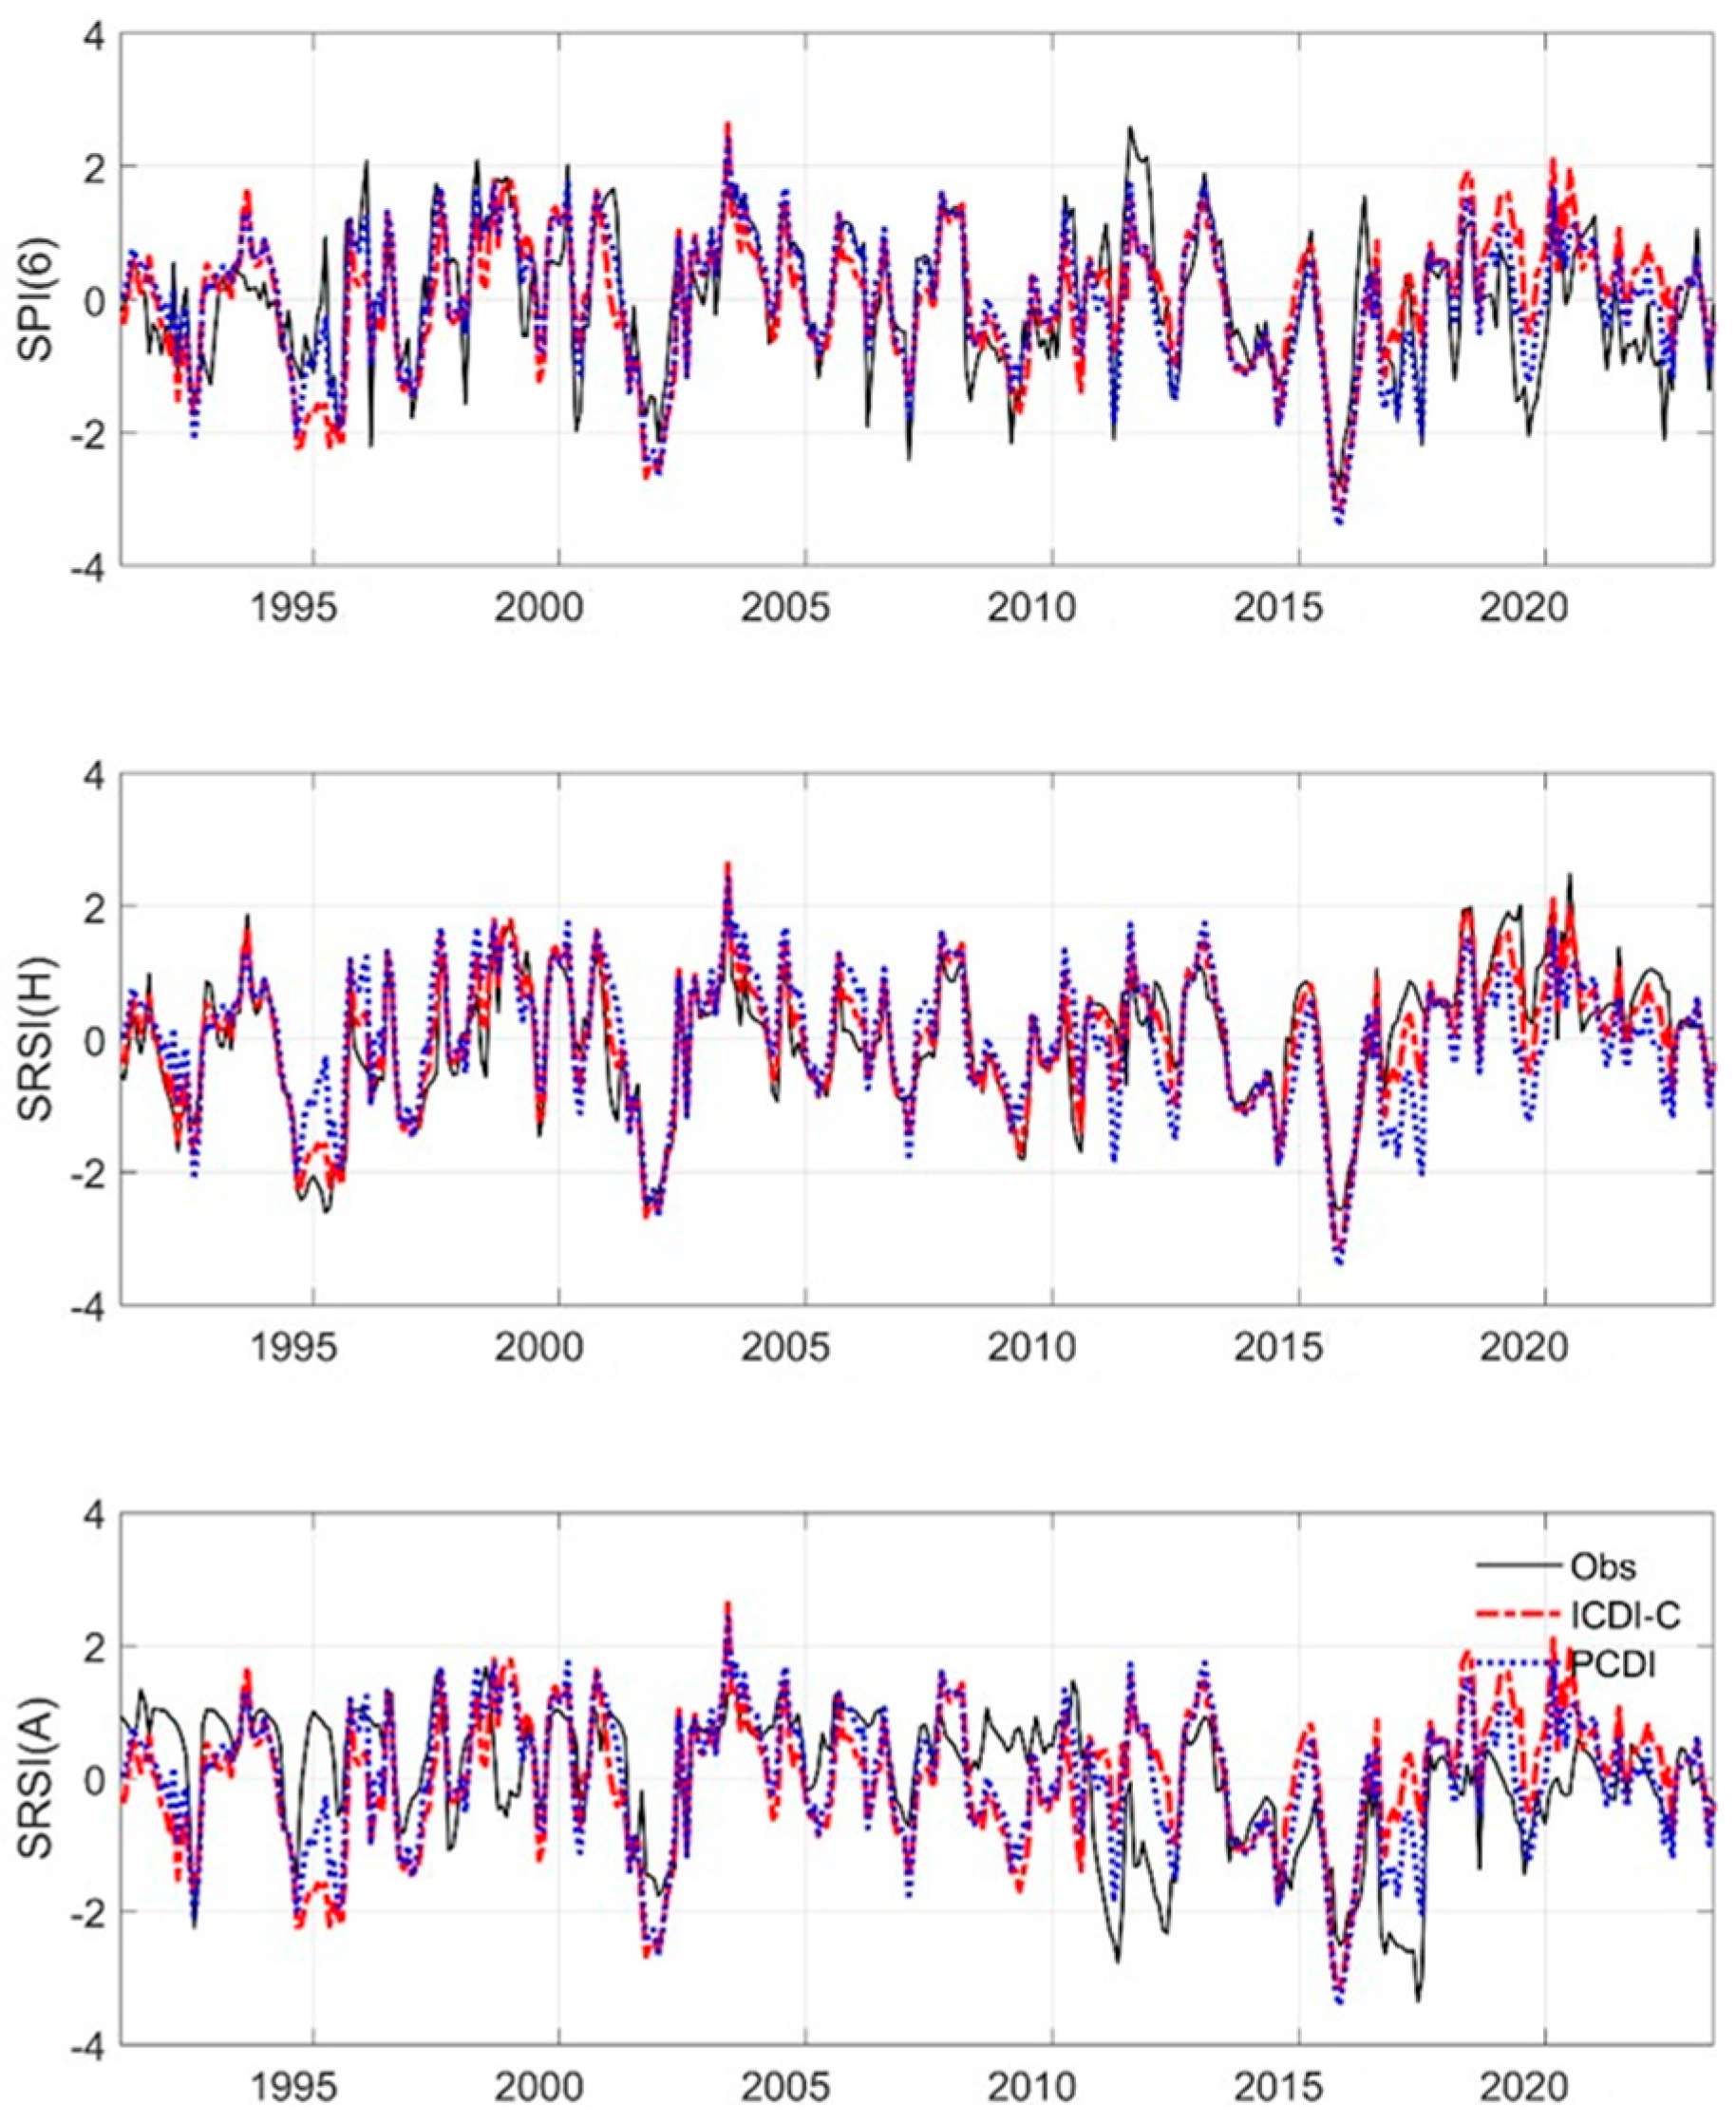
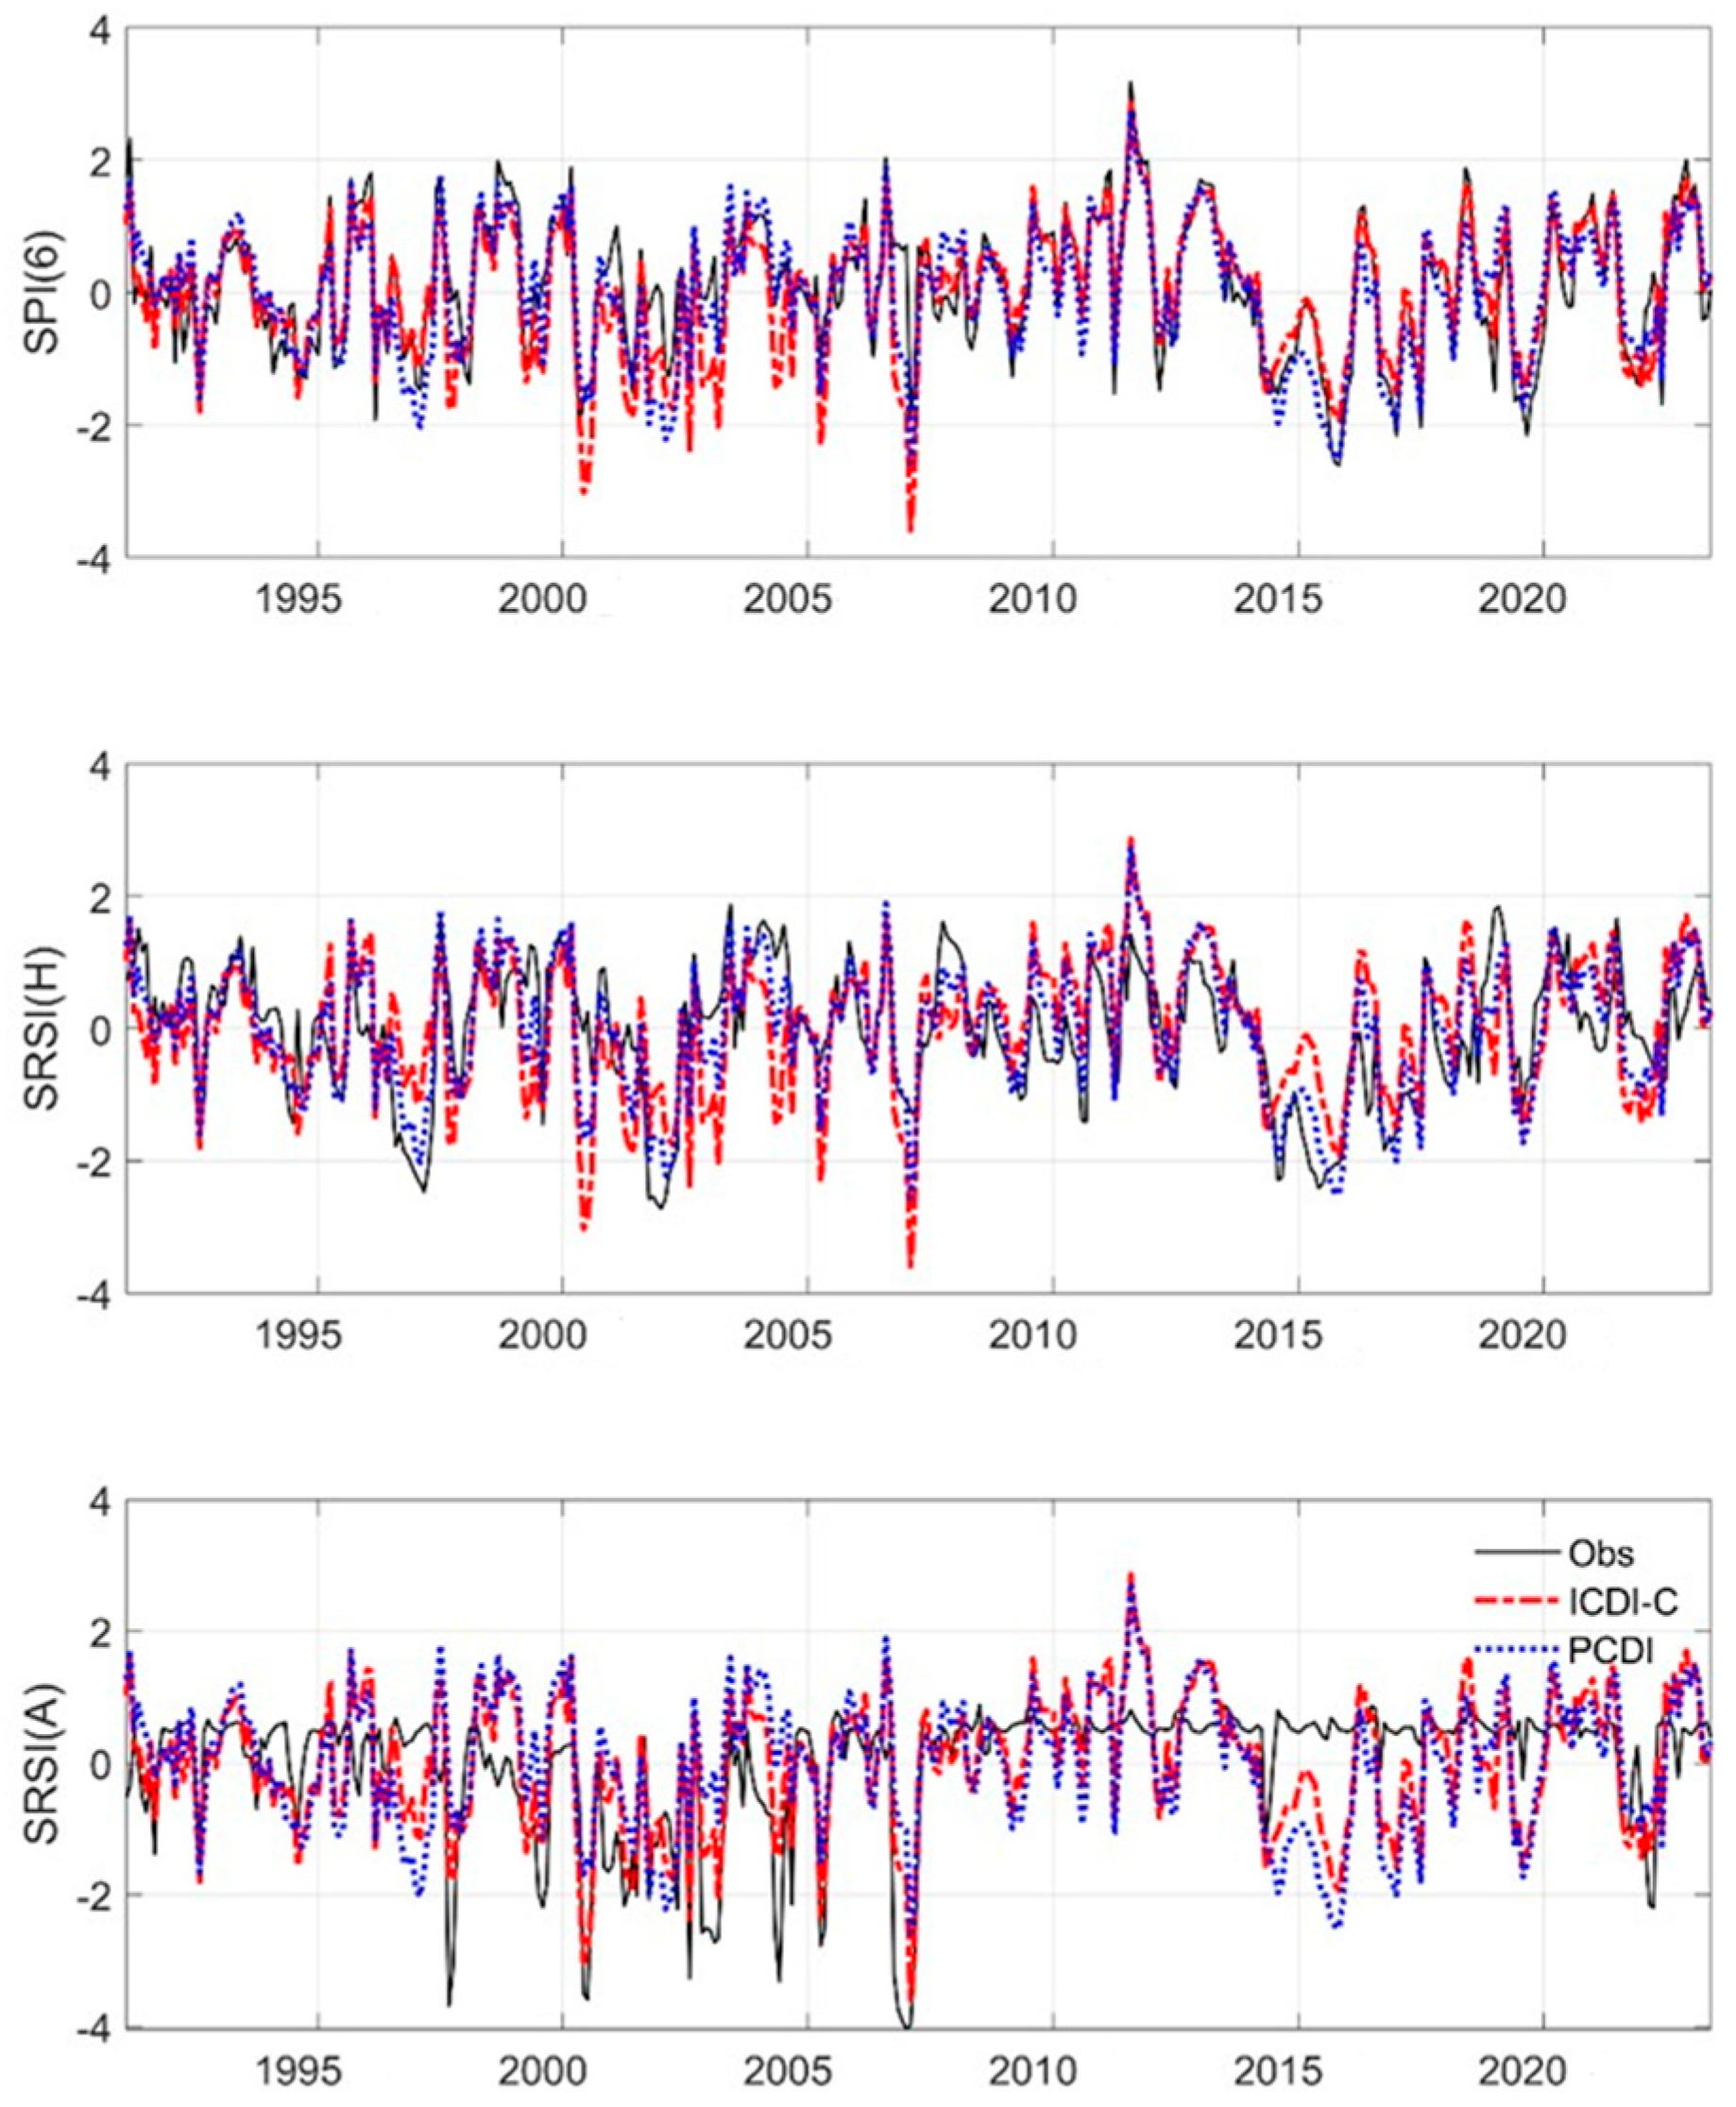
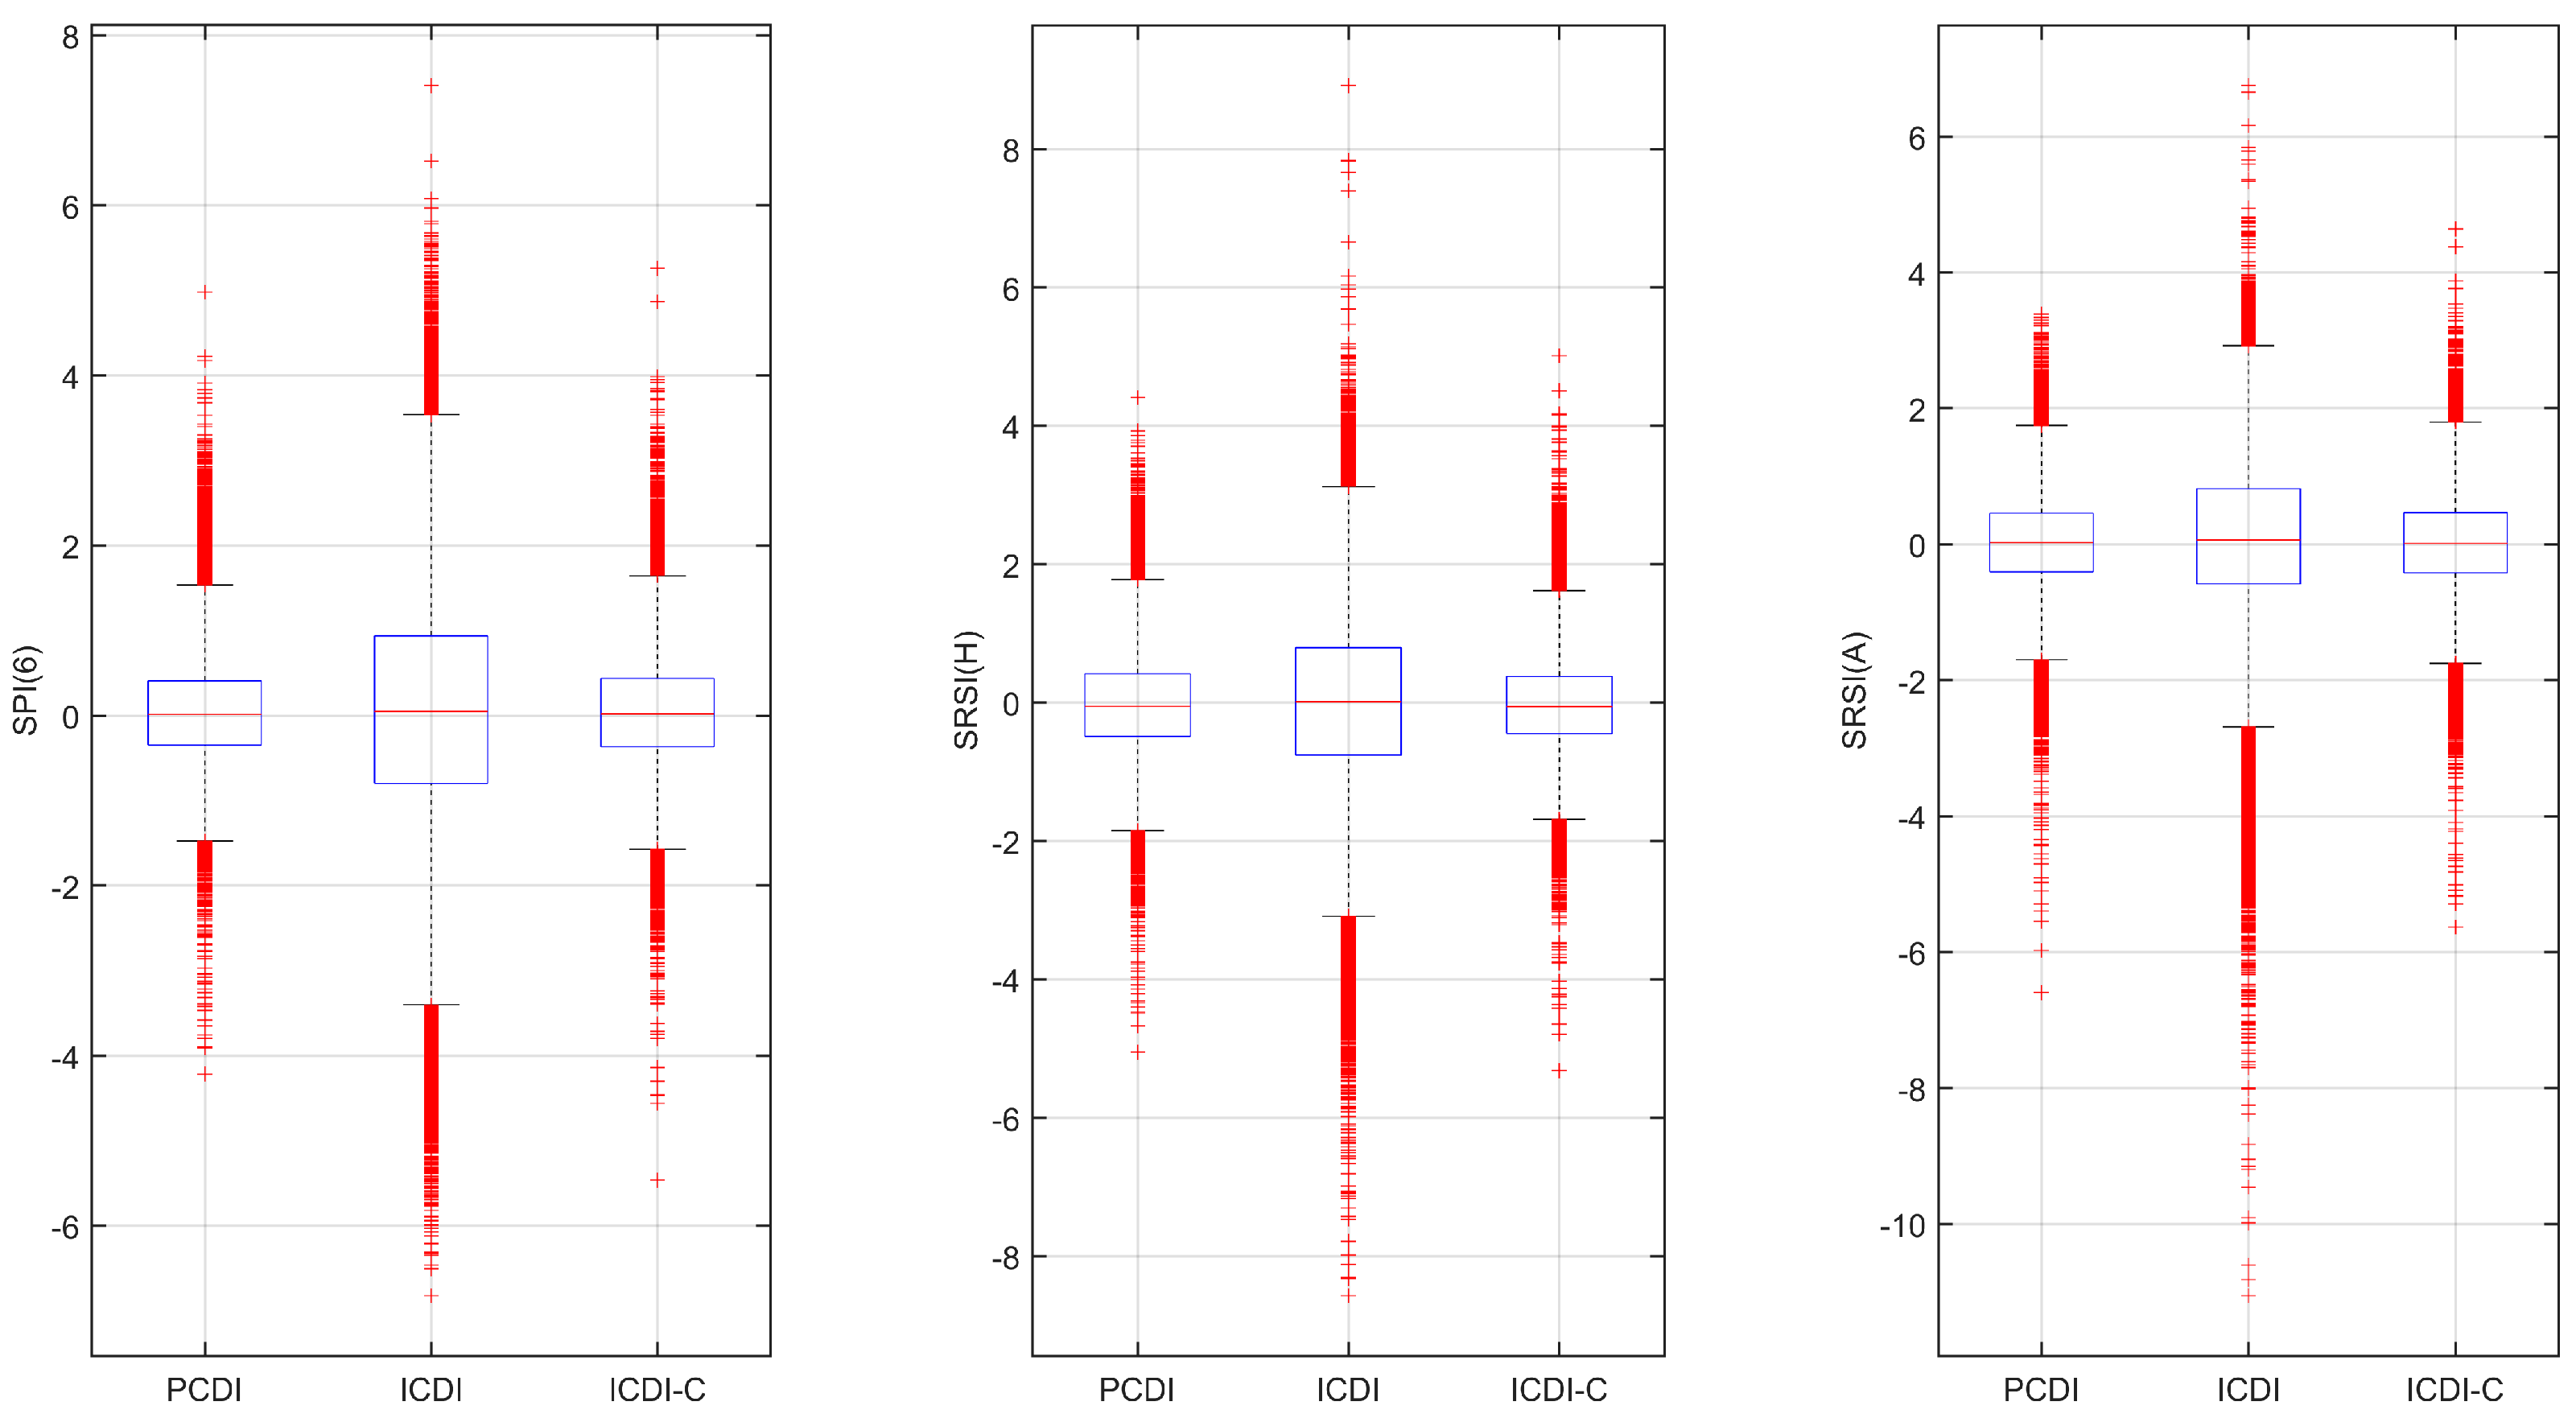
4.1. Difference Performance

The ICDI was compared with the PCA-based Composite Drought Index (PCDI) to evaluate the similarity of these composite indices to observed data derived from SPI(6), SRSI(H), and SRSI(A). The PCDI was developed using the same methodology as the ICDI, except that PCA was employed instead of ICA for weight extraction. Through Equation (6), ICDI timeseries for 127 sites were derived. Further comparison was conducted by plotting the observed data with ICDI and PCDI. The overall results indicate that PCDI exhibited closer agreement with the observed data. However, cases wherein ICDI showed greater similarity with the observed SRSI(H) data exist, as presented in Figure 4.
The results demonstrate unreliable performance, attributed to negative weights, which can emerge during the centering or optimization stages. The ICA algorithm mathematically optimizes independent components, inherently producing negative values in some cases. However, negative weights present mathematical issues during the aggregation process of indices. Specifically, summation involving negative values may skew the final results and create proportional distortions when combined with index weights. For instance, a negative weight assigned to a particular drought feature could disproportionately influence the composite index. To address this and enhance the reliability of ICDI, it was deemed essential to derive positive weights and normalize them so that the sum of the three weights equals unity. The resulting improved index was developed and designated as the ICA-based Composite Drought Index with constraints (ICDI-C). Comparisons between data observed with ICDI-C and PCDI were conducted, and they proved almost identical, as shown in Figure 5. This indicates that ICDI-C achieves a similar performance to PCDI.
While ICDI-C and PCDI achieve similar performances, cases wherein ICDI-C showed higher correlation with SRSI(H) than PCDI arose, shown in Figure 6. This proves that ICDI-C preserves SRSI(H) better than PCDI.
Furthermore, cases wherein ICDI-C showed a clear advantage in catching severe and extreme droughts over SRSI(A) arose, as in Figure 7. This indicates that ICDI-C could be more reliable, as it more effectively catches severe and extreme droughts.
The development of a further comparison method seemed vital to achieve a better evaluation, and this was undertaken using the different performance measurements of difference, model, and alarm performance, as summarized in Table 2. The difference performance is shown with a boxplot and timeseries, as presented in Figure 8 and Figure 9, respectively. If the difference values are closer to zero, it indicates that the composite index values are closer to those in the observed data.
Through the boxplot in Figure 10, it is shown that ICDI achieved the worst performance, and that PCDI and ICDI-C outperformed it with a similar performance. Moreover, several cases wherein ICDI-C showed difference values closer to zero than other composite indices with SRSI(H) arose, as indicated in Figure 9. This indicates that the ICDI-C may be highly acceptable as it better preserves hydrological drought. This is especially valuable, as the hydrological index is the most important index in the study area given that the supply of water resources for economical and human uses is mostly achieved with hydrological dams and reservoirs.

4.2. Model Performance

To better evaluate the models, the model performances were assessed with RMSE, MAE, and correlation using Equations (8)–(10), as illustrated in Figure 10.
The RMSE results show that the performance of ICDI was the worst, with a distinctively high value. ICDI-C and PCDI showed similar performances, with slightly better performance for PCDI. The same was seen for MAE, PCDI and ICDI-C, as they were highly similar to each other, while the worst performance could be observed for ICDI. With lower RMSE and MAE, ICDI-C and PCDI were shown to be better models than ICDI.
Along with the error comparisons, correlations were tested between the composite indices (i.e., PCDI, ICDI, ICDI-C) and observed indices (SPI(6), SRSI(H), SRSI(A)). The correlation of SPI(6) was the best with PCDI, followed by ICDI-C. ICDI, which showed an unreliable result in RMSE and MAE, achieved the lowest performance in correlation as well. The correlation of SRSI(A) was similar to that of SPI(6), with the highest performance for PCDI, similar to ICDI-C. While PCDI showed the highest correlation with SPI(6) and SRSI(A) data, in the case of SRSI(H), ICDI-C showed the best performance, indicating that ICDI-C preserves hydrological drought better.

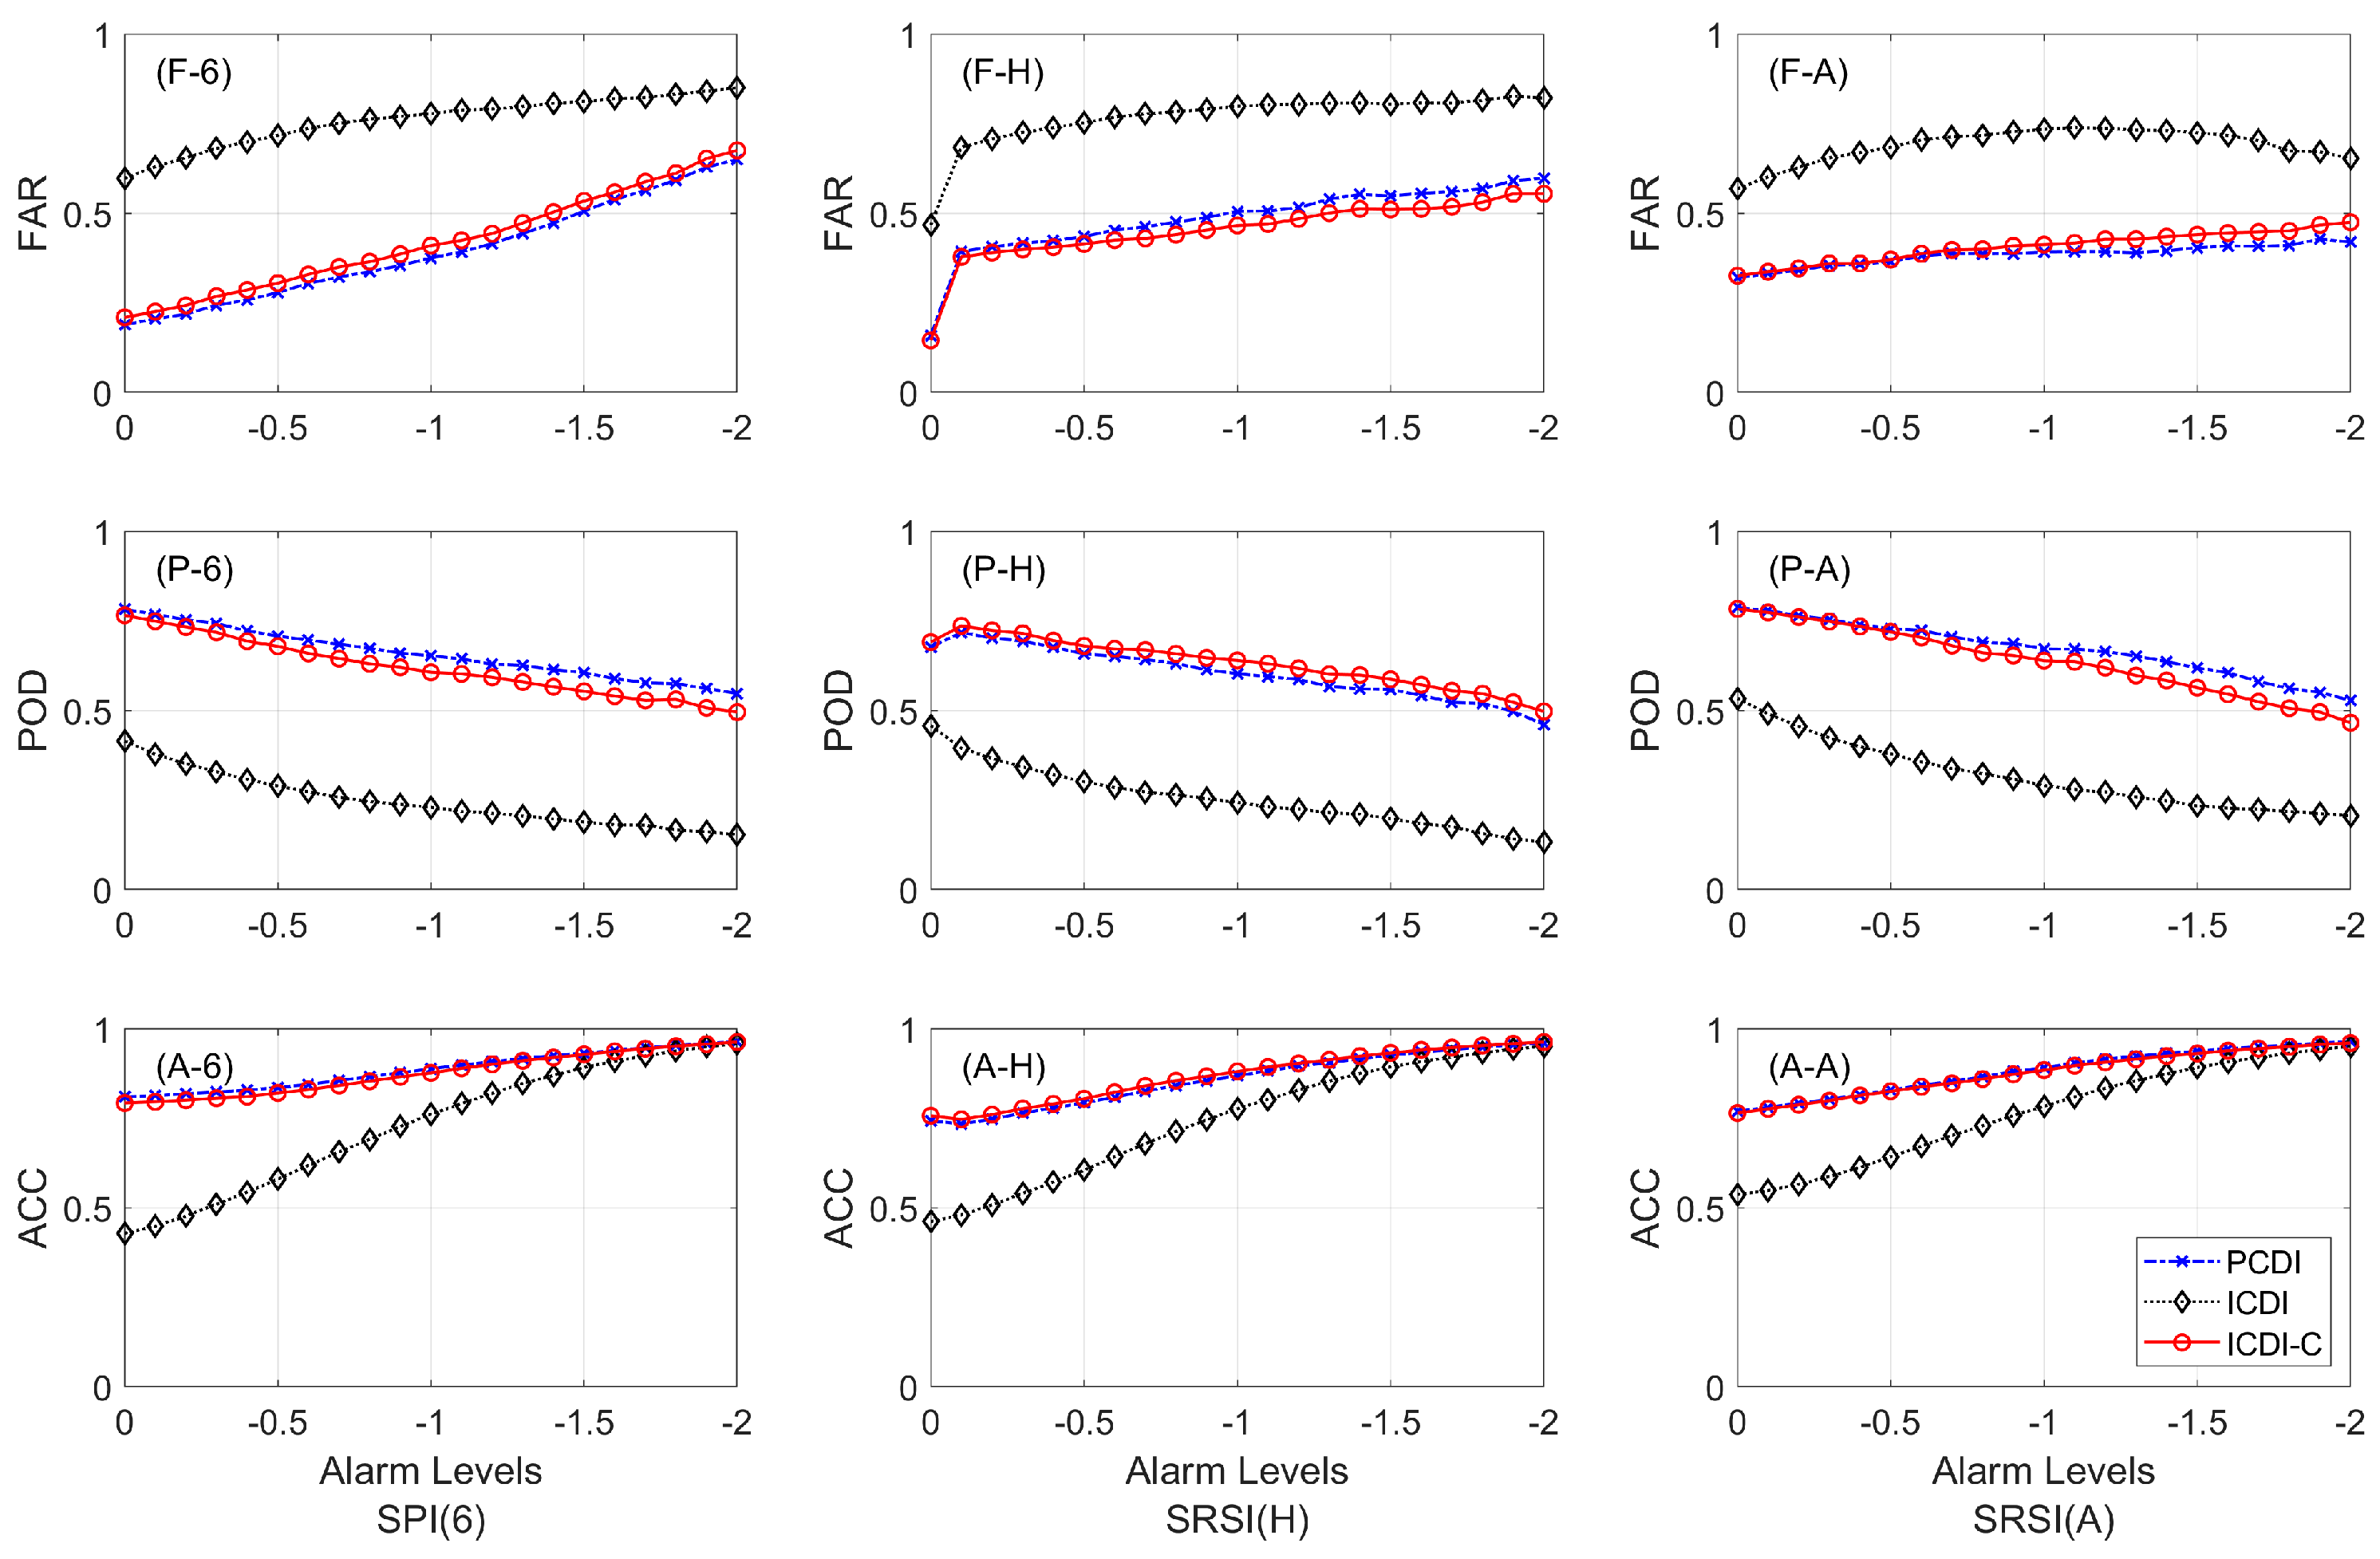
4.3. Alarm Performance

The alarm performance was also tested to compare the indices, as indicated in Figure 11. This was done using FAR, POD, and ACC. Here, higher POD and ACC and lower FAR indicate better performance. The results show that the overall alarm performance of ICDI was the poorest, with the highest FAR and the lowest POD and ACC. Similar to the model performance results, PCDI was slightly better than the ICDI-C of SPI(6) and SRSI(A). However, ICDI-C showed better performance than the PCDI of SRSI(H), with lower FAR, and higher POD and ACC. This indicates that ICDI-C can be more reliable in raising the alarm for hydrological drought events, which are more costly when they happen.

5. Discussion

Historically, drought studies have predominantly relied on individual drought indices, each targeting specific categories such as meteorological, hydrological, or agricultural drought. However, drought inherently represents a complex and multivariate phenomenon, thus necessitating the integration of diverse drought metrics into composite drought indices for a holistic understanding. In recognition of this, recent research has increasingly favored composite drought indices, notably the Aggregate Drought Index (ADI) and Combined Drought Index (CDI). Typically, these composite indices are developed by assigning appropriate weights to individual drought indicators and subsequently integrating these weights with observed data.
Previous studies have commonly employed Principal Component Analysis (PCA) for the extraction of these weights. While PCA efficiently addresses linear relationships, it inherently assumes linearity among the variables involved. Given the independence and potential non-linear relationships among drought indicators, Independent Component Analysis (ICA) presents itself as a more appropriate and robust alternative. ICA is particularly beneficial due to its capacity to capture both linear and nonlinear dependencies, thereby offering a more comprehensive characterization of drought phenomena.
A notable issue identified in prior studies is the frequent occurrence of negative weights derived from PCA, potentially leading to misleading interpretations and results. Negative weights can unintentionally generate positive outcomes when multiplied by negative observational values, thus undermining the reliability and physical interpretability of composite indices. To address this challenge, the present study proposes the implementation of two essential constraints during the weight extraction process: (1) ensuring all derived weights are positive, and (2) normalizing these weights so that their sum equals unity.
These imposed constraints significantly enhance the physical interpretability of the composite drought indices by ensuring that each index contributes positively and proportionally to the overall drought representation, effectively preventing any single index from disproportionately dominating or negatively influencing the composite outcome. Furthermore, this methodological advancement has broader applicability beyond drought research, extending its relevance to various scientific disciplines and practical applications where accurate and meaningful weight assignment is critical. The incorporation of these constraints is anticipated to yield more consistent, reliable, and interpretable results across diverse applications involving composite indices.

6. Summary and Conclusions

Developing a comprehensive index that integrates multiple drought types is essential for effective drought preparedness and mitigation. This study proposed a novel method for constructing a composite drought index encompassing meteorological, hydrological, and agricultural drought categories. While previous studies predominantly utilized Principal Component Analysis (PCA) for weight extraction, the current research introduced Independent Component Analysis (ICA) to develop the ICA-based Composite Drought Index (ICDI). Recognizing that raw ICA-derived weights could lead to inadequate performance due to negative values, two constraints were implemented—(1) ensuring weights remained positive, and (2) that their sum equaled unity. Incorporating these constraints, an improved index, termed ICDI-C, was subsequently developed. Additionally, a PCA-based Composite Drought Index (PCDI) was computed for comparative evaluation.
Model performance assessments involving Root Mean Square Error (RMSE), Mean Absolute Error (MAE), and correlation indicated that ICDI, lacking the imposed constraints, demonstrated the poorest performance. In contrast, ICDI-C and PCDI exhibited comparable overall performance. Notably, ICDI-C was superior in representing the hydrological drought index, SRSI(H), whereas PCDI performed slightly better for meteorological (SPI(6)) and agricultural (SRSI(A)) drought indices. Alarm performance, evaluated using False Alarm Ratio (FAR), Probability of Detection (POD), and Accuracy (ACC), corroborated these findings. ICDI was consistently the least reliable, while ICDI-C achieved the best performance specifically for hydrological drought detection.
Given that SRSI(H) data reflect conditions in dams and reservoirs, crucial to water resource management, particularly in South Korea, ICDI-C emerges as a particularly valuable composite index. Furthermore, ICDI-C’s enhanced capability in detecting severe and extreme agricultural drought conditions (SRSI(A)) highlights its practical importance in a country heavily reliant on agriculture. Thus, ICDI-C represents a robust tool for integrated drought management, meriting further refinement and broader application.

Author Contributions

Methodology, investigation and original draft writing, Y.K.; resources and data curation, J.-H.L.; conceptualization and review and editing, T.L. All authors have read and agreed to the published version of the manuscript.

Funding

This research was funded by [Ministry of Interior and Safety] and [National Research Foundation of Korea] grant number [2022-MOIS63-001] and [2023R1A2C1003850].

Institutional Review Board Statement

Not applicable.

Informed Consent Statement

Not applicable.

Data Availability Statement

The original contributions to the study are included in the article; further inquiries can be directed to the corresponding authors.

Acknowledgments

The authors acknowledge that this research was partially supported by a grant (2022-MOIS63-001) from Cooperative Research Method and Safety Management Technology in National Disaster funded by the Ministry of Interior and Safety (MOIS, Korea). This work was also supported by the National Research Foundation of Korea (NRF) grant funded by the Korean Government (MSIT) (2023R1A2C1003850).

Conflicts of Interest

The authors declare no conflict of interest.

References

  1. Dai, A. Drought under global warming: A review. Wiley Interdiscip. Rev. Clim. Change 2011, 2, 45–65. [Google Scholar] [CrossRef]
  2. Zargar, A.; Sadiq, R.; Naser, B.; Khan, F.I. A review of drought indices. Environ. Rev. 2011, 19, 333–349. [Google Scholar] [CrossRef]
  3. Spinoni, J.; Naumann, G.; Vogt, J.V.; Barbosa, P. The biggest drought events in Europe from 1950 to 2012. J. Hydrol. Reg. Stud. 2015, 3, 509–524. [Google Scholar] [CrossRef]
  4. Al-Bakri, J.T.; Alnaimat, M.J.; Al-Karablieh, E.; Qaryouti, E.A. Assessment of combined drought index and mapping of drought vulnerability in Jordan. Int. J. Eng. Res. Appl. 2019, 9, 59–68. [Google Scholar]
  5. Niemeyer, S. New drought indices. Mediterr. Options Ser. A Mediterr. Semin. 2008, 80, 267–274. [Google Scholar]
  6. Balti, H.; Ben Abbes, A.; Mellouli, N.; Farah, I.R.; Sang, Y.; Lamolle, M. A review of drought monitoring with big data: Issues, methods, challenges and research directions. Ecol. Inform. 2020, 60. [Google Scholar] [CrossRef]
  7. Eslamian, S.; Ostad-Ali-Askari, K.; Singh, V.P.; Dalezios, N.R.; Ghane, M.; Yihdego, Y.; Matouq, M. A review of drought indices. Int. J. Constr. Res. Civ. Eng. 2017, 3, 48–66. [Google Scholar]
  8. Mishra, A.K.; Singh, V.P. A review of drought concepts. J. Hydrol. 2010, 391, 202–216. [Google Scholar] [CrossRef]
  9. Wilhite, D.A.; Glantz, M.H. Understanding: The drought phenomenon: The role of definitions. Water Int. 1985, 10, 111–120. [Google Scholar] [CrossRef]
  10. Abu Arra, A.; Şişman, E. Characteristics of hydrological and meteorological drought based on intensity-duration-frequency (IDF) curves. Water 2023, 15, 3142. [Google Scholar] [CrossRef]
  11. Wang, W.; Ertsen, M.W.; Svoboda, M.D.; Hafeez, M. Propagation of drought: From meteorological drought to agricultural and hydrological drought. Adv. Meteorol. 2016, 2016. [Google Scholar] [CrossRef]
  12. Quiring, S.M. Monitoring drought: An evaluation of meteorological drought indices. Geogr. Compass 2009, 3, 64–88. [Google Scholar] [CrossRef]
  13. McKee, T.B.; Doesken, N.J.; Kleist, J. The relationship of drought frequency and duration to time scales. In Proceedings of the 8th Conference on Applied Climatology, Anaheim, CA, USA, 17–22 January 1993; pp. 179–183. [Google Scholar]
  14. Vicente-Serrano, S.M.; Beguería, S.; López-Moreno, J.I. A multiscalar drought index sensitive to global warming: The standardized precipitation evapotranspiration index. J. Clim. 2010, 23, 1696–1718. [Google Scholar] [CrossRef]
  15. Palmer, W.C. Meteorological Drought; US Department of Commerce, Weather Bureau: Washington, DC, USA, 1965; Volume 30.
  16. Wei, W.; Zhang, J.; Zhou, L.; Xie, B.; Zhou, J.; Li, C. Comparative evaluation of drought indices for monitoring drought based on remote sensing data. Environ. Sci. Pollut. Res. 2021, 28, 20408–20425. [Google Scholar] [CrossRef]
  17. Nalbantis, I.; Tsakiris, G. Assessment of hydrological drought revisited. Water Resour. Manag. 2009, 23, 881–897. [Google Scholar] [CrossRef]
  18. Yang, C.; Liu, C.; Gu, Y.; Wang, Y.; Xing, X.; Ma, X. A novel comprehensive agricultural drought index accounting for precipitation, evapotranspiration, and soil moisture. Ecol. Indic. 2023, 154, 110593. [Google Scholar] [CrossRef]
  19. Balint, Z.; Mutua, F.; Muchiri, P.; Omuto, C.T. Monitoring Drought with the Combined Drought Index in Kenya. Dev. Earth Surf. Process. 2013, 16, 341–356. [Google Scholar] [CrossRef]
  20. Keyantash, J.A.; Dracup, J.A. An aggregate drought index: Assessing drought severity based on fluctuations in the hydrologic cycle and surface water storage. Water Resour. Res. 2004, 40, W0930401–W0930413. [Google Scholar] [CrossRef]
  21. Barua, S.; Perera, B.; Ng, A. A comparative drought assessment of Yarra River Catchment in Victoria, Australia. In Proceedings of the 18th World IMACS/MODSIM Congress, Cairns, Australia, 13–17 July 2009; pp. 13–17. [Google Scholar]
  22. Al Bakri, J.; Rakonczai, J. Applicability of a Combined Drought Index to Monitoring Drought in Jordan. J. Eng. Res. Appl. 2019, 9, 20–39. [Google Scholar]
  23. Ozawa, S.; Kotani, M. A study of feature extraction and selection using independent component analysis. jEf 2014, 1, 1. [Google Scholar]
  24. Lee, T.; Won, C.-H.; Singh, V.P. ML-based regionalization of climate variables to forecast seasonal precipitation for water resources management. Mach. Learn. Sci. Technol. 2024, 5, 015019. [Google Scholar] [CrossRef]
  25. Nam, W.-H.; Hayes, M.J.; Svoboda, M.D.; Tadesse, T.; Wilhite, D.A. Drought hazard assessment in the context of climate change for South Korea. Agric. Water Manag. 2015, 160, 106–117. [Google Scholar] [CrossRef]
  26. Nam, W.-H.; Hong, E.-M.; Choi, J.-Y. Has climate change already affected the spatial distribution and temporal trends of reference evapotranspiration in South Korea? Agric. Water Manag. 2015, 150, 129–138. [Google Scholar] [CrossRef]
  27. Kyoung, M.; Kwak, J.; Kim, D.; Kim, H.; Singh, V.P. Drought analysis based on SPI and SAD curve for the korean peninsula considering climate change. In Climate Change—Geophysical Foundations and Ecological Effects; IntechOpen: London, UK, 2011. [Google Scholar]
  28. Kim, H.; Park, J.; Yoo, J.; Kim, T.-W. Assessment of drought hazard, vulnerability, and risk: A case study for administrative districts in South Korea. J. Hydro-Environ. Res. 2015, 9, 28–35. [Google Scholar] [CrossRef]
  29. Kwak, J.; Kim, S.; Jung, J.; Singh, V.P.; Lee, D.R.; Kim, H.S. Assessment of meteorological drought in Korea under climate change. Adv. Meteorol. 2016, 2016, 1–13. [Google Scholar] [CrossRef]
  30. Bae, H.; Ji, H.; Lim, Y.-J.; Ryu, Y.; Kim, M.-H.; Kim, B.-J. Characteristics of drought propagation in South Korea: Relationship between meteorological, agricultural, and hydrological droughts. Nat. Hazards 2019, 99, 1–16. [Google Scholar] [CrossRef]
  31. Lee, J.-W.; Hong, E.-M.; Kim, J.-U.; Jang, W.-J.; Jung, C.-G.; Kim, S.-J. Evaluation of agricultural drought in South Korea using socio-economic drought information. Int. J. Disaster Risk Reduct. 2022, 74, 102936. [Google Scholar] [CrossRef]
  32. Abu Arra, A.; Şişman, E. Innovative drought classification matrix and acceptable time period for temporal drought evaluation. Water Resour. Manag. 2024, 38, 2811–2833. [Google Scholar] [CrossRef]
  33. Abu Arra, A.; Şişman, E. A comprehensive analysis and comparison of SPI and SPEI for spatiotemporal drought evaluation. Environ. Monit. Assess. 2024, 196, 980. [Google Scholar] [CrossRef]
  34. Jeong, M.-S.; Park, S.-Y.; Kim, Y.-J.; Yoon, H.-C.; Lee, J.-H. Identification of propagation characteristics from meteorological drought to hydrological drought using daily drought indices and lagged correlations analysis. J. Hydrol. Reg. Stud. 2024, 55, 101939. [Google Scholar] [CrossRef]
  35. Khalid, S.; Khalil, T.; Nasreen, S. A survey of feature selection and feature extraction techniques in machine learning. In Proceedings of the 2014 Science and Information Conference, London, UK, 27–29 August 2014; pp. 372–378. [Google Scholar]
  36. Comon, P. Independent component analysis, a new concept? Signal Process. 1994, 36, 287–314. [Google Scholar] [CrossRef]
  37. Jutten, C.; Herault, J. Blind separation of sources, part I: An adaptive algorithm based on neuromimetic architecture. Signal Process. 1991, 24, 1–10. [Google Scholar] [CrossRef]
  38. Baek, K.; Draper, B.A.; Beveridge, J.R.; She, K. PCA vs. ICA: A Comparison on the FERET Data Set. In Proceedings of the 6th Joint Conference on Information Science, Research Triangle Park, NC, USA, 8–13 March 2002; pp. 824–827. [Google Scholar]
  39. Hyvärinen, A. Independent component analysis: Recent advances. Philos. Trans. R. Soc. A Math. Phys. Eng. Sci. 2013, 371, 20110534. [Google Scholar] [CrossRef] [PubMed]
  40. Stone, J.V. Independent component analysis: An introduction. Trends Cogn. Sci. 2002, 6, 59–64. [Google Scholar] [CrossRef]
  41. Chai, T.; Draxler, R.R. Root mean square error (RMSE) or mean absolute error (MAE). Geosci. Model. Dev. Discuss. 2014, 7, 1525–1534. [Google Scholar]
  42. Hodson, T.O. Root mean square error (RMSE) or mean absolute error (MAE): When to use them or not. Geosci. Model. Dev. Discuss. 2022, 2022, 1–10. [Google Scholar] [CrossRef]
Figure 1. ID numbers and region names for 127 sites. Note that (a) indicates the 167 sites assigned by use of Thiessen boundaries from 60 weather stations, which have been marked with blue dots to further develop the meteorological index; (b) addresses the data for 136 sites applied to develop SRSI(H); and (c) shows the reservoir data for 131 sites applied to develop SRSI(A).
Atmosphere 16 00688 g001
Figure 2. Procedure of the current study. (1) SPI(6) was selected for meteorological drought index development, and SRSI for both hydrological and agricultural drought indices; (2) the composite drought index was developed as ICDI, ICDI-C, and PCDI; (3) model and alarm performance comparisons were conducted with RMSE, MAE, and correlation and FAR, POD and ACC, respectively. (4) The conclusion was derived from the performance results.
Atmosphere 16 00688 g002
Figure 3. Schematic diagram of ICA.
Atmosphere 16 00688 g003
Figure 4. Comparison of ICDI and PCDI with a case wherein ICDI shows higher similarity to the SRSI(H) data compared to PCDI (site 5). Note that higher similarity with the observed data indicates a better model.
Atmosphere 16 00688 g004
Figure 5. Comparison of ICDI-C and PCDI for a case wherein it is difficult to verify the difference between ICDI-C and PCDI (site 1). Note that this is the case when further model and alarm performance metrics are needed as ICDI-C and PDCDI have high similarity.
Atmosphere 16 00688 g005
Figure 6. Comparison of ICDI-C and PCDI with a case wherein ICDI-C show higher similarity to the SRSI(H) data compared to PCDI (site 9). Note that higher similarity with the observed data indicates a better model.
Atmosphere 16 00688 g006
Figure 7. Comparison of ICDI-C and PCDI with a case wherein ICDI-C is more sensitive to maintaining extreme droughts in SRSI(A) (site 10). Note that when the composite index value is the same as or lower than the values in the observed data, it indicates that the composite index preserves the drought condition well.
Atmosphere 16 00688 g007
Figure 8. Boxplot of difference values between the observed data and drought indices data for all 127 sites.
Atmosphere 16 00688 g008
Figure 9. Timeseries of difference values between the observed data and drought indices data for 127 sites.
Atmosphere 16 00688 g009
Figure 10. Model performance of PCDI, ICDI, and ICDI-C with RMSE (top left panel), MAE (bottom left panel), and correlation (right panels for SPI(6), SRSI(H), and SRSI(A)). Lower RMSE and MAE and higher correlation are desirable.
Atmosphere 16 00688 g010
Figure 11. Alarm performances of PCDI, ICDI, and ICDI-C with FAR, POD, and ACC. Here, F-6, F-H and F-A indicate the FAR for SPI(6), SRSI(H), and SRSI(A), respectively. The other figures are also represented in the same way. Note that higher POD and ACC and lower FAR indicate better performance.
Atmosphere 16 00688 g011
Table 1. Drought categories of SPI and SRSI and their corresponding values.
SPI/SRSIDrought Category
≥2.0Extreme wet
1.50 to 1.99Severe wet
1.49 to 1.00Moderate wet
0.99 to −0.99Near normal
−1.00 to −1.49Moderate drought
−1.5 to −1.99Severe drought
≤−2.00Extreme drought
Table 2. Performance metrics equations and ideal values.
Type of
Performance Measurement
Performance MetricsEquationIdeal Values
Difference performanceBoxplotEach drought index value − composite drought index value
-
Median value closer to 0
-
Less outliers
-
Narrow box
Timeseries plotEach drought index value − composite drought index value
-
Closer to 0
Model
performance
RMSE i = 1 n x i x ^ i 2 n
-
Lower value closer to 0
MAE i = 1 n x i x ^ i n
-
Lower value closer to 0
Correlation C o v ( x , y ) σ x σ y
-
Higher value closer to 1
Alarm
performance
FAR F P T P + F P
-
Lower value closer to 0
POD T P T P + F P
-
Higher value closer to 1
ACC T P + T N T P + F P + T N + F N
-
Higher value closer to 1
Disclaimer/Publisher’s Note: The statements, opinions and data contained in all publications are solely those of the individual author(s) and contributor(s) and not of MDPI and/or the editor(s). MDPI and/or the editor(s) disclaim responsibility for any injury to people or property resulting from any ideas, methods, instructions or products referred to in the content.

