Article

The Variation in Emission Characteristics and Sources of Atmospheric VOCs in a Polymer Material Chemical Industrial Park in the Yangtze River Delta Region, China

1
College of Civil Engineering and Architecture, Zhejiang University of Water Resources and Electric Power, Hangzhou 310018, China
2
Ecological Environment Low Carbon Development Center of Zhejiang Province, Hangzhou 310012, China
3
Zheneng Jinjiang Environment Holding Company Limited, Hangzhou 310011, China
*
Author to whom correspondence should be addressed.
Atmosphere 2025, 16(6), 687; https://doi.org/10.3390/atmos16060687
Submission received: 30 April 2025 / Revised: 28 May 2025 / Accepted: 4 June 2025 / Published: 6 June 2025
(This article belongs to the Section Air Quality)

Abstract

:
To characterize the temporal variation in and source contribution of volatile organic compounds (VOCs) in a polymer industrial park, a two-year offline monitoring campaign (2018–2019) at Shangyu Industrial Park in the Yangtze River Delta was conducted. The study quantified the VOCs composition, seasonal variation, and ozone formation potential (OFP), with source apportionment performed using the Positive Matrix Factorization (PMF) model. During the observation period, the average concentration of total VOCs in 2019 was 286.1 ppb, showing a 22.6% reduction compared to that in 2018. Seasonal analysis revealed decreases in the total VOCs concentration by 41.8%, 38.4%, and 6.1% during spring, summer and winter, respectively, while an increase of 13.8% was observed in autumn, primarily attributed to industrial restructuring in the second half of 2019. Notable reductions were observed in specific VOCs components: oxygen-containing volatile organic compounds (OVOCs), alkane, halogenated hydrocarbon, alkene, and alkyne decreased by 34.5%, 27.9%, 26.3%, 24.6%, and 20.4%, respectively. The average OFP in 2019 was 2402.0 μg/m3, representing a 1.8% reduction from 2018. Contributions to total OFP from alkane, OVOCs, alkyne, and alkene decreased by 32.9%, 26.0%, 20.7%, and 15.0%, respectively, while halogenated hydrocarbons and aromatic hydrocarbons increased by 50.1% and 7.0%. PMF analysis identified four major VOCs sources: industrial production (44.9%), biomass combustion (17.8%), vehicle exhaust (11.0%), and solvent usage (26.3%). From 2018 to 2019, contributions from vehicle exhaust and solvent usage increased by 4.8% and 5.9%, respectively, while industrial production and biomass combustion decreased by 10.5% and 0.3%.

1. Introduction

Volatile organic compounds (VOCs) are a class of organic compounds present in the atmosphere that serve as critical precursors for ozone formation and secondary organic aerosol components [1]. They impact both the ambient air quality and human health [2,3]. Atmospheric VOCs exhibit complex compositions and can be categorized by their chemical structure into alkane, aromatic hydrocarbon, alkene, halogenated hydrocarbon, ester, aldehyde, ketone, and others. Their sources are equally diverse, including stationary combustion, vehicular emission, industrial process, solvent usage, and natural sources [4,5,6]. Studies demonstrated that anthropogenic sources dominated VOCs emission in densely populated areas [7]. In urban regions with a developed industrial economy, anthropogenic emissions can exceed natural sources by severalfold [8], making its impact on VOCs impossible to be ignored. For most Chinese cities, industrial sources constitute the majority, with industrial parks being primary contributors to industrial VOCs emission [9]. Since 2018, the Ministry of Ecology and Environment of China has issued various VOCs control policies, including the “Three Year Action Plan for Winning the Blue Sky Defense War” [10], the “Comprehensive Management Plan for Volatile Organic Compounds in Key Industries” [11], etc., which clearly focused on key emission industries, such as chemical and painting industries, and comprehensive control from multiple aspects, such as source control, VOCs control technology upgrading, strengthening supervision, and controlling unorganized emissions, in order to improve the air quality by reducing VOCs emissions.
The chemical industry has long served as a cornerstone of China’s national energy and industrial sector, with its VOCs emission significantly impacting regional air quality. Following the nationwide “Relocate Industrial Enterprises to Designated Parks” initiative, chemical industrial parks have become centralized hubs for both industrial development and pollutant accumulation—particularly for substantial VOCs emission [12,13,14]. The chemical production sector encompasses diverse product categories, complex manufacturing processes, and varied raw/auxiliary materials [15], resulting in a highly complex VOCs emission profile. In 2010, the chemical industry emitted 2630 kilotons of VOCs, accounting for 13.2% of total industrial VOCs emission [16], demonstrating the sector’s substantial environmental impact. China’s industrial expansion has spawned numerous rapidly developing large-scale chemical parks. By 2020, over 600 state-recognized key chemical parks specialized in petroleum/chemical production were operational [15]. The Yangtze River Delta (YRD) region hosts the densest concentration—more than 100 parks, exceeding one-sixth of China’s total parks [17]. Notably, 15 of the top 30 most competitive chemical parks (ranked in 2021 by the China Petroleum and Chemical Industry Federation) are located in Jiangsu, Zhejiang, and Shanghai [18]. Huang et al.’s YRD emission inventory reveals that chemical industry VOCs contribute to 38.0% of the region’s total ozone formation potential (OFP) [19]. These findings underscore the critical need to investigate VOCs emission characteristics and conduct source apportionment studies for chemical parks in the YRD region. In recent years, numerous scholars have investigated VOCs emission characteristics from different types of chemical industrial parks. Wang et al. studied the pollution features of VOCs in a coal chemical industrial park and their contribution to complex atmospheric pollution, identifying oxygenated volatile organic compounds (OVOCs) (such as propanal and formaldehyde), alkenes (such as cis-2-butene), and aromatic hydrocarbons (such as m/p-xylene and o-xylene) as the predominant characteristic pollutants [20]. Feng et al.’s research on a fine chemical industrial park in the YRD region revealed that dichloromethane, toluene, and 1,2-dichloroethane were the dominant VOCs species, with pharmaceutical manufacturing, agricultural chemical production, and rubber product enterprises being the primary emission sources [21]. Dumanoglu et al. reported seasonal variation characteristics of VOCs in Turkey’s Aliaga industrial zone, finding aliphatic compounds to be the predominant VOCs species, mainly originating from refineries and petrochemical plants [22]. Similarly, in Houston’s petrochemical industrial park in the United States, refineries and petrochemical enterprises were the most significant VOCs sources [23]. Wang et al. conducted the mobile monitoring of VOCs around different industrial parks in the YRD region, discovering that textile industry parks exhibited the highest VOCs concentration, followed by chemical, coating, and petrochemical industrial parks, demonstrating significant variations among different industrial parks [24]. Cheng investigated VOCs in a large chemical industrial park in the YRD region, establishing 25 VOCs source profiles based on chemical production processes and identifying aromatic hydrocarbons as priority control species [15]. Li et al. monitored VOCs in chemical industrial parks in Northeast China’s old industrial base, finding ten characteristic pollutants, including hexanethiol and carbon tetrachloride, and pharmaceutical/pesticide manufacturing, paint production, and rubber/plastic synthesis enterprises were the main emission sources [25]. Therefore, research has primarily focused on pharmaceutical, petrochemical, and coal chemical industries. However, there has been limited research on the characteristics and sources of VOCs emission in the polymer-material-processing industry, which belongs to the light chemical industry. Moreover, few studies also employed year-round continuous monitoring to reveal the annual variation in VOCs emission characteristics and sources.
This investigation selected a representative polymer-material-processing industrial park in the YRD region, implementing a comprehensive two-year offline VOCs monitoring program. The research systematically examined temporal variations in the VOCs concentration, chemical composition, OFP, and source apportionment conducted using a Positive Matrix Factorization (PMF) model in order to supplement the shortcoming of research on VOCs emission characteristics in chemical industrial parks. The resultant data elucidated the emission variation and provided critical scientific support for developing a targeted VOCs control strategy in the polymer-material-processing industry.

2. Materials and Methods

2.1. VOCs Sample Collection

The polymer-material-processing industrial park studied in this research is located in Shangyu District, Shaoxing City, Zhejiang Province (120.87° E, 30.01° N) in the YRD region, called Shangyu Industrial Park (SYIP). As a national-level industrial park, SYIP has developed into a characteristic chemical industry cluster specializing in polymer materials and biomedicine, representing one of China’s most typical industrial zones for polymer material processing. Its geographical location is marked by the red area in Figure 1. According to the National Economic Industry Classification [24], new polymer material processing belongs to the chemical raw material and chemical product manufacturing sector and belongs to the light chemical industry. The SYIP’s production processes involve the synthesis, processing, and application of polymer materials, utilizing various VOCs-containing raw and auxiliary materials during production processes. An ambient air pollution monitoring station is equipped in the SYIP center that conducts real-time online measurements of PM10 (particulate matter with the particle size of 10 μm or less), PM2.5 (particulate matter with the particle size of 2.5 μm or less), SO2, NOx, O3, and CO concentrations. Accordingly, this study established the sampling point at this monitoring station, with the sampling inlet positioned 15 m above ground level.
This study conducted a two-year offline monitoring campaign from 2018 to 2019, covering all four seasons: spring (from March to May), summer (from June to August), autumn (from September to November) and winter (from December to February of the following year). Daily sampling was performed, accumulating a total of 700 samples. The ambient air samples were collected using the 3.2 L passivated stainless steel SUMMA canister for 24 h integrated sampling (10:00 to 10:00 the next day) and the 2,4-dinitrophenylhydrazine (DNPH) sampling cartridge (CNW, 350 mg, Alta Scientific Co., Ltd., Tianjin, China) for 3 h integrated sampling (12:00–15:00). To prevent ozone interference during sampling, the inlet of the DNPH cartridge was connected to the ozone scrubber (Agela KI140, Bonaijer Technology Co., Ltd., Tianjin, China).

2.2. VOCs Sample Analysis

The monitoring methodology followed the Chinese national standard “Ambient air-determination of volatile organic compounds—collected by specially-prepared canisters and analyzed by gas chromatography/mass spectrometry (HJ 759-2015)” [26]. Air samples were analyzed through a process of concentration, thermal desorption, gas chromatographic separation, and mass spectrometric detection. Compound identification was achieved by comparing retention times and mass spectra with reference standards, while quantification employed the internal standard method. To ensure data reliability and validity, flow rates were verified before and after sampling using traceable standard flow meters, with allowable flow rate errors of ≤5%. Pre-sampling cleaning blank checks were performed on newly cleaned canisters to ensure that target compound concentrations were maintained below the detection limits.
For laboratory analysis, calibration curves with ≥5 points were established, requiring correlation coefficients (R2) ≥ 0.995 (otherwise recalibration was performed). Each sample batch included laboratory blanks and duplicate samples. Relative deviations between duplicate samples were required to be ≤30.0%. Each sampling batch included one full-process blank and one field duplicate sample. The study finally detected 98 VOCs species, comprising 29 alkanes, 26 halogenated hydrocarbons, 16 aromatic hydrocarbons, 12 alkenes, 6 aldehydes, 5 ketones, methyl tert-butyl ether (MTBE), acetonitrile, and acetylene.

2.3. OFP Calculation Method

Given the vast number and structural diversity of atmospheric VOCs, their atmospheric reactivity varies significantly. This study employed the OFP value to evaluate the atmospheric reactivity of VOCs. The OFP value serves as an indicator to assess the relative contribution of different VOCs species to ozone generation [27], with its calculation formula as follows:
O F P i = M I R i × V O C s i × M i n
where OFPi is the maximum ozone formation potential from VOCs species i, μg/m3; MIRi is the maximum incremental reactivity, μg/μg, of VOCs species i and the MIR value is adopted from the latest 2012 data from Carter’s laboratory [28]; VOCsi is the measured volume mixing ratio of VOCs species i, ppb; Mi is the relative molecular mass of VOCs species i; and n is the molar volume, L/mol, taken as 22.4 under standard conditions.

2.4. VOCs Source Apportionment Method

This study employed the PMF model for VOCs source apportionment, utilizing the PMF 5.0 software developed by the U.S. Environmental Protection Agency. As a receptor-based model, PMF estimates the source profiles and their contributions to ambient concentrations using observational data, with the distinct advantage of requiring no a priori input regarding source numbers or source profiles [29]. This approach has been widely applied in atmospheric VOCs source apportionment studies [30]. The fundamental principle of PMF involves factorizing the receptor matrix (X) into the source composition profile matrix (F), the source contribution matrix (G) and the residual matrix (E):
X i j = k = 1 P G i k F k j E i j
where Xij is the concentration of species j in environmental sample i, μg/m3; Gik is the contribution percentage of source k to environmental sample i, %; Fkj is the composition profile of species j in source k; Eij is the residual of species j in environmental sample i; and p is the number of identified sources, namely the number of factors.
The PMF model obtains factor distribution maps and contributions by minimizing the objective function Q using the least squares method:
Q = i = 1 n j = 1 n E i j U i j
where Uij is the uncertainty of each species in each sample. The calculation of Uij is as below:
U n c = 5 6 M D L C i M D L
U n c = E F i × C i 2 + 0.5 × M D L 2 C i > M D L
where Unc is uncertainty of VOCs species; MDL is the detection limits for VOCs species; EFi is the error score of VOCs species i, %; and Ci is mass concentration of VOCs species i, μg/m3. When the mass concentration of VOCs species is less than or equal to MDL, the uncertainty is calculated using Formula (4). When the mass concentration of VOCs species is greater than MDL, the uncertainty is calculated using Formula (5).

3. Results and Discussion

3.1. VOCs Concentration Characteristics

3.1.1. VOCs Concentration Level and Annual Variation

In 2019, the average volume concentration of total VOCs (TVOCs) in SYIP was 286.1 ± 393.6 ppb, showing a significant reduction of 22.6% compared to that in 2018 (369.7 ± 199.8 ppb). Many VOCs species have been listed as carcinogens and toxic substances by international organizations in Canada and the United States, posing great harm to human health [31]. Long-term exposure to high concentrations of VOCs may increase the risk of cancer, respiratory diseases, and other illnesses. A significant reduction in the VOCs concentration can not only improve the air quality but also reduce the carcinogenic or non-carcinogenic risks to the exposed population in SYIP.
As shown in Table 1, the average volume concentration of TVOCs in SYIP was significantly higher than those of industrial parks in other provinces but lower than the VOCs concentration measured at a fine chemical industrial park in Zhejiang Province. This observation indirectly reflected that Zhejiang’s chemical industrial parks generally exhibited higher VOCs emission levels compared to other industrial parks in China, which may be attributed to factors such as differences in the park scale, industrial structure, and meteorological conditions during sampling periods [9].
The seasonal average concentrations of TVOCs in SYIP in 2018, from high to low, were as follows: summer (469.4 ± 145.9) ppb, spring (456.2 ± 234.9) ppb, autumn (332.6 ± 171.1) ppb, and winter (226.5 ± 124.7) ppb. The average concentrations of TVOCs during 2019 according to the season, from high to low, were as follows: autumn (378.5 ± 720.1) ppb, summer (289.1 ± 148.8) ppb, spring (265.4 ± 230.9) ppb, and winter (212.7 ± 118.2) ppb. Compared to those in 2018, the TVOCs concentrations in spring, summer, and winter decreased by 41.8%, 38.4%, and 6.1%, respectively, in 2019, while they increased by 13.8% in autumn. This was mainly due to the industrial adjustment of SYIP in the second half of 2019, which comprehensively integrated the park and nearby industrial enterprises. The number and scale of polymer-material-processing enterprises had expanded [35], resulting in an increase in VOCs emission in autumn. After the special rectification of air pollution prevention and control in autumn and winter, the TVOCs concentration had significantly decreased [36,37].
Overall, the decrease in the VOCs concentration was mainly attributed to the governance of industrial enterprises. Since 2016, Shaoxing City and SYIP have carried out a large number of VOCs control measures, including improving the efficiency of VOCs treatment equipment [38], using low-concentration VOCs raw materials to replace high-concentration VOCs raw materials, and reducing VOCs leakage during the production process [39]. After years of accumulation, VOCs emitted from industrial sources were significantly reduced, resulting in a decrease in the VOCs concentration in the atmosphere.

3.1.2. VOCs Component Change Characteristics

The order and proportion of VOCs components in SYIP were similar in 2018 and 2019. Halogenated hydrocarbon and alkane were the two components with the highest proportion among VOCs, as shown in Figure 2. In 2018, the proportions of VOCs components were as follows: halogenated hydrocarbon (37.8%), alkane (21.3%), aromatic hydrocarbon (17.7%), OVOCs (13.3%), alkene (2.6%), alkyne (1.1%), and others (6.2%). In 2019, the proportions of VOCs components were as follows: halogenated hydrocarbon (36.0%), aromatic hydrocarbon (23.0%), alkane (20.0%), OVOCs (11.3%), alkene (2.6%), alkyne (1.2%), and others (6.1%).
Compared to those in 2018, the concentrations of alkane, alkene, halogenated hydrocarbon, and OVOCs all decreased in 2019, with OVOCs showing the most significant reduction (34.4%). Alkane, halogenated hydrocarbon, alkene, and alkyne decreased by 27.9%, 26.3%, 24.6%, and 20.4%, respectively, with only aromatic hydrocarbon rebounding by 0.7%. Aromatic hydrocarbons mainly came from vehicle exhaust and industrial production emission, indicating that the contributions of these two types of emissions have increased. From a seasonal perspective, the proportion of halogenated hydrocarbon remained at the top for two consecutive years. Halogenated hydrocarbons mainly came from solvent usage [40], which was closely related to the industrial structure of SYIP. Most enterprises in SYIP were polymer-material-processing and biopharmaceutical enterprises, which inevitably used solvents in the production process [41], resulting in a large amount of halogenated hydrocarbon emissions. Next was alkane, which mainly came from industrial production and vehicle exhaust [30]. The result indicated that vehicle exhaust was also an important source of VOCs in SYIP.
Table 2 shows the top ten VOCs species by volume concentration ranking in 2018 and 2019. The top ten species in 2018 accounted for 69.0% of the TVOCs volume fraction, while the top ten species in 2019 accounted for 60.9% of TVOCs. The top ten species in 2018 and 2019 mainly included halogenated hydrocarbons such as 1,2-dichloroethane, dichloromethane, chloroethane, and chloroform, OVOCs such as acetone and MTBE, alkanes such as propane, ethane, cyclohexane, 2,3-dimethylpentane, and 2-methylpentane, and aromatic hydrocarbons such as toluene, m/p-xylene, and Freon 11. Propane mainly came from vehicle exhaust, industrial production, and fuel recovery. Acetone may come from primary emissions such as solvent usage and the secondary conversion of atmospheric photochemical reactions. Dichloromethane mainly came from solvent usage [42,43,44,45].

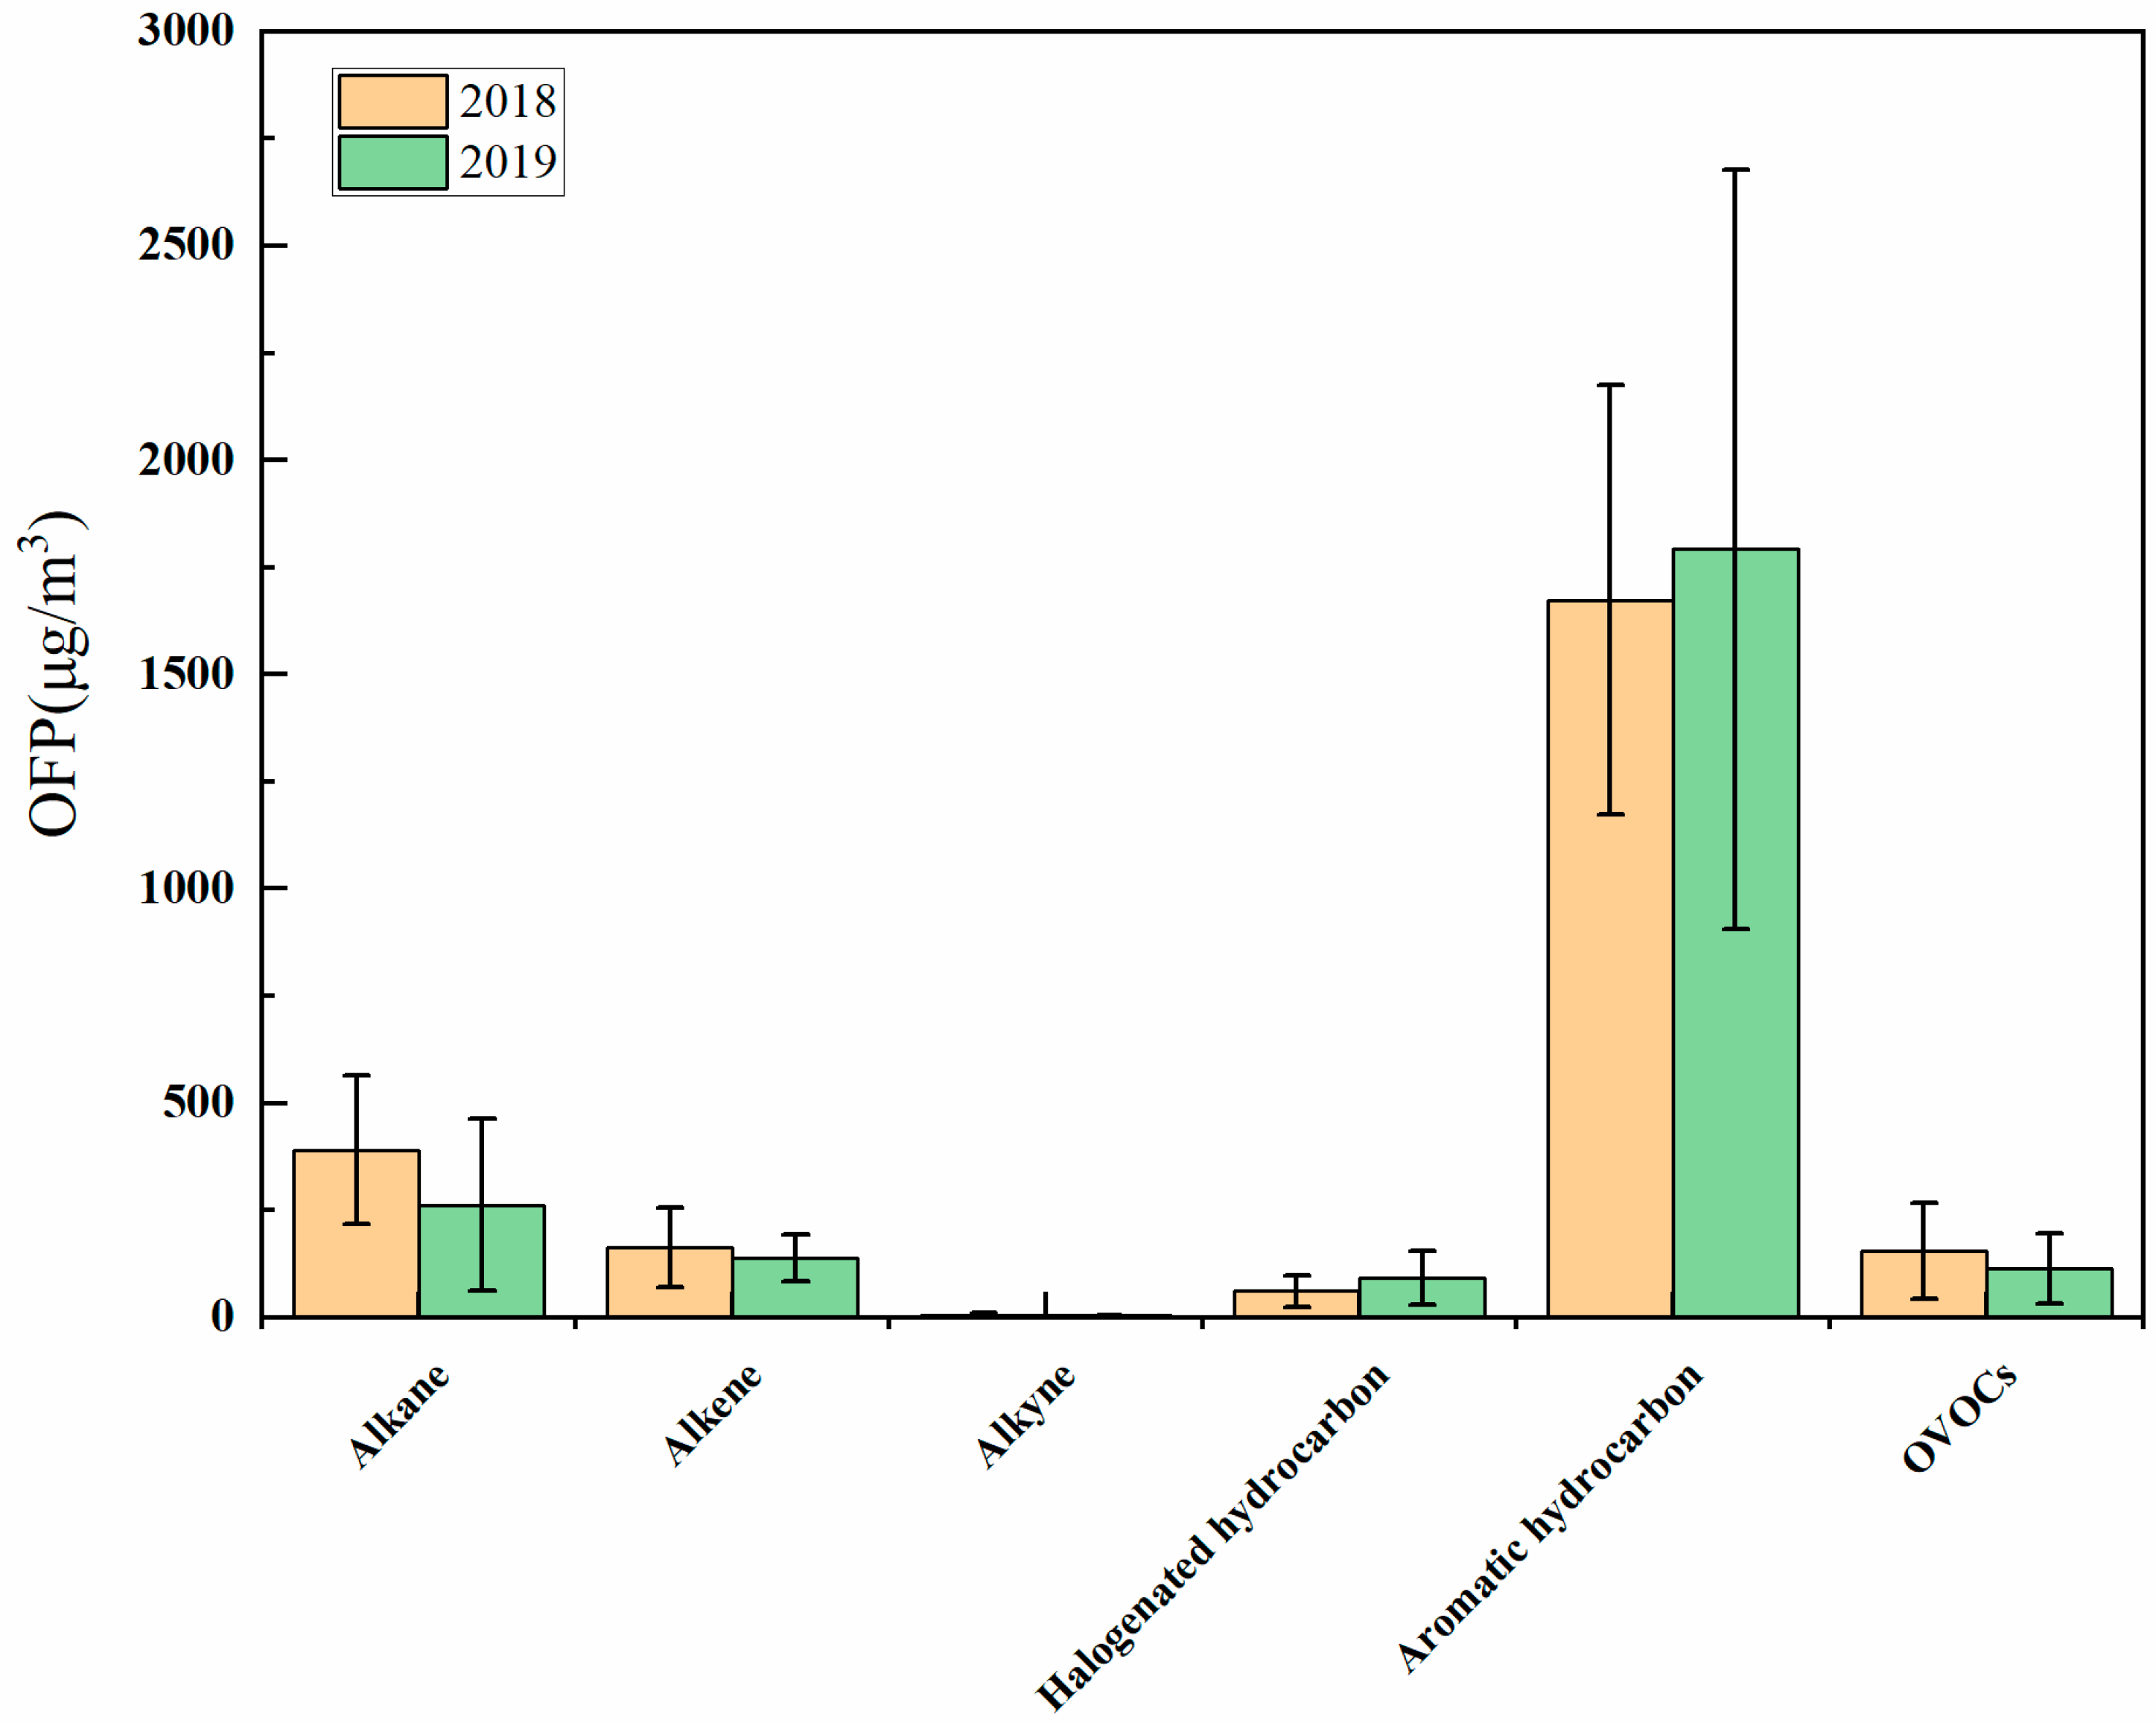
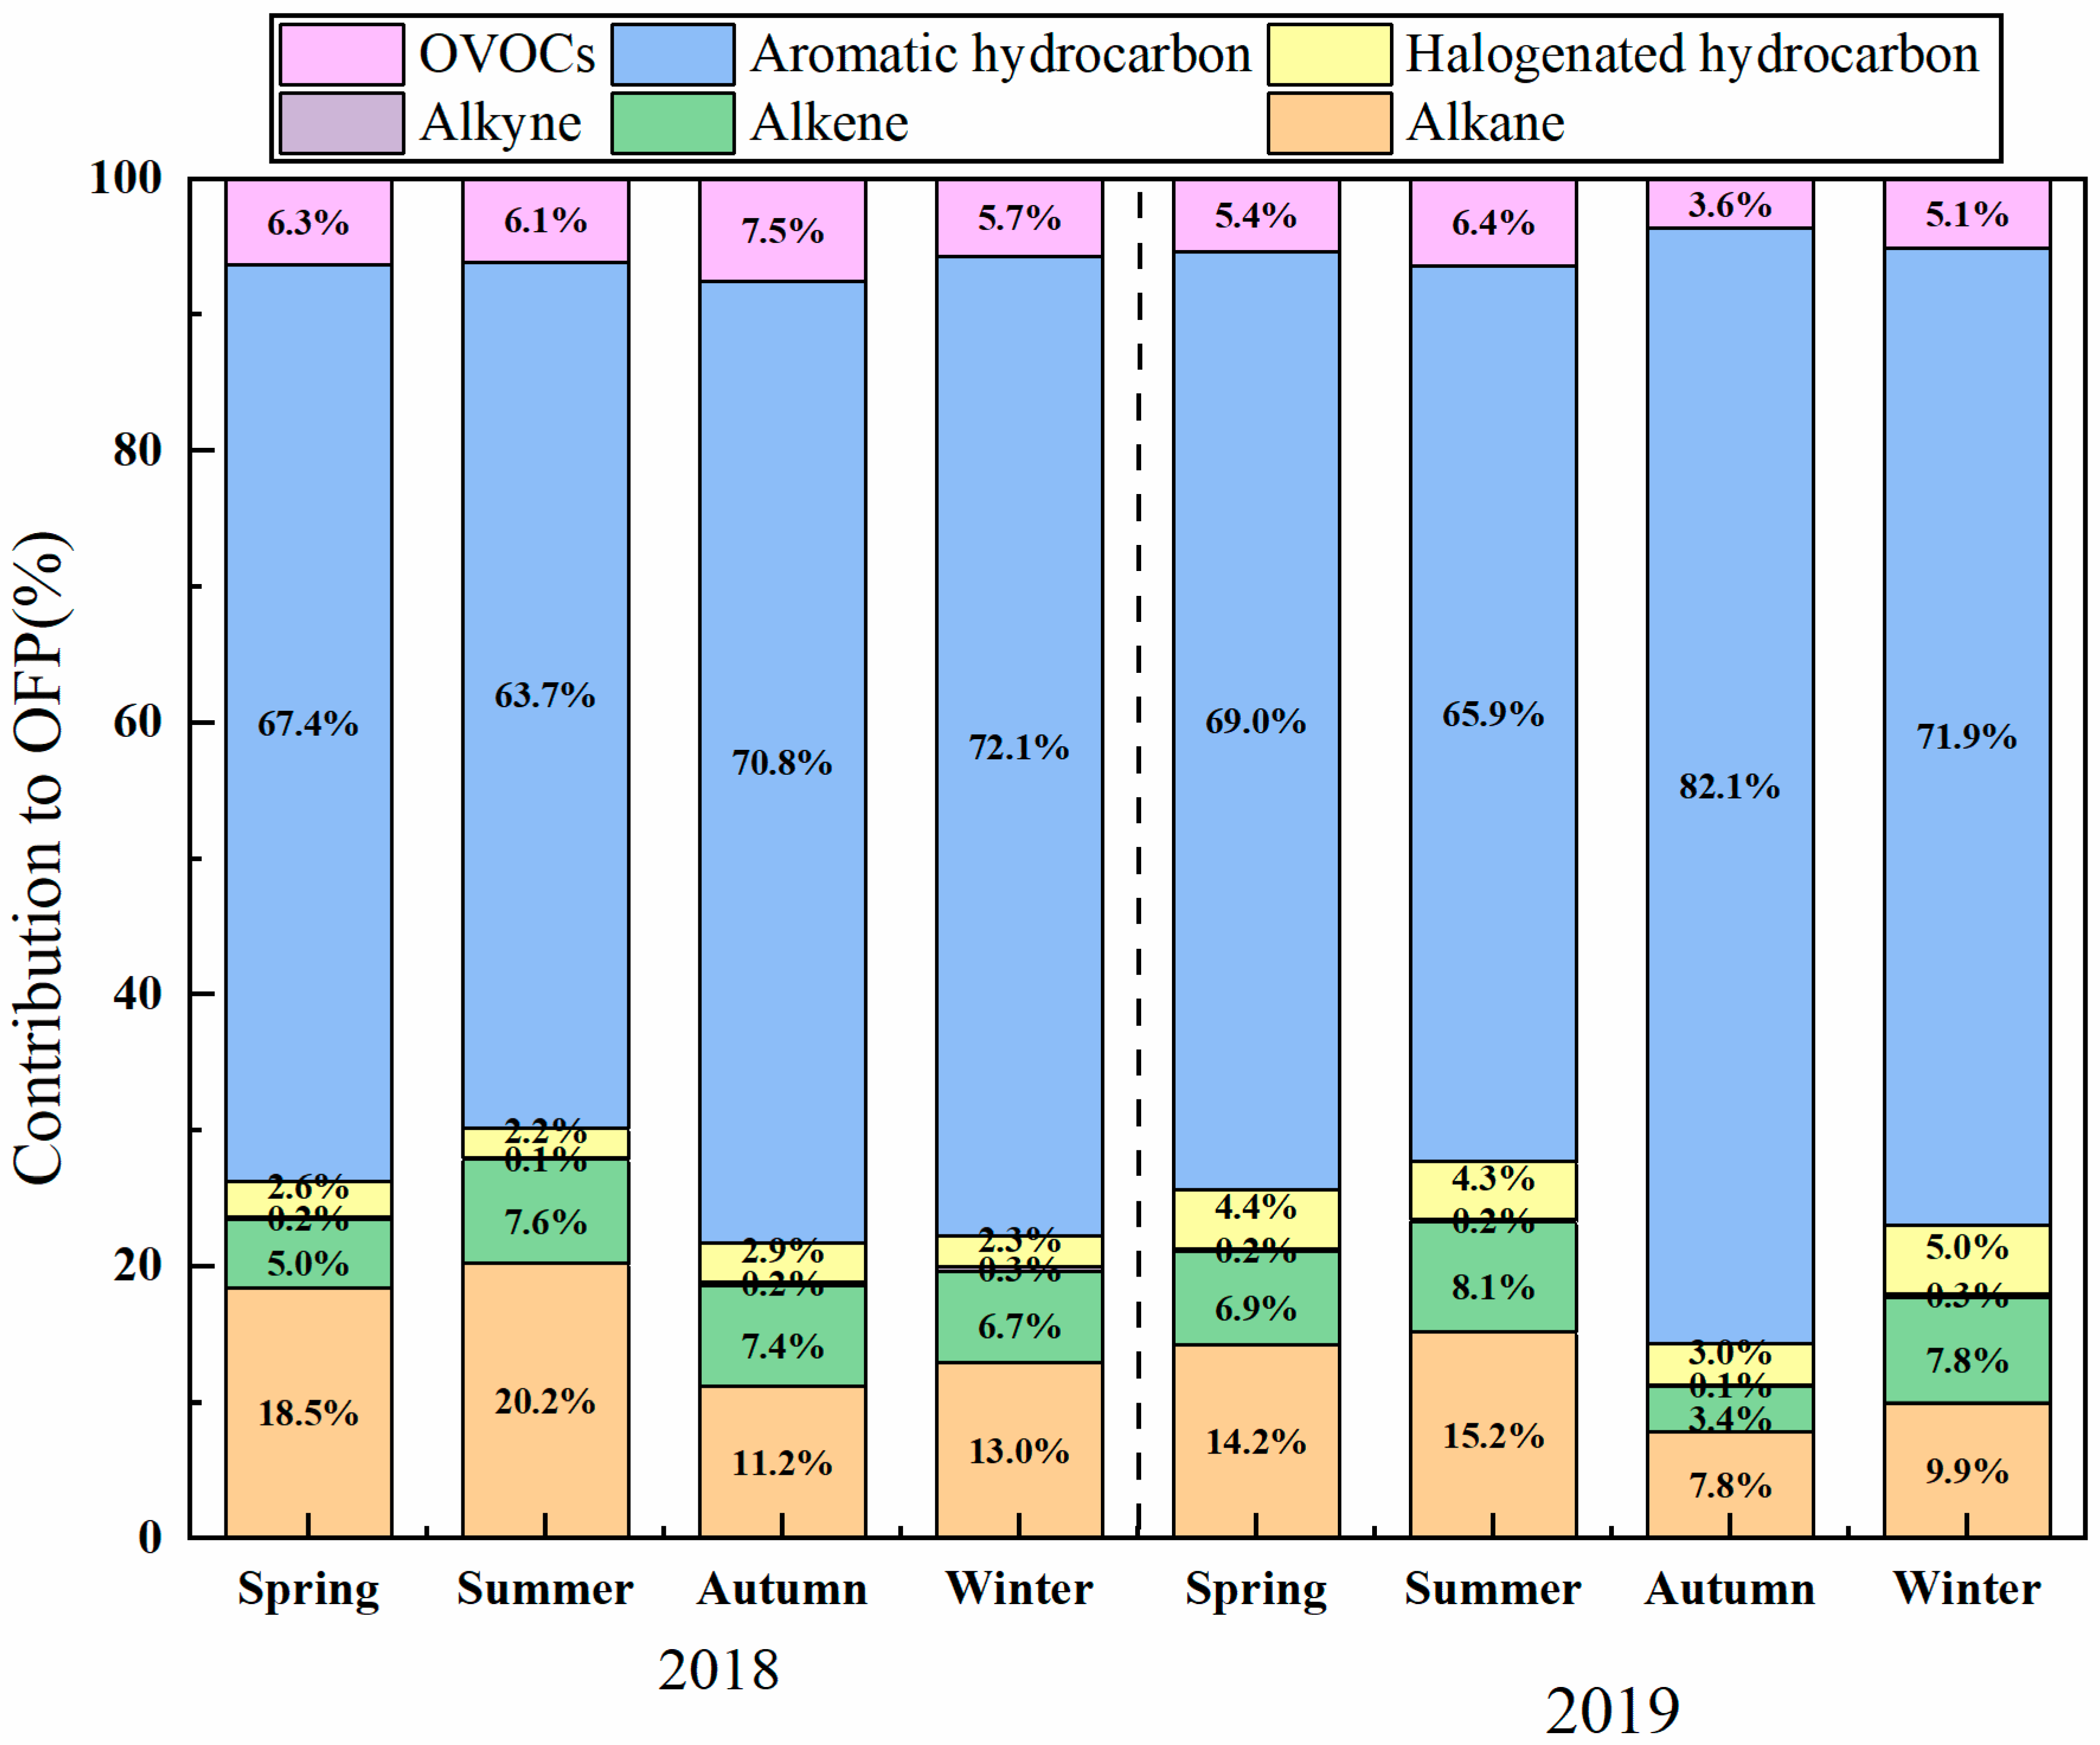
3.1.3. OFP Characteristics

In 2018, the average OFP of VOCs in SYIP was 2447.1 μg/m3. The proportions of each component from high to low were aromatic hydrocarbon (68.4%), alkane (16.0%), alkene (6.6%), OVOCs (6.3%), halogenated hydrocarbon (2.5%), and alkyne (0.2%). The average OFP in 2019 was 2402.0 μg/m3, and the proportions of each component from high to low were aromatic hydrocarbon (74.6%), alkane (10.9%), alkene (5.7%), OVOCs (4.8%), halogenated hydrocarbon (3.9%), and alkyne (0.2%). The OFP of alkane, OVOCs, alkyne, and alkene in 2019 decreased compared to those in 2018, with reduction rates of 32.9%, 26.0%, 20.7%, and 15.0%, respectively. The OFP of halogenated hydrocarbon and aromatic hydrocarbon increased by 50.1% and 7.0%, respectively, as shown in Figure 3.
Although halogenated hydrocarbon has rebounded, its OFP was much lower than OFP values of other VOCs species, mainly due to its lower photochemical reactivity. The aromatic hydrocarbon remained at a high level, with a two-year mean OFP of 1732.9 μg/m3, which was the species of priority concern in SYIP. Studies have shown that aromatic hydrocarbon was one of the most active VOCs species in photochemical reactions [46]. Aromatic hydrocarbon has a higher MIR value than other VOCs species, resulting in an obviously higher OFP value. Although the TVOCs concentration of SYIP decreased in 2019, the concentration proportion of aromatic hydrocarbon still increased from 17.7% to 23.0%, which was the main reason for the increased contribution to OFP.
Figure 4 shows the seasonal OFP contributions by VOCs species in SYIP from 2018 to 2019. Aromatic hydrocarbon dominated the OFP contribution, accounting for 64.0–82.0% of total OFP across all seasons. Alkyne showed the lowest OFP contributions, consistently remaining below 1.0%. The aromatic hydrocarbon contribution increased significantly during autumn and winter. The highest contribution occurred in autumn 2019. Aromatics showed strong dependence on industrial activities [30]. Consequently, they served as the dominant ozone precursors in this park. Alkane ranked second (8.0–20.0% contribution) and was identified as a priority control species for ozone mitigation.
Table 3 is the top ten VOCs species ranked by OFP in SYIP. Key OFP contributors mainly included aromatic hydrocarbons such as toluene, m/p-xylene, ethylbenzene, o-xylene, 1,2,4-trimethylbenzene, and 1,3,5-trimethylbenzene, alkanes such as cyclohexane, 2-methylpentane, and 2,3-dimethylpentane, alkenes such as ethylene, propylene, and isoprene, and OVOCs such as acetone and hexanal. Isoprene (a natural biogenic marker [44]) only appeared in summer 2018, confirming a minimal impact from natural sources on ozone formation in SYIP. Key aromatics (e.g., 1,3,5-trimethylbenzene, o-xylene, and m/p-xylene) were predominantly emitted from solvent usage and industrial processes [47,48], reinforcing the strong industrial contribution to ozone precursors.

3.2. VOCs Source Apportionment

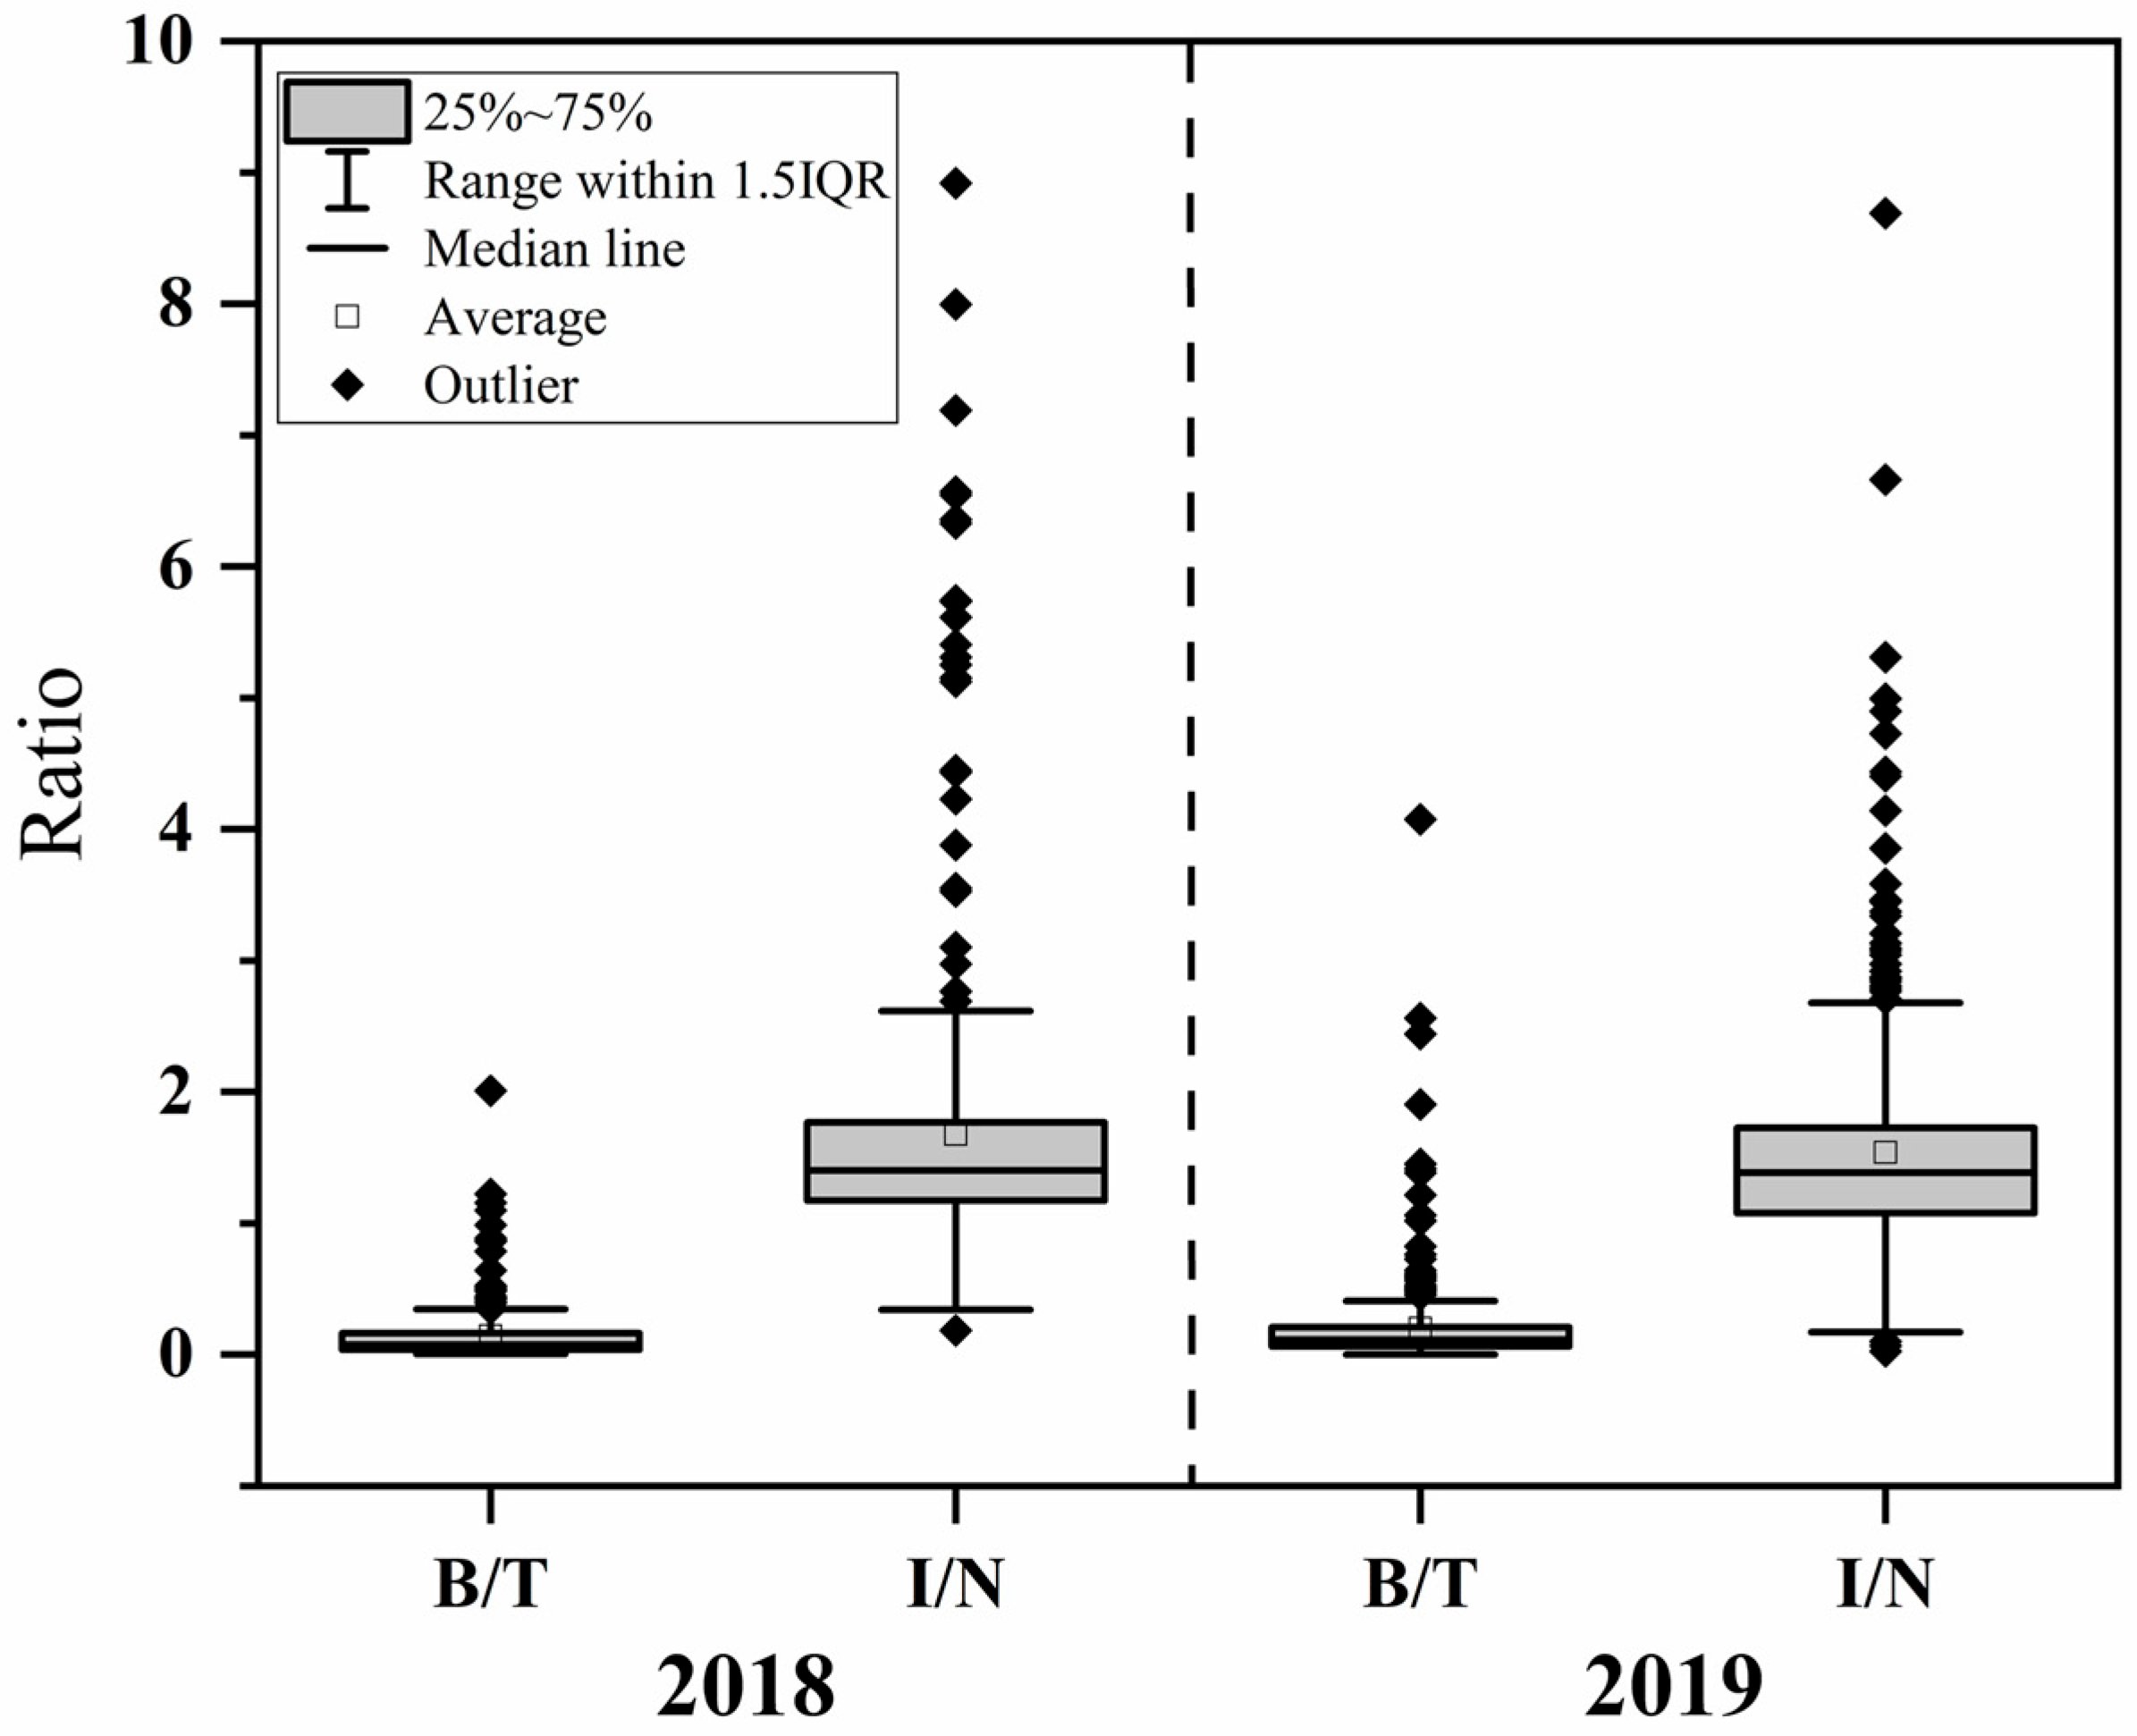
3.2.1. Characteristic Species Ratios

The ratio of benzene to toluene (B/T) is commonly used to indicate the main sources of VOCs in the atmosphere. According to research, a B/T value below 0.2 suggests that VOCs are predominantly influenced by solvent usage. A B/T range of 0.2 to 1 indicates significant impact from vehicle emissions. When this ratio falls between 1 and 1.5, it signifies that VOCs are more likely affected by combustion processes. Should the B/T value be within the range of 1.5 to 2.2, coal-fired sources appear to be the predominant influence on VOCs. Lastly, if the B/T exceeds 2.5, it points towards biomass combustion as the major source impacting VOCs concentrations [49]. The ratio of isopentane to n-pentane (I/N) can be used to indicate the emission sources of combustion. An I/N ratio ranging from 0.56 to 0.8 reflects coal combustion. A ratio between 1.5 and 3.0 characterizes the emissions of liquid gasoline after combustion in motor vehicles. Lastly, when the I/N ratio falls between 1.8 and 4.6, it indicates fuel evaporation, which mainly refers to the natural evaporation of petroleum products such as gasoline during storage and settling in petroleum refining, storage, transportation, and chemical processes [50].
As shown in Figure 5, the mean values of B/T and N/T in 2018 and 2019 were 0.2 ± 0.4, 0.1 ± 0.2, 1.5 ± 0.9, and 1.7 ± 1.1, respectively. The B/T ratios were all 0.2 or below, indicating a significant influence from solvent usage. Additionally, the I/N ratios were all above 1.5, suggesting a substantial impact from liquid gasoline evaporation. It was speculated that chemical enterprises within the industrial park primarily use liquid gasoline as their main combustion material. Therefore, it can be preliminarily concluded that solvent usage and gasoline evaporation may be the dominant sources of VOCs emission in SYIP.

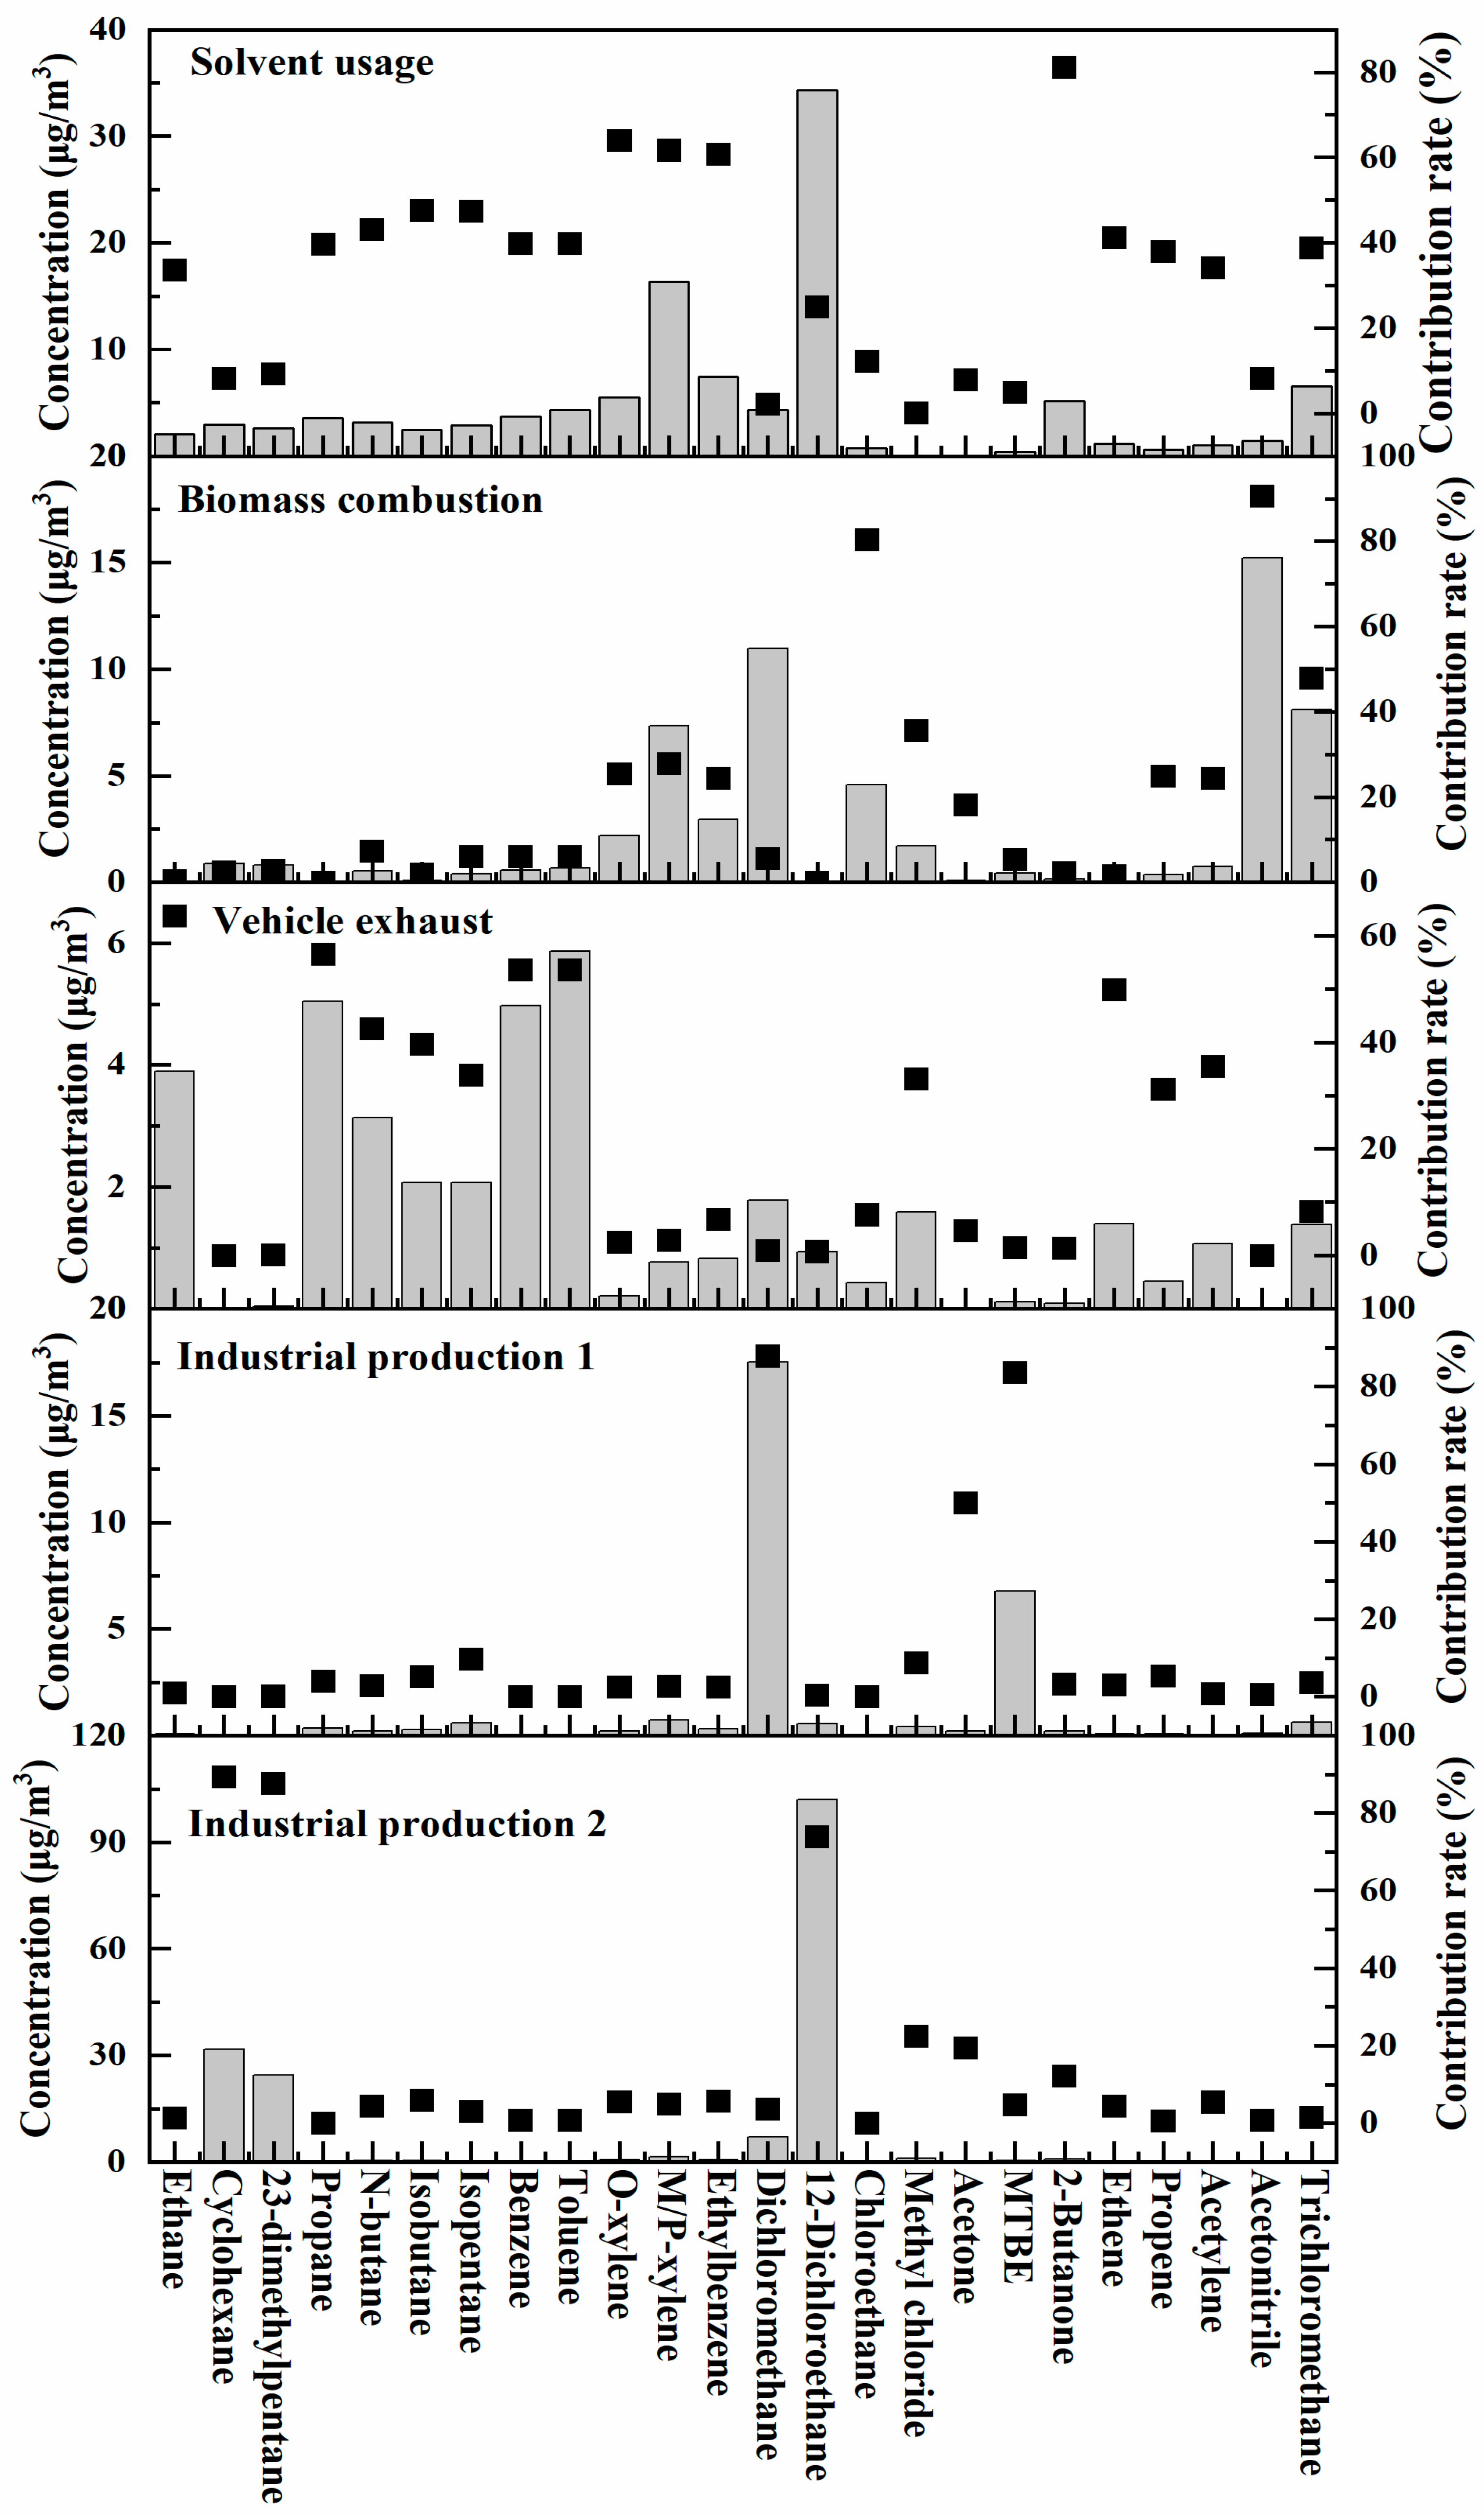
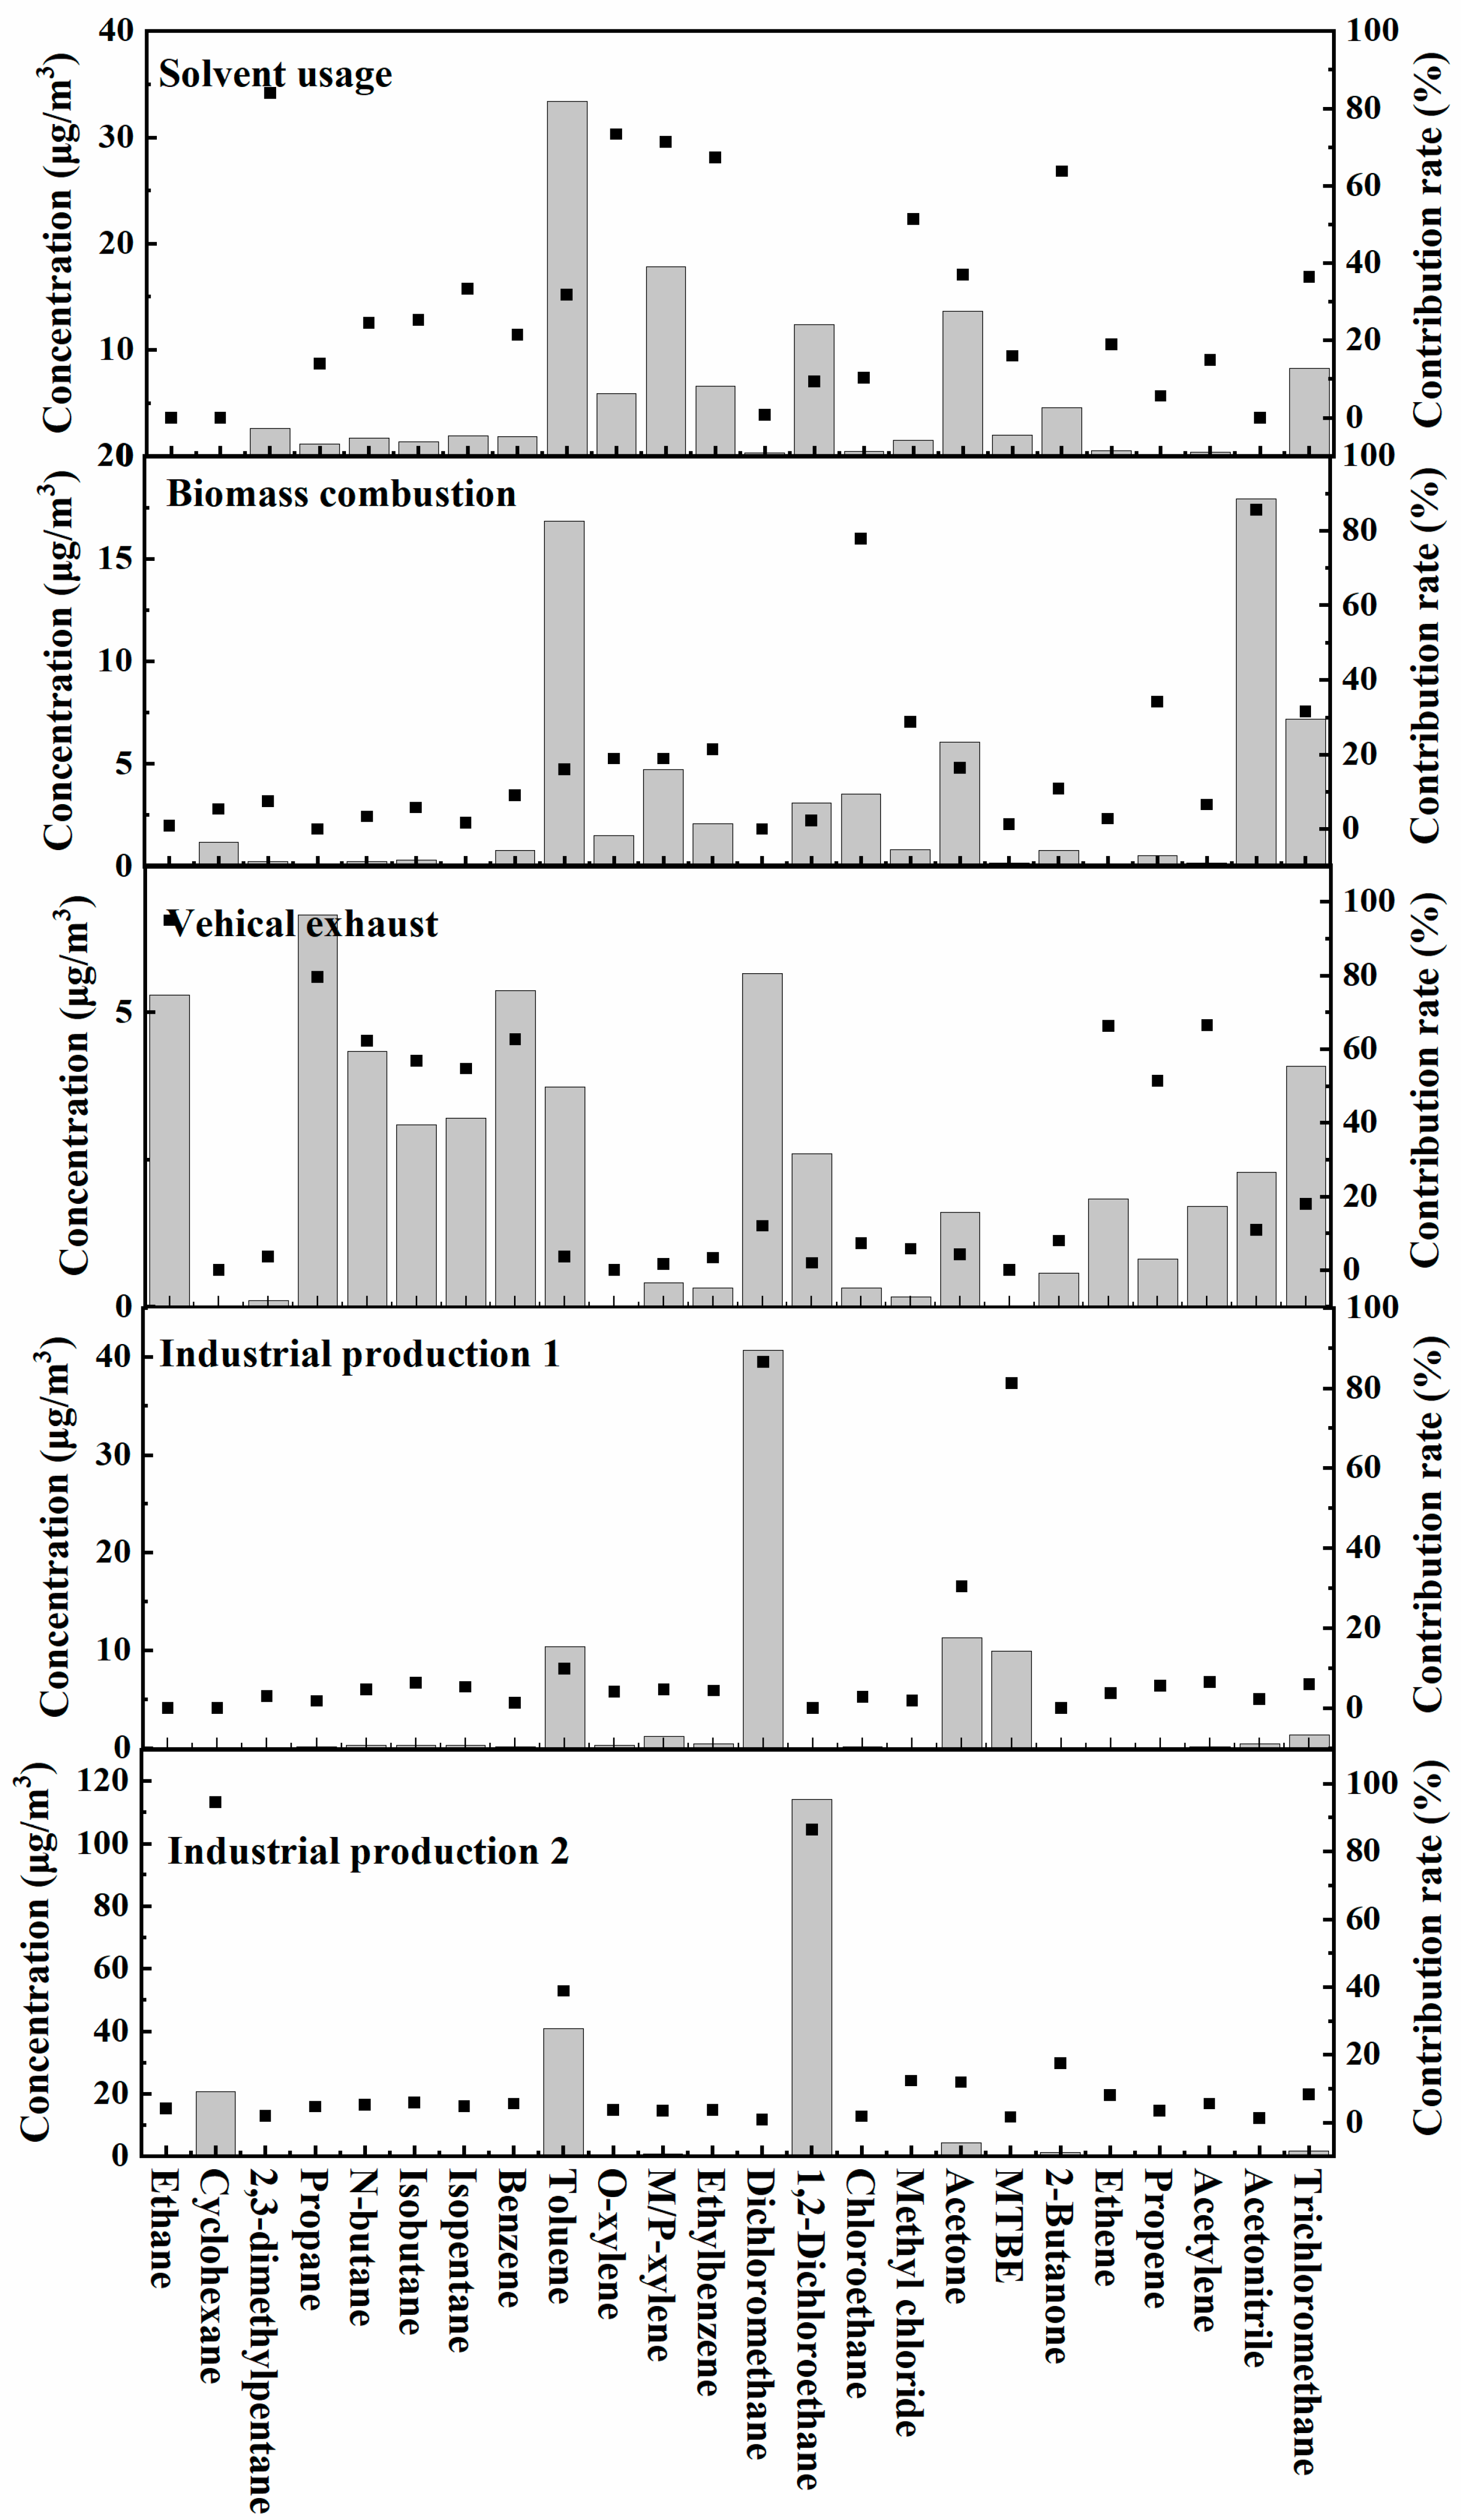
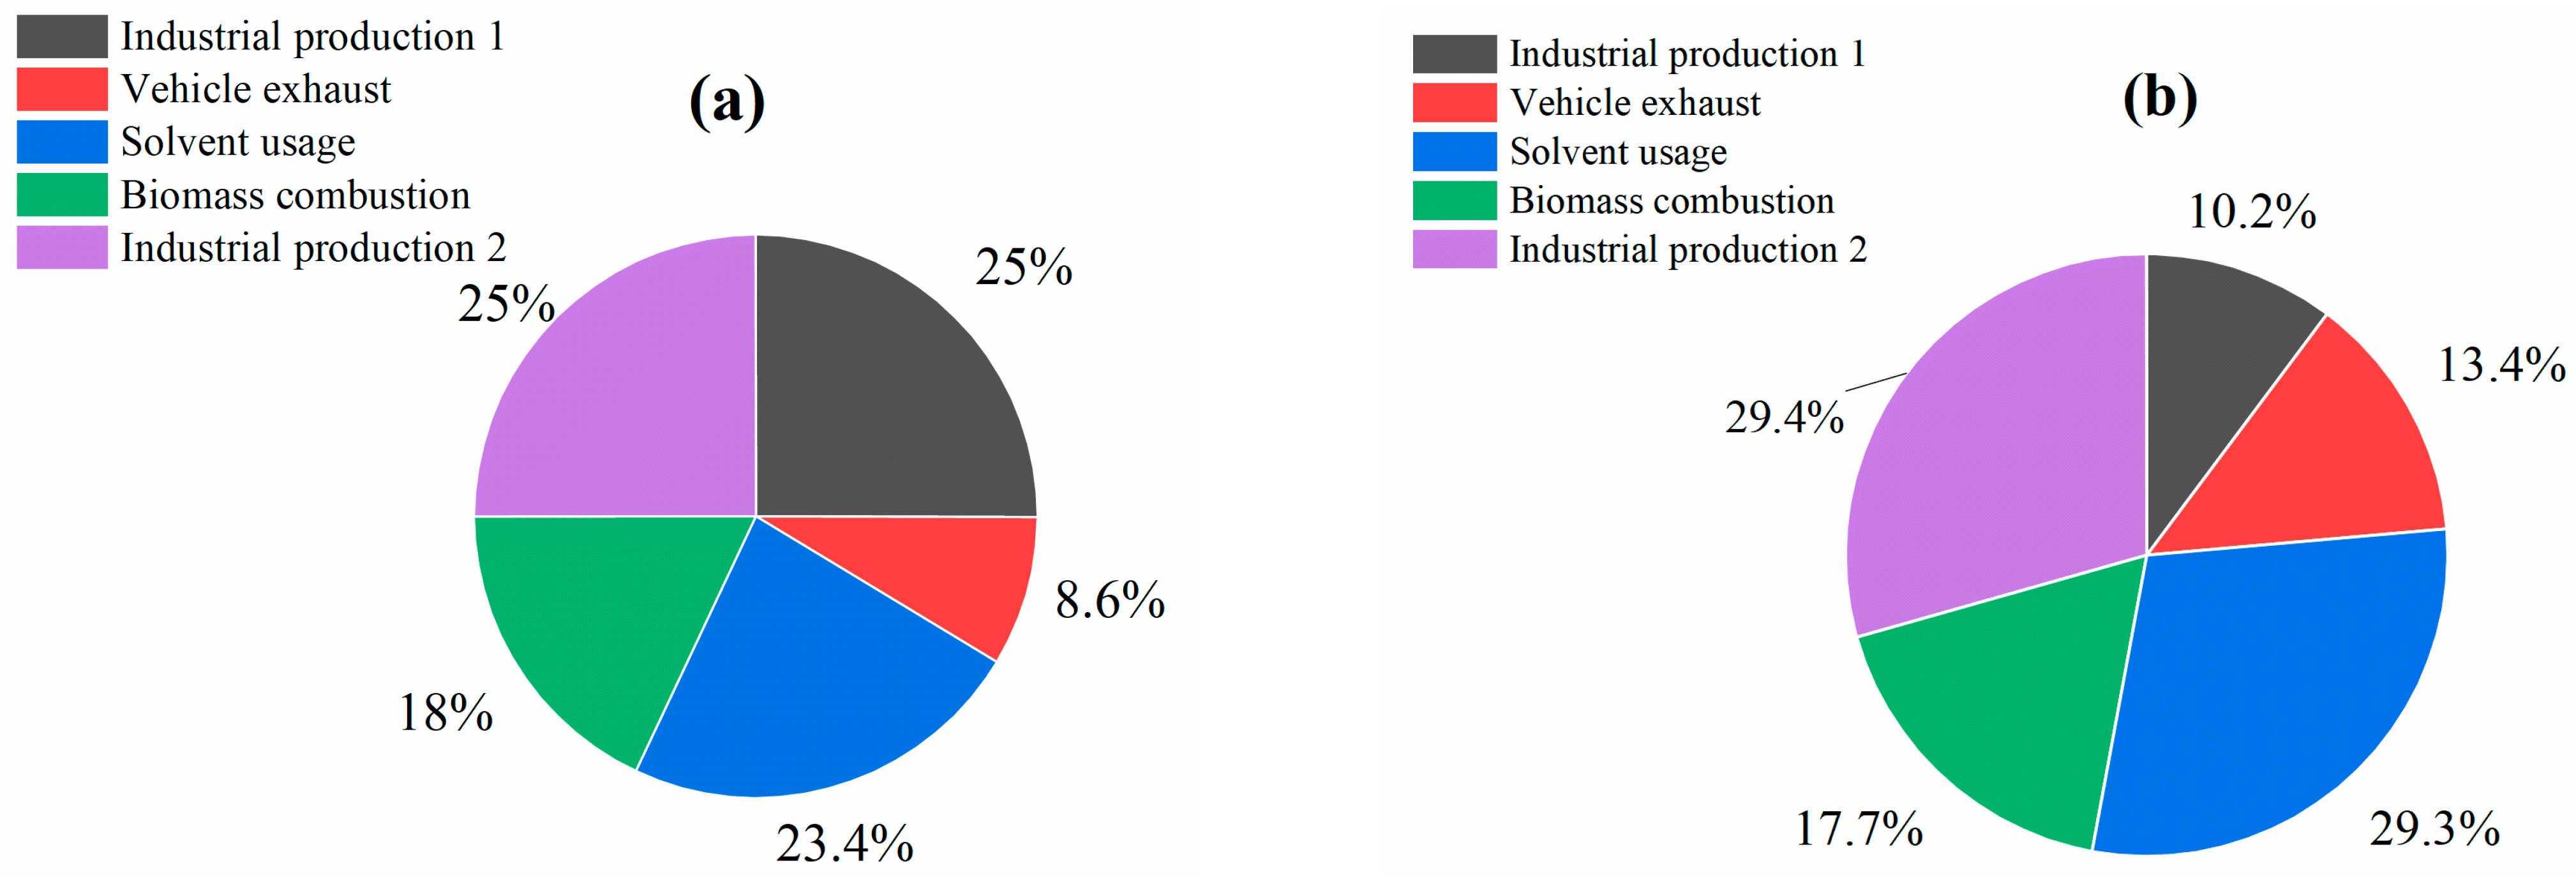
3.2.2. PMF Source Apportionment

To further identify the sources of different VOCs components, this study utilized the PMF 5.0 model to analyze VOCs sources in SYIP for the years 2018–2019, based on existing observational data. The selection of input compounds was determined primarily according to the following four principles: first, species with missing data proportions greater than 25.0% or with volume concentrations below the detection limit for 25.0% or more of the time were excluded. Second, species with relatively high concentrations and source-tracing significance were selected. Third, the chosen species had to possess strong indicative values for specific sources. Finally, highly reactive species were excluded. Ultimately, 24 VOCs species were selected from a total of 98 compounds for source apportionment. The Q(Robust)/Q(True) values ranged between 0.962 and 0.976. After multiple simulation runs, five factors were identified, with results showing high convergence, as illustrated in Figure 6 and Figure 7.
In Figure 6, the VOCs species with high contributions in Factor 1 were 2-butanone, o-xylene, m/p-xylene, and ethylbenzene. 2-Butanone and aromatic hydrocarbon were characteristic components of solvent usage sources [51,52]. The dominance of these species indicated emissions from solvent usage such as paint, coating, or degreasing applications. Therefore, Factor 1 was determined as the source of solvent usage. The VOCs species that contributed significantly to Factor 2 were acetonitrile, chloroethane, trichloromethane, and chloromethane. Acetonitrile and chloromethane are established biomass combustion markers [53,54]. Hence, Factor 2 was named as a biomass combustion source. The VOCs species that contributed significantly to Factor 3 were ethane, propane, benzene, toluene, and ethylene. Light alkanes (ethane, propane) and ethylene were primary vehicular exhaust components. In addition, vehicle exhaust contained a certain number of species such as ethylene, and the high content of aromatic hydrocarbons was also a characteristic of China’s vehicle exhaust emissions. Therefore, Factor 3 was named as the source of vehicle exhaust emissions. The VOCs species that contributed significantly to Factor 4 were 1,2-dichloroethane, MTBE, and acetone. 1,2-dichloroethane was linked to chemical manufacturing [55] and MTBE originated from petrochemical production or gasoline additive handling [56]. It was comprehensively judged that Factor 4 was a source of industrial production processes. The VOCs species that contributed significantly to Factor 5 were cyclohexane, 2,3-dimethylpentane, and 1,2-dichloroethane. Cyclohexane was a nylon production intermediate [57], and 1,2-dichloroethane was also from industrial production. Therefore, Factor 5 and Factor 4 were both industrial production sources. At the same time, the contribution of natural sources was minimal in SYIP, since the characteristic factor (isoprene) of the natural source was not identified, which was significantly different from the VOCs sources in cities [30,31,48,49,55,56,57,58,59].
In Figure 7, the VOCs species with higher contributions in Factor 1 were acetonitrile, chloroethane, propylene, trichloromethane, and chloromethane, which were consistent with the situation of Factor 2 in Figure 6. Therefore, it was identified as a biomass combustion source. The VOCs species with higher contributions in Factor 2 were ethane, propane, acetylene, and ethylene, so that Factor 2 was identified as a vehicle exhaust source. The VOCs species that contributed significantly to Factor 3 was 2,3-dimethylpentane, o-xylene, m/p-xylene, ethylbenzene, and 2-butanone, so that Factor 3 was named as a solvent usage source. The VOCs species with high contributions in Factor 4 were 1,2-dichloromethane, MTBE, and acetone. Therefore, Factor 4 was identified as an industrial production source. The VOCs species with high contribution in Factor 5 were cyclohexane, 1,2-dichloroethane, toluene, and 2-butanone. Factor 5 was also identified as an industrial production source.
The source apportionment results from 2018 to 2019 in Figure 8 indicated that the primary sources of atmospheric VOCs in SYIP included industrial production, biomass combustion, solvent usage, and vehicle exhaust. Industrial production has consistently been the most significant VOCs source in SYIP. In 2019, the contributions from vehicle exhaust and solvent usage increased by 4.8% and 6.0%, respectively, while the contributions from industrial production and biomass combustion decreased by 10.5% and 0.3%, respectively. Since 2016, local authorities have placed a strong emphasis on controlling VOCs emission from industrial production in chemical industrial parks [38]. The reduction in industrial production sources demonstrates the effectiveness of these efforts. However, the significant increases in solvent usage and vehicle exhaust highlight the need for enhanced control measures targeting these two sources in future VOCs pollution management efforts.

4. Conclusions

This study conducted a two-year offline sampling of VOCs in a typical polymer material chemical industrial park (SYIP) in the YRD region and analyzed the detection results. In 2019, the average concentration of TVOCs in SYIP was 286.1 ppb, marking a 22.6% reduction compared to that in 2018. The average concentrations of TVOCs during spring, summer, and winter were also reduced by 41.8%, 38.4%, and 6.1%, respectively. However, due to industrial restructuring and an increase in the number of enterprises within SYIP in the second half of 2019, the average concentration of TVOCs in autumn increased by 13.8%. Besides the TVOCs concentration, significant reductions were observed in various components of VOCs in SYIP, with OVOCs, alkane, halogenated hydrocarbon, alkene, and alkyne decreasing by 34.4%, 27.9%, 26.3%, 24.6%, and 20.4%, respectively.
The OFP of SYIP in 2019 (2402.0 μg/m3) decreased by only 1.8% from 2018 (2447.1 μg/m3). Specifically, the OFP values for alkane, OVOCs, alkyne, and alkene were reduced by 32.9%, 26.0%, 20.7%, and 15.0%, respectively, while those for halogenated hydrocarbon and aromatic hydrocarbon increased by 50.1% and 7.0%, indicating that these should be the focus as reactive VOCs in SYIP. Aromatic hydrocarbons such as toluene, m/p-xylene, ethylbenzene, o-xylene, 1,2,4-trimethylbenzene, and 1,3,5-trimethylbenzene consistently ranked among the top six contributors to OFP from 2018 to 2019.
Ultimately, the sources of VOCs in SYIP mainly comprised industrial production (44.9%), biomass combustion (17.8%), vehicle exhaust (11.0%), and solvent usage (26.3%). From 2018 to 2019, contributions from vehicle exhaust and solvent usage increased by 4.8% and 6.0%, respectively, while those from industrial production and biomass combustion decreased by 10.5% and 0.3%, respectively. The reduction of contributions from industrial production sources was primarily attributed to extensive measures taken for controlling industrial VOCs emission, which led to vehicle exhaust and solvent usage becoming additional key focuses for VOCs control in this park.

Author Contributions

W.L. prepared the original draft writing. J.W. conducted the sampling. C.X. analyzed the data and prepared the original draft writing. R.W. conducted the PMF analysis. All authors have read and agreed to the published version of the manuscript.

Funding

This study was funded by the “Pioneer” and “Leading Goose” R&D Program of Zhejiang, grant number 2025C02239, and the 2024 National College Student Innovation and Entrepreneurship Training Program, grant number 202411481016.

Institutional Review Board Statement

Not applicable.

Informed Consent Statement

Not applicable.

Data Availability Statement

The raw data supporting the conclusions of this article will be made available by the authors upon request.

Conflicts of Interest

Author Rupei Wang was employed by the company Zheneng Jinjiang Environment Holding Company Limited. The remaining authors declare that the research was conducted in the absence of any commercial or financial relationships that could be construed as a potential conflict of interest.

References

  1. Liu, D.; Xie, Q.; Zhang, X.; Wang, H.L.; Yan, Z.Y.; Yang, H.W.; Hao, Z.P. Source apportionment and health risk assessment of VOCs during the haze period in the winter in Beijing. Environ. Sci. 2016, 37, 3693–3701. (In Chinese) [Google Scholar]
  2. Bari, M.A.; Kindzierski, W.B. Ambient volatile organic compounds (VOCs) in Calgary, Alberta: Sources and screening health risk assessment. Sci. Total Environ. 2018, 631–632, 627–640. [Google Scholar] [CrossRef] [PubMed]
  3. Tang, X.Y.; Zhang, Y.H.; Shao, M. Atmospheric Environmental Chemistry, 2nd ed.; Higher Education Press: Beijing, China, 2006; pp. 172–175. (In Chinese) [Google Scholar]
  4. Hui, L.R.; Liu, X.G.; Tan, Q.W.; Feng, M.; An, J.L.; Qu, Y.; Zhang, Y.H.; Jiang, M.Q. Characteristics, source apportionment and contribution of VOCs to ozone formation in Wuhan, Central China. Atmos. Environ. 2018, 192, 55–71. [Google Scholar] [CrossRef]
  5. Wu, R.R.; Li, J.; Hao, Y.Q.; Li, Y.Q.; Zeng, L.M.; Xie, S.D. Evolution process and sources of ambient volatile organic compounds during a severe haze event in Beijing, China. Sci. Total Environ. 2016, 560–561, 62–72. [Google Scholar] [CrossRef]
  6. Shao, P.; An, J.L.; Xin, J.Y.; Wu, F.K.; Wang, J.X.; Ji, D.S.; Wang, Y.S. Source apportionment of VOCs and the contribution to photochemical ozone formation during summer in the typocal industrial area in the Yangtze River Delta, China. Atmos. Res. 2016, 176–177, 64–74. [Google Scholar] [CrossRef]
  7. Kansal, A. Sources and reactivity of NMHCs and VOCs in the atmosphere: A review. J. Hazard. Mater. 2009, 166, 17–26. [Google Scholar] [CrossRef]
  8. Zheng, J.Y.; Zheng, Z.Y.; Yu, Y.F.; Zhong, L.J. Temporal, spatial characteristics and uncertainty of biogenic VOC emissions in the Pearl River Delta region, China. Atmos. Environ. 2010, 44, 1960–1969. [Google Scholar] [CrossRef]
  9. Wang, L.J.; Qin, M. Analysis of VOCs characteristics and ozone formation potential in an industrial park in Hubei Province. Ind. Saf. Environ. Prot. 2024, 50, 92–97. (In Chinese) [Google Scholar]
  10. The State Council. Notice on Issuing the Three Years Action Plan for Winning the Blue Sky Defense War. Available online: https://www.gov.cn/gongbao/content/2018/content_5306820.htm (accessed on 26 May 2025). (In Chinese)
  11. Ministry of Ecology and Environment of China. Notice on Issuing the Comprehensive Management Plan for Volatile Organic Compounds in Key Industries. Available online: https://www.gov.cn/gongbao/content/2019/content_5442284.htm (accessed on 26 May 2025). (In Chinese)
  12. Hsu, C.; Chiang, H.; Shie, R.; Ku, C.; Lin, T.; Chen, M.; Chen, N.; Chen, Y. Ambient VOCs in residential areas near a large-scale petrochemical complex: Spatiotemporal variation, source apportionment and health risk. Environ. Pollut. 2018, 240, 95–104. [Google Scholar] [CrossRef]
  13. Liang, X.M.; Chen, X.; Zhang, J.; Shi, T.; Sun, X.; Fan, L.; Wang, L.; Ye, D. Reactivity-based industrial volatile organic compounds emission inventory and its compounds emission inventory and its implication for ozone control strategies in China. Atmos. Environ. 2017, 162, 115–126. [Google Scholar] [CrossRef]
  14. Sopian, N.; Jalaludin, J.; Tamrin, S. Risk of respiratory health impairment among susceptible pollution living near petrochemical industry-a review article. Iran. J. Public Health 2016, 45, 9–16. [Google Scholar]
  15. Cheng, N.N. Research on Ozone Emission Characteristics, Ozone Influencing Mechanism and Pollution Source Tracing in Typical Chemical Industrial Park. Ph.D. Thesis, Zhejiang University, Hangzhou, China, 2022. (In Chinese). [Google Scholar]
  16. He, M.L.; Xiao, H.L.; Chen, X.F.; Liang, X.M.; Fan, L.Y.; Ye, D.Q. Emission characteristics of volatile organic compounds in chemical industry park based on emission links. China Environ. Sci. 2017, 37, 38–48. (In Chinese) [Google Scholar]
  17. China Petroleum and Chemical Industry Federation. The Yangtze River Delta Chemical Industrial Park Welcomes New Opportunities. Available online: http://www.ccin.com.cn/detail/60c7712f0af68a4591022ce66bfce270 (accessed on 14 April 2025). (In Chinese).
  18. China Petroleum and Chemical Industry Federation. Top 30/Top 10 Potential Chemical Industrial Parks Announced in 2021. Available online: https://www.jiemian.com/article/6185111.html (accessed on 14 April 2025). (In Chinese).
  19. Huang, C.; Chen, C.H.; Li, L.; Cheng, Z.; Wang, H.L.; Streets, D.G.; Wang, J.Y.; Zhang, G.F.; Chen, Y.R. Emission inventory of anthropogenic air pollutants and VOC species in the Yangtze River Delta region, China. Atmos. Chem. Phys. 2011, 11, 4105–4120. [Google Scholar] [CrossRef]
  20. Wang, K.X.; Zhang, X.; Ji, Y.Y.; Li, H.; Fan, K.; Gao, R.; He, M. Characterization of ambient VOCs in a coal chemical industry park and their contribution to complex air pollution. Res. Environ. Sci. 2023, 36, 294–304. (In Chinese) [Google Scholar]
  21. Feng, D.D.; Wu, C.Z.; Chen, B.X.; Wang, Q.L.; Zhang, S.H.; Cheng, J.M.; Li, W. Characteristics and source analysis of VOCs in a fine chemical industrial park. J. Chem. Eng. Chin. Univ. 2021, 35, 935–942. (In Chinese) [Google Scholar]
  22. Dumanoglu, Y.; Kara, M.; Altiok, H.; Odabasi, M.; Elbir, T.; Bayram, A. Spatial and seasonal variation and source apportionment of volatile organic compounds (VOCs) in a heavily industrialized region. Atmos. Environ. 2014, 98, 168–178. [Google Scholar] [CrossRef]
  23. Buzcu-Guven, B.; Fraser, M.P. Comparison of VOC emissions inventory data with source apportionment results for Houston, TX. Atmos. Environ. 2008, 42, 5032–5043. [Google Scholar] [CrossRef]
  24. Wang, H.L.; Gao, Y.Q.; Jing, S.X.; Lou, S.R.; Hu, Q.Y.; An, J.Y.; Wu, Y.H.; Gao, W.; Zhu, L.; Huang, C. Characterization of volatile organic compounds (VOCs) using mobile monitoring around the industrial parks in the Yangzte River Delta Region of China. Environ. Sci. 2021, 42, 1298–1305. (In Chinese) [Google Scholar]
  25. Li, Y.H.; Lin, J.W.; Sun, J.C.; Song, W.Q.; Niu, X.W.; Li, Y.Z. Analysis of atmospheric VOCs pollution characteristics in a chemical industrial in Shenyang. Environ. Pollut. Control 2022, 44, 1175–1181. (In Chinese) [Google Scholar]
  26. HJ759-2015; Ambient Air-Determination of Volatile Organic Compounds—Collected by Specially—Prepared Canisters and Analyzed by Gas Chromatography/Mass Spectrometry. China Environmental Publisher: Beijing, China, 2015. (In Chinese)
  27. Deng, Y.Y.; Li, J.; Li, Y.Q. Characteristics of volatile organic compounds, NO2, and effects on ozone formation at a site with high ozone level in Chengdu. J. Environ. Sci. 2019, 01, 334–345. [Google Scholar] [CrossRef]
  28. Carter, W.P.L.; Heo, G. Development of revised SAPRC aromatics mechanisms. Atmos. Environ. 2013, 77, 404–414. [Google Scholar] [CrossRef]
  29. Shao, M.; Yuan, B.; Wang, M.; Zheng, J.Y.; Liu, Y.; Lu, S.H. Volatile Organic Compounds in the Atmosphere: Source and The Roles in Atmospheric Chemistry; Science Press: Beijing, China, 2020; pp. 226–228. (In Chinese) [Google Scholar]
  30. Zhang, H.Y.; Sui, H.X.; Wang, Z.F.; Zhang, S.F.; Du, M.Y.; Ge, X.; Wang, M.; Tao, W.X.; Xu, H.Y.; Gu, D.S.; et al. Characteristics and sources of volatile organic compounds in urban Jinan, China. China Environ. Sci. 2024, 9, 4765–4777. (In Chinese) [Google Scholar]
  31. Qin, T. Pollution Characteristics, Environmental Effect and Health Risk Assessment of Ambient VOCs in Zibo City. Master’s Thesis, Tianjin University of Technology, Tianjin, China, 2022. (In Chinese). [Google Scholar]
  32. Sun, Z.; Liu, S.T.; Zhang, H.; Wei, Y.B.; Wang, S.B.; Hong, X.Y.; Wang, X.Q.; Qian, L.M.; Zhu, S. Component characteristics and source analysis of VOCs in autumn in Hefei industrial park. J. Atmos. Environ. Opt. 2024, 19, 185–198. (In Chinese) [Google Scholar]
  33. Wang, J.; Yao, Z.; Wang, M.Y.; Chen, S.M.; Long, T.; Wang, H.L.; Li, H.; Guo, X.R.; Hao, J.H.; Nie, L. VOCs pollution characteristics and health risk assessment in typical industrial parks in Beijing: Environmental impact of high and new technology industries. Environ. Sci. 2024, 45, 2019–2027. (In Chinese) [Google Scholar]
  34. Gan, H. Characteristics, Sources and Health Risk Assessment of Atmospheric VOCs in a Chemical Industrial Park of Zibo. Master’s Thesis, Tianjin University of Technology, Tianjin, China, 2022. (In Chinese). [Google Scholar]
  35. Department of Commerce of Zhejiang Province. Introduction to Shangyu Economic Development Zone in Hangzhou Bay. Available online: http://www.zcom.gov.cn/art/2021/5/24/art_1389612_58930782.html (accessed on 14 April 2025). (In Chinese)
  36. Ministry of Ecology and Environment of China. Action Plan for Comprehensive Air Pollution Control in the Yangtze River Delta Region in Autumn and Winter in 2018–2019. Available online: https://www.mee.gov.cn/xxgk2018/xxgk/xxgk03/201811/W020181112374953651473.pdf (accessed on 14 April 2025). (In Chinese)
  37. Ministry of Ecology and Environment of China. Action Plan for Comprehensive Control of Air Pollution in Autumn and Winter in 2019–2020 in the Yangtze River Delta Region. Available online: https://www.gov.cn/zhengce/zhengceku/2019-11/26/content_5455687.htm (accessed on 14 April 2025). (In Chinese)
  38. Shaoxing Ecological Environment Bureau. The Regulation for the Remediation of Volatile Organic Compound Pollution in the Fine Chemical Industry in Shaoxing City. Available online: https://www.sx.gov.cn/art/2016/5/26/art_1229559239_1839264.html (accessed on 14 April 2025). (In Chinese)
  39. Shaoxing Ecological Environment Bureau Shangyu Branch. Implementation Plan for Scientific Treatment of Waste Gas in Hangzhou Bay Shangyu Economic and Technological Development Zone in 2024. Available online: https://www.shangyu.gov.cn/art/2024/5/10/art_1229218515_1900943.html (accessed on 14 April 2025). (In Chinese)
  40. Zhao, F. Variation Characteristics and Sources of Atmospheric Halocarbons in Mount Tai. Master’s Thesis, Shandong University, Jinan, China, 2022. (In Chinese). [Google Scholar]
  41. Yuan, Y. Research on innovation and development of polymer materials processing technology. Henan Sci. Technol. 2022, 25, 39–41. (In Chinese) [Google Scholar]
  42. Zhang, D.; He, B.; Yuan, M.; Yu, S.; Yin, S.; Zhang, R. Characteristics, sources and health risks assessment of VOCs in Zhengzhou, China during haze pollution season. J. Environ. Sci. 2021, 108, 44–57. [Google Scholar] [CrossRef]
  43. Li, J.Y.; Xie, X.D.; Li, L.; Wang, X.Y.; Wang, H.L.; Jing, S.A.; Ying, Q.; Qin, M.M.; Hu, J.L. Fate of oxygenated volatile organic compounds in the Yangtze River Delta Region: Source contributions and impacts on the atmospheric oxidation capacity. Environ. Sci. Technol. 2022, 56, 11212–11224. [Google Scholar] [CrossRef]
  44. Wang, Z.Y.; Tian, X.; Li, J.; Wang, F.; Liang, W.; Zhao, H.; Huang, B.; Wang, Z.H.; Feng, Y.C.; Shi, G. Quantitative evidence from VOCs source apportionment reveals O3 control strategies in northern and southern China. Environ. Sci. 2023, 172, 107786. [Google Scholar] [CrossRef]
  45. Zou, Y.; Yan, X.L.; Flores, R.M.; Zhang, L.Y.; Yang, S.P.; Fan, L.Y.; Deng, T.; Ye, D.Q. Source apportionment and ozone formation mechanism of VOCs considering photochemical loss in Guangzhou, China. Sci. Total Environ. 2023, 903, 166191. [Google Scholar] [CrossRef]
  46. Yang, D.Y. Research on the Sources of VOCs and Ozone Generation Potential Under Clean Heating in Rural Areas of North China. Master’s Thesis, North China Electric Power University, Beijing, China, 2023. (In Chinese). [Google Scholar]
  47. Qiao, S.Y.; Guan, J.W.; Guan, L.; Zhang, T.; Wang, Y.Y.; Shen, J.D.; Yu, X.N. Composition characteristics of volatile organic compounds and contribution to secondary pollution formation in Hangzhou. China Environ. Sci. 2024, 44, 1921–1928. (In Chinese) [Google Scholar]
  48. Pang, X.D.; Gao, B.; Chen, L.G.; Liu, M.; Lu, H.T.; Wang, S.; Zhao, W.; Liang, X.M.; Guo, S.J. Characteristics and source apportionment of volatile organic compounds in Zhanjiang in Summer. Environ. Sci. 2023, 44, 2461–2471. (In Chinese) [Google Scholar]
  49. Zhang, P.H.; Hu, D.M.; Peng, L.; Niu, W.L.; Gong, X.X.; Yan, Y.L.; Niu, Y.Y.; Dong, J.Q. Characteristics and sources of atmospheric VOCs pollution in Jincheng. China Environ. Sci. 2023, 9, 4525–4533. (In Chinese) [Google Scholar]
  50. Fu, Y.M. Analysis of Pollution Characteristics and Sources of VOCs in Ezhou City Based on PMF. Master’s Thesis, Wuhan University of Technology, Wuhan, China, 2020. (In Chinese). [Google Scholar]
  51. Guenther, A.; Geron, C.; Pierce, T.; Lamb, B.; Harley, P.; Fall, R. Natural emissions of nonmethane volatile organic compounds, carbon monoxide, and oxides of nitrogen from North America. Atmos. Environ. 2000, 34, 2205–2230. [Google Scholar] [CrossRef]
  52. Yuan, B.; Shao, M.; de Gouw, J.; Parrish, D.D.; Lu, S.H.; Wang, M.; Zeng, L.M.; Zhang, Q.; Song, Y.; Zhang, J.B.; et al. Volatile organic compounds (VOCs) in urban air: How chemistry affects the interpretation of positive matrix factorization (PMF) analysis. J. Geophys. Res. Atmos. 2012, 117, 1–17. [Google Scholar] [CrossRef]
  53. Shi, X.X.; Zheng, G.D.; Shao, Z.Z.; Gao, D. Effect of source-classified and mixed collection from residential household waste bins on the emission characteristics of volatile organic compounds. Sci. Total Environ. 2020, 707, 135478. [Google Scholar] [CrossRef]
  54. Niu, Z.Z.; Kong, S.F.; Yan, Q.; Zheng, S.R.; Zheng, H.; Zeng, X.; Yao, L.Q.; Wu, J.; Wu, F.Q.; Cheng, Y.; et al. Profile characteristics of VOCs from wood and economic crop burning. Environ. Sci. 2020, 41, 1107–1115. (In Chinese) [Google Scholar]
  55. Wang, C.H.; Chen, J.H.; Han, L.; Xu, C.X.; Wang, B.; Li, Y.J.; Liu, Z.; Qian, J. Seasonal pollution characteristics and analysis of the sources of atmospheric VOCs in Chengdu urban area. Environ. Sci. 2020, 41, 3951–3960. (In Chinese) [Google Scholar]
  56. Zhang, B.T.; Jing, K.; Wang, Q.; An, X.X.; Lu, H.F.; Wang, C.J.; Wang, Y.F.; Liu, B.X. Characteristics and source apportionment of VOCs initial Mixing Ratio in Beijing during summer. Environ. Sci. 2024, 24, 81–92. (In Chinese) [Google Scholar]
  57. Jiang, Z.M.; Yang, M.Y.; Wang, Y.; Zhang, Y.J.; Peng, H.H.; Lin, X.H.; Gao, Y.H. Characteristics and source apportionment of atmospheric volatile organic compounds in Zhongshan. Environ. Pollut. Control 2023, 45, 843–854. (In Chinese) [Google Scholar]
  58. Meng, X.L.; Sun, Y.; Liao, T.T.; Zhang, C.; Zhang, C.Y. Characteristic analysis and source apportionment of VOCs in urban areas of Beijing in summer. Environ. Sci. 2022, 22, 4484–4496. (In Chinese) [Google Scholar]
  59. Niu, Y.Y.; Liu, Z.C.; Li, R.M.; Gao, Q.Z.; Deng, M.J.; Yan, Y.L.; Hu, D.M.; Wu, J.; Peng, L. Characteristics, source apportionment, and environmental impact of volatile organic compounds in summer in Yangquan. Environ. Sci. 2020, 7, 3066–3075. (In Chinese) [Google Scholar]
Figure 1. The location of SYIP (120.87° E, 30.01° N) and sampling site. (The red region is SYIP).
Atmosphere 16 00687 g001
Figure 2. Volume fractions changes in VOCs components in four seasons from 2018 to 2019.
Atmosphere 16 00687 g002
Figure 3. Annual variation in OFP contributions by different VOCs species (2018–2019).
Atmosphere 16 00687 g003
Figure 4. Seasonal variations in OFP contributions by VOCs species from 2018 to 2019.
Atmosphere 16 00687 g004
Figure 5. Ratios of characteristic species in 2018 and 2019.
Atmosphere 16 00687 g005
Figure 6. VOCs source profile from PMF analysis in SYIP in 2018.
Atmosphere 16 00687 g006
Figure 7. VOCs source profile from PMF analysis in SYIP in 2019.
Atmosphere 16 00687 g007
Figure 8. Contribution proportions of major VOCs emission sources in SYIP: (a) 2018; (b) 2019.
Atmosphere 16 00687 g008
Table 1. Comparison of VOCs concentration and composition between SYIP and other industrial parks in China (unit: ppb).
LocationYearTVOCsAlkaneAlkeneAlkyneHalogenated
Hydrocarbon
Aromatic
Hydrocarbon
OVOCs
SYIP2018369.779.49.74.1139.865.449.2
SYIP2019286.157.27.33.3103.065.832.3
A tire manufacturing industrial park in Anhui Province [32]202140.613.96.46.63.110.7
An electronics product manufacturing industrial park in Beijing City [33]202372.727.07.32.313.47.315.3
A chemical industrial park in Hubei Province [9]202155.317.05.14.518.33.56.7
A chemical industrial park in Shandong Province [34]2021189.199.042.4-10.012.823.6
A fine chemical industrial park in Zhejiang Province [21]2018381.982.97.63.5146.167.974.5
A coal chemical industrial park in Shanxi Province [20]202189.319.17.31.513.94.243.1
Table 2. Top ten VOCs species across four seasons from 2018 to 2019.
YearOrderSpringSummerAutumnWinter
SpeciesppbSpeciesppbSpeciesppbSpeciesppb
201811,2-Dichloroethane72.2Dichloromethane99.3Dichloromethane48.4Dichloromethane37.7
2Toluene62.0Acetone54.6Toluene34.2Toluene26.9
3Dichloromethane57.6Toluene52.5Acetonitrile28.3Acetone20.0
4Acetone52.3Acetonitrile44.81,2-dichloroethane28.01,2-dichloroethane15.8
52-Methylpentane28.42-Methylpentane42.6Acetone26.2Freon 117.1
6Cyclohexane22.21,2-Dichloroethane40.92-Methylpentane9.0Ethane7.1
7Acetonitrile16.1Cyclohexane16.5Ethyl chloride8.3Ethyl chloride6.1
82,3-Dimethylpentane11.92,3-Dimethylpentane10.3m/p-Xylene8.1Propane6.0
9Ethyl chloride10.1Freon 117.1Freon 1137.8Acetonitrile5.1
10Freon 118.0m/p-Xylene6.8Chloroform6.7m/p-Xylene4.8
201911,2-Dichloroethane58.11,2-Dichloroethane46.3Toluene61.6Toluene25.0
2Toluene32.5Toluene36.3Freon 1127.21,2-Dichloroethane21.6
3Acetone18.7Acetone28.91,2-Dichloroethane27.0Acetonitrile17.6
4Dichloromethane15.5Dichloromethane23.8m/p-Xylene24.7Dichloromethane14.6
5Acetonitrile14.8Acetonitrile18.0Acetonitrile20.0Chloroform12.3
6Cyclohexane11.6Cyclohexane14.89Acetone19.8Acetone10.4
72,3-Dimethylpentane7.72,3-Dimethylpentane10.2Dichloromethane9.7Ethyl chloride7.1
8Chloroform6.4Freon 118.71,3-Dichlorobenzene9.4Ethane6.7
9MTBE6.1MTBE7.3Ethylbenzene8.5Propane6.6
10m/p-Xylene5.7Ethyl chloride5.9Ethyl chloride8.1m/p-Xylene6.6
Table 3. Top 10 VOCs species ranked by OFP across seasons from 2018 to 2019.
YearOrderSpringSummerAutumnWinter
Speciesμg/m3Speciesμg/m3Speciesμg/m3Speciesμg/m3
20181Toluene1359.1Toluene1149.4Toluene748.5Toluene588.5
2m/p-Xylene269.7m/p-Xylene283.5m/p-Xylene341.1m/p-Xylene202.7
32-Methylpentane168.42-Methylpentane252.0Ethylbenzene138.3Ethylbenzene137.2
4Cyclohexane129.3Cyclohexane96.1o-Xylene131.4o-Xylene66.5
5Ethylbenzene121.1Ethylbenzene89.71,3,5-Trimethylbenzene70.7Ethylene39.9
6o-Xylene82.0o-Xylene85.61,2,4-Trimethylbenzene56.81,2,4-Trimethylbenzene34.4
72,3-Dimethylpentane73.22,3-Dimethylpentane63.22-Methylpentane51.82-Methylpentane24.8
8Acetone48.8Acetone50.91,3-Butadiene43.9Cyclohexane24.3
9Hexanal44.8Isoprene41.3Hexanal36.9Propylene21.1
101,2,4-Trimethylbenzene42.61,2,4-Trimethylbenzene37.5Pentanal36.11,2,3-Trimethylbenzene20.0
20191Toluene712.4Toluene794.7Toluene1350.3Toluene547.6
2m/p-Xylene239.3m/p-Xylene233.0m/p-Xylene1033.8m/p-Xylene277.5
3Ethylbenzene100.9Ethylbenzene86.5o-Xylene334.3o-Xylene87.4
4o-Xylene76.8Cyclohexane86.3Ethylbenzene308.3Ethylbenzene82.5
5Cyclohexane67.5o-Xylene77.81,2,4-Trimethylbenzene84.6Trichlorethylene45.0
62,3-Dimethylpentane47.72,3-Dimethylpentane62.71,2,3-Trimethylbenzene58.2Ethylene35.5
7Trichlorethylene43.3Trans-2-butene42.81,3,5-Trimethylbenzene57.1Propylene25.2
81,2,4-Trimethylbenzene32.7Trichlorethylene32.53-Ethyltoluene47.91,2,4-Trimethylbenzene23.8
9Ethylene28.71,2,4-Trimethylbenzene30.71,4-Diethylbenzene47.5Benzene19.4
10Trans-2-butene28.2Ethyl Chloride30.0Trichlorethylene45.91,3,5-Trimethylbenzene13.9
Disclaimer/Publisher’s Note: The statements, opinions and data contained in all publications are solely those of the individual author(s) and contributor(s) and not of MDPI and/or the editor(s). MDPI and/or the editor(s) disclaim responsibility for any injury to people or property resulting from any ideas, methods, instructions or products referred to in the content.

