
Temporal Trends and Meteorological Associations of Particulate Matter and Gaseous Air Pollutants in Tehran, Iran (2017–2021)


Abstract
1. Introduction
2. Method
3. Results and Discussion
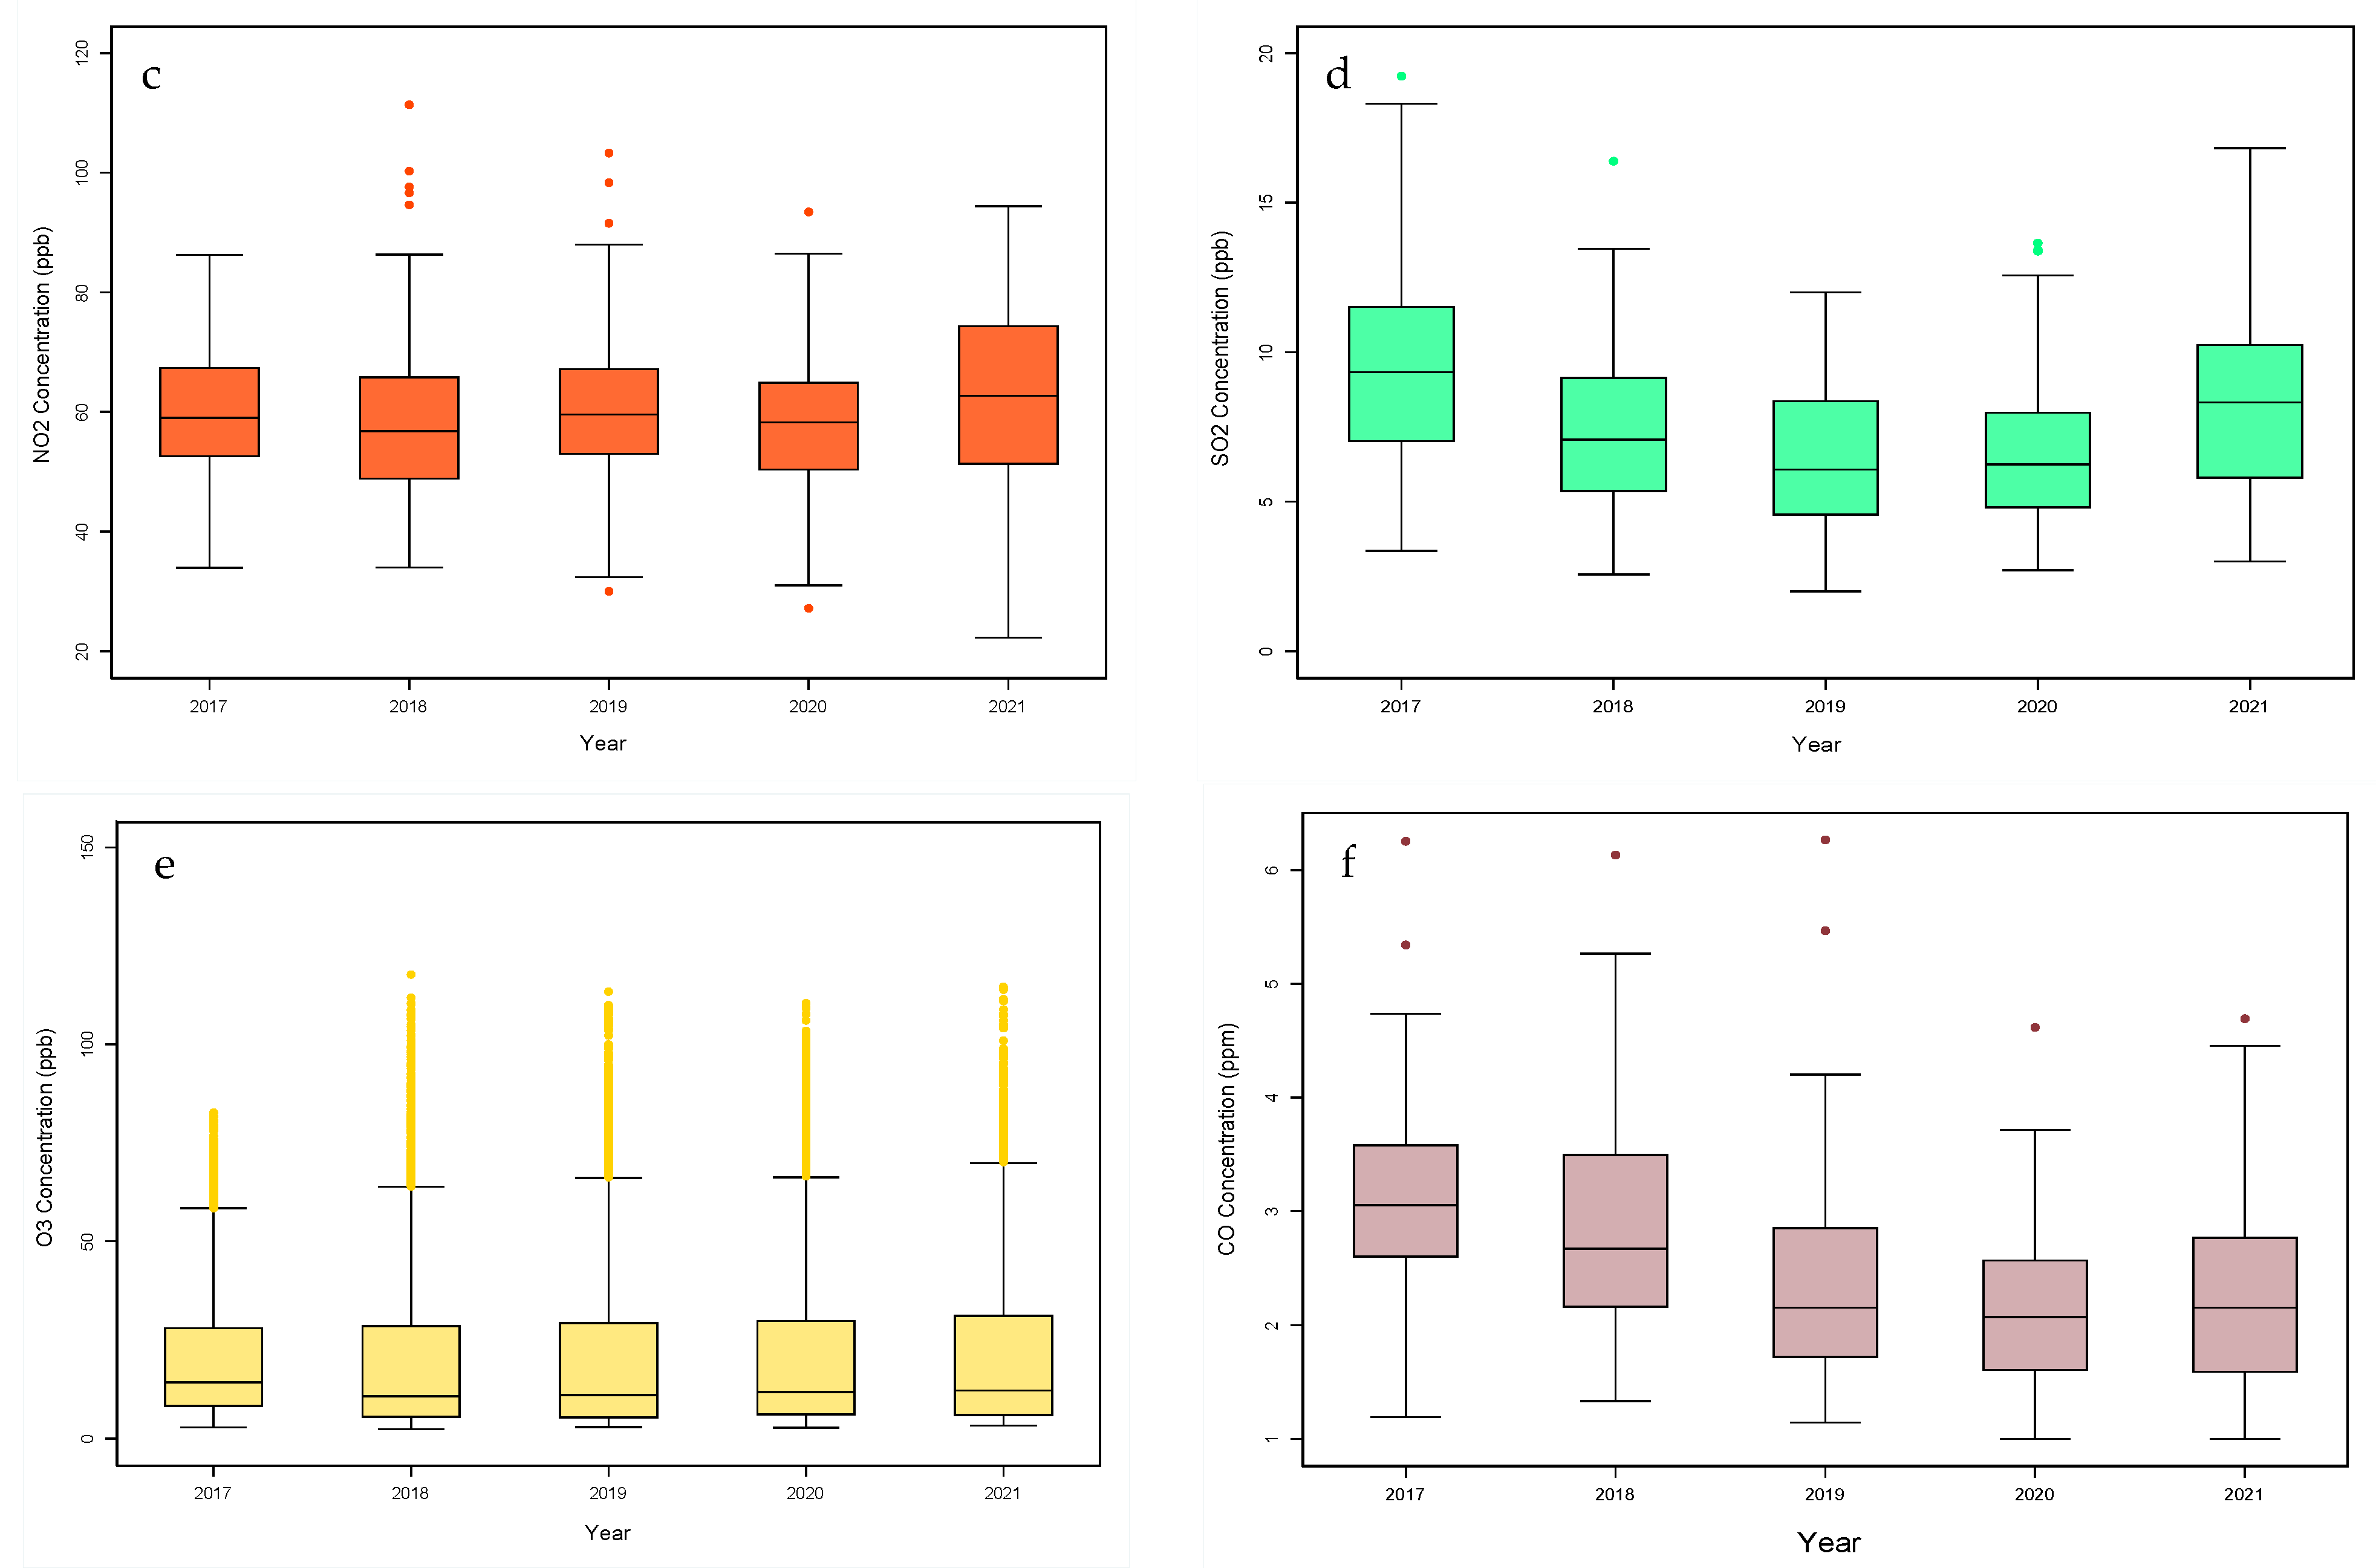
3.1. Temporal Trends of Air Pollutants
- Annual trends
- Seasonal and monthly trends
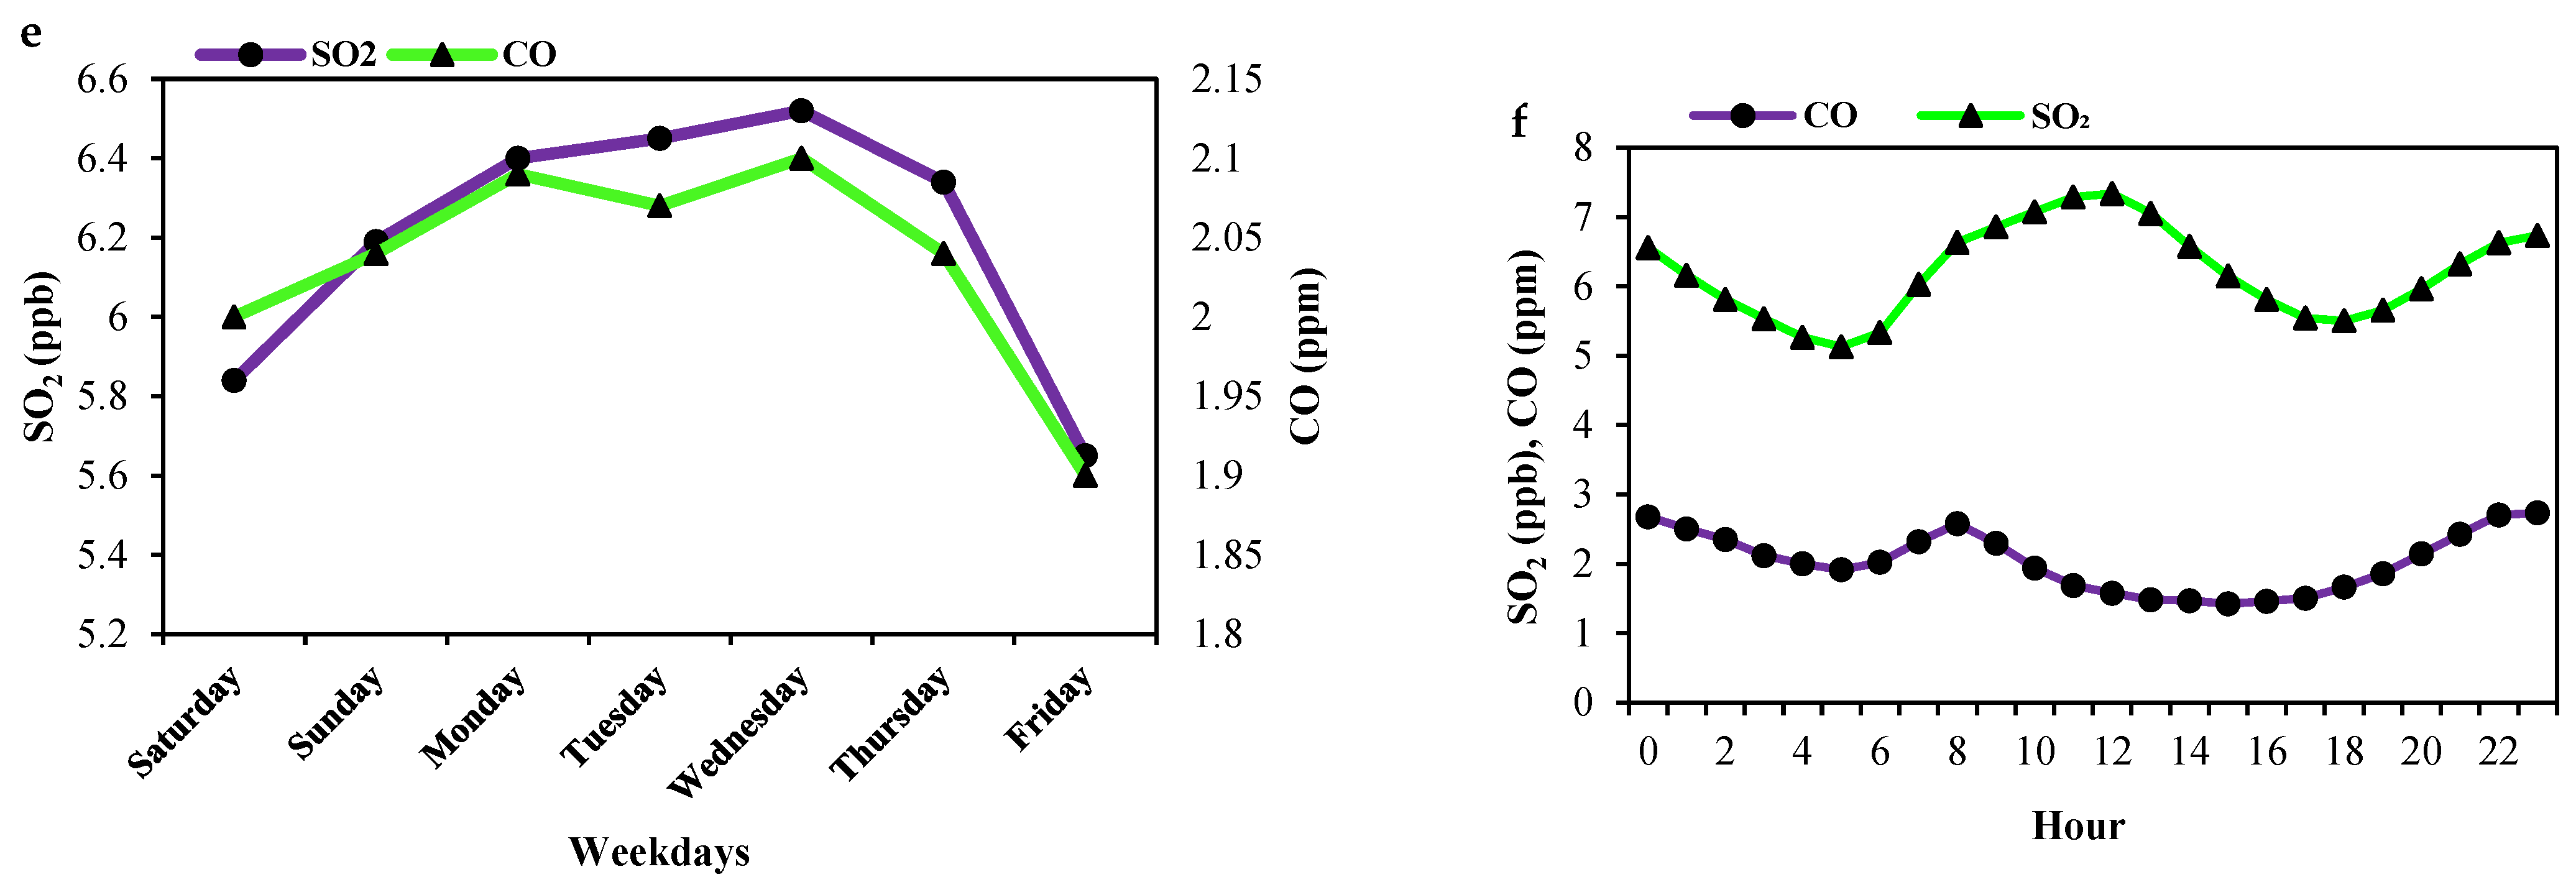
- Daily and hourly trends
- AQI and responsible air pollutants
3.2. The Association Between Six Criteria Air Pollutants and MPs
4. Conclusions
Supplementary Materials
Author Contributions
Funding
Institutional Review Board Statement
Informed Consent Statement
Data Availability Statement
Conflicts of Interest
References
- Abdul Jabbar, S.; Tul Qadar, L.; Ghafoor, S.; Rasheed, L.; Sarfraz, Z.; Sarfraz, A.; Sarfraz, M.; Felix, M.; Cherrez-Ojeda, I. Air Quality, Pollution and Sustainability Trends in South Asia: A Population-Based Study. Int. J. Environ. Res. Public Health 2022, 19, 7534. [Google Scholar] [CrossRef] [PubMed]
- Song, C.; Wu, L.; Xie, Y.; He, J.; Chen, X.; Wang, T.; Lin, Y.; Jin, T.; Wang, A.; Liu, Y.; et al. Air pollution in China: Status and spatiotemporal variations. Environ. Pollut. 2017, 227, 334–347. [Google Scholar] [CrossRef] [PubMed]
- Jiang, L.; Bai, L. Spatio-temporal characteristics of urban air pollutions and their causal relationships: Evidence from Beijing and its neighboring cities. Sci. Rep. 2018, 8, 1279. [Google Scholar] [CrossRef] [PubMed]
- Faridi, S.; Shamsipour, M.; Krzyzanowski, M.; Künzli, N.; Amini, H.; Azimi, F.; Malkawi, M.; Momeniha, F.; Gholampour, A.; Hassanvand, M.S.; et al. Long-term trends and health impact of PM2.5 and O3 in Tehran, Iran, 2006–2015. Environ. Int. 2018, 114, 37–49. [Google Scholar] [CrossRef]
- Zheng, S.; Cao, C.-X.; Singh, R.P. Comparison of ground based indices (API and AQI) with satellite based aerosol products. Sci. Total Environ. 2014, 488, 398–412. [Google Scholar] [CrossRef]
- Abbasi, M.T.; Alesheikh, A.A.; Jafari, A.; Lotfata, A. Spatial and temporal patterns of urban air pollution in tehran with a focus on PM2.5 and associated pollutants. Sci. Rep. 2024, 14, 25150. [Google Scholar] [CrossRef]
- Brumberg, H.L.; Karr, C.J.; Bole, A.; Ahdoot, S.; Balk, S.J.; Bernstein, A.S.; Byron, L.G.; Landrigan, P.J.; Marcus, S.M.; Nerlinger, A.L.; et al. Ambient air pollution: Health hazards to children. Pediatrics 2021, 147, e2021051484. [Google Scholar] [CrossRef]
- Barzeghar, V.; Sarbakhsh, P.; Hassanvand, M.S.; Faridi, S.; Gholampour, A. Long-term trend of ambient air PM10, PM2.5, and O3 and their health effects in Tabriz city, Iran, during 2006–2017. Sustain. Cities Soc. 2020, 54, 101988. [Google Scholar] [CrossRef]
- Goudarzi, G.; Shirmardi, M.; Naimabadi, A.; Ghadiri, A.; Sajedifar, J. Chemical and organic characteristics of PM2. 5 particles and their in-vitro cytotoxic effects on lung cells: The Middle East dust storms in Ahvaz, Iran. Sci. Total Environ. 2019, 655, 434–445. [Google Scholar] [CrossRef]
- Taghizadeh, F.; Mokhtarani, B.; Rahmanian, N. Air pollution in Iran: The current status and potential solutions. Environ. Monit. Assess. 2023, 195, 737. [Google Scholar] [CrossRef]
- Yousefian, F.; Faridi, S.; Azimi, F.; Aghaei, M.; Shamsipour, M.; Yaghmaeian, K.; Hassanvand, M.S. Temporal variations of ambient air pollutants and meteorological influences on their concentrations in Tehran during 2012–2017. Sci. Rep. 2020, 10, 292. [Google Scholar] [CrossRef] [PubMed]
- Amini, H.; Hosseini, V.; Schindler, C.; Hassankhany, H.; Yunesian, M.; Henderson, S.B.; Künzli, N. Spatiotemporal description of BTEX volatile organic compounds in a Middle Eastern megacity: Tehran study of exposure prediction for environmental health research (Tehran SEPEHR). Environ. Pollut. 2017, 226, 219–229. [Google Scholar] [CrossRef] [PubMed]
- Taghvaee, S.; Sowlat, M.H.; Mousavi, A.; Hassanvand, M.S.; Yunesian, M.; Naddafi, K.; Sioutas, C. Source apportionment of ambient PM2.5 in two locations in central Tehran using the Positive Matrix Factorization (PMF) model. Sci. Total Environ. 2018, 628, 672–686. [Google Scholar] [CrossRef] [PubMed]
- Shamsipour, M.; Hassanvand, M.S.; Gohari, K.; Yunesian, M.; Fotouhi, A.; Naddafi, K.; Sheidaei, A.; Faridi, S.; Akhlaghi, A.A.; Rabiei, K.; et al. National and sub-national exposure to ambient fine particulate matter (PM2.5) and its attributable burden of disease in Iran from 1990 to 2016. Environ. Pollut. 2019, 255, 113173. [Google Scholar] [CrossRef]
- Javanbakht, M.; Boloorani, A.D.; Kiavarz, M.; Samany, N.N.; Zebardast, L.; Zangiabadi, M. Spatial-temporal analysis of urban environmental quality of Tehran, Iran. Ecol. Indic. 2021, 120, 106901. [Google Scholar] [CrossRef]
- Alizadeh-Choobari, O.; Bidokhti, A.; Ghafarian, P.; Najafi, M. Temporal and spatial variations of particulate matter and gaseous pollutants in the urban area of Tehran. Atmos. Environ. 2016, 141, 443–453. [Google Scholar] [CrossRef]
- Khoshakhlagh, A.H.; Mohammadzadeh, M.; Morais, S. Air quality in Tehran, Iran: Spatio-temporal characteristics, human health effects, economic costs and recommendations for good practice. Atmos. Environ. X 2023, 19, 100222. [Google Scholar] [CrossRef]
- Ranjbar, M.; Bahak, B. Temporal-spatial changes of air pollutants using GIS (case study, northern half of Tehran). Geogr. Q. 2019, 17, 72–85. [Google Scholar]
- Jafarigol, F.; Yousefi, S.; Omrani, A.D.; Rashidi, Y.; Buonanno, G.; Stabile, L.; Sabanov, S.; Torkmahalleh, M.A. The relative contributions of traffic and non-traffic sources in ultrafine particle formations in Tehran mega city. Sci. Rep. 2024, 14, 10399. [Google Scholar]
- US Environmental Protection Agency. Technical Assistance Document for the Reporting of Daily Air Quality—The Air Quality Index (AQI); US Environmental Protection Agency Office of Air Quality Planning and Standards Air Quality Assessment Division Research Triangle Park: Durham, NC, USA, 2018. [Google Scholar]
- Agency USEP. Technical Assistance Document for the Reporting of Daily Air Quality—The Air Quality Index (AQI); [Internet]. AirNow; U.S. Environmental Protection Agency: Washington, DC, USA, 2024. Available online: https://www.airnow.gov/publications/air-quality-index/technical-assistance-document-for-reporting-the-daily-aqi/ (accessed on 23 May 2025).
- Faridi, S.; Krzyzanowski, M.; Cohen, A.J.; Malkawi, M.; Moh’d Safi, H.A.; Yousefian, F.; Azimi, F.; Naddafi, K.; Momeniha, F.; Niazi, S.; et al. Ambient air quality standards and policies in eastern mediterranean countries: A review. Int. J. Public health 2023, 68, 1605352. [Google Scholar] [CrossRef]
- World Health Organization. WHO Global Air Quality Guidelines: Particulate Matter (PM2. 5 and PM10), Ozone, Nitrogen Dioxide, Sulfur Dioxide and Carbon Monoxide; World Health Organization: Geneva, Switzerland, 2021. [Google Scholar]
- Agency USEP. National Ambient Air Quality Standards (NAAQS) Table; U.S. EPA: Washington, DC, USA, 2023. Available online: https://www.epa.gov/criteria-air-pollutants/naaqs-table (accessed on 23 May 2025).
- Faridi, S.; Yousefian, F.; Niazi, S.; Ghalhari, M.R.; Hassanvand, M.S.; Naddafi, K. Impact of SARS-CoV-2 on Ambient Air Particulate Matter in Tehran. Aerosol Air Qual. Res. 2020, 20, 1805–1811. [Google Scholar] [CrossRef]
- Faridi, S.; Yousefian, F.; Janjani, H.; Niazi, S.; Azimi, F.; Naddafi, K.; Hassanvand, M.S. The effect of COVID-19 pandemic on human mobility and ambient air quality around the world: A systematic review. Urban Clim. 2021, 38, 100888. [Google Scholar] [CrossRef] [PubMed]
- Gharibvand, L.K.; Jamali, A.A.; Amiri, F. Changes in NO2 and O3 levels due to the pandemic lockdown in the industrial cities of Tehran and Arak, Iran using Sentinel 5P images, Google Earth Engine (GEE) and statistical analysis. Stoch. Environ. Res. Risk Assess. 2023, 37, 2023–2034. [Google Scholar] [CrossRef] [PubMed]
- Ali-Taleshi, M.S.; Riyahi Bakhtiari, A.; Hopke, P.K. Particulate and gaseous pollutants in Tehran, Iran during 2015–2021: Factors governing their variability. Sustain. Cities Soc. 2022, 87, 104183. [Google Scholar] [CrossRef]
- Arhami, M.; Hosseini, V.; Shahne, M.Z.; Bigdeli, M.; Lai, A.; Schauer, J.J. Seasonal trends, chemical speciation and source apportionment of fine PM in Tehran. Atmos. Environ. 2017, 153, 70–82. [Google Scholar] [CrossRef]
- Hassanvand, M.S.; Naddafi, K.; Faridi, S.; Arhami, M.; Nabizadeh, R.; Sowlat, M.H.; Pourpak, Z.; Rastkari, N.; Momeniha, F.; Kashani, H.; et al. Indoor/outdoor relationships of PM10, PM2.5, and PM1 mass concentrations and their water-soluble ions in a retirement home and a school dormitory. Atmos. Environ. 2014, 82, 375–382. [Google Scholar] [CrossRef]
- Givehchi, R.; Arhami, M.; Tajrishy, M. Contribution of the Middle Eastern dust source areas to PM10 levels in urban receptors: Case study of Tehran, Iran. Atmos. Environ. 2013, 75, 287–295. [Google Scholar] [CrossRef]
- Sotoudeheian, S.; Salim, R.; Arhami, M. Impact of Middle Eastern dust sources on PM10 in Iran: Highlighting the impact of Tigris-Euphrates basin sources and Lake Urmia desiccation. J. Geophys. Res. Atmos. 2016, 121, 14–018. [Google Scholar] [CrossRef]
- Goudie, A.S. Desert dust and human health disorders. Environ. Int. 2014, 63, 101–113. [Google Scholar] [CrossRef]
- Hayashida, S.; Kajino, M.; Deushi, M.; Sekiyama, T.T.; Liu, X. Seasonality of the lower tropospheric ozone over China observed by the Ozone Monitoring Instrument. Atmos. Environ. 2018, 184, 244–253. [Google Scholar] [CrossRef]
- Chen, Z.; Zhuang, Y.; Xie, X.; Chen, D.; Cheng, N.; Yang, L.; Li, R. Understanding long-term variations of meteorological influences on ground ozone concentrations in Beijing During 2006–2016. Environ. Pollut. 2019, 245, 29–37. [Google Scholar] [CrossRef] [PubMed]
- Squizzato, S.; Masiol, M.; Rich, D.Q.; Hopke, P.K. PM2.5 and gaseous pollutants in New York State during 2005–2016: Spatial variability, temporal trends, and economic influences. Atmos. Environ. 2018, 183, 209–224. [Google Scholar] [CrossRef]
- Heger, M.; Sarraf, M. Air Pollution in Tehran: Health Costs, Sources, and Policies; World Bank: Washington, DC, USA, 2018. [Google Scholar]
- Han, L.; Qi, Y. Characterization of Spatial and Temporal Variations in Air Pollutants and Identification of Health Risks in Xi’an, a Heavily Polluted City in China. Atmosphere 2024, 15, 716. [Google Scholar] [CrossRef]
- Soni, P.S.; Singh, V.; Gautam, A.S.; Singh, K.; Sharma, M.; Singh, R.; Singh, S.P.; Kumar, S.; Gautam, S. Temporal dynamics of urban air pollutants and their correlation with associated MPs: An investigation in northern Indian cities. Environ. Monit. Assess. 2024, 196, 505. [Google Scholar] [CrossRef]
- Deng, C.; Qin, C.; Li, Z.; Li, K. Spatiotemporal variations of PM2. 5 pollution and its dynamic relationships with meteorological conditions in Beijing-Tianjin-Hebei region. Chemosphere 2022, 301, 134640. [Google Scholar] [CrossRef]
- Chang, Y.; Li, G.; Zhang, P.; Liu, Y.; Chen, Z.; Xing, G.; Li, M. Relationships among six urban air pollutants and identification of pollution types–A case study of Chinese cities above prefecture level. Atmos. Pollut. Res. 2024, 15, 102160. [Google Scholar] [CrossRef]
- Hassanpour Matikolaei, S.A.H.; Jamshidi, H.; Samimi, A. Characterizing the effect of traffic density on ambient CO, NO2, and PM2.5 in Tehran, Iran: An hourly land-use regression model. Transp. Lett. 2019, 11, 436–446. [Google Scholar] [CrossRef]
- Maleki, H.; Sorooshian, A.; Goudarzi, G.; Nikfal, A.; Baneshi, M.M. Temporal profile of PM10 and associated health effects in one of the most polluted cities of the world (Ahvaz, Iran) between 2009 and 2014. Aeolian Res. 2016, 22, 135–140. [Google Scholar] [CrossRef]
- Ali-Taleshi, M.S.; Riyahi Bakhtiari, A.; Masiol, M. The possible emission sources and atmospheric photochemical processes of air pollutants in Tehran, Iran: The role of micrometeorological factors on the air quality. Air Qual. Atmos. Health 2024, 17, 525–539. [Google Scholar] [CrossRef]
- Sisipoor, M.; Rahnama, M.; Sehat Kashani, S.; Khodam, N.; Noori, F.; Qahramani, S. Study of atmospheric pollutants concentration correlation with meteorological quantities in Bandar Abbas. Nivar 2024, 48, 146–162. [Google Scholar]
- Hu, C.; Kang, P.; Jaffe, D.A.; Li, C.; Zhang, X.; Wu, K.; Zhou, M. Understanding the impact of meteorology on ozone in 334 cities of China. Atmos. Environ. 2021, 248, 118221. [Google Scholar] [CrossRef]
- Mousavinezhad, S.; Choi, Y.; Pouyaei, A.; Ghahremanloo, M.; Nelson, D.L. A comprehensive investigation of surface ozone pollution in China, 2015–2019: Separating the contributions from meteorology and precursor emissions. Atmos. Res. 2021, 257, 105599. [Google Scholar] [CrossRef]
- Kaffashzadeh, N.; Solmon, F.; Shahbazi, H.; Bidokhti, A.-A.A. Trend analysis of measured surface ozone at the megacity of Tehran for the summertime 2007–2021. Atmos. Environ. 2024, 321, 120289. [Google Scholar] [CrossRef]


| PM2.5 | PM10 | O3 | NO2 | SO2 | CO | Temp 1 | RH 2 | WS 3 | Visib 4 | |
| PM2.5 | 1 | |||||||||
| PM10 | 0.81 * | 1 | ||||||||
| O3 | −0.37 * | 0.21 * | 1 | |||||||
| NO2 | 0.61 * | 0.45 * | 0.62 * | 1 | ||||||
| SO2 | 0.58 * | 0.48 * | −0.34 * | 0.62 * | 1 | |||||
| CO | 0.48 * | 0.42 * | −0.55 * | 0.68 * | 0.52 * | 1 | ||||
| Temp | −0.16 * | 0.10 * | 0.55 * | −0.32 * | −0.25 * | −0.15 | 1 | |||
| HR | −0.13 * | −0.11 * | −0.44 * | 0.17 * | 0.05 * | 0.08 * | 0.69 * | 1 | ||
| WS | −0.45 * | −0.22 * | 0.33 * | −0.32 * | −0.19 * | −0.30 * | 0.44 * | −0.38 * | 1 | |
| Visib | −0.23 * | −0.14 * | 0.31 * | −0.30 * | −0.20 * | −0.24 * | 0.22 * | −0.18 * | 0.17 * | 1 |
Disclaimer/Publisher’s Note: The statements, opinions and data contained in all publications are solely those of the individual author(s) and contributor(s) and not of MDPI and/or the editor(s). MDPI and/or the editor(s) disclaim responsibility for any injury to people or property resulting from any ideas, methods, instructions or products referred to in the content. |
© 2025 by the authors. Licensee MDPI, Basel, Switzerland. This article is an open access article distributed under the terms and conditions of the Creative Commons Attribution (CC BY) license (https://creativecommons.org/licenses/by/4.0/).
Share and Cite
Yousefian, F.; Afzali Borujeni, Z.; Akbarzadeh, F.; Mostafaii, G. Temporal Trends and Meteorological Associations of Particulate Matter and Gaseous Air Pollutants in Tehran, Iran (2017–2021). Atmosphere 2025, 16, 683. https://doi.org/10.3390/atmos16060683
Yousefian F, Afzali Borujeni Z, Akbarzadeh F, Mostafaii G. Temporal Trends and Meteorological Associations of Particulate Matter and Gaseous Air Pollutants in Tehran, Iran (2017–2021). Atmosphere. 2025; 16(6):683. https://doi.org/10.3390/atmos16060683
Chicago/Turabian StyleYousefian, Fatemeh, Zohreh Afzali Borujeni, Fatemeh Akbarzadeh, and Gholamreza Mostafaii. 2025. "Temporal Trends and Meteorological Associations of Particulate Matter and Gaseous Air Pollutants in Tehran, Iran (2017–2021)" Atmosphere 16, no. 6: 683. https://doi.org/10.3390/atmos16060683
APA StyleYousefian, F., Afzali Borujeni, Z., Akbarzadeh, F., & Mostafaii, G. (2025). Temporal Trends and Meteorological Associations of Particulate Matter and Gaseous Air Pollutants in Tehran, Iran (2017–2021). Atmosphere, 16(6), 683. https://doi.org/10.3390/atmos16060683