1. Introduction
Strong winds associated with tropical cyclones may affect the operations of landing aircraft. The most important factors include strong crosswinds, fluctuations in crosswinds, and low-level windshear/turbulence at the airport caused by cyclones. At Hong Kong International Airport (HKIA), aircraft operations are affected when winds cross the runway, which, in the case of tropical cyclones, can be highly turbulent, combined with the inherent turbulent flow associated with the atmospheric boundary layer of the tropical cyclone. The forecasting of such turbulent flow has been attempted at HKIA, e.g., using numerical weather prediction (NWP) models with high spatial resolutions (in the order of 40 m to 200 m).
The available aircraft data and the relevant meteorological observations are analyzed and compared with the results of an NWP simulation at a spatial resolution of 200 m to determine the reasons for the missed approach. In particular, apart from the turbulent flow associated with the atmospheric boundary layer of the typhoon, there is an extensive area of high ground, with a maximum height of around 270 m above mean sea level, to the east of the airport at a distance of around 14,500 m. The potential effect of the terrain is also studied.
3. Airport Observations and the Missed Approach of the Aircraft
The missed aircraft approach occurred at 09:35 UTC, 31 October 2024. The aircraft had been flying in holding loops near the airport and attempted a landing on the 05R runway of Taoyuan International Airport (i.e., a landing on the eastern runway of the airport, approaching from the southwest). The aircraft aborted the approach, conducted a go-around, and landed later on a second attempt (
Figure 3).
The meteorological reports (METARs) taken at the airport around 09:35 UTC include the following:
2024/10/31 10:00:00 UTC
METAR RCTP 311000Z 08044G58KT 9999 -SHRA FEW010 SCT025 BKN120 27/25
Q0986 WS ALL RWY NOSIG RMK QFF 986.4HPA A2913 RA AMT 0.2MM=
2024/10/31 09:30:00 UTC
METAR RCTP 310930Z 08039G55KT 9999 -SHRA FEW010 SCT025 BKN080 27/25
Q0986 WS ALL RWY NOSIG RMK A2914=
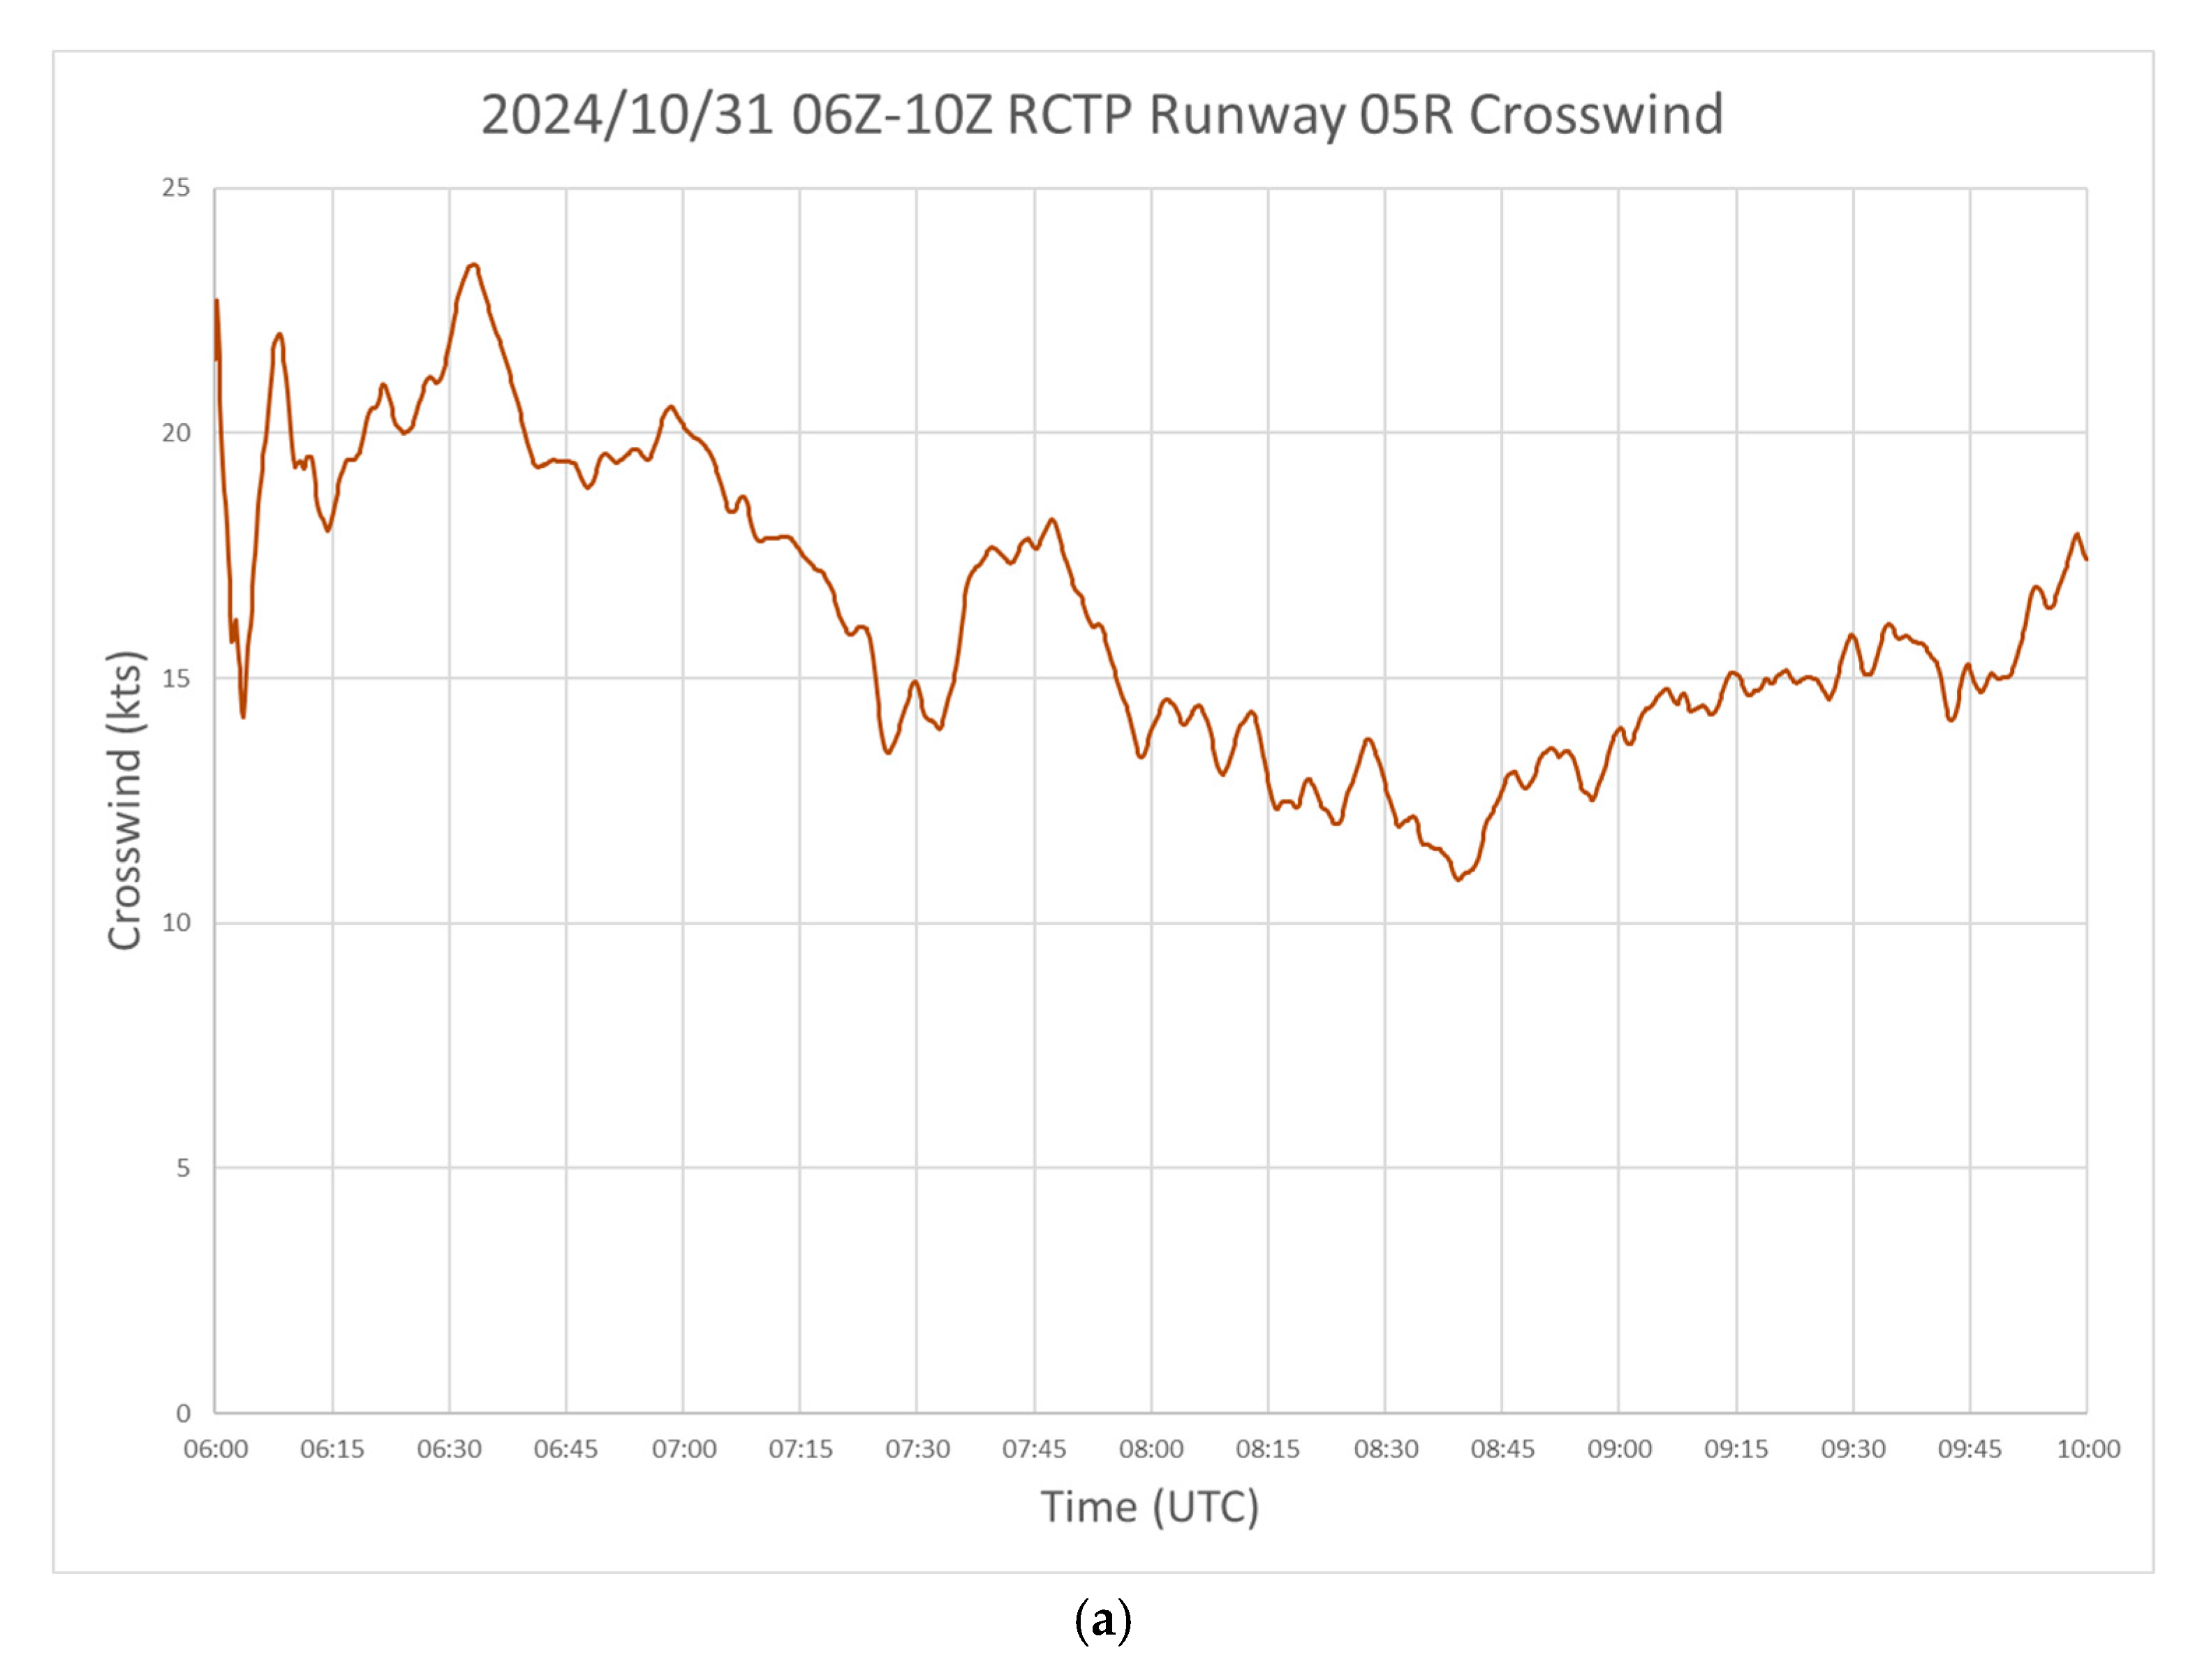
Based on the above, we can see that the mean winds of 39 to 44 knots (around 20 to 22 m/s, 1 knot = 1.852 km/s), with gusts of 55 to 58 knots (around 28 to 30 m/s) and a wind direction of around 80 degrees, have a crosswind component in the order of 20 to 22 knots, and gusts of around 30 knots. The crosswind of 30 knots is approaching the limit of normal operation of the aircraft. Moreover, the difference between the mean wind and the gusts is more than 7 knots, which is considered a significant variation that may require additional intervention from the pilot (the so-called “7-knot criterion” in the Netherlands; Nieuwpoort et al. (2008) [
1]). Crosswinds of such magnitudes and variations may pose a challenge to the safe landing of the aircraft. The missed approach of the aircraft could be partly attributed to the strong crosswind and its fluctuations.
In the literature, there are not many articles covering approaches missed due to significant crosswind and crosswind variations. A study of missed approach has been reported in [
2], but it mainly deals with windshear; namely, headwind changes. The impact of crosswind variations has been reported in [
3]. In particular, apart from the conventional 7-knot criterion, an extended crosswind criterion has been proposed. It is conjectured in [
3] that many aircraft incidents, including missed approaches, may be related to crosswind changes.
As to the terrain effect, the height-to-distance ratio of the terrain to the east is in the order of 270/14500 = 1:54, which is smaller than the ratio of 1:35 for obstructions caused by airport design, as adopted by some authorities around the world (e.g., the Australian Government’s the National Airports Safeguarding Framework, Managing the risk of building generated windshear and turbulence at airports,
https://www.infrastructure.gov.au/sites/default/files/documents/2.2.5-Guideline-B-Windshear.pdf, accessed on 30 May 2025). As such, the terrain’s impact may be considered rather small. The Automatic Dependent Surveillance–Broadcast (ADS-B) data from RadarBox were utilized to calculate the root-mean-square vertical acceleration (RMSVA). The vertical acceleration was approximated by differentiating the vertical rate over a 5 s average gradient, as shown below, where
is vertical acceleration (
),
v is the vertical rate (
) and
t is timestamps (
).
The RMSVA was then calculated by applying a running 5 s windowed root mean square on
. As the vertical rate was not readily available in RadarBox, the vertical rate was obtained by differentiating the altitude. Previous studies have used high-frequency ADS-B data to derive the correlations of RMSVA with the actual turbulence observations made by pilots (Leung and Leung, 2024) [
4].
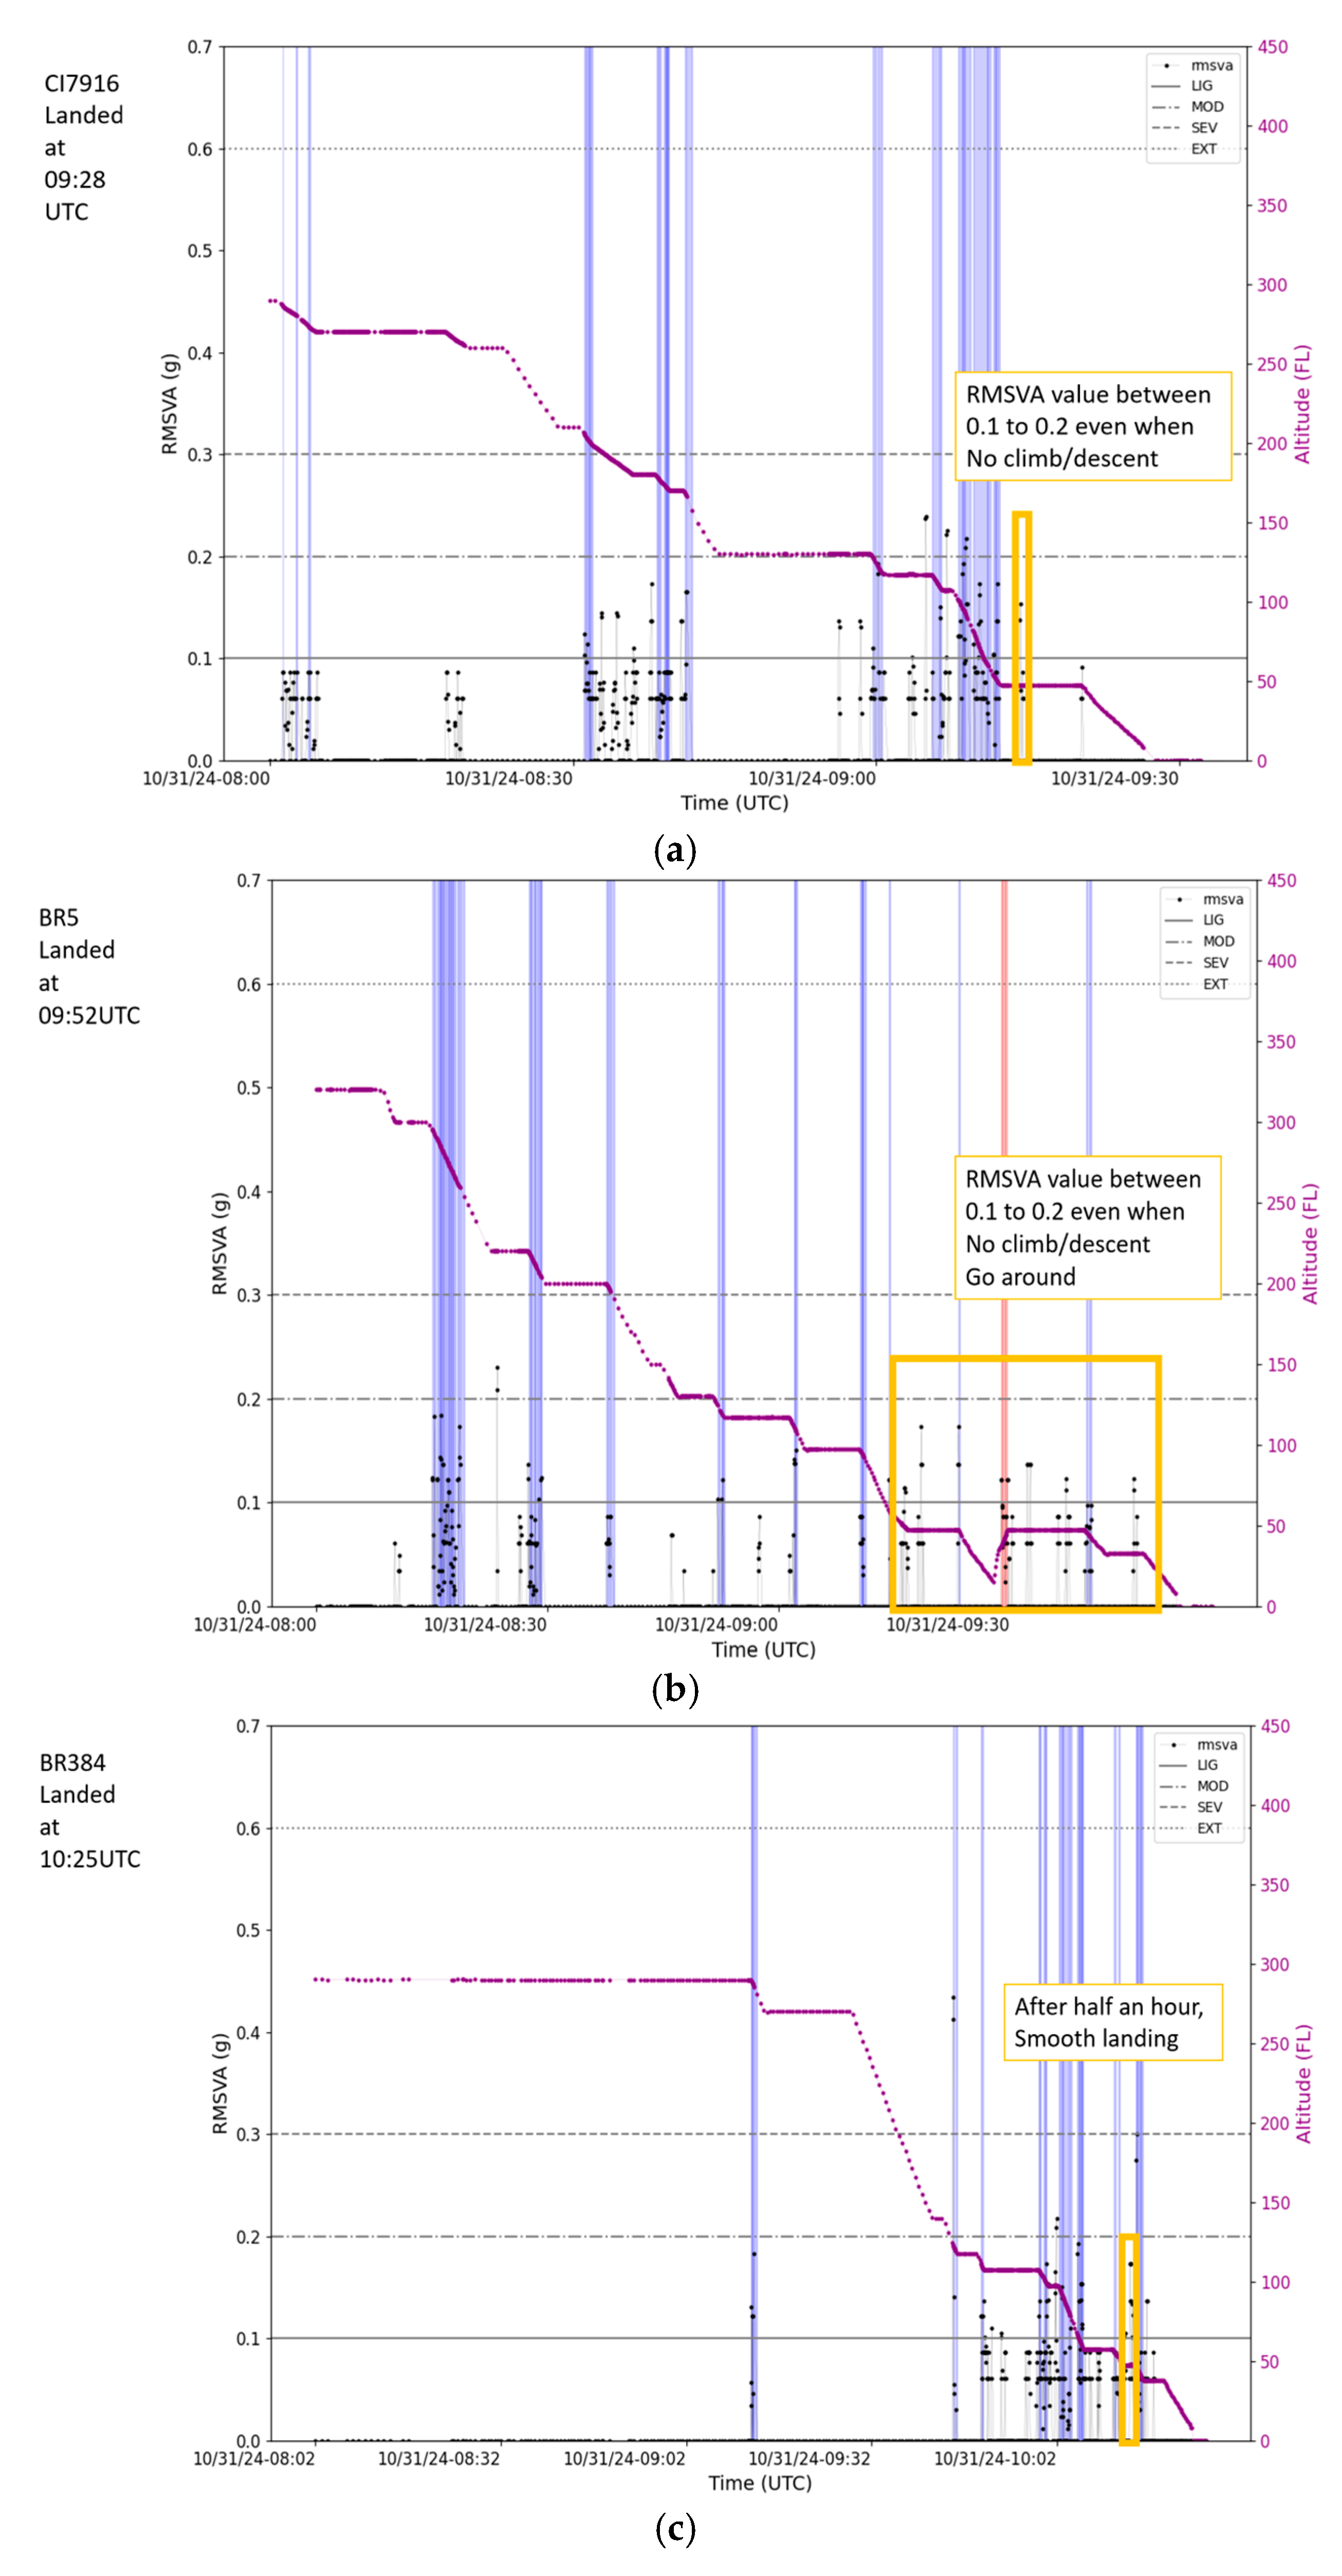
Figure 4 shows the RMSVA calculated for the aircraft under study during its landing phase. When the aircraft was approaching the airport for the first time, the RMSVA was in the order of 0.1 to 0.15 g, which is considered light to moderate turbulence. However, the methodology for calculating RMSVA is mainly applicable to level flight. When the aircraft is landing/descending, maneuvering may affect the accuracy of the RMSVA estimation. These phases are highlighted in
Figure 4, and it can be seen that, apart from these highlighted phases, there are still time instances with RMSVA values of between 0.1 and 0.2. It is also worth noting that the frequency of the flight data is around 0.2 Hz, which is lower than the frequency of 1 Hz derived in the study by Leung and Leung (2024) [
4]. Unfortunately, this is the best dataset we could obtain, as there is no way to obtain the raw aircraft data from the airline.
4. Numerical Model and Simulation Results
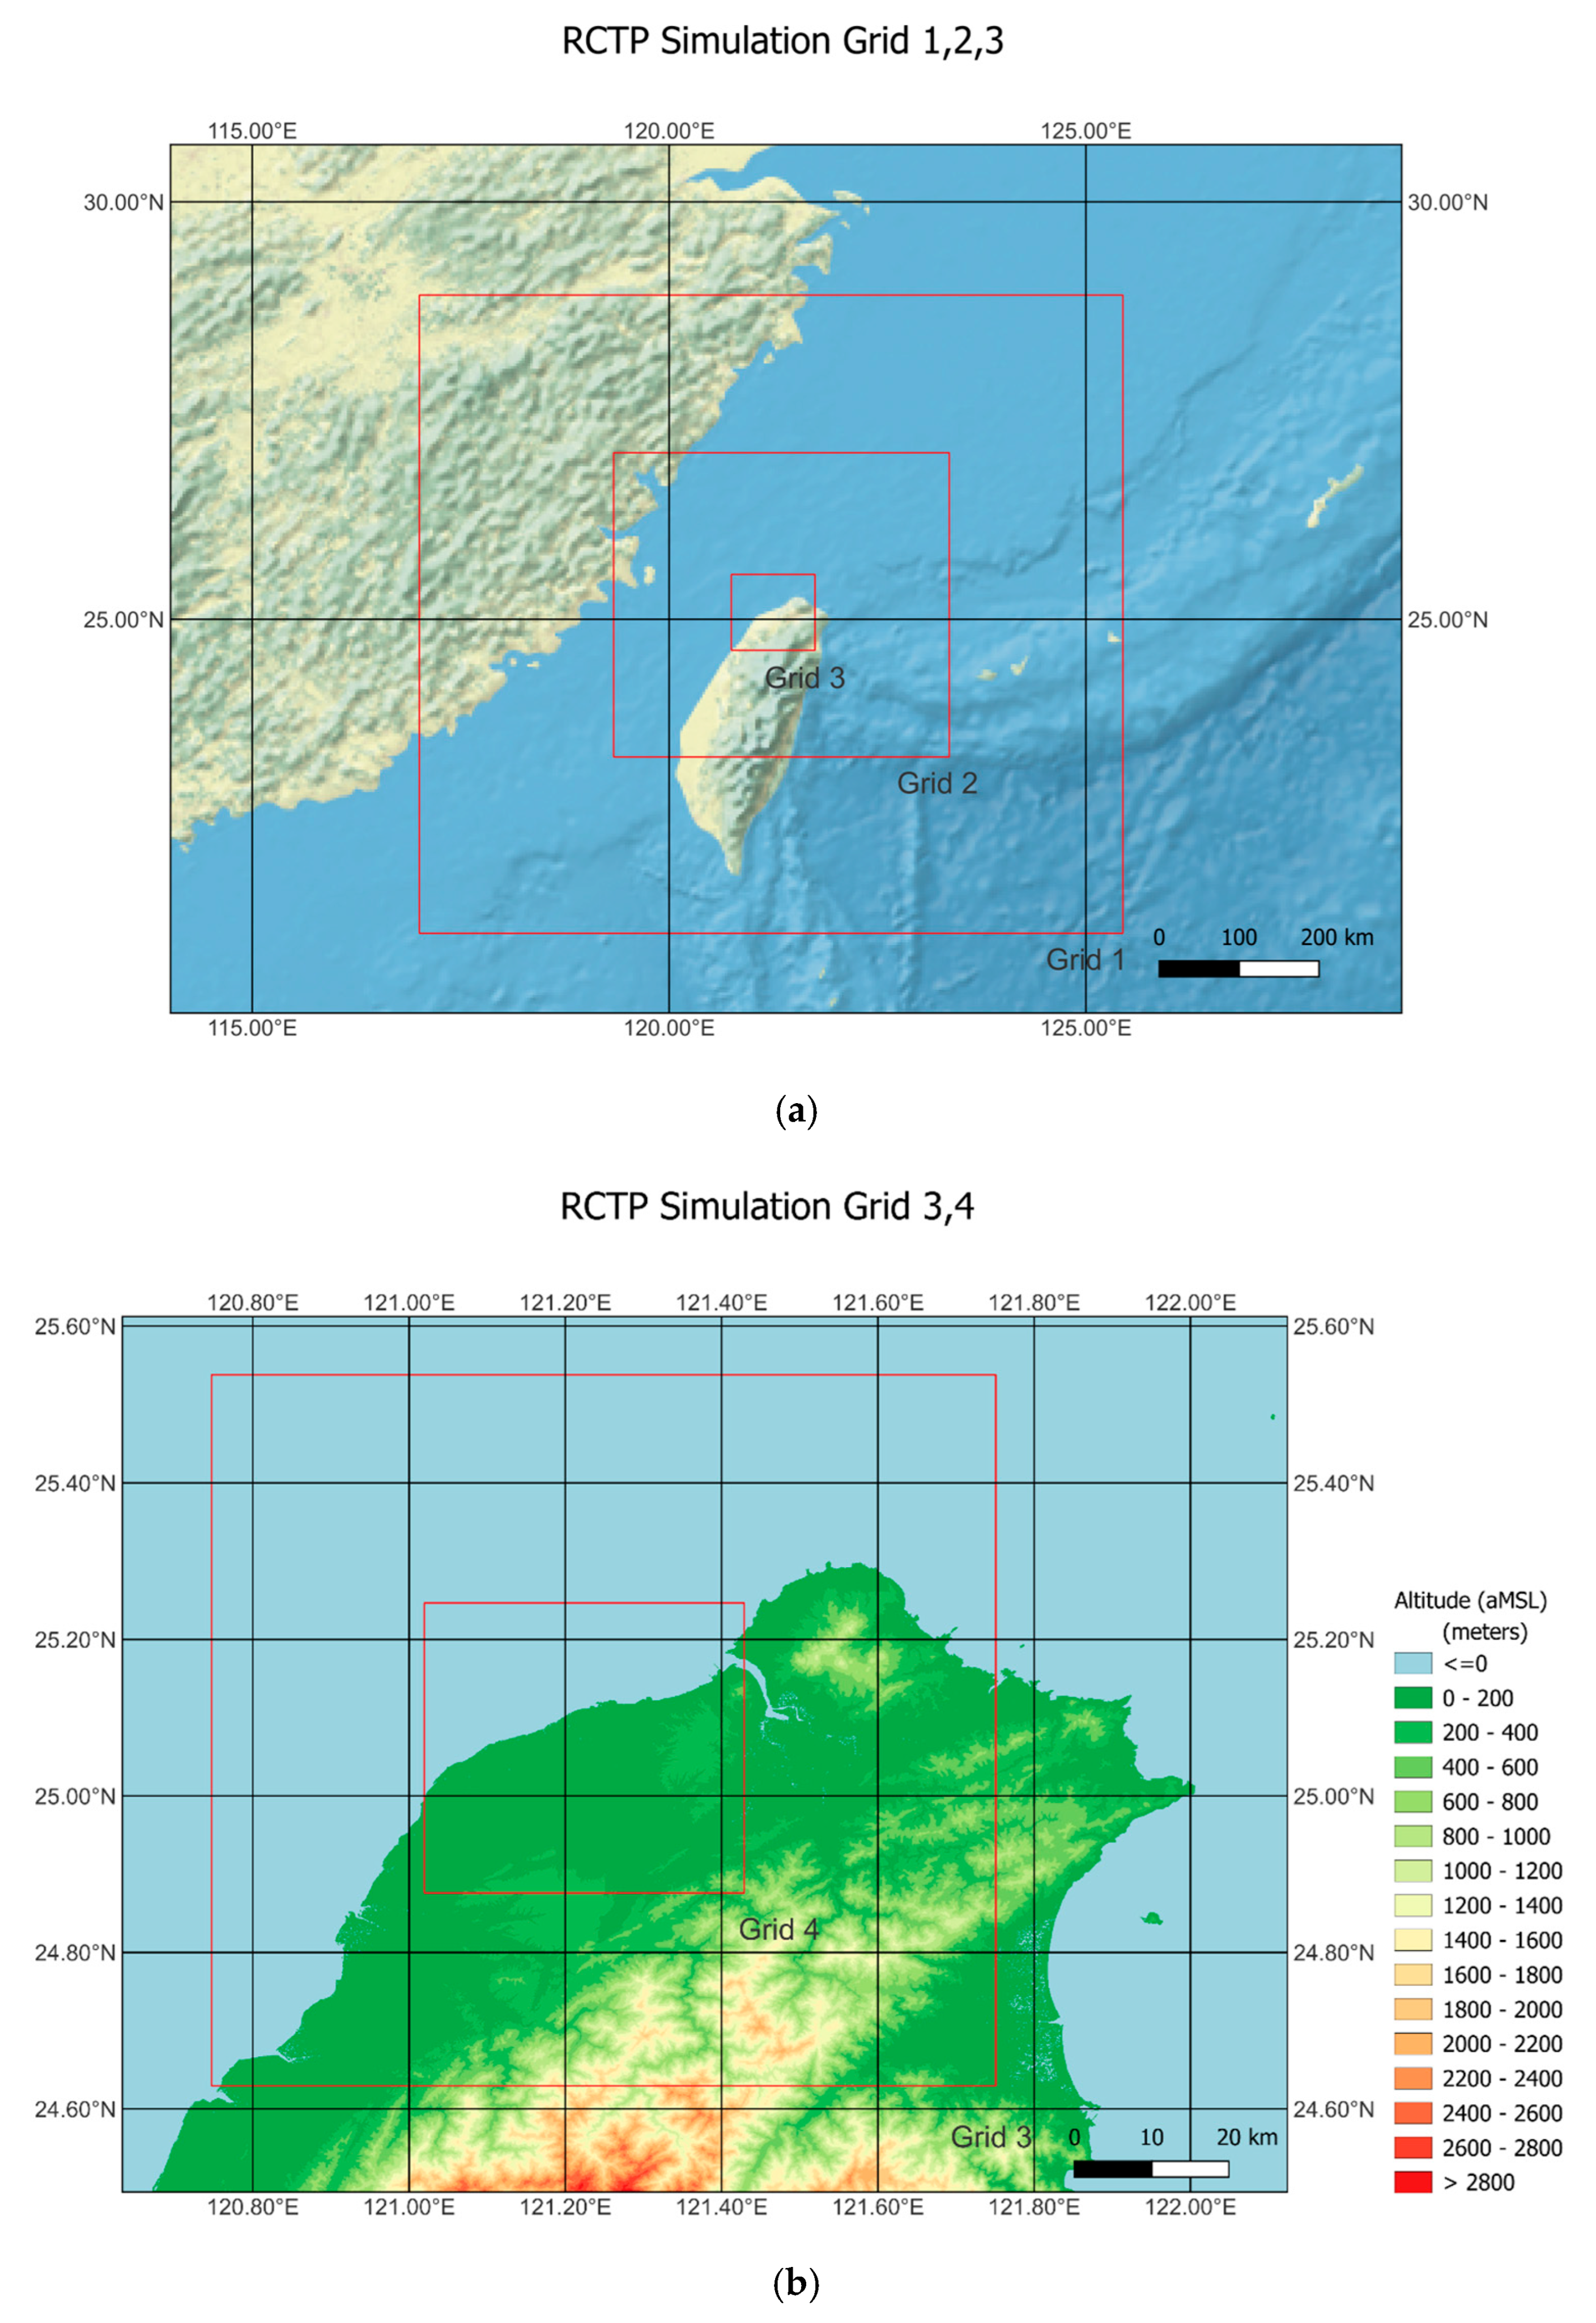
To study the impact of terrain, the simulation method adopted for HKIA (Chan et al., 2021) [
5] is applied to Taoyuan International Airport in this case. Four model domains are used here, with the innermost domain having a spatial resolution of 200 m. The model used is the Regional Atmospheric Modeling System (RAMS) version 6.3, nested with the global NWP model of the National Centers for Environmental Prediction (NCEP). The choice of turbulence parameterization is crucial in the simulation. The Smagorinsky (1963) [
6] scheme is chosen for domains 1 and 2, and the Deardorff (1980) [
7] scheme is chosen for domains 3 and 4. The spatial coverage of the four model domains is shown in
Figure 5a,b. The model was initialized at 06 UTC, 31 October 2024, and run for four hours.
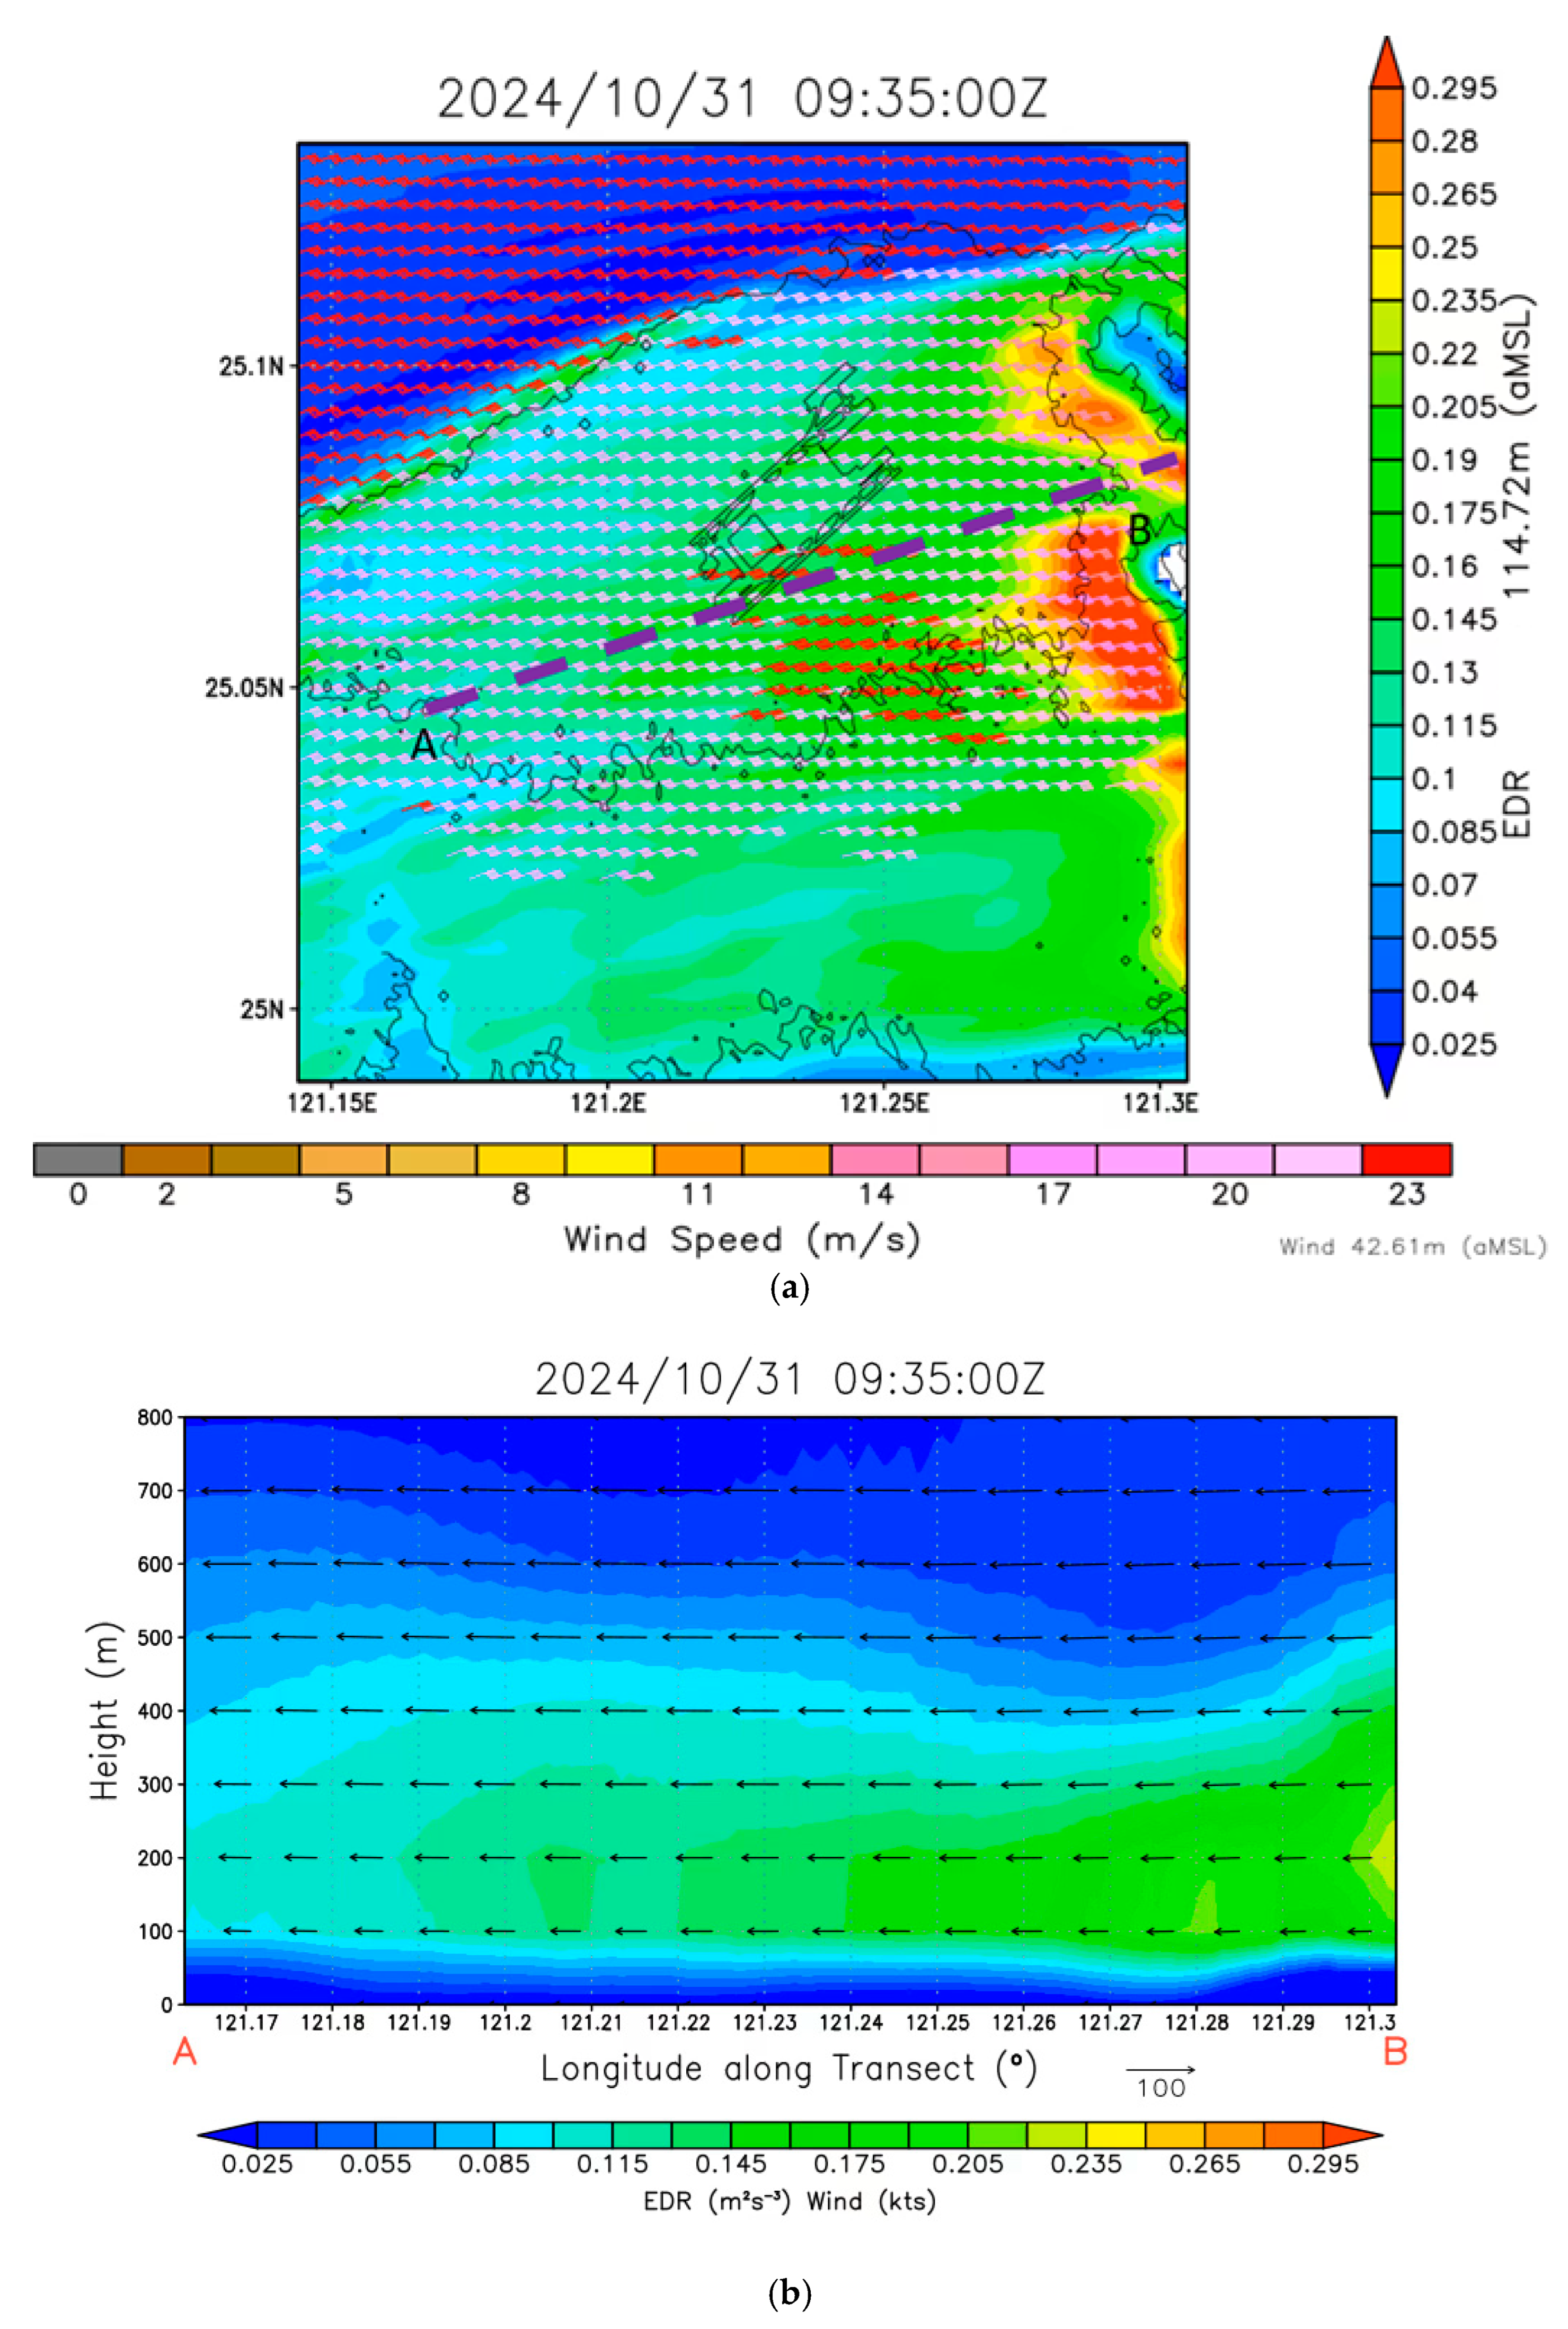
The simulation results for the wind at 10 m above the surface and eddy dissipation rate (EDR) at about 80 m above ground at 09:35 UTC, 31 October 2024, are shown in
Figure 6a. The EDR is obtained from the turbulent kinetic energy dissipation term in the sub-grid-scale turbulence parameterization scheme, as in the previous studies in HKIA. The height of 80 m is chosen because the EDR at lower altitudes may have limited application value due to the limited treatment of turbulence in the surface layer of the atmosphere. The surface wind as simulated is generally consistent with the actual observations, e.g., the gale force wind jet around the northern coast of Taiwan, and the generally weaker winds to the south. However, in the vicinity of 05R’s touchdown, there are also gale-force winds, which may be related to the valley upstream and the downslope flow to the south. The EDR in that region is in the order of 0.15 m
2/3s
−1, consistent with the magnitude of turbulence revealed by RMSVA. According to the latest version of ICAO Annex 3 (2018) [
8], light turbulence in the en-route phase is taken to be between 0.1 and 0.2 m
2/3s
−1. For low-level turbulence (below 1600 feet) in the landing phase, light turbulence is taken to be between 0.1 and 0.3 m
2/3s
−1. As such, the turbulence level based on RMSVA is considered reasonable.
To study the airflow upstream and along 05R’s touchdown route in detail, a vertical cross-section is laid out at location A-B in
Figure 6a. The components of the wind as projected on this cross-sectional plane and the EDR are shown in
Figure 6b. Between the valley and the airport, the vertical motion of the air is not apparent. There is a “tongue” of moderate turbulence up to around 500 m extending toward the runway end, and this region has a “wavy” surface, represented by the shaded contours of the EDR.
Another consideration to be made in relation to the missed approach is the impact of crosswind changes. Significant crosswind changes could affect the operation of the aircraft. The 7-knot crosswind change criterion was established in Nieuwpoort et al. (2008) [
1]. The simulated crosswind component at the runway threshold of 05R is shown in
Figure 7a. A significant crosswind change of 7 knots or above was not detected around the time of the event. This applies to mean wind only; gusts have not been simulated here.
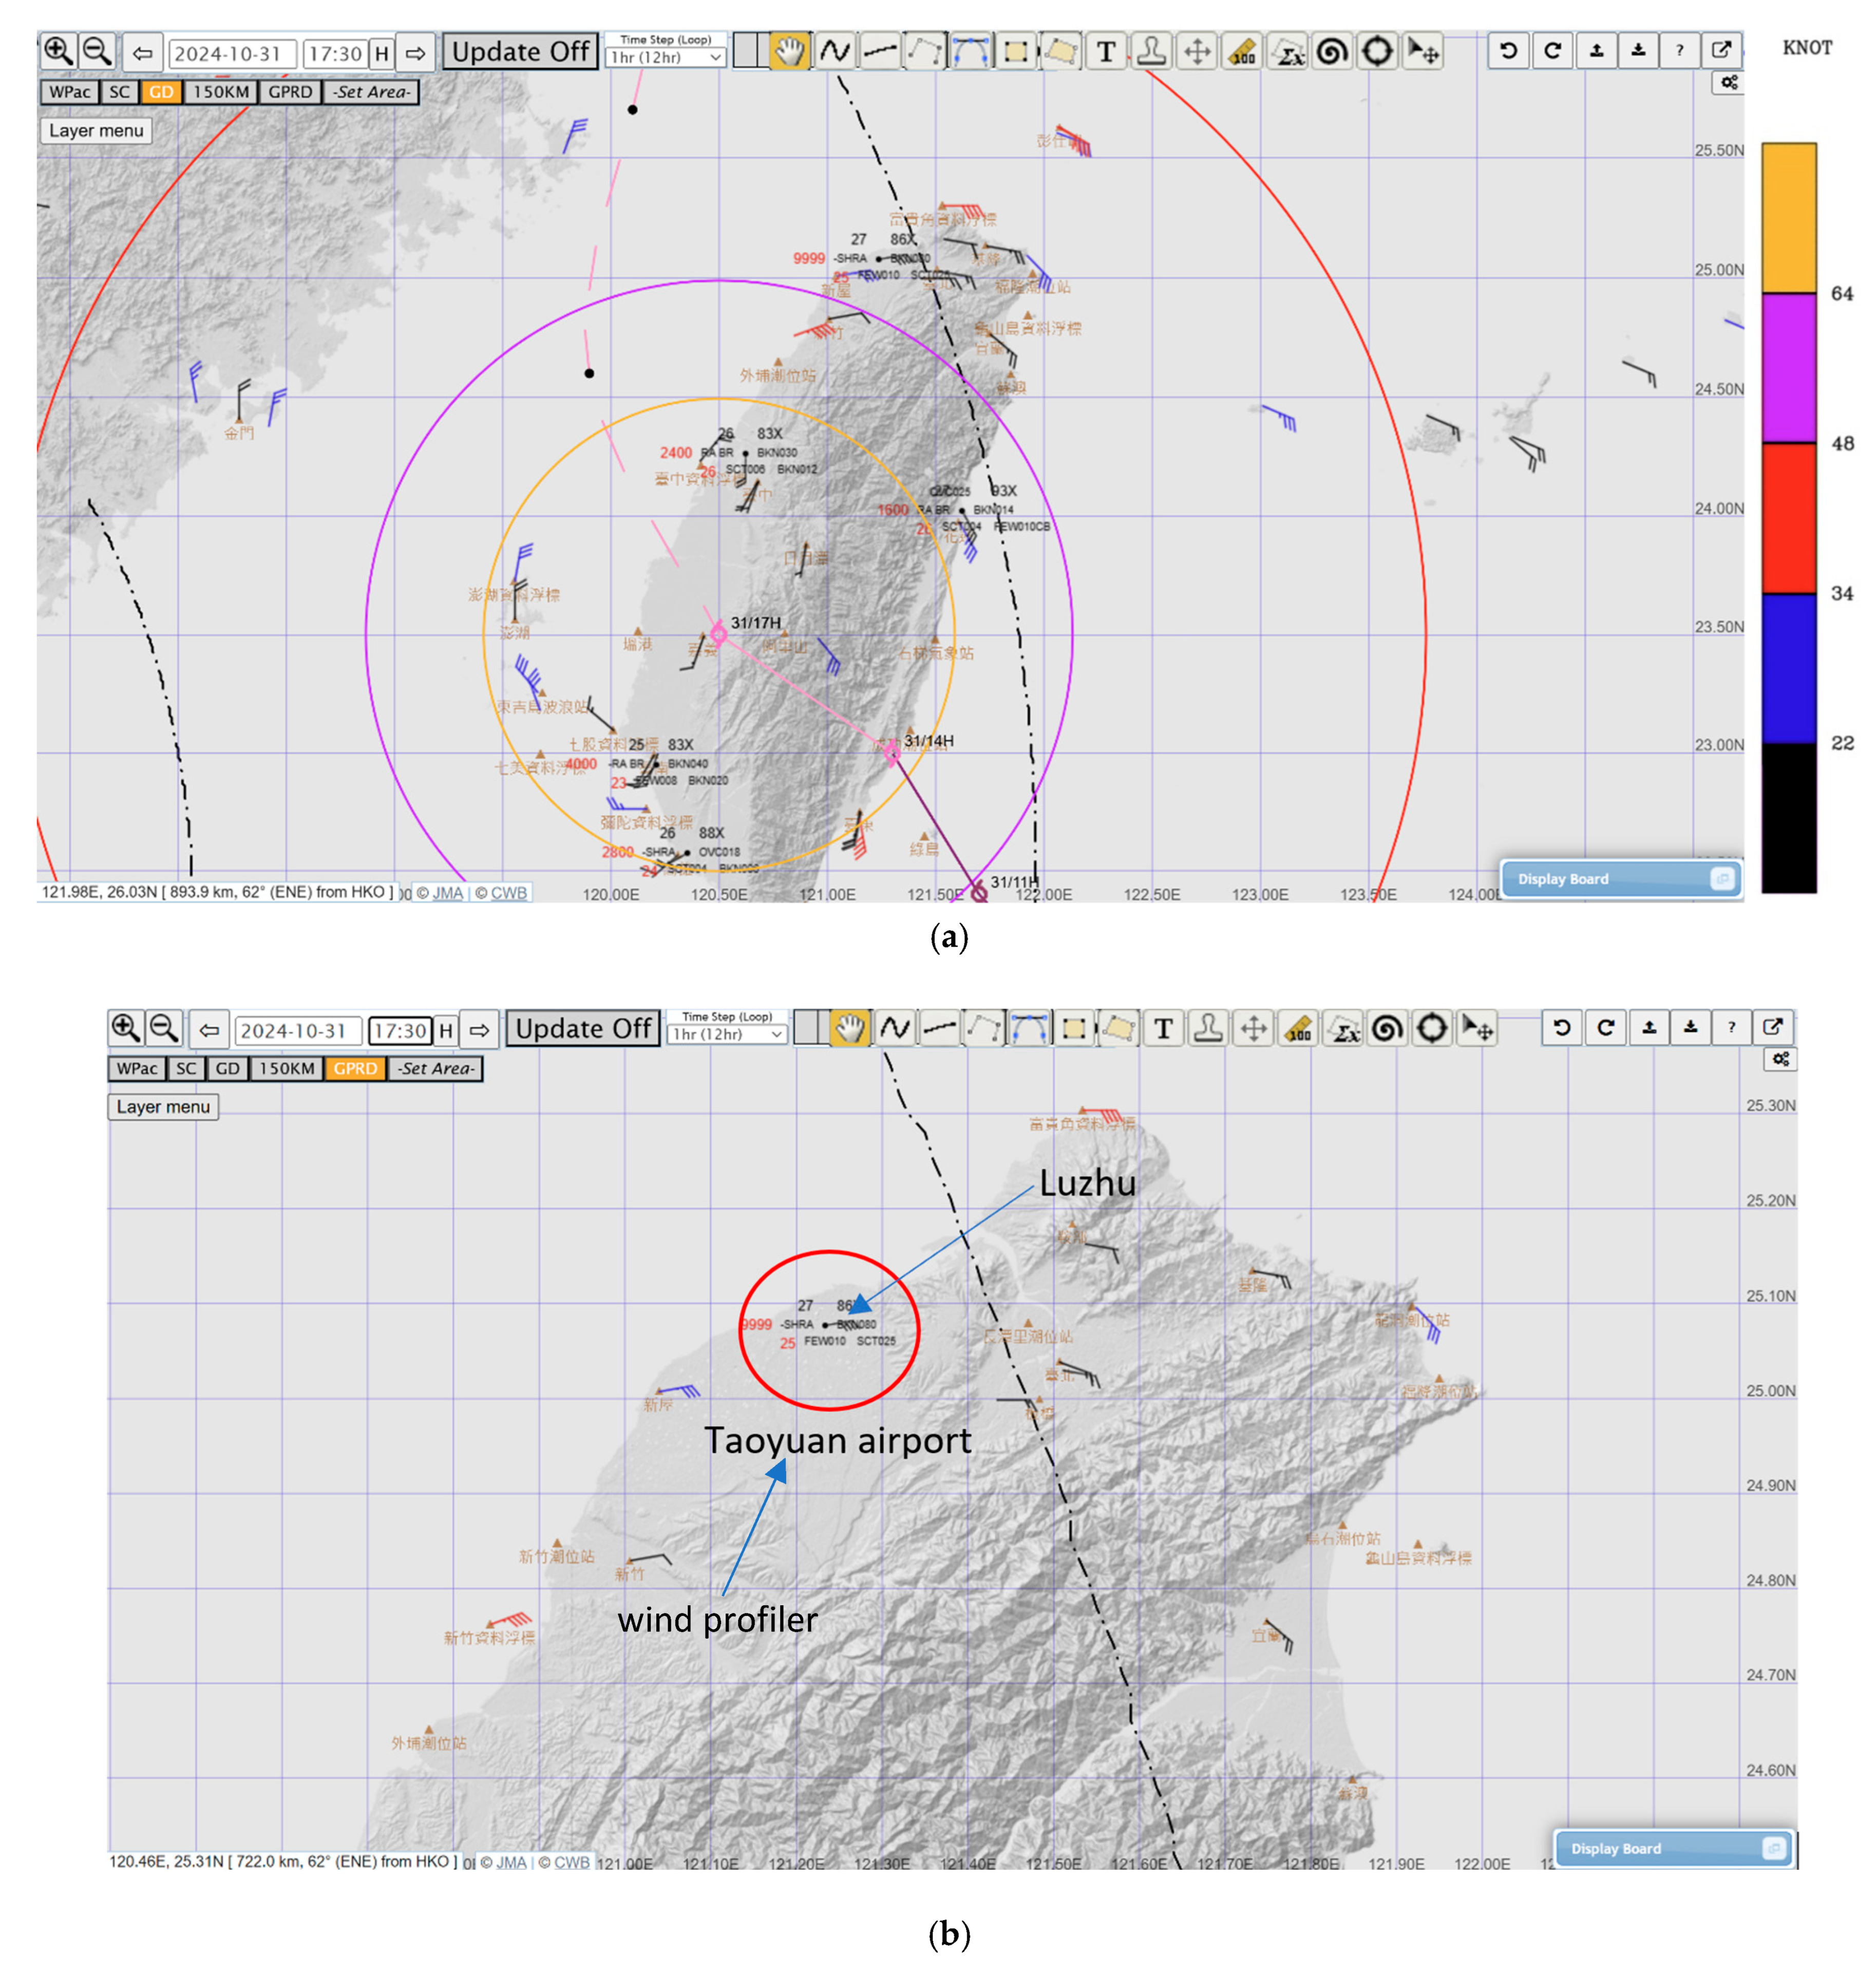
To assess the accuracy of the model’s forecast, the wind observations made at Luzhu station (location in
Figure 2b) near the airport are considered, and they are compared with the simulated winds shown in
Figure 7b. The wind direction difference is in the order of around 20 degrees. The wind speed difference is in the order of a few m/s. The simulated results are considered to be reasonable.
Figure 7b shows that, at around 09:35 UTC, 31 October 2024, which is the main time of interest, the simulated and measured wind speeds differ by about 4 to 5 m/s. This difference may be speculated to arise from the initial difference between the two datasets at 06 UTC. Two more model runs were performed, initialized at 03 UTC, 31 October 2024, and 09 UTC, 31 October 2024. The results from the two datasets at around 09:35 UTC remain similar. As inferred from the metadata for Luzhu station, the difference may be attributable to the station’s exposure. Moreover, the numerical simulation may have limitations related to the availability of high-resolution land use/land cover (LULC) data around the airport, which could contribute to the difference between the measured and simulated results.
The maximum wind measured at Luzhu station is also plotted in
Figure 7b. It turns out to be generally consistent with the simulated wind speed. The difference is mainly in the region of 2 to 3 m/s only.
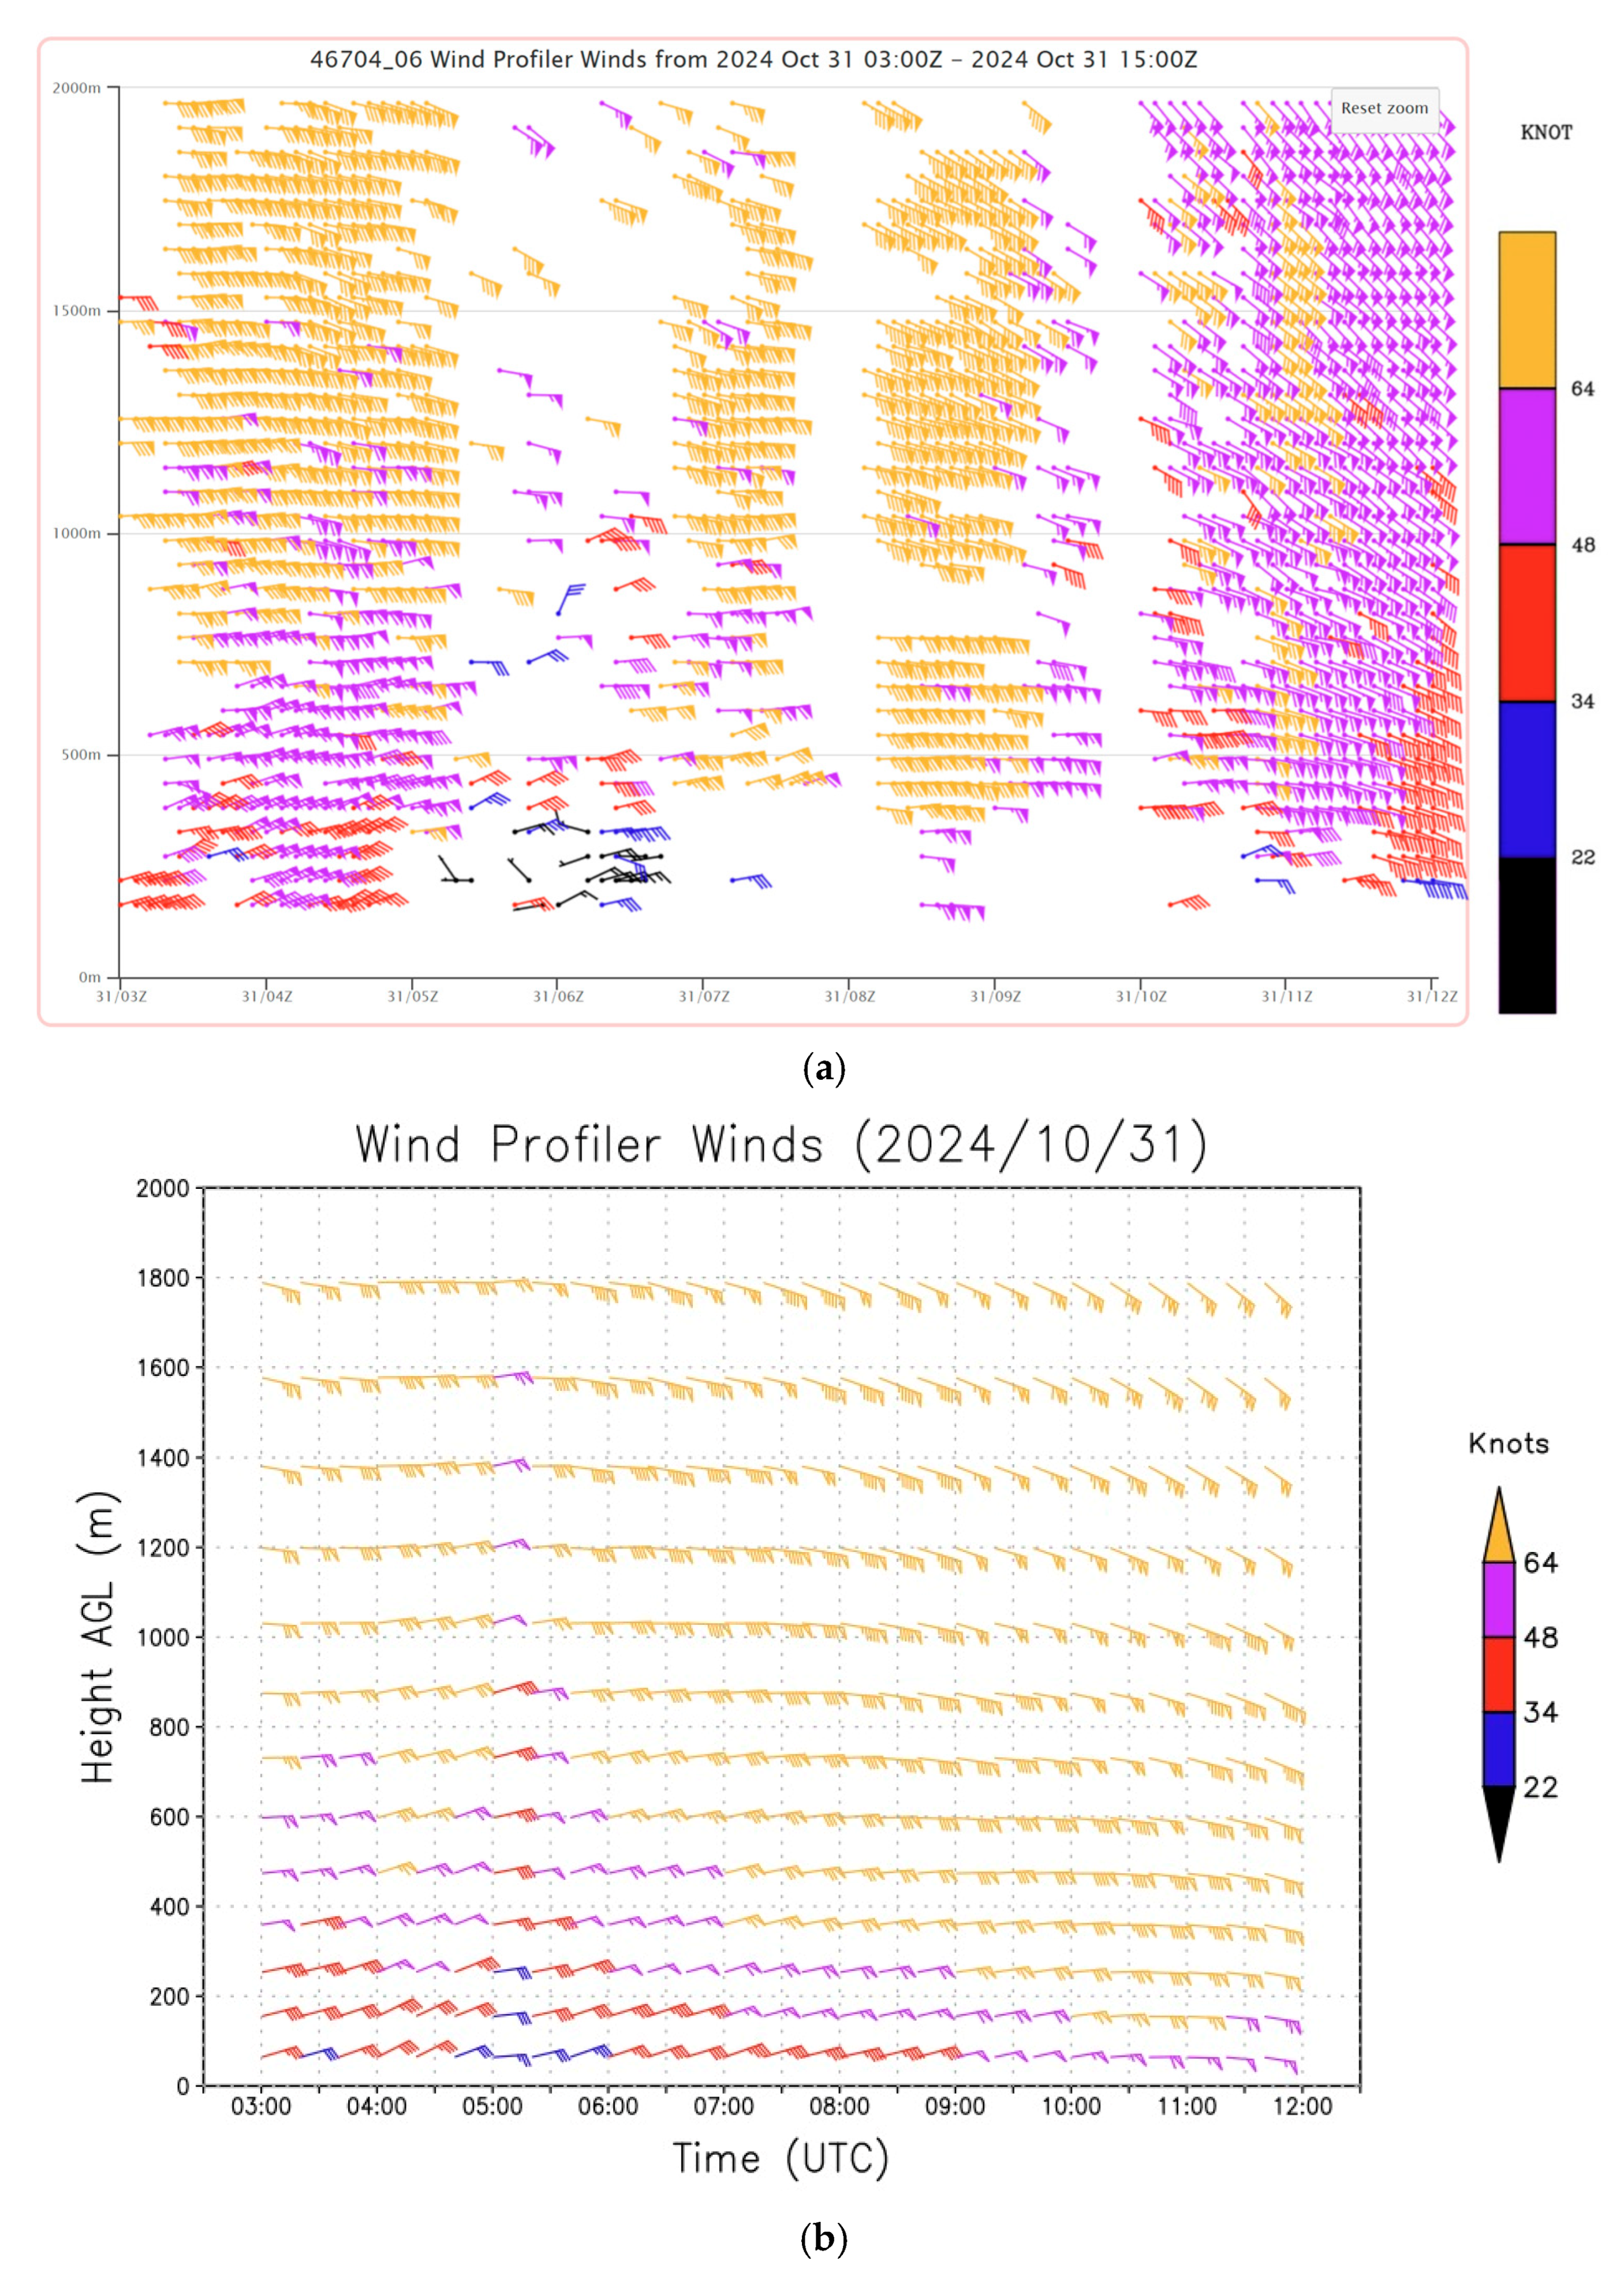
To study the performance of the simulation further, the data on upper air wind produced by the simulation are compared with the actual observations derived from a radar wind profiler at National Central University (24.965 degrees north, 121.1966 degrees east, with a height of 129 m above mean sea level, location in
Figure 2b). The actual observations are shown in
Figure 8a. There are several missing data points for the period of interest (between 09 and 10 UTC, 31 October 2024). In general, the hurricane-force wind (colored orange) descends with time from around 600 m at about 03 UTC to around 300 m at about 10 UTC, which is generally consistent with the simulation results (based on the model run initialized at 03 UTC, 31 October 2024) at the location of the wind profiler (
Figure 8b). Afterward, the winds gain a more southerly component and gradually weaken, as shown in
Figure 8a. The trend of weakening is shown in the simulation (
Figure 8b), but the weakening speed is slower. The weakening is related to the land friction of the island of Taiwan, acting on the typhoon, and again, the limitation of LULC data may limit the successful simulation of the speed of weakening of the winds.
In order to have a better appreciation of the consistency between the model result and the actual observations in the whole process under consideration, all the surface stations within the innermost model domain (
Figure 9a) are considered and the modeled wind speed and the modeled wind direction are compared with the corresponding actual observations for the whole simulation period (06 UTC to 12 UTC) for all stations. The maximum observed wind speeds are also compared with the modeled wind speed (
Figure 9b). The modeled and the observed datasets are found to be generally consistent with each other, following similar trends with time.
6. Conclusions
The case of an aircraft that performed a missed approach at Taoyuan International Airport during a typhoon has been studied. Based on the available meteorological observations and aircraft data, the missed approach can be inferred to have been potentially related to strong and gusty crosswinds. Other meteorological factors, such as low-level turbulence, appear to have been secondary or minor. A high-resolution NWP model has been used outside HKIA to study this missed approach case in more detail, and it is shown here to be a useful analysis tool.
It is noted that the present study only focuses on meteorological factors that may contribute to the missed approach of an aircraft during a typhoon situation. In addition to flight JX871, flights before and after have been analyzed. Of course, other factors may contribute to the missed approach, such as the pilot’s operation of the aircraft. In the video clip of the missed approach, we see that the wing tip was about to touch the ground. Such factors relating to the pilot and the operation of the aircraft are outside the scope of the present study.
Though limited to meteorological factors only, the methodology adopted in this study could be used to study other airports around the world suffering from possible terrain effects and influenced by strong winds. More cases will be addressed in future studies to see if such conjectures apply to similar weather conditions at other airports. Alternatively, the inputting of meteorological data, such as wind data (wind shear and turbulence), into flight simulators is being assessed, and such simulations may be useful for determining conditions unfavorable to the landing of aircraft.


