Abstract
Ozone (O3) is a major air pollutant with significant health effects, including increased respiratory and cardiovascular mortality. While previous research has largely focused on urban areas, this study assesses the association between maximum 8 h O3 concentrations and non-accidental mortality, including cardiovascular and respiratory mortality, in suburban and rural areas of Spain. We conducted a nationwide time-series analysis across 122 municipalities between April and September 2017 using Poisson regression models and adjusting for daily maximum temperature and provincial variability. Distributed lag models were applied to estimate the cumulative effects of ozone exposure on mortality, considering lags from 1 to 30 days. For each 10 µg/m3 increase in 8 h maximum O3 concentration, a significant increase in all-cause mortality risk of 2.3% was observed, with a peak at lag 2. Cardiovascular mortality increased by 2.4%, also peaking at lag 2, while respiratory mortality showed the strongest association, with a 4.3% rise at lag 1. A secondary mortality risk increase was observed at lags 24–28, suggesting the potential delayed effects of O3 exposure. These findings showed higher risk than those previously reported for urban populations and highlight the need for targeted public health interventions to mitigate the impact of ozone pollution in non-urban populations.
1. Introduction
Tropospheric ozone, also named ground-level ozone (O3), is a secondary air pollutant formed by the photochemical oxidation of precursors such as volatile organic compounds (VOCs) and nitrogen oxides (NOx) in the presence of ultraviolet radiation [1]. These precursors are predominantly emitted from anthropogenic sources [2,3].
The complex precursor dynamics together with atmospheric transport processes often result in elevated concentrations observed not only within urban environments, where precursor emissions are high, but also in downwind areas where O3 pollution can be more pronounced than near the emission sources [4,5,6]. This is due to the long-range transport of ozone and precursors, which undergo photochemical reactions during transit, leading to ozone formation and accumulation far from its primary emission source, with a variation that largely depends on geographical characteristics and climatic conditions [7].
Ozone concentrations exhibit pronounced spatial and temporal variability, following a specific diurnal pattern. Levels typically peak in the afternoon around 16:00 h [8], especially during summer due to increased photolysis rates; by contrast, winter diurnal cycles are generally less pronounced [9]. Concentrations progressively decrease, reaching their lowest levels during the night [6,10].
In Europe, the highest O3 levels are observed in the Mediterranean basin and parts of central Europe [11]. The health impact of ozone exposure depends on duration, concentration [dose], and individual susceptibility. Long-term exposure has been linked to faster decline in spirometry lung function [12], elevated risk of death from cardiovascular disease, ischemic heart disease, respiratory issues, and chronic obstructive pulmonary disease [13,14]. Furthermore, a possible association has been identified between ozone exposure and an increased incidence of diabetes [15,16,17], end-stage renal disease, and mortality in individuals with chronic kidney disease [18].
Short-term O3 exposure can lead to a decrease in forced expiratory volume in one second (FEV1) and trigger respiratory symptoms such as coughing, burning sensation, chest tightness, and difficulty breathing [19]. It is also linked to increased all-cause mortality [20,21] and cardiovascular mortality [22,23]. For its part, O3 mean of the daily maximum 8 h (MDA8) high concentrations have been associated with all-cause, respiratory, and circulatory mortalities [24].
According to the Global Burden of Disease data, in 2021 ozone exposure contributed to an estimated 489,518 deaths and 8.8 million Disability-Adjusted Life Years (DALYs) globally [25,26]. This is consistent with the fact that, between 2000 and 2019, global exposure of the urban population to O3 increased on average 0.8% every year due to lower titration by NO [27]. Death rates and DALYs are estimated to be higher among males compared to females as well as in areas with a low-middle sociodemographic index [28]. Geographically, O3 attributable deaths are not evenly distributed, with three-quarters occurring in cities in South and East Asia [29]. Additionally, a disproportionate burden is also observed between peri-urban and urban areas, with higher mortality rates estimated in peri-urban regions, as indicated by a 2022 modelling study [30,31].
Imported ozone from outside Europe accounted for approximately 60% of ozone-attributable mortality [31]. Although O3 emissions decreased between 2010 and 2017, more than 95% of the EU-28 urban population remained exposed to O3 levels exceeding the World Health Organization’s recommended limits, particularly in Southern Europe. Summertime MDA8 values have increased on average 0.6% per year globally as well as −1 and +1% per year in Central and Southern Europe [27]. Between 2000 and 2017, premature deaths attributable to O3 increased by 0.55 deaths per million inhabitants across Europe, while in Spain, the increase was not statistically significant, at 0.03 deaths per million inhabitants [32,33].
To date, however, no studies have specifically addressed respiratory morbidity and ozone exposure in Spain. Although ozone exposure indoors is relevant due to the amount of time people spend inside, indoor ozone concentrations are typically lower than outdoor levels and were not considered in this study [34].
Despite a growing body of research on the health effects of ozone worldwide, most previous studies are limited to urban areas, sometimes due to the paucity of air pollutant measurements in rural areas [35]. Moreover, elevated background ozone levels—especially in northern and eastern Europe—have hindered the identification of consistent trends in urban ozone concentrations, particularly when considering the broader influences of transboundary pollution [36]. In Spain, several studies, including multicenter analyses, have examined the health impacts of ozone [37,38], but the majority have focused on urban areas or provincial capitals, with relatively little attention paid to suburban and rural areas. Given the substantial number of people residing outside urban areas and their elevated health risks [30], this study focuses on peri-urban and rural regions to better understand and address the impacts of ozone exposure on public health. In this context, the present study aims to analyze the impact of daily maximum eight-hour ozone concentrations on cause-specific mortality (non-accidental, cardiovascular, and respiratory mortality) in suburban and rural areas of Spain.
2. Materials and Methods
2.1. Study Design
We set up an ecological time-series study conducted from 1 April to 30 September 2017. The study population included residents of 122 municipalities across 43 of Spain’s 52 provinces, based on official population figures as of 1 January 2017. These data were obtained from the municipal registers provided by the National Statistics Institute (INE) [39], in accordance with Article 17 of the Law on the Basis of Local Government [40].
The primary outcome was daily mortality, including all-cause natural mortality, cardiovascular mortality, and respiratory mortality, classified using the Spanish version of the International Classification of Diseases, 10th Revision (ICD-10). All-cause mortality included all deaths from natural causes (ICD-10: A00-R99). Cardiovascular mortality included all deaths coded under Chapter I (I00-I99), and respiratory mortality included those classified under Chapter J (J00-J99).
Mortality data were aggregated daily for each of the 122 municipalities and covered the study period from April to September 2017. All mortality data were obtained from the INE [39].
2.2. Ozone Concentration Measures
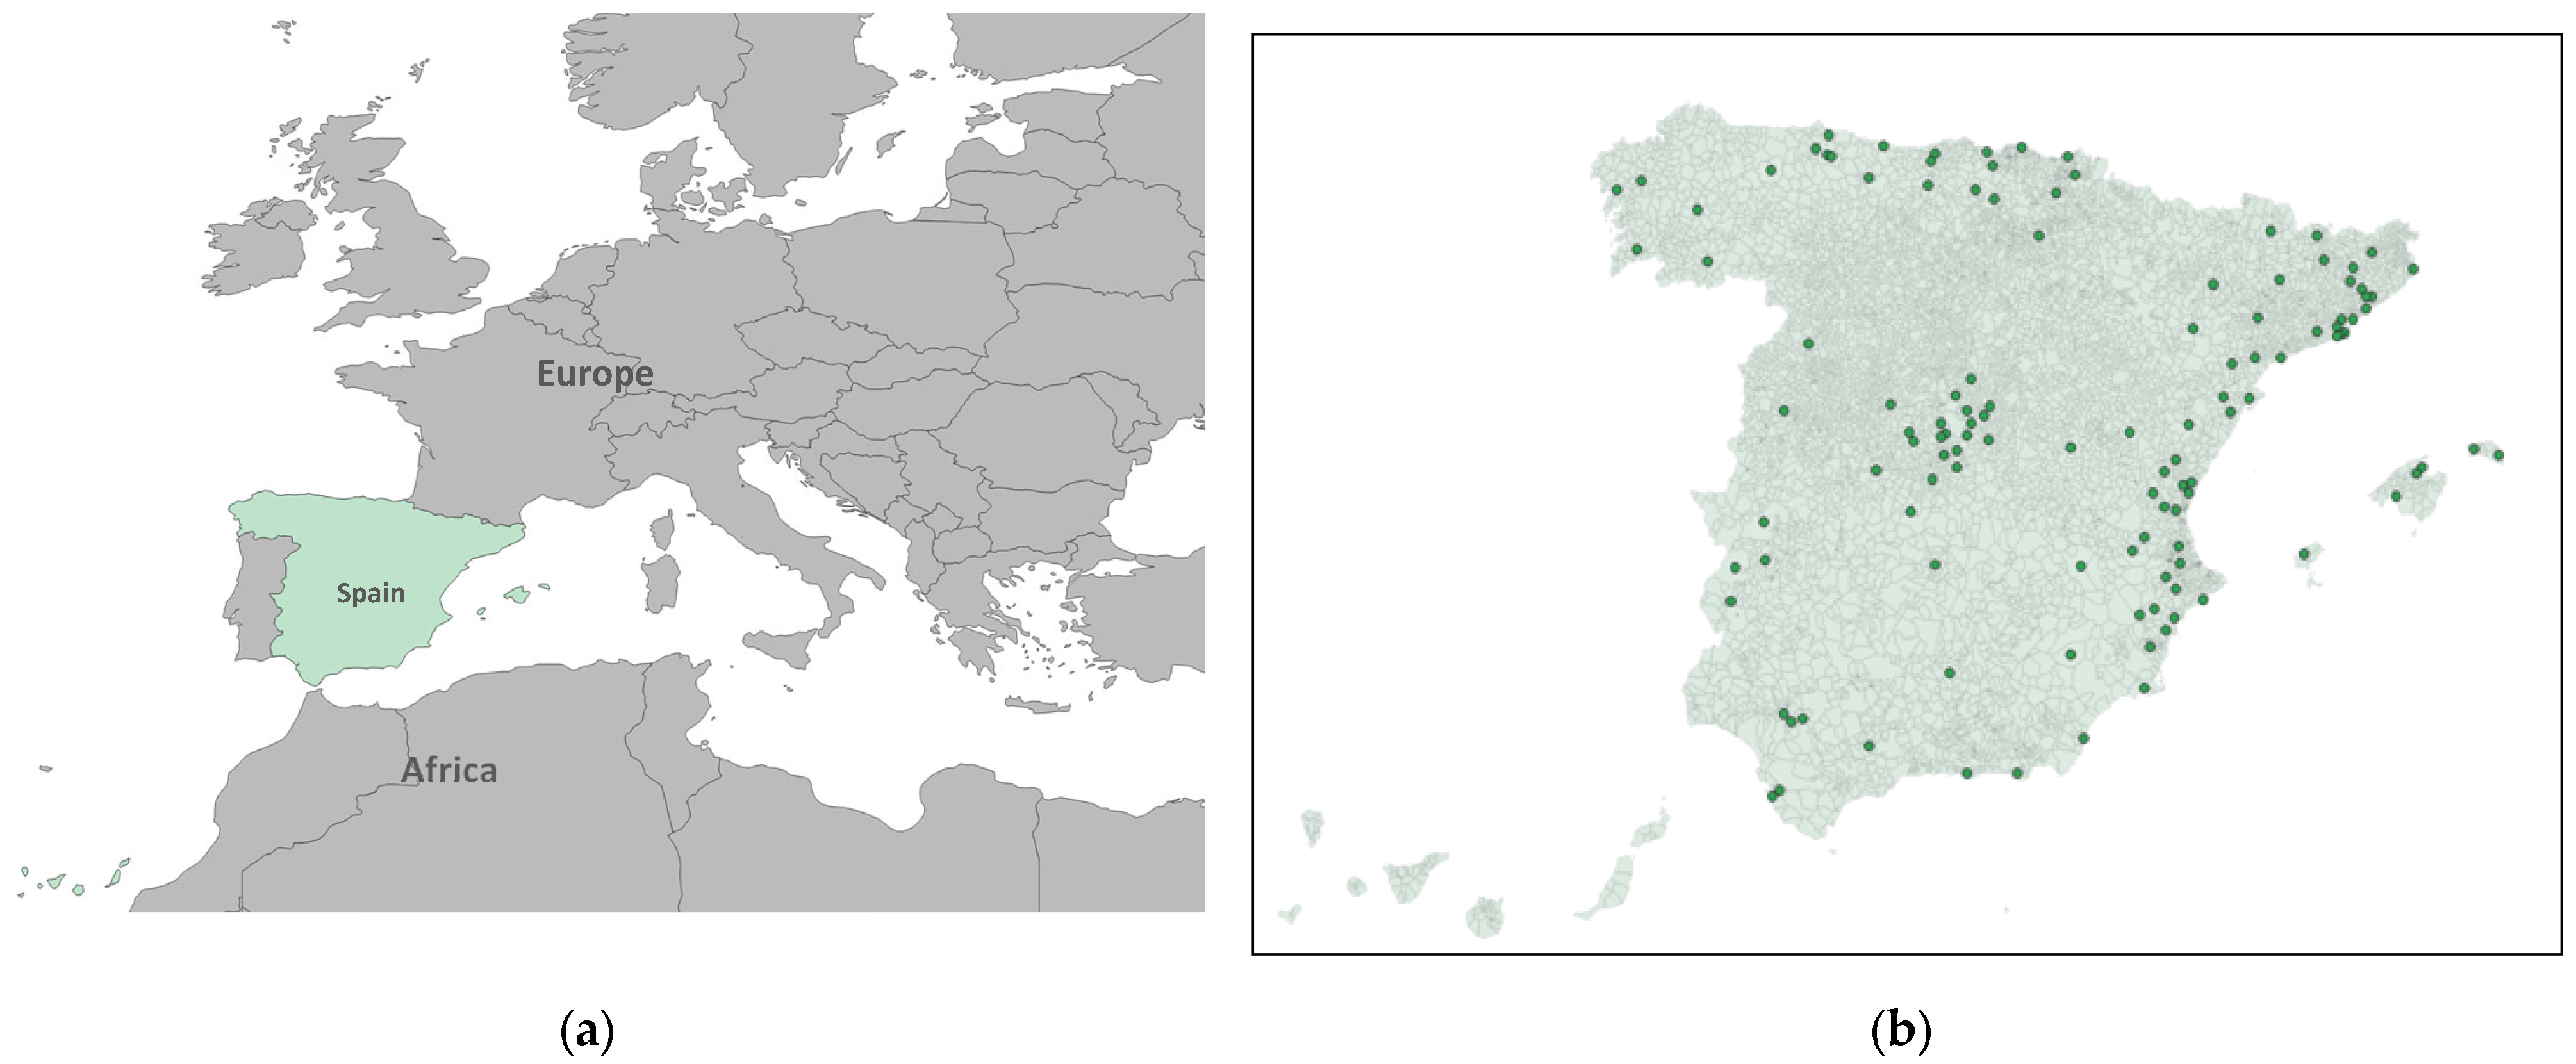
The independent variable was the daily maximum eight-hour average ozone concentration (µg/m3), measured at air quality monitoring stations located within the selected municipalities that record the hourly ozone concentrations (Figure 1). In accordance with current legislation [41], monitoring stations are classified by area type: urban, characterized by continuous building structures; suburban, built environments separated by non-urbanized spaces such as small lakes or forests; and rural, which do not meet the criteria for either urban or suburban classifications. Stations are further categorized based on predominant emission sources: traffic stations, where air pollution is primarily influenced by nearby vehicle emissions; industrial stations, located near major industrial emission sources; and background stations, which are not dominated by any specific emission source. In this study, we exclusively included background monitoring stations located in suburban and rural municipalities. In each of these municipalities, there is only one station that is representative of the ozone for the whole area.
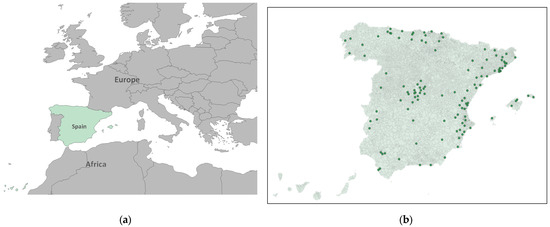
Figure 1.
(a) Spain in its geographical context; (b) Geographic distribution of the ozone monitoring and control station sited in suburban and rural municipalities included in the analysis in green points (Spain).
Ozone concentration data were provided from the Ministry for the Ecological Transition and the Demographic Challenge [42].
2.3. Control Variables
We included daily maximum temperature, measured in degrees Celsius at the provincial level. Previous studies have shown that temperature may influence both air pollutant concentrations and their health effects [43], particularly in the case of ozone, which tends to peak during periods of high temperatures [44]. Additionally, province was incorporated as a control variable to account for spatial heterogeneity in demographic, geographic, and socio-economic factors that could affect the observed associations. Meteorological data were obtained from the Spanish Meteorological Agency (AEMET) [45].
2.4. Statistical Analysis
Given that the outcome variable was the daily number of deaths in relation to time-varying covariates, Poisson regression models were employed—using generalized linear models (GLMs)—to assess the association between O3 concentrations and daily mortality. The effect of air pollution on daily mortality may not be immediate, as it can be delayed by several days [46,47]. In the case of ozone, previous studies have shown that its health effects can extend for days following exposure [21,38,48]. Therefore, in addition to incorporating all previously described variables, lag variables were constructed for ozone, covering day 1 to day 30 prior to the date of death. Models included all previously described covariates (daily maximum temperature and province) and accounted for potential delayed effects by incorporating distributed lag structures. Analyses were conducted separately for each of the three mortality outcomes and stratified by sex. The measure of association estimated in this study was the relative risk (RR), which quantifies the change in mortality risk associated with each unit increase in air pollutant concentration.
The RR was calculated based on an increment of 10 units of the pollutant (10 μg/m3 O3), using the following formula where the number of deaths follows a Poisson distribution with mean equal to the product of the population and the rate (λ). In turn, the logarithm of the rate is modeled as the sum of a constant term, the effect of the ozone in the specific municipality on the specific day, the effect of the temperature for the province on the specific day, and the effect of the province itself (“i” denotes the municipality, “j” is the day of observation, “k” represents the lag period [days before the event], and “p” refers to the province).
In a simpler way the formula could be written as follows.
We set statistical significance to a p-value < 0.05. For this analysis, we used the software package R, Version 4.4.1 (2024-06-14).
3. Results
The descriptive analysis showed that, during the study period, a total of 33,397 all-cause deaths were recorded, of which 17,306 occurred in men and 16,091 in women. When stratified by cause, circulatory-cause mortality was higher in women, with 4749 deaths, compared to 4243 in men. In contrast, respiratory-cause mortality was more frequent in men, with 2018 cases, versus 1586 in women (Table 1).

Table 1.
Total and sex-specific mortality. Mean ozone and maximum temperature.
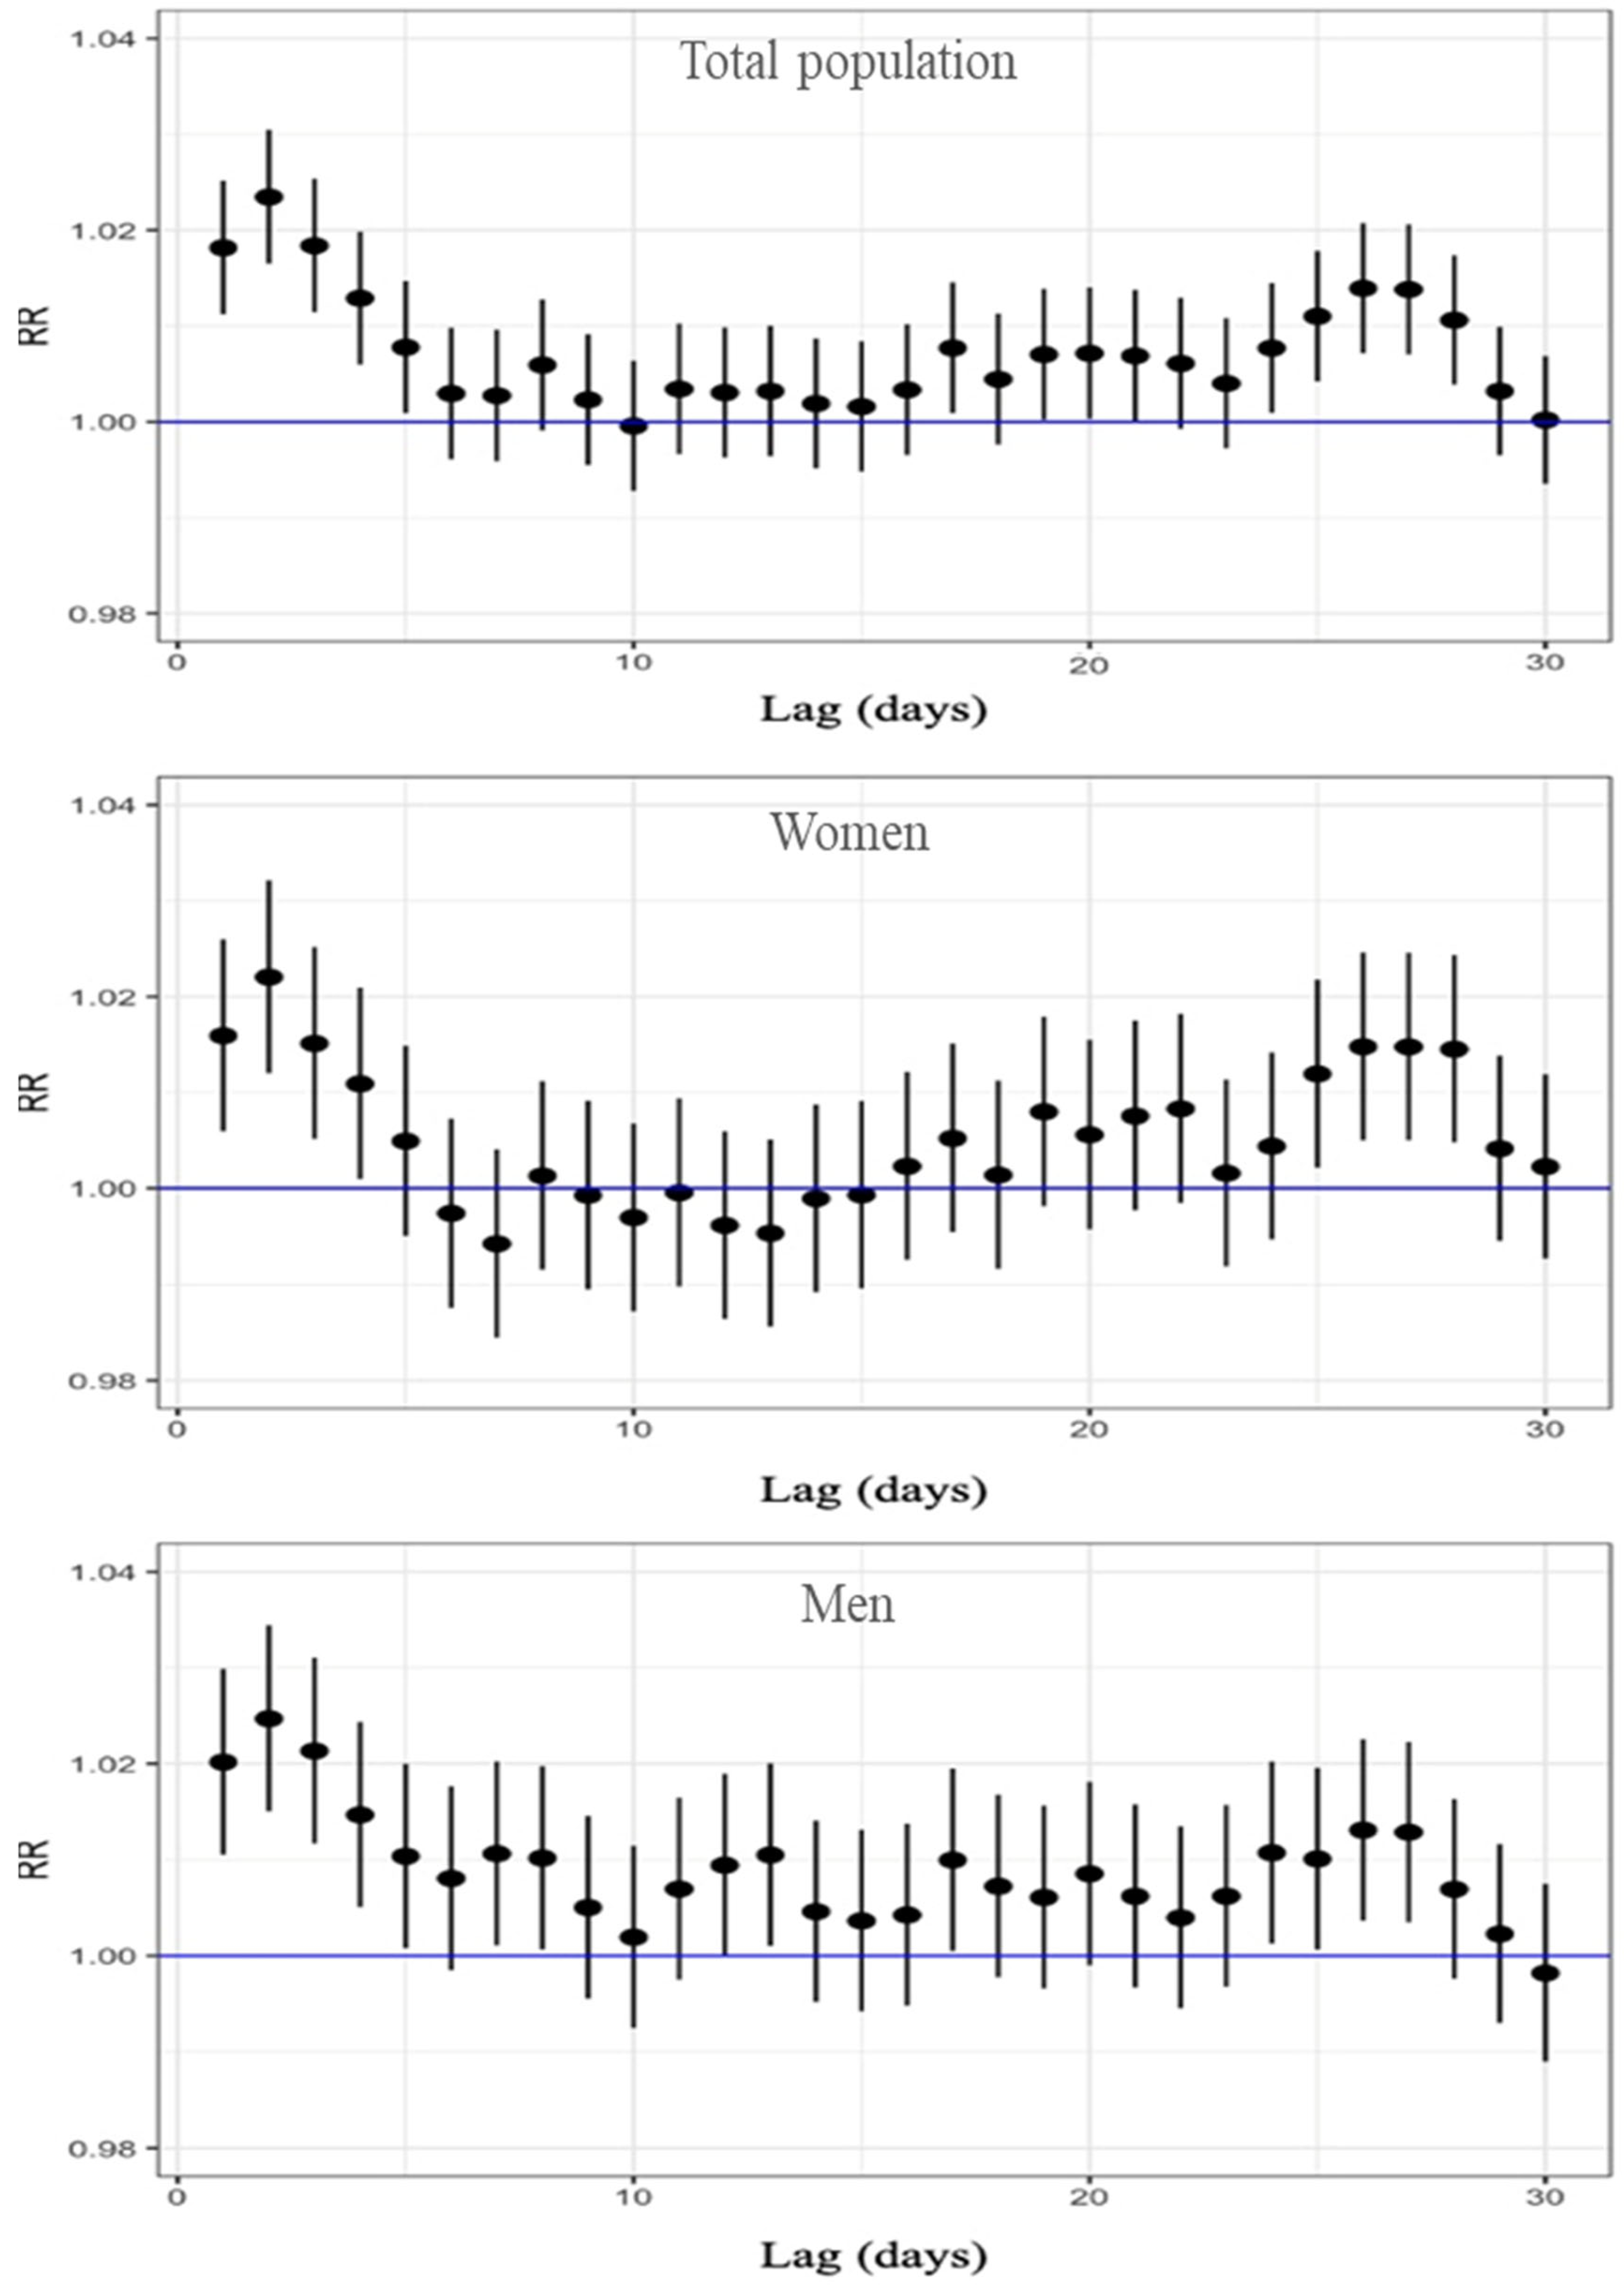
Figure 2 presents the RR and the corresponding 95% confidence intervals, based on the Poisson regression modeling for all-cause mortality and stratified by sex. The relationship between ozone concentration and mortality was evaluated across different lag days, ranging from 1 to 30. The results show that, for the total population, a significant increase in all-cause mortality risk was observed from lag 1 to lag 5, with the RR ranging from 1.023 to 1.008; the maximum effect was at lag 2, where the RR was 1.023 (95% CI: 1.016–1.030), indicating a 2.3% increase in mortality risk per 10 µg/m3 increase in O3. Table S1 in the Supplementary Materials presents all RR, 95% CI, and p-values for the 30 lag days. When stratified by sex, both women and men showed the highest risk at lag 2. Among women, the RR was 1.022 (95% CI: 1.012–1.032), while among men, the RR was slightly higher, reaching 1.025 (95% CI: 1.015–1.034). A significant excess of risk was found for lag 1 to lag 4 in women and for lag 1 to lag 5 in men (Table S1). All three graphs also indicate an excess risk between lags 24 and 28. In summary, our results showed the higher excess of all-cause mortality associated with an increase of 10 μg/m3 O3 two days before death, with a RR above 2% for the three population groups.
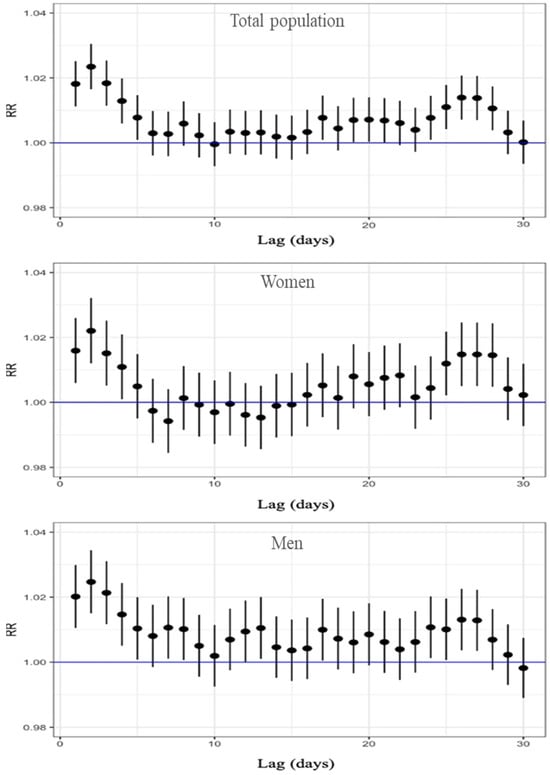
Figure 2.
Lag-specific RR and 95%CI of O3 exposure for all-cause mortality, displayed top to bottom for the total population, women, and men.
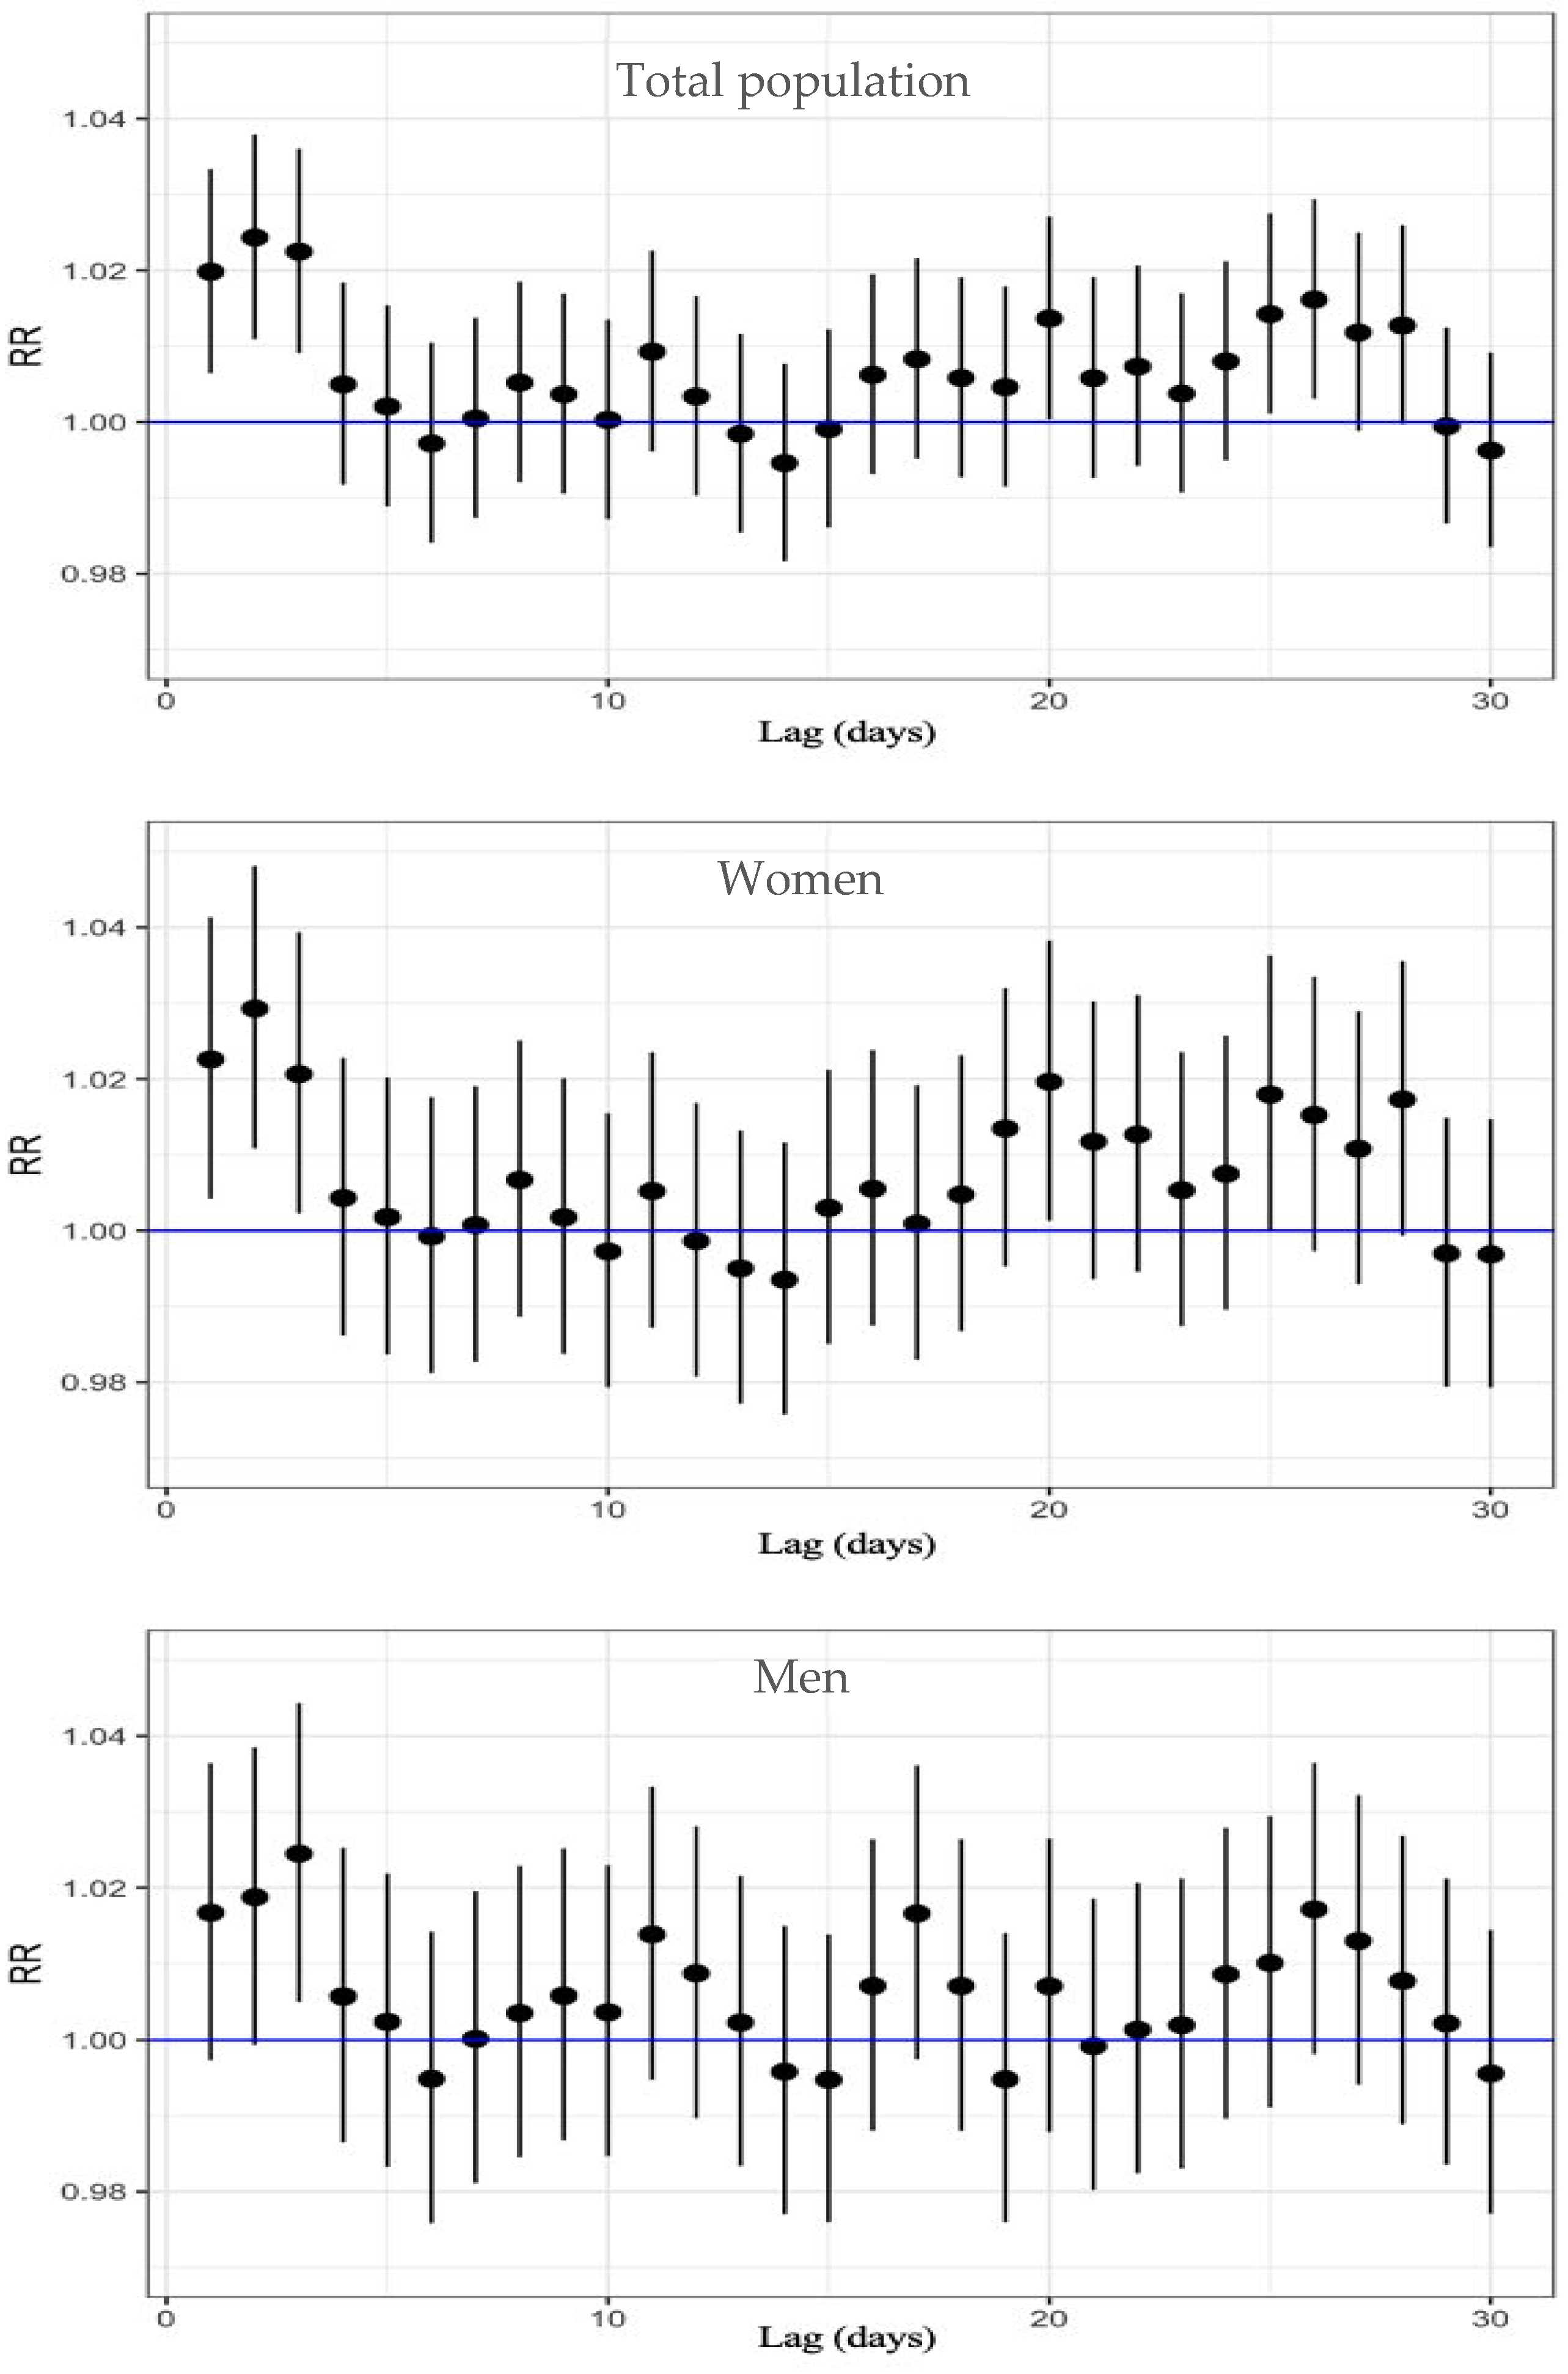
Regarding cardiovascular mortality, Table S2 and Figure 3 show the results from the analysis. In the total population, a significant increase in mortality risk was observed between lag 1 and lag 3, with an RR from 1.024 to 1.020, with the highest relative risk of 2.4% at lag 2 (RR: 1.024; 95% CI: 1.011–1.038).
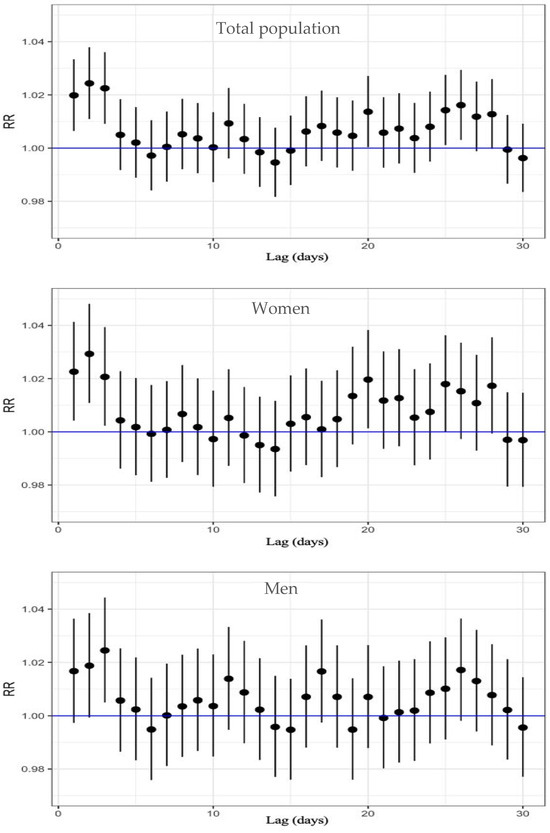
Figure 3.
Lag-specific RR and 95%CI of O3 exposure on circulatory-cause mortality, displayed top to bottom for the total population, women, and men.
When analyzing by sex, women also exhibited a significant increase in risk from lag 1 to lag 3, with an RR from 1.029 to 1.021; the highest RR was at lag 2, corresponding to a 2.9% increase in cardiovascular mortality per 10 µg/m3 increase in O3 (95% CI: 1.011–1.048). Among men, however, the RR was lower than among women, and a statistically significant association was only observed at lag 3 (RR: 1.024; 95% CI: 1.005–1.044).
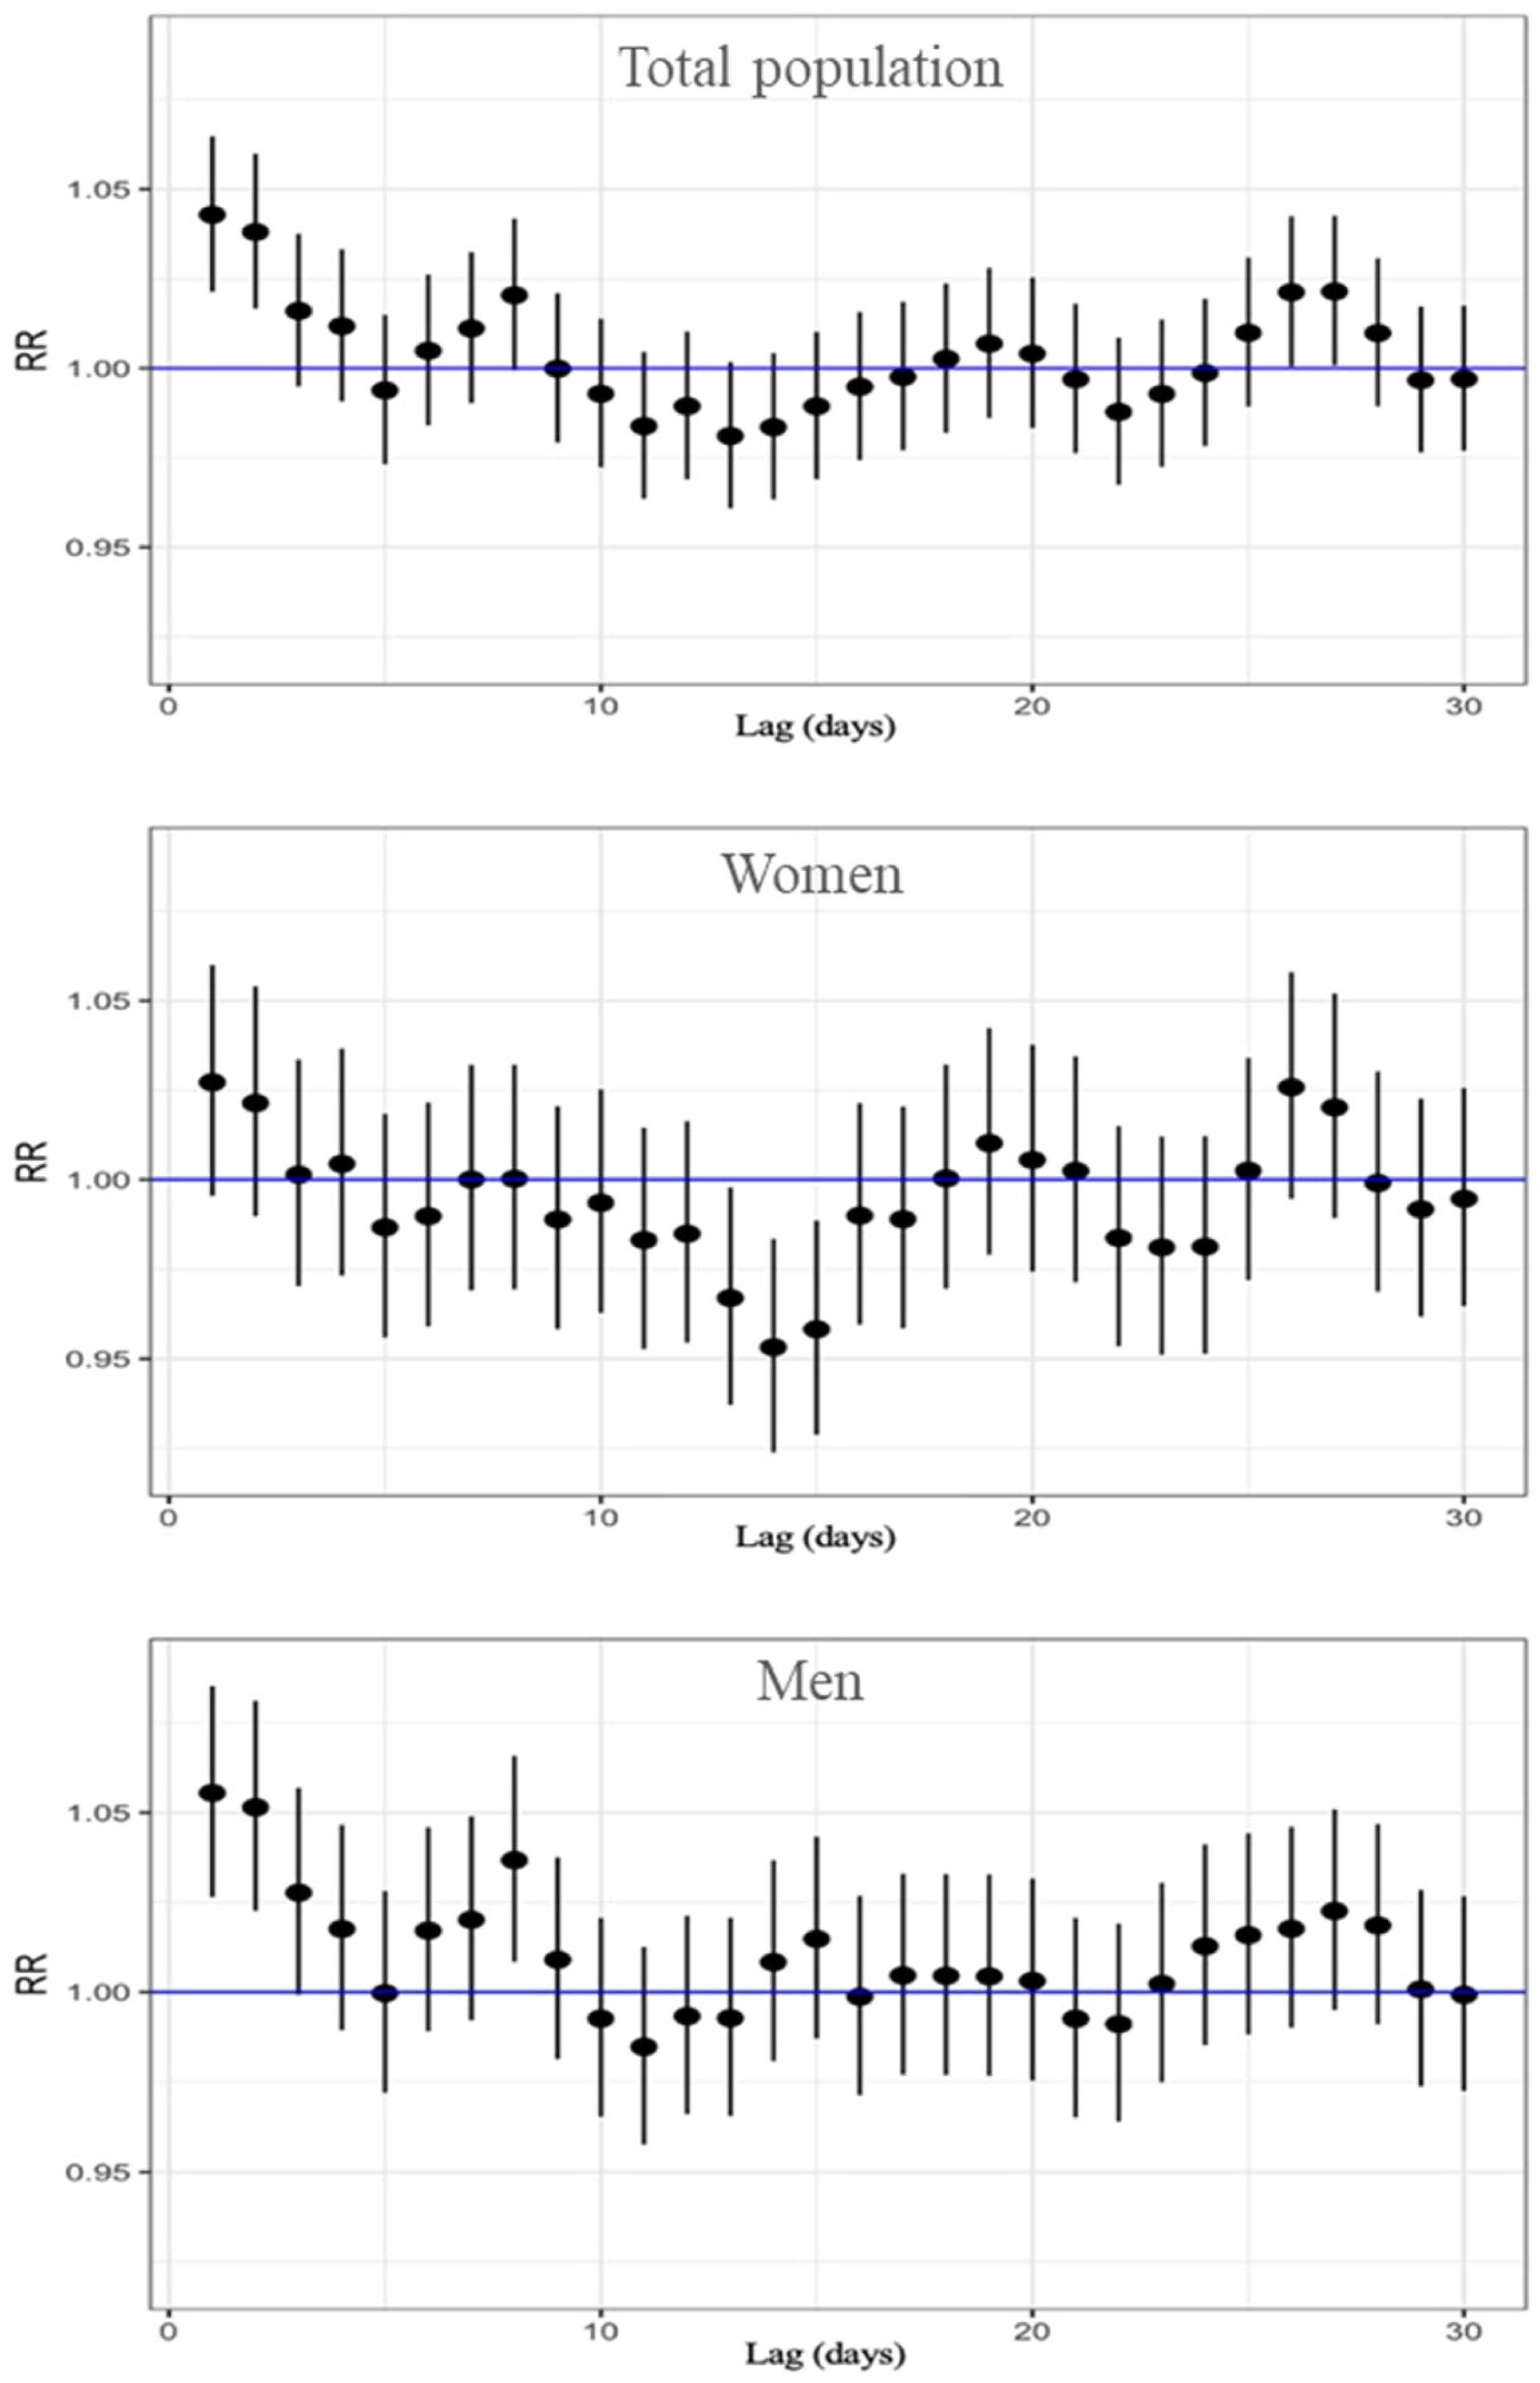
Finally, results for the association between ozone exposure and respiratory mortality are in Table S3 and Figure 4. In this analysis we found the highest risk estimations of the study, and this was on lag 1. For the total population, the highest relative risk was observed at lag 1, with an RR of 1.043 (95% CI: 1.021–1.065). This finding suggests that immediate exposure to O3 has a significant impact on respiratory-related deaths. In sex-stratified analyses, the highest risk was also found at lag 1 for both men and women. Among women, the RR was 1.027 (95% CI: 0.995–1.060), whereas in men, the association was stronger, with an RR of 1.055 (95% CI: 1.027–1.085), suggesting a higher susceptibility to the respiratory effects of ozone exposure. It is important to note that significant associations were concentrated on the day immediately preceding death (lag 1). However, a secondary increase in risk was observed between lags 24 and 28, consistent with the pattern seen for cardiovascular mortality, which may be due to cumulative effects of ozone exposure or confounding seasonal or environmental factors.
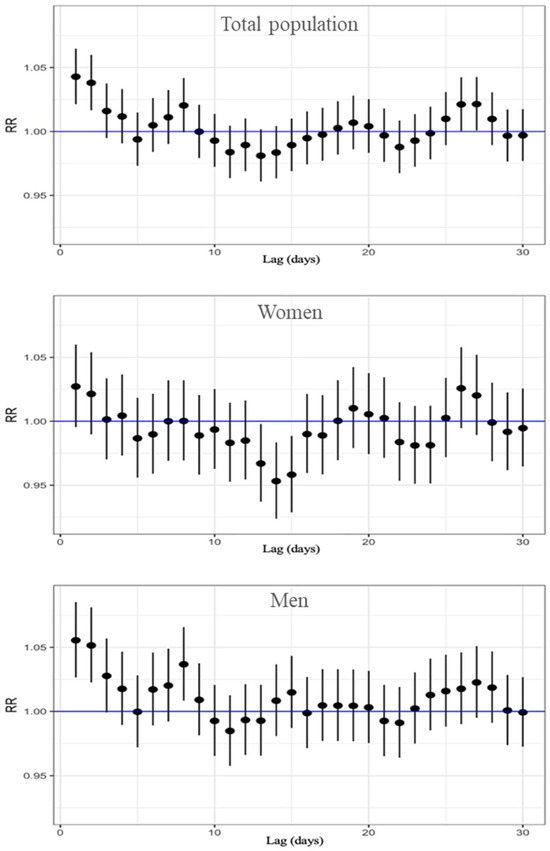
Figure 4.
Lag-specific RR and 95%CI of O3 exposure for respiratory-cause mortality, displayed top to bottom for the total population, women, and men.
4. Discussion
In this ecological time-series study, we investigated the relationship between maximum 8 h ozone concentrations and daily mortality, including all-cause, circulatory, and respiratory causes, in suburban and rural areas of Spain during the period from April to September 2017. The results show a significant association between ozone exposure and daily mortality, with the strongest effects observed in the days immediately preceding death. Additionally, elevated relative risks between lags 24 and 28 days prior to death, suggest both the immediate and short-term effects of ozone on mortality.
Our results suggest higher mortality risk in suburban and rural areas than those previously reported for urban areas. However, the mortality burdens calculated in this study are not directly comparable to those reported in previous research due to differences in study design, population characteristics, and exposure periods. Our analysis used data from a limited time period and focused on suburban and rural populations in a specific region, which are typically underrepresented in the literature. Most comparable studies are conducted in urban contexts and over longer time frames, as we explore below.
Recent studies have confirmed the significant relationship between ozone exposure and non-accidental mortality [49,50]. One study conducted in 95 urban areas in the United States found a significant association between short-term ozone exposure and all-cause mortality, reporting that a 10 ppb increase in daily ozone levels in the previous week corresponded to a 0.52% (95% posterior interval, 0.27–0.77%) increase in daily mortality [21]. This finding aligns with our results, but our estimation was higher, with a 2.3% increase in daily total mortality per 10 µg/m3 in ozone concentration.
Cardiovascular mortality followed a similar pattern. Few studies have specifically studied the underlying biological mechanisms explaining the cardiovascular effects of ozone, such as platelet activation and blood pression increase [51] as well as acute changes in inflammation, fibrinolysis, and endothelial cell function [52]. A previous meta-analysis estimated that the pooled relative risk for cardiovascular mortality for each 10 µg/m3 increment in ozone concentration was 0.068% (95% CI: 1.0049–1.0086) [53], again, lower than our estimate of 2.4% (95% CI: 1.011–1.038).
Our findings also revealed a significant increase in the relative risk of cardiovascular mortality at lag 2 in both the total population and among women, while in men, it peaked at lag 3. This temporal pattern differs slightly from previous studies, which have reported a significant increase in circulatory-cause mortality for a 10 μg/m3 increase in ozone concentration in lags 0–1 [54]. Regarding respiratory-cause mortality, this study showed that the highest relative risk was observed at lag 1 in the overall population, with an RR of 4.3% (95% CI: 1.021–1.065), suggesting that short-term exposure to ozone has a significant impact on respiratory mortality. These findings are in line with previous studies, which have consistently reported associations between short-term ozone exposure and increased respiratory mortality [55], though some studies have failed to find significant associations [22,56]. Ozone exposure is known to trigger acute airway inflammation, and exposure to 0.10 ppm ozone has been shown to result in significant increases in inflammatory markers and protein levels in bronchoalveolar lavage fluid as well as impaired phagocytic function of alveolar macrophages via the complement receptor [46]. A different study from China found that a 10 μg/m3 increase in ozone at lags 0–1 was associated with an increase of 0.11% in circulatory mortality, 0.12% in non-accidental mortality, and 0.09% in respiratory mortality (the latter was not statistically significant) [57]. Mortality risk was higher in females for all three causes studied, which differs from the data in our results. Although our study did not use the same exposure metric (we treated ozone as a continuous variable), these estimates fall within a comparable range, especially considering our shorter study period, and focus on less urbanized areas. Another study conducted in the U.S. found that long-term annual average ozone exposure per 10 ppb was associated with increased mortality from cardiovascular (HR 1.03) and respiratory diseases (HR 1.04), again supporting a positive association between ozone and mortality [55]. While our study covers a much shorter exposure period, the observed effects fall within a similar range, suggesting a coherent pattern across exposure durations, albeit with less statistical power in the short-term estimates. Regarding the moment of higher risk, one study reported that the strongest associations between ozone and cardiovascular mortality occurred at lag 1, followed by lag 2 and 6, which partially supports our results [58]. However, the study was limited to elderly populations and specific causes of death, therefore not being totally compatible.
It is essential to consider the inherent complexity in comparing studies conducted in different regions, due to variations in population characteristics, ozone exposure, and environmental conditions. For instance, demographic structure, prevalence of pre-existing diseases, and health-related behaviors may differ substantially between different countries. Given the regional variability in ozone precursor emissions and the higher sensitivity of low-latitude areas, it is essential to consider the geographic distribution and evolving trends of ozone sources when designing air quality policies [59].
A notable finding is the increase in RR observed between lags 24 and 28 days prior to death for all three causes of death. This pattern is not yet widely documented in the literature and may be explained by the cumulative damage caused by ozone exposure.
A key strength of our study is to consider the ambient air quality data provided by suburban and background air quality monitoring facilities distributed throughout the country to ensure an accurate representation of regional ozone exposure, minimizing the bias that can result from relying on a single station that represents large areas. Furthermore, our focus on suburban and rural areas provides a more comprehensive and precise assessment of background ozone exposure across diverse populations and limits the confusion with urban pollutants such as nitrogen dioxide. The statistical models were adjusted for meteorological variables and stratified by province, thereby reducing the risk of confounding and enhancing the validity of the findings.
However, several limitations should be recognized. First, the ecological study design inherently limits the ability to establish definitive causal relationships. Second, indoor ozone was not included in the analysis because of the lack of data. Third, although adjustments were made for several control variables, unmeasured confounding factors may still influence the observed associations.
In addition, while our analysis examined the association between ozone levels and all-cause, circulatory, and respiratory mortality, we lacked detailed data on tobacco use prevalence within the study population. Tobacco consumption is a well-established risk factor for respiratory and cardiovascular diseases, as well as for various types of cancer [60,61]. The absence of this variable may affect the precision of our estimates, as tobacco is a major contributor to mortality from these causes. Without information on variations in tobacco consumption, we were unable to adequately adjust our models for this potential confounder, which may result in either an overestimation or underestimation of the effects of ozone exposure on mortality.
Finally, our analysis focused exclusively on ozone as a pollutant, without accounting for the potential influence of other environmental pollutants. This may limit the broader understanding of the cumulative health and ecological impacts of air pollution.
5. Conclusions
In conclusion, our findings indicate a potential association between daily ozone concentrations and daily mortality, with short-term effects in suburban and rural areas and with higher risk compared to those previously reported for urban areas. These results underscore the urgent need for rapid and effective interventions to mitigate ozone exposure and safeguard public health. The implementation of stringent environmental policies and the promotion of health-conscious behaviors can substantially contribute to the reduction of mortality linked to air pollution.
Supplementary Materials
The following supporting information can be downloaded at: https://www.mdpi.com/article/10.3390/atmos16050625/s1, Table S1: RR, 95%CI and p-value (P) for all-cause mortality; Table S2: RR, 95%CI and p-value (P) for cardiovascular mortality; Table S3: RR, 95%CI and p-value (P) for respiratory mortality.
Author Contributions
Conceptualization, R.R. and M.A.D.; methodology, R.R.; formal analysis, M.A.D.; data curation, J.R.M.F. and M.A.D.; writing—original draft preparation, M.A.D.; writing—review and editing, ALL; visualization, M.A.D.; supervision, R.R.; funding acquisition, B.N.-C. and R.R. All authors have read and agreed to the published version of the manuscript.
Funding
This research was funded by European Union H2020, grant number 945391, and Horizon, 101157269.
Institutional Review Board Statement
Not applicable.
Informed Consent Statement
Not applicable.
Data Availability Statement
Restrictions apply to the availability of these data. Data were obtained from Spanish National Statistics Institute (INE) www.ine.es (accessed on 31 March 2025).
Conflicts of Interest
The authors declare no conflicts of interest.
Abbreviations
The following abbreviations are used in this manuscript:
| INE | National Statistics Institute [Instituto Nacional de Estadística] |
| ICD | International Classification of Diseases |
| AEMET | Spanish Meteorological Agency [Agencia Estatatal de Meteorología] |
References
- Moeini, O.; Tarasick, D.W.; McElroy, C.T.; Liu, J.; Osman, M.K.; Thompson, A.M.; Parrington, M.; Palmer, P.I.; Johnson, B.; Oltmans, S.J.; et al. Estimating Wildfire-Generated Ozone over North America Using Ozonesonde Profiles and a Differential Back Trajectory Technique. Atmos. Environ. X 2020, 7, 100078. [Google Scholar] [CrossRef]
- Zhang, J.; Wei, Y.; Fang, Z. Ozone Pollution: A Major Health Hazard Worldwide. Front. Immunol. 2019, 10, 2518. [Google Scholar] [CrossRef]
- Butler, T.; Lupascu, A.; Nalam, A. Attribution of Ground-Level Ozone to Anthropogenic and Natural Sources of Nitrogen Oxides and Reactive Carbon in a Global Chemical Transport Model. Atmos. Chem. Phys. 2020, 20, 10707–10731. [Google Scholar] [CrossRef]
- Qu, K.; Yan, Y.; Wang, X.; Jin, X.; Vrekoussis, M.; Kanakidou, M.; Brasseur, G.P.; Lin, T.; Xiao, T.; Cai, X.; et al. The Effect of Cross-Regional Transport on Ozone and Particulate Matter Pollution in China: A Review of Methodology and Current Knowledge. Sci. Total Environ. 2024, 947, 174196. [Google Scholar] [CrossRef] [PubMed]
- Holloway, T.; Fiore, A.; Hastings, M.G. Intercontinental Transport of Air Pollution: Will Emerging Science Lead to a New Hemispheric Treaty? Environ. Sci. Technol. 2003, 37, 4535–4542. [Google Scholar] [CrossRef] [PubMed][Green Version]
- García, M.Á.; Villanueva, J.; Pardo, N.; Pérez, I.A.; Sánchez, M.L. Analysis of Ozone Concentrations between 2002–2020 in Urban Air in Northern Spain. Atmosphere 2021, 12, 1495. [Google Scholar] [CrossRef]
- Nguyen, D.-H.; Lin, C.; Vu, C.-T.; Cheruiyot, N.K.; Nguyen, M.K.; Le, T.H.; Lukkhasorn, W.; Vo, T.-D.-H.; Bui, X.-T. Tropospheric Ozone and NOx: A Review of Worldwide Variation and Meteorological Influences. Environ. Technol. Innov. 2022, 28, 102809. [Google Scholar] [CrossRef]
- European Environment Agency. Annex 2. Phenomenology of Ozone Concentrations. Available online: https://www.eea.europa.eu/en/analysis/publications/c1i92-9167-123-1/page008.html (accessed on 31 March 2025).
- Petetin, H.; Thouret, V.; Athier, G.; Blot, R.; Boulanger, D.; Cousin, J.-M.; Gaudel, A.; Nédélec, P.; Cooper, O. Diurnal Cycle of Ozone Throughout the Troposphere over Frankfurt as Measured by MOZAIC-IAGOS Commercial Aircraft. Elem. Sci. Anthr. 2016, 4, 000129. [Google Scholar] [CrossRef]
- Bernier, C.; Wang, Y.; Estes, M.; Lei, R.; Jia, B.; Wang, S.C.; Sun, J. Clustering Surface Ozone Diurnal Cycles to Understand the Impact of Circulation Patterns in Houston, TX. J. Geophys. Res. Atmos. 2019, 124, 13457–13474. [Google Scholar] [CrossRef]
- European Environment Agency. Europe’s Air Quality Status 2023. Available online: https://www.eea.europa.eu/publications/europes-air-quality-status-2023/europes-air-quality-status2023 (accessed on 31 March 2025).
- Zhao, T.; Markevych, I.; Fuertes, E.; de Hoogh, K.; Accordini, S.; Boudier, A.; Casas, L.; Forsberg, B.; Aymerich, J.G.; Gnesi, M.; et al. Impact of Long-Term Exposure to Ambient Ozone on Lung Function over a Course of 20 Years [The ECRHS Study]: A Prospective Cohort Study in Adults. Lancet Reg. Health Eur. 2023, 34, 100729. [Google Scholar] [CrossRef]
- Jerrett, M.; Burnett, R.T.; Pope, C.A., III; Ito, K.; Thurston, G.; Krewski, D.; Shi, Y.; Calle, E.; Thun, M. Long-Term Ozone Exposure and Mortality. N. Engl. J. Med. 2009, 360, 1085–1095. [Google Scholar] [CrossRef] [PubMed]
- Lim, C.C.; Hayes, R.B.; Ahn, J.; Shao, Y.; Silverman, D.T.; Jones, R.R.; García, C.; Bell, M.L.; Thurston, G.D. Long-Term Exposure to Ozone and Cause-Specific Mortality Risk in the United States. Am. J. Respir. Crit. Care Med. 2019, 200, 1022–1031. [Google Scholar] [CrossRef] [PubMed]
- Wang, Y.; Cao, R.; Xu, Z.; Jin, J.; Wang, J.; Yang, T.; Wei, J.; Huang, J.; Li, G. Long-Term Exposure to Ozone and Diabetes Incidence: A Longitudinal Cohort Study in China. Sci. Total Environ. 2022, 816, 151634. [Google Scholar] [CrossRef] [PubMed]
- Zhan, Q.; Meng, X.; Wang, H.; Yu, Y.; Su, X.; Huang, Y.; Yu, L.; Du, Y.; Zhang, F.; An, Q.; et al. Long-Term Low-Level Ozone Exposure and the Incidence of Type 2 Diabetes Mellitus and Glycemic Levels: A Prospective Cohort Study from Southwest China. Ecotoxicol. Environ. Saf. 2025, 293, 118028. [Google Scholar] [CrossRef]
- Yu, S.; Zhang, M.; Zhu, J.; Yang, X.; Bigambo, F.M.; Snijders, A.M.; Wang, X.; Hu, W.; Lv, W.; Xia, Y. The Effect of Ambient Ozone Exposure on Three Types of Diabetes: A Meta-Analysis. Environ. Health 2023, 22, 32. [Google Scholar] [CrossRef]
- Kim, E.; Huh, H.; Mo, Y.; Park, J.Y.; Jung, J.; Lee, H.; Kim, S.; Kim, D.K.; Kim, Y.S.; Lim, C.S.; et al. Long-Term Ozone Exposure and Mortality in Patients with Chronic Kidney Disease: A Large Cohort Study. BMC Nephrol. 2024, 25, 74. [Google Scholar] [CrossRef]
- U.S. Environmental Protection Agency. Health Effects of Ozone in the General Population. Available online: https://www.epa.gov/ozone-pollution-and-your-patients-health/health-effects-ozone-general-population (accessed on 1 April 2025).
- Vicedo-Cabrera, A.M.; Sera, F.; Liu, C.; Armstrong, B.; Milojevic, A.; Guo, Y.; Tong, S.; Lavigne, E.; Kyselý, J.; Urban, A.; et al. Short Term Association between Ozone and Mortality: Global Two Stage Time Series Study in 406 Locations in 20 Countries. BMJ 2020, 368, m108. [Google Scholar] [CrossRef]
- Bell, M.L.; McDermott, A.; Zeger, S.L.; Samet, J.M.; Dominici, F. Ozone and Short-Term Mortality in 95 US Urban Communities, 1987–2000. JAMA 2004, 292, 2372–2378. [Google Scholar] [CrossRef]
- Yin, P.; Chen, R.; Wang, L.; Meng, X.; Liu, C.; Niu, Y.; Lin, Z.; Liu, Y.; Liu, J.; Qi, J.; et al. Ambient Ozone Pollution and Daily Mortality: A Nationwide Study in 272 Chinese Cities. Environ. Health Perspect. 2017, 125, 117006. [Google Scholar] [CrossRef]
- Raza, A.; Dahlquist, M.; Lind, T.; Ljungman, P.L.S. Susceptibility to Short-Term Ozone Exposure and Cardiovascular and Respiratory Mortality by Previous Hospitalizations. Environ. Health 2018, 17, 37. [Google Scholar] [CrossRef]
- Zhang, X.; Yan, B.; Zhou, Y.; Osei, F.; Li, Y.; Zhao, H.; Cheng, C.; Stein, A. Short-term health impacts related to ozone in China before and after implementation of policy measures: A systematic review and meta-analysis. Sci. Total Environ. 2022, 847, 157588. [Google Scholar] [CrossRef]
- Air Pollution Accounted for 8.1 Million Deaths Globally in 2021, Becoming the Second Leading Risk Factor for Death, Including for Children Under 5 Years|Institute for Health Metrics and Evaluation. (n.d.). Available online: https://www.healthdata.org/news-events/newsroom/news-releases/air-pollution-accounted-81-million-deaths-globally-2021-becoming (accessed on 8 May 2025).
- Brauer, M.; Roth, G.A.; Aravkin, A.Y.; Zheng, P.; Abate, K.H.; Abate, Y.H.; Abbafati, C.; Abbasgholizadeh, R.; Abbasi, M.A.; Abbasian, M.; et al. Global burden and strength of evidence for 88 risk factors in 204 countries and 811 subnational locations, 1990–2021: A systematic analysis for the Global Burden of Disease Study 2021. Lancet 2024, 403, 2162–2203. [Google Scholar] [CrossRef]
- Sicard, P.; Agathokleous, E.; Anenberg, S.C.; De Marco, A.; Paoletti, E.; Calatayud, V. Trends in urban air pollution over the last two decades: A global perspective. Sci. Total Environ. 2023, 858, 160064. [Google Scholar] [CrossRef]
- Hu, W.; Yang, J. Effect of ambient ozone pollution on disease burden globally: A systematic analysis for the global burden of disease study 2019. Sci. Total Environ. 2024, 926, 171739. [Google Scholar] [CrossRef]
- Malashock, D.A.; DeLang, M.N.; Becker, J.S.; Serre, M.L.; West, J.J.; Chang, K.-L.; Cooper, O.R.; Anenberg, S.C. Estimates of ozone concentrations and attributable mortality in urban, peri-urban and rural areas worldwide in 2019. Environ. Res. Lett. 2022, 17, 054023. [Google Scholar] [CrossRef]
- Malashock, D.A.; Delang, M.N.; Becker, J.S.; Serre, M.L.; West, J.J.; Chang, K.-L.; Cooper, O.R.; Anenberg, S.C. Global trends in ozone concentration and attributable mortality for urban, peri-urban, and rural areas between 2000 and 2019: A modelling study. Lancet Planet. Health 2022, 6, e958–e967. [Google Scholar] [CrossRef]
- Achebak, H.; Garatachea, R.; Pay, M.T.; Jorba, O.; Guevara, M.; Pérez García-Pando, C.; Ballester, J. Geographic sources of ozone air pollution and mortality burden in Europe. Nat. Med. 2022, 30, 1732–1738. [Google Scholar] [CrossRef]
- Sicard, P.; Agathokleous, E.; De Marco, A.; Paoletti, E.; Calatayud, V. Urban population exposure to air pollution in Europe over the last decades. Environ. Sci. Eur. 2021, 33, 28. [Google Scholar] [CrossRef]
- Ministerio Para la Transición Ecológica y el Reto Demográfico. Gobierno de España. Evaluación de la Calidad del Aire en España (año 2022). 2023. Available online: https://www.miteco.gob.es/content/dam/miteco/es/calidad-y-evaluacion-ambiental/temas/atmosfera-y-calidad-del-aire/informeevaluacioncalidadaireespana2022_tcm30-590211.pdf (accessed on 3 April 2025).
- Salonen, H.; Salthammer, T.; Morawska, L. Human exposure to ozone in school and office indoor environments. Environ. Int. 2018, 119, 503–514. [Google Scholar] [CrossRef]
- Lin, C.; Ma, Y.; Liu, R.; Shao, Y.; Ma, Z.; Zhou, L.; Jing, Y.; Bell, M.L.; Chen, K. Associations between Short-Term Ambient Ozone Exposure and Cause-Specific Mortality in Rural and Urban Areas of Jiangsu, China. Environ. Res. 2022, 211, 113098. [Google Scholar] [CrossRef]
- Nelson, B.; Drysdale, W. Urban Ozone Trends in Europe and the USA (2000–2021). EGUsphere 2025, 2024–3743. [Google Scholar]
- Ballester, F.; Sáez, M.; Daponte, A.; Ordóñez, J.M.; Taracido, M.; Cambra, K.; Arribas, F.; Bellido, J.B.; Guillén, J.J.; Aguinaga, I.; et al. El proyecto EMECAS: Protocolo del estudio multicéntrico en España de los efectos a corto plazo de la contaminación atmosférica sobre la salud. Rev. Esp. Salud Pública 2005, 79, 229–242. [Google Scholar] [CrossRef]
- Díaz, J.; Ortiz, C.; Falcón, I.; Salvador, C.; Linares, C. Short-term effect of tropospheric ozone on daily mortality in Spain. Atmos. Environ. 2018, 187, 107–116. [Google Scholar] [CrossRef]
- Instituto Nacional de Estadística [INE]. Instituto Nacional de Estadística—INE. Available online: https://www.ine.es/ (accessed on 1 April 2025).
- Ley 7/1985, de 2 de Abril, Reguladora de las Bases del Régimen Local. Boletín Oficial del Estado, núm. 80, 3 de abril de 1985, pp. 8945–8964. Available online: https://www.boe.es/buscar/act.php?id=BOE-A-1985-5392 (accessed on 2 April 2025).
- Organización Mundial de la Salud. Clasificación Internacional de Enfermedades [CIE-10]. Available online: https://www.who.int/classifications/icd/en/ (accessed on 2 April 2025).
- Real Decreto 102/2011, de 28 de Enero, Relativo a la Mejora de la Calidad del Aire. Boletín Oficial del Estado, núm. 25, 29 de Enero de 2011, pp. 9574–9613. Available online: https://www.boe.es/buscar/act.php?id=BOE-A-2011-1645 (accessed on 2 April 2025).
- Ministerio para la Transición Ecológica y el Reto Demográfico. Ministerio para la Transición Ecológica y el Reto Demográfico; Gobierno de España: Madrid, España. Available online: https://www.miteco.gob.es/es.html (accessed on 3 April 2025).
- Coates, J.; Mar, K.A.; Ojha, N.; Butler, T.M. The Influence of Temperature on Ozone Production under Varying NOx Conditions—A Modelling Study. Atmos. Chem. Phys. 2016, 16, 11601–11615. [Google Scholar] [CrossRef]
- Zhang, X.; Waugh, D.W.; Kerr, G.H.; Miller, S.M. Surface Ozone-Temperature Relationship: The Meridional Gradient Ratio Approximation. Geophys. Res. Lett. 2022, 49, e2022GL098680. [Google Scholar] [CrossRef]
- Agencia Estatal de Meteorología. Agencia Estatal de Meteorología—AEMET. Gobierno de España. Available online: https://www.aemet.es/es/portada (accessed on 3 April 2025).
- Chiusolo, M.; Cadum, E.; Stafoggia, M.; Galassi, C.; Berti, G.; Faustini, A.; Bisanti, L.; Vigotti, M.A.; Dessì, M.P.; Cernigliaro, A.; et al. Short-Term Effects of Nitrogen Dioxide on Mortality and Susceptibility Factors in 10 Italian Cities: The EpiAir Study. Environ. Health Perspect. 2011, 119, 1233–1238. [Google Scholar] [CrossRef]
- Fu, J.; Fei, F.; Wang, S.; Zhao, Q.; Yang, X.; Zhong, J.; Hu, K. Short-Term Effects of Fine Particulate Matter Constituents on Mortality Considering the Mortality Displacement in Zhejiang Province, China. J. Hazard. Mater. 2023, 457, 131723. [Google Scholar] [CrossRef]
- Stafoggia, M.; Bellander, T. Short-Term Effects of Air Pollutants on Daily Mortality in the Stockholm County—A Spatiotemporal Analysis. Environ. Res. 2020, 188, 109854. [Google Scholar] [CrossRef]
- Chen, K.; Zhou, L.; Chen, X.; Bi, J.; Kinney, P.L. Acute Effect of Ozone Exposure on Daily Mortality in Seven Cities of Jiangsu Province, China: No Clear Evidence for Threshold. Environ. Res. 2017, 155, 235–241. [Google Scholar] [CrossRef] [PubMed]
- Ozone and Daily Mortality Rate in 21 Cities of East Asia: How Does Season Modify the Association? Am. J. Epidemiol. 2014, 180, 729–739. [CrossRef]
- Day, D.B.; Xiang, J.; Mo, J.; Li, F.; Chung, M.; Gong, J.; Weschler, C.J.; Ohman-Strickland, P.A.; Sundell, J.; Weng, W.; et al. Association of Ozone Exposure With Cardiorespiratory Pathophysiologic Mechanisms in Healthy Adults. JAMA Intern. Med. 2017, 177, 1344–1353. [Google Scholar] [CrossRef]
- Mirowsky, J.E.; Carraway, M.S.; Dhingra, R.; Tong, H.; Neas, L.; Diaz-Sanchez, D.; Cascio, W.; Case, M.; Crooks, J.; Hauser, E.R.; et al. Ozone Exposure Is Associated with Acute Changes in Inflammation, Fibrinolysis, and Endothelial Cell Function in Coronary Artery Disease Patients. Environ. Health 2017, 16, 126. [Google Scholar] [CrossRef] [PubMed]
- Guo, X.; Su, W.; Wang, H.; Li, N.; Song, Q.; Liang, Q.; Sun, C.; Liang, M.; Zhou, Z.; Song, E.J.; et al. Short-Term Exposure to Ambient Ozone and Cardiovascular Mortality in China: A Systematic Review and Meta-Analysis. Int. J. Environ. Health Res. 2023, 33, 958–975. [Google Scholar] [CrossRef]
- Chen, C.; Li, T.; Sun, Q.; Shi, W.; He, M.Z.; Wang, J.; Liu, J.; Zhang, M.; Jiang, Q.; Wang, M.; et al. Short-Term Exposure to Ozone and Cause-Specific Mortality Risks and Thresholds in China: Evidence from Nationally Representative Data, 2013–2018. Environ. Int. 2023, 171, 107666. [Google Scholar] [CrossRef]
- Wu, H.; Lu, K.; Fu, J. A Time-Series Study for Effects of Ozone on Respiratory Mortality and Cardiovascular Mortality in Nanchang, Jiangxi Province, China. Front. Public Health 2022, 10, 864537. [Google Scholar] [CrossRef]
- Cortes, T.R.; Silveira, I.H.; de Oliveira, B.F.A.; Bell, M.L.; Junger, W.L. Short-Term Association Between Ambient Air Pollution and Cardio-Respiratory Mortality in Rio de Janeiro, Brazil. PLoS ONE 2023, 18, e0281499. [Google Scholar] [CrossRef]
- Wang, T.; Wang, J.; Sun, L.; Deng, Y.; Xiang, Y.; Wang, Y.; Chen, J.; Peng, W.; Cui, Y.; He, M. Effect of Ozone Exposure on Cardiovascular and Cerebrovascular Disease Mortality in the Elderly. Toxics 2025, 13, 184. [Google Scholar] [CrossRef]
- Devlin, R.B.; McDonnell, W.F.; Mann, R.; Becker, S.; House, D.E.; Schreinemachers, D.; Koren, H.S. Exposure of Humans to Ambient Levels of Ozone for 6.6 Hours Causes Cellular and Biochemical Changes in the Lung. Am. J. Respir. Cell Mol. Biol. 1991, 4, 72–81. [Google Scholar] [CrossRef]
- Zhang, Y.; West, J.J.; Emmons, L.K.; Flemming, J.; Jonson, J.E.; Lund, M.T.; Sekiya, T.; Sudo, K.; Gaudel, A.; Chang, K.L.; et al. Contributions of World Regions to the Global Tropospheric Ozone Burden Change From 1980 to 2010. Geophys. Res. Lett. 2021, 48, e2020GL089184. [Google Scholar] [CrossRef]
- Centers for Disease Control and Prevention [CDC]. About Tobacco Use and Prevention. Available online: https://www.cdc.gov/tobacco/about/index.html (accessed on 6 April 2025).
Disclaimer/Publisher’s Note: The statements, opinions and data contained in all publications are solely those of the individual author(s) and contributor(s) and not of MDPI and/or the editor(s). MDPI and/or the editor(s) disclaim responsibility for any injury to people or property resulting from any ideas, methods, instructions or products referred to in the content. |
© 2025 by the authors. Licensee MDPI, Basel, Switzerland. This article is an open access article distributed under the terms and conditions of the Creative Commons Attribution (CC BY) license (https://creativecommons.org/licenses/by/4.0/).

