Article

A Monitoring and Sampling Platform for Air Pollutants on a Rotary-Wing Unmanned Aerial Vehicle: Development and Application

1
College of Architecture and Environment, Sichuan University, Chengdu 610065, China
2
College of Carbon Neutrality Future Technology, Sichuan University, Chengdu 610065, China
3
Yibin Institute of Industrial Technology, Sichuan University Yibin Park, Yibin 644000, China
4
Chengdu Academy of Environmental Science, Chengdu 610072, China
5
Sichuan Province Suining Ecological Environment Monitoring Center Station, Suining 629000, China
*
Authors to whom correspondence should be addressed.
Atmosphere 2025, 16(5), 613; https://doi.org/10.3390/atmos16050613
Submission received: 19 April 2025 / Revised: 11 May 2025 / Accepted: 15 May 2025 / Published: 17 May 2025

Abstract

Complex air pollution, including particulate matter and ozone, is a significant environmental issue in China, with volatile organic compounds (VOCs) as key precursors. Traditional ground-based monitoring methods struggle to capture the vertical distribution and changes of pollutants in the troposphere. To address this, we developed a vertical monitoring and sampling platform using a quadcopter unmanned aerial vehicle (UAV). The platform, equipped with lightweight quartz sampling canisters and miniaturized sensors, collects air samples for VOC analysis and vertical data on meteorological parameters and particulate matter. Performance tests showed the quartz canisters had less than 15% adsorption loss, with sample storage stability exceeding 80% over three days. Sensor data showed strong correlations with standard instruments (R2 > 0.80). Computational fluid dynamics simulations optimized the sampler’s inlet position and ascertained that ascending flight mitigates rotor-induced air recirculation. Field campaigns were conducted at six sites along the Chengdu Metropolitan Circle Ring Expressway. Vertical data from 0~300 m revealed particulate matter concentrations peaked at 50~70 m. Near-surface VOCs were dominated by alkanes, while aromatics were found concentrated at 150~250 m, indicating significant regional transport influences. The results confirmed the platform’s effectiveness for pollutant distribution analysis.

1. Introduction

With the rapid acceleration of urbanization and the expanding scope of human activities, complex pollution formed by fine particulate matter (PM2.5) and ozone (O3) has become a critical factor constraining improvements in ambient air quality [1] and poses significant threats to ecosystems and human health [2,3]. Although traditional ground-based monitoring methods can provide localized pollutant concentration information, the behavior of atmospheric pollutants differs significantly across various altitude layers, with their transport, dispersion, transformation, and deposition processes being influenced by a combination of meteorological conditions, topography, and chemical reactions [4,5,6,7,8]. This provides crucial insights for studying the vertical structure of pollutants within the atmospheric boundary layer, vertical fluxes, and the pathways of pollutant transport in the atmosphere [9,10,11].
Volatile organic compounds (VOCs) are key precursors of tropospheric ozone and secondary organic aerosols [12]. Their vertical distribution characteristics directly influence the formation mechanisms of regional air pollution and the development of mitigation strategies [9,13]. The vertical distribution of VOCs within the atmospheric boundary layer is not uniform. It is influenced by various factors, including the type and intensity of pollution sources, vertical turbulent mixing, horizontal transport, and photochemical reactions [14,15]. Vertical observations reveal a general trend of decreasing VOC concentrations with increasing altitude. During the morning rush hour, increased vehicle emissions raise near-surface VOC concentrations. However, pollutants accumulated at the top of the boundary layer are diluted as the boundary layer rises. Notably, oxygenated VOCs (OVOCs) like formaldehyde and acetaldehyde can increase in concentration due to secondary formation processes [14,16,17]. When there are significant differences in regional ground pollution emissions, the chemical composition and reactivity of the emitted VOCs vary. Their vertical distribution in the troposphere also shows significant spatial differences due to reactions with other pollutants such as NOx and CO [15,18]. Research has found that VOC concentrations measured vertically are negatively correlated with their photochemical reaction activity. VOCs with high OH rate constants decrease more significantly in concentration with proximity to the ground compared to those with low OH rate constants [19]. The proportion of different VOC types varies with altitude. For example, the proportion of alkenes decreases with altitude, while the proportion of alkanes and aromatics increases [14]. Vertical observations also enable the analysis of the oxidation mechanisms of VOCs in the residual layer at night, enhancing our understanding of secondary pollutant formation [20]. The oxidative degradation of VOCs in the nighttime boundary layer is critical for maintaining ground-level air quality. Additionally, vertical monitoring of VOCs facilitates a comprehensive investigation into the characteristics of ozone formation sensitivity, thereby informing science-based strategies for ozone pollution control [21,22].
The vertical profile of air pollutants can be measured using various technologies, including tower observations, tethered balloons, aircraft, remote sensing, and unmanned aerial vehicles (UAVs). Tower observations can provide continuous data from the ground to heights of hundreds of meters at a relatively low cost. However, due to the fixed locations of the towers, the data may have limitations in representing the spatial distribution over a broader area [10,11,13]. Tethered balloons require a large operating space and are challenging to deploy in densely built or populated areas, and the equipment is susceptible to fluctuations in meteorological conditions [23,24,25,26,27,28]. Aircraft can overcome the height and location limitations encountered with tower and tethered balloon measurements. However, the exhaust emissions from aircraft engines may lead to cross-contamination with the air samples being collected [29,30,31,32]. Remote sensing, with its advantage of large-scale and continuous observation, can provide long-term, high spatiotemporal resolution data. Nevertheless, its accuracy can be affected by factors such as particulate matter and other species in the air. Moreover, it is currently mainly used to measure specific pollutants in the troposphere, such as formaldehyde, limiting the variety of VOCs that can be measured [33,34,35,36]. Multi-rotor UAVs, now under development as a novel monitoring platform, provide flexibility, convenience, and cost-effectiveness, allowing for operations at different altitudes and across complex terrains. This capability significantly enhances the study of vertical pollutant distribution [37,38]. In recent years, numerous studies have employed UAVs equipped with various portable monitoring instruments to conduct vertical observations of multiple atmospheric pollutants [39,40,41,42]. Related research utilized a hexacopter UAV equipped with a TSI SidePak AM510 aerosol monitor to perform detailed measurements of PM2.5 vertical distribution within the lower troposphere (below 1000 m) [42]. The results indicated a decreasing trend in PM2.5 concentrations with altitude, with a notably rapid decline observed between 200 and 500 m in the early morning compared to other altitude ranges. Some studies have utilized UAVs equipped with SUMMA canisters for vertical sampling, revealing that VOC concentrations peak at 327 ppbv (parts per billion by volume) at a height of 300 m due to temperature inversion [43]. Toluene and m/p-xylene have been identified as key species in the formation of secondary organic aerosols and ozone [14]. However, due to the payload limitations of UAVs, the traditional SUMMA canister sampling method cannot accommodate multiple canisters simultaneously, resulting in the collection of VOC samples from only a single altitude layer during each flight. Additionally, adsorption tubes and micro needle trap samplers (NTSs) have been employed for VOC sampling over forests in South China and in the Kaohsiung industrial park [44,45]. However, the reliance of adsorption tube sampling on material adsorption capacity limits the range of VOCs that can be effectively captured.
Compared to other UAV models, quadcopter UAVs feature a simple mechanical structure, lightweight design, and compact size, providing excellent maneuverability. This allows for rapid response and flexible sampling at various altitudes and locations [46]. Based on the performance characteristics of quadcopter UAVs, this study developed a system capable of carrying lightweight quartz sampling canisters for air sampling. By evaluating and calibrating meteorological and particulate matter sensor performance and simulating the vertical sampling flow field characteristics of the UAV, an atmospheric pollutant vertical monitoring and sampling platform was established. This platform was deployed at six sites along the Chengdu Metropolitan Circle Ring Expressway for vertical observations and sampling analyses of atmospheric particulate matter and VOCs. The collected data provided insights into the meteorological parameters, particulate matter concentrations, and VOC vertical distribution characteristics at the observation sites. Experimental results validated the platform’s practical applications, offering strong support for acquiring accurate vertical distribution data on atmospheric pollutants and enhancing the understanding of pollutant dispersion patterns.

2. Materials and Methods

2.1. Flight Platform

2.1.1. UAV Configuration

In this study, we utilized the DJI Matrice 300 RTK quadcopter UAV platform. This model has a weight of 6.3 kg and a rotor diameter of 533.4 mm, with a maximum payload capacity of 2.7 kg. Its extended rotor blades enhance flight stability and improve resistance to wind shear, allowing it to withstand wind speeds of up to 12 m/s. Additionally, the UAV can operate in environmental temperatures ranging from −20 °C to 50 °C. Key specifications of this UAV model are presented in Table S1. The UAV platform is equipped with a control module designed to ensure successful mission execution and flight safety. The integrated flight controller features a high-precision Global Positioning System (GPS) and an Inertial Measurement Unit (IMU), enabling precise navigation and hovering at designated locations while maintaining real-time communication with a handheld ground control station. Its positioning accuracy is ±0.5 m vertically and ±1 m horizontally. The navigation control system transmits airborne and ground signals via a 2.4 GHz radio link. The ground control station display provides real-time flight data, including altitude, latitude and longitude, flight speed, and battery voltage, facilitating power monitoring and timely diagnostics of the motors.

2.1.2. Ambient Air Quartz Sampling Canister

As illustrated in Figure S1, this study designed and fabricated an air sampling canister primarily composed of a quartz cylindrical chamber (SiO2 purity of 99.9%) and a sealing valve made of polytetrafluoroethylene (PTFE). The interior of the canister was polished to minimize active adsorption sites and reduce wall adsorption effects. The canister measures 14.1 cm in height, has an outer diameter of 8.3 cm, a wall thickness of 0.3 cm, and holds a volume of approximately 600 mL, with a total weight of about 244.2 g (including the sealing valve). Its lightweight design allows for the simultaneous collection of six canister samples during each flight mission. This makes the quartz sampling canister more suitable for UAV payload constraints than other sampling tools.
Prior to sampling, the Entech 3100D (Entech, Simi Valley, CA, USA) canister cleaning system was employed to purge the sampling canisters repeatedly with high-purity nitrogen. The internal pressure was reduced to near-vacuum levels (50 mTorr, approximately 7 Pa) to ensure optimal conditions for sample collection. To prevent degradation of the sample due to photochemical reactions, each canister was stored in a light-shielding foam box. A series of characterization experiments (detailed in Section 3.2, Performance Test of the Quartz Sampling Canister (Lianyungang Dongxin Quartz Products Co., Ltd., Lianyungang, China)) confirmed the suitability of the canisters for UAV-based sampling and subsequent offline analysis.

2.1.3. Sensor Selection

In this study, the BMP388 (DFROBOT, Shanghai, China) and the M702 seven-in-one sensor module (Shenzhen Shenchen Technology Co., Ltd., Shenzhen, China), were used to measure atmospheric pressure (P), temperature (T), relative humidity (RH), and particulate matter (PM2.5 and PM10). The BMP388, utilizing piezo-resistive technology, measures atmospheric pressure. The M702 seven-in-one sensor is a cost-effective digital serial output module that employs the UART serial level output mode, enabling simultaneous monitoring of temperature, relative humidity, PM2.5, and PM10. This module is well-suited for various air quality monitoring applications, offering excellent stability and high precision. Its technical specifications are provided in Table S2. Specifically, the PM2.5 and PM10 sensors in the M702 module are based on laser scattering principles. When air passes through the measurement chamber, suspended particles scatter the laser light. By collecting the scattered light at a specific angle, the sensor calculates the equivalent particle size and the number of particles of different sizes per unit volume using the Mie theory. The temperature sensor in the M702 module uses negative temperature coefficient thermistor technology, which measures temperature by detecting changes in the resistance of the thermistor with temperature. The humidity sensor employs Humidity-Induced Hydration technology, measuring humidity by detecting changes in the dielectric constant of a hygroscopic material. Additionally, the module demonstrates outstanding compatibility, allowing integration with various data acquisition systems and parameter devices. It can be paired with development boards such as Raspberry Pi and incorporated into wireless sensor modules like LoRa for remote data transmission and centralized management. Studies have shown that sensor performance varies among individual units, and environmental factors such as temperature and humidity significantly influence measurement results. Therefore, regular calibration is crucial [47,48,49]. To verify sensor stability and response performance, this study conducted comparative experiments using standard instrumentation data from the Chengdu Academy of Environmental Sciences. Detailed experimental methods and results are presented in Section 3.3, Sensor performance test and results.

2.1.4. Integration of the Sampling Equipment

As shown in Figure 1, the integrated schematic of the monitoring and sampling platform primarily includes a VOC sampling system (quartz canisters) and a sensor monitoring system (meteorological parameters and particulate matter sampling). The VOC sampling system consists of six quartz sampling canisters and six solenoid valves, with each canister connected to its corresponding solenoid valve via Teflon tubing. The solenoid valve switches are controlled by a ground-based controller. The sensor power switch is integrated into the circuit board and must be manually activated before takeoff. Both the solenoid valves and sensors are incorporated into a single circuit board, powered by a battery with a rated voltage of 24 V and a capacity of 200 mAh. The quartz sampling canisters are horizontally inserted into a light-blocking foam structure fixed beneath the UAV to prevent overheating due to direct sunlight exposure, ensuring the chemical stability of the VOC samples.

2.2. Offline Analysis of VOC Samples

The collected samples were analyzed within three days using an offline gas chromatography–mass spectrum-try/flame ionization detector (GC-MS/FID) system (Agilent, 7890B/5977B, Santa Clara, CA, USA). VOC analysis followed the TO-15 method outlined by the USEPA, with detailed procedures available in previous studies [50,51]. Briefly, the air samples were introduced via an automatic sampler and processed using the Entech 7200CTS (Simi Valley, CA, USA) pre-concentration system, which collected and pretreated samples from canisters filled with high-purity nitrogen, removing water vapor and carbon dioxide. The VOCs were carried by a helium carrier gas into the gas chromatography system for analysis. Ethane, ethylene, and acetylene were separated on one HP-Plot/Q + PT column (30 m × 0.32 mm × 20 µm, Agilent, J&W, Santa Clara, CA, USA) and detected by FID. The remaining compounds were separated on a DB-1 column (60 m × 0.25 mm × 1.0 µm, Agilent, J&W, Santa Clara, CA, USA) and analyzed by MS, with quantification performed using the external standard method. During the analysis, 20 mL of standard gas at 100 ppbv was added to the samples to correct the mass spectrometry response as internal standards. These standard gases (provided by NTRM, Chengdu, China) included bromochloromethane, chlorobenzene-d5, 4-bromofluorobenzene, and 1,4-difluorobenzene. The concentrations of VOC components were calculated using standard calibration curves, ensuring that the relative standard deviation (RFRSD) remained below 25%. Additionally, the method detection limits (MDL) were determined by conducting repeated tests on seven sample sets with a concentration of 2 ppbv. Further details are provided in Table S3 in the Supplementary Materials.

2.3. Computational Fluid Dynamics Simulation

During mission execution, multi-rotor UAVs are influenced by both internal and external factors, including variations in meteorological conditions such as wind speed and direction. These factors not only affect UAV flight stability but also significantly impact the accuracy and precision of onboard sensors and sampling data. Therefore, before determining the installation position of the sampling canisters on the UAV, it is necessary to verify whether the spatial scale of atmospheric mixing induced by the UAV rotors aligns with the natural mixing scale of the atmosphere during sampling [37]. Computational fluid dynamics (CFD) modeling is a commonly used method for assessing airflow mixing around UAVs by identifying regions with the weakest gas velocity [52,53]. In this study, CFD simulations of the atmospheric flow field surrounding a quadcopter UAV were performed using the Fluent module within the Ansys Workbench integrated engineering simulation software (Ansys 2022 R1). Post-processing tools were used for visualization and analysis of the results. The UAV model was constructed using Unigraphics NX and consists of four main components: the fuselage, arms, rotors, and mounted equipment. The UAV’s dimensions were obtained from the DJI official website, while detailed rotor specifications were measured directly. The mounted equipment was designed as a trapezoidal hexahedron structure located beneath the UAV, with a payload weight of 2.5 kg. All components were built as solid structures to reduce the number of mesh elements and facilitate subsequent calculations. Flow path extraction was performed using the Space Claim module in Ansys. The overall flow field was divided into two regions: a rotating domain and a stationary domain. A cylindrical rotating domain was defined around each rotor, with interface treatment applied to the contact surfaces. The total computational domain was set as a rectangular cuboid with dimensions of 3 m × 3 m × 4.229 m (length × width × height). Meshing was performed in Ansys, with refinements around the impellers to improve computational accuracy while simplifying the fuselage and support structures due to computer resource constraints. The rotating domain contained 900,000 mesh elements, with a total of 2.63 million mesh units and 2,466,932 nodes.
The study employed the Shear Stress Transfer (SST) k-ω turbulence model to calculate the viscous effects of the fluid. Originally proposed by Menter Menter [54], this model is based on the Reynolds-Averaged Navier–Stokes (RANS) equations to simulate turbulent flow processes. It models turbulence kinetic energy and turbulence dissipation rate while incorporating characteristics of both the boundary layer and free-stream regions to predict turbulence effects (The specific calculation formulas are provided in Text S1 [54,55,56,57,58,59]).

3. Results and Discussion

3.1. Performance Test of the Quartz Sampling Canister

Considering the potential loss of VOCs during air sample transportation and storage, a series of test experiments were conducted to evaluate the performance and suitability of the quartz canisters, ensuring data accuracy and reliability. Each sampling canister underwent airtightness testing, with results indicating that the internal pressure remained below 18 Pa over a five-day period. Additionally, the sampling canisters demonstrated low background levels that were consistent with the blank measurements obtained from the detection system.

3.1.1. Adsorption Loss Test

The loss mechanisms of VOCs in quartz sampling canisters mainly include three processes: physical adsorption, dissolution, and chemical reaction [60,61]. To further investigate these loss mechanisms and their impact on sampling accuracy, we randomly selected eight quartz sampling canisters (accounting for 9% of the total) and two SUMMA canisters (3.2 L, Entech, Simi Valley, CA, USA) for testing. To ensure uniform initial volume mixing ratios of VOCs in all samples, the same connector was used for gas distribution during the experiment. A standard gas mixture of 10 ppbv, including PAMS ozone precursors, aldehydes, and ketones, TO-15 compounds, and eight terpene ketone substances, totaling 123 compounds (see Table S3 for details), was introduced into the canisters. Subsequently, the samples in the canisters were analyzed using a GC-MS/FID system (Agilent 7890B/5977B, Santa Clara, CA, USA).
The adsorption losses of VOC standard gases on the inner walls of sampling canisters were quantitatively characterized using relative deviation (RD). The adsorption loss results for quartz canisters and SUMMA canisters are presented in Figure 2 and Table 1. Numerically, most compounds measured in both types of canisters exhibited concentrations close to 10 ppbv. However, adsorption losses varied between canister types. The signal variation ratio for most compounds was lower in quartz canisters compared to SUMMA canisters, indicating a smaller impact on measurement accuracy. For alkanes and alkenes, adsorption losses were minimal in both canister types, with signal variation ratios below 2%, though slightly higher in SUMMA canisters. Compared to SUMMA canisters, quartz canisters exhibited lower wall adsorption for halohydrocarbons (−1.82%) and aromatics (−0.30%). Overall, OVOCs were more susceptible to wall adsorption in both canister types, with higher loss rates observed, especially in SUMMA canisters. The 14 VOC species with the highest adsorption losses in quartz and SUMMA canisters are illustrated in Figure S2. Among them, compounds such as m-Tolualdehyde, naphthalene, 2-hexanone, β-pinene, benzaldehyde, 4-methyl-2-pentanone, trichlorofluoromethane, hexanal, and trichlorobenzene exhibited the most significant losses, exceeding 30%, while losses for other species remained below 20% (see Table S4 for details).

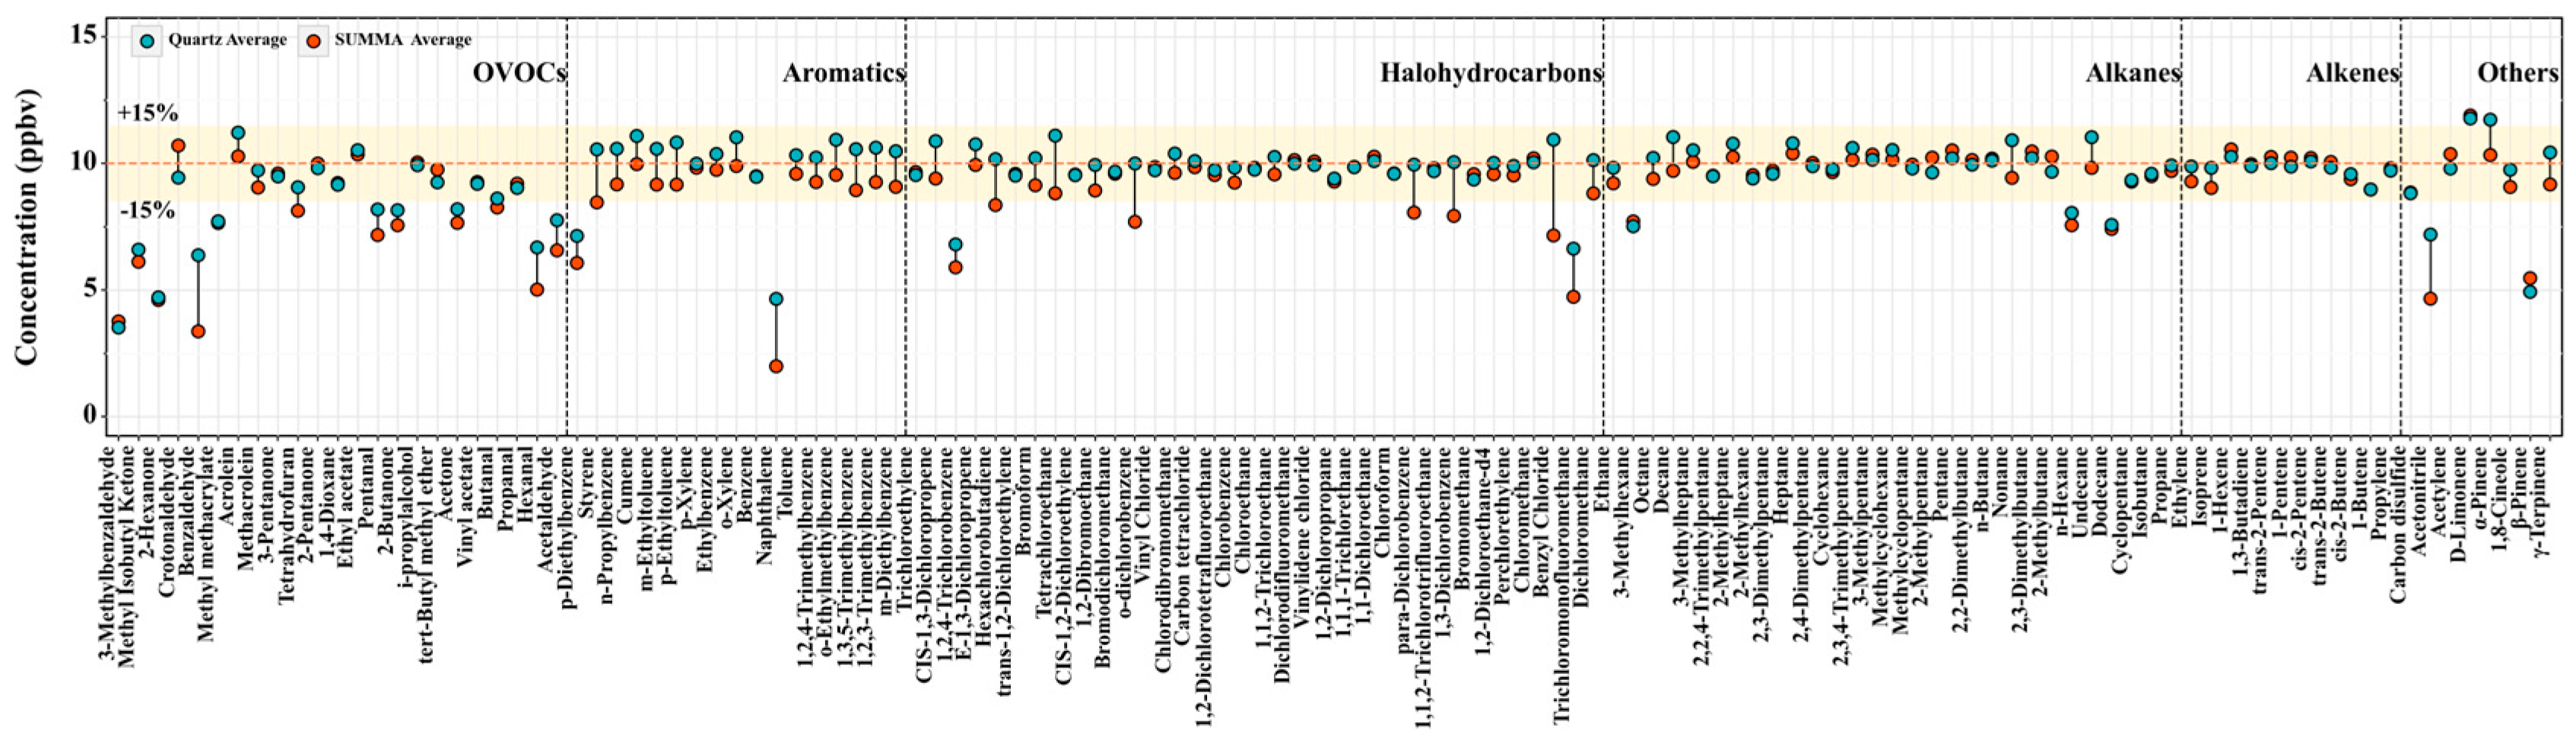
3.1.2. Canister Stability

Considering that sample collection, transportation, and analysis require time, target compounds may undergo decomposition or attenuation during storage, leading to discrepancies between measured values and original sampling concentrations. Therefore, this study conducted storage stability analyses of quartz canister samples at 0 days, 1 day, 2 days, and 3 days to evaluate canister storage performance. Additionally, SUMMA canister samples were analyzed at the same time intervals for comparison. Stability was defined as the variation in the volume mixing ratio of each VOC species measured on day 3 relative to day 0. Figure 3 illustrates the trend in average sample storage stability over three days.
The storage stability ranges of VOC samples in quartz and SUMMA canisters were 25.6~112.27% and 55.35~194.96%, respectively. A decreasing trend in sample storage stability was observed in quartz canisters over three days, with a significant decline on day 3. Compounds with lower chemical reactivity, such as low-carbon alkanes, benzene, and certain alkenes and halohydrocarbons, exhibited higher storage stability. However, the storage stability of aromatics declined rapidly over the three-day period. Overall, the average storage stability of all VOC species exceeded 80%. Certain VOC species demonstrated lower storage stability in quartz canisters (Figure S3), with limonene and eucalyptol exhibiting the lowest stability at 25.67% and 56.72%, respectively. The storage stability of C9~C10 compounds ranged from 70% to 80%. High-altitude atmospheric components primarily consist of low-carbon and mid-carbon VOCs, which are lightweight and can undergo long-range transport or secondary formation through photochemical reactions. In contrast, C9~C10 compounds (e.g., naphthalene) are primarily associated with industrial emissions, tend to remain near the surface due to their heavier mass, and settle quickly. Therefore, the lower storage stability of C9~C10 compounds does not significantly impact high-altitude sampling. For most VOC species, prompt analysis following sampling is essential, as longer time intervals introduce greater uncertainties in sample concentrations. Ensuring analysis within two days effectively minimizes such attenuation.

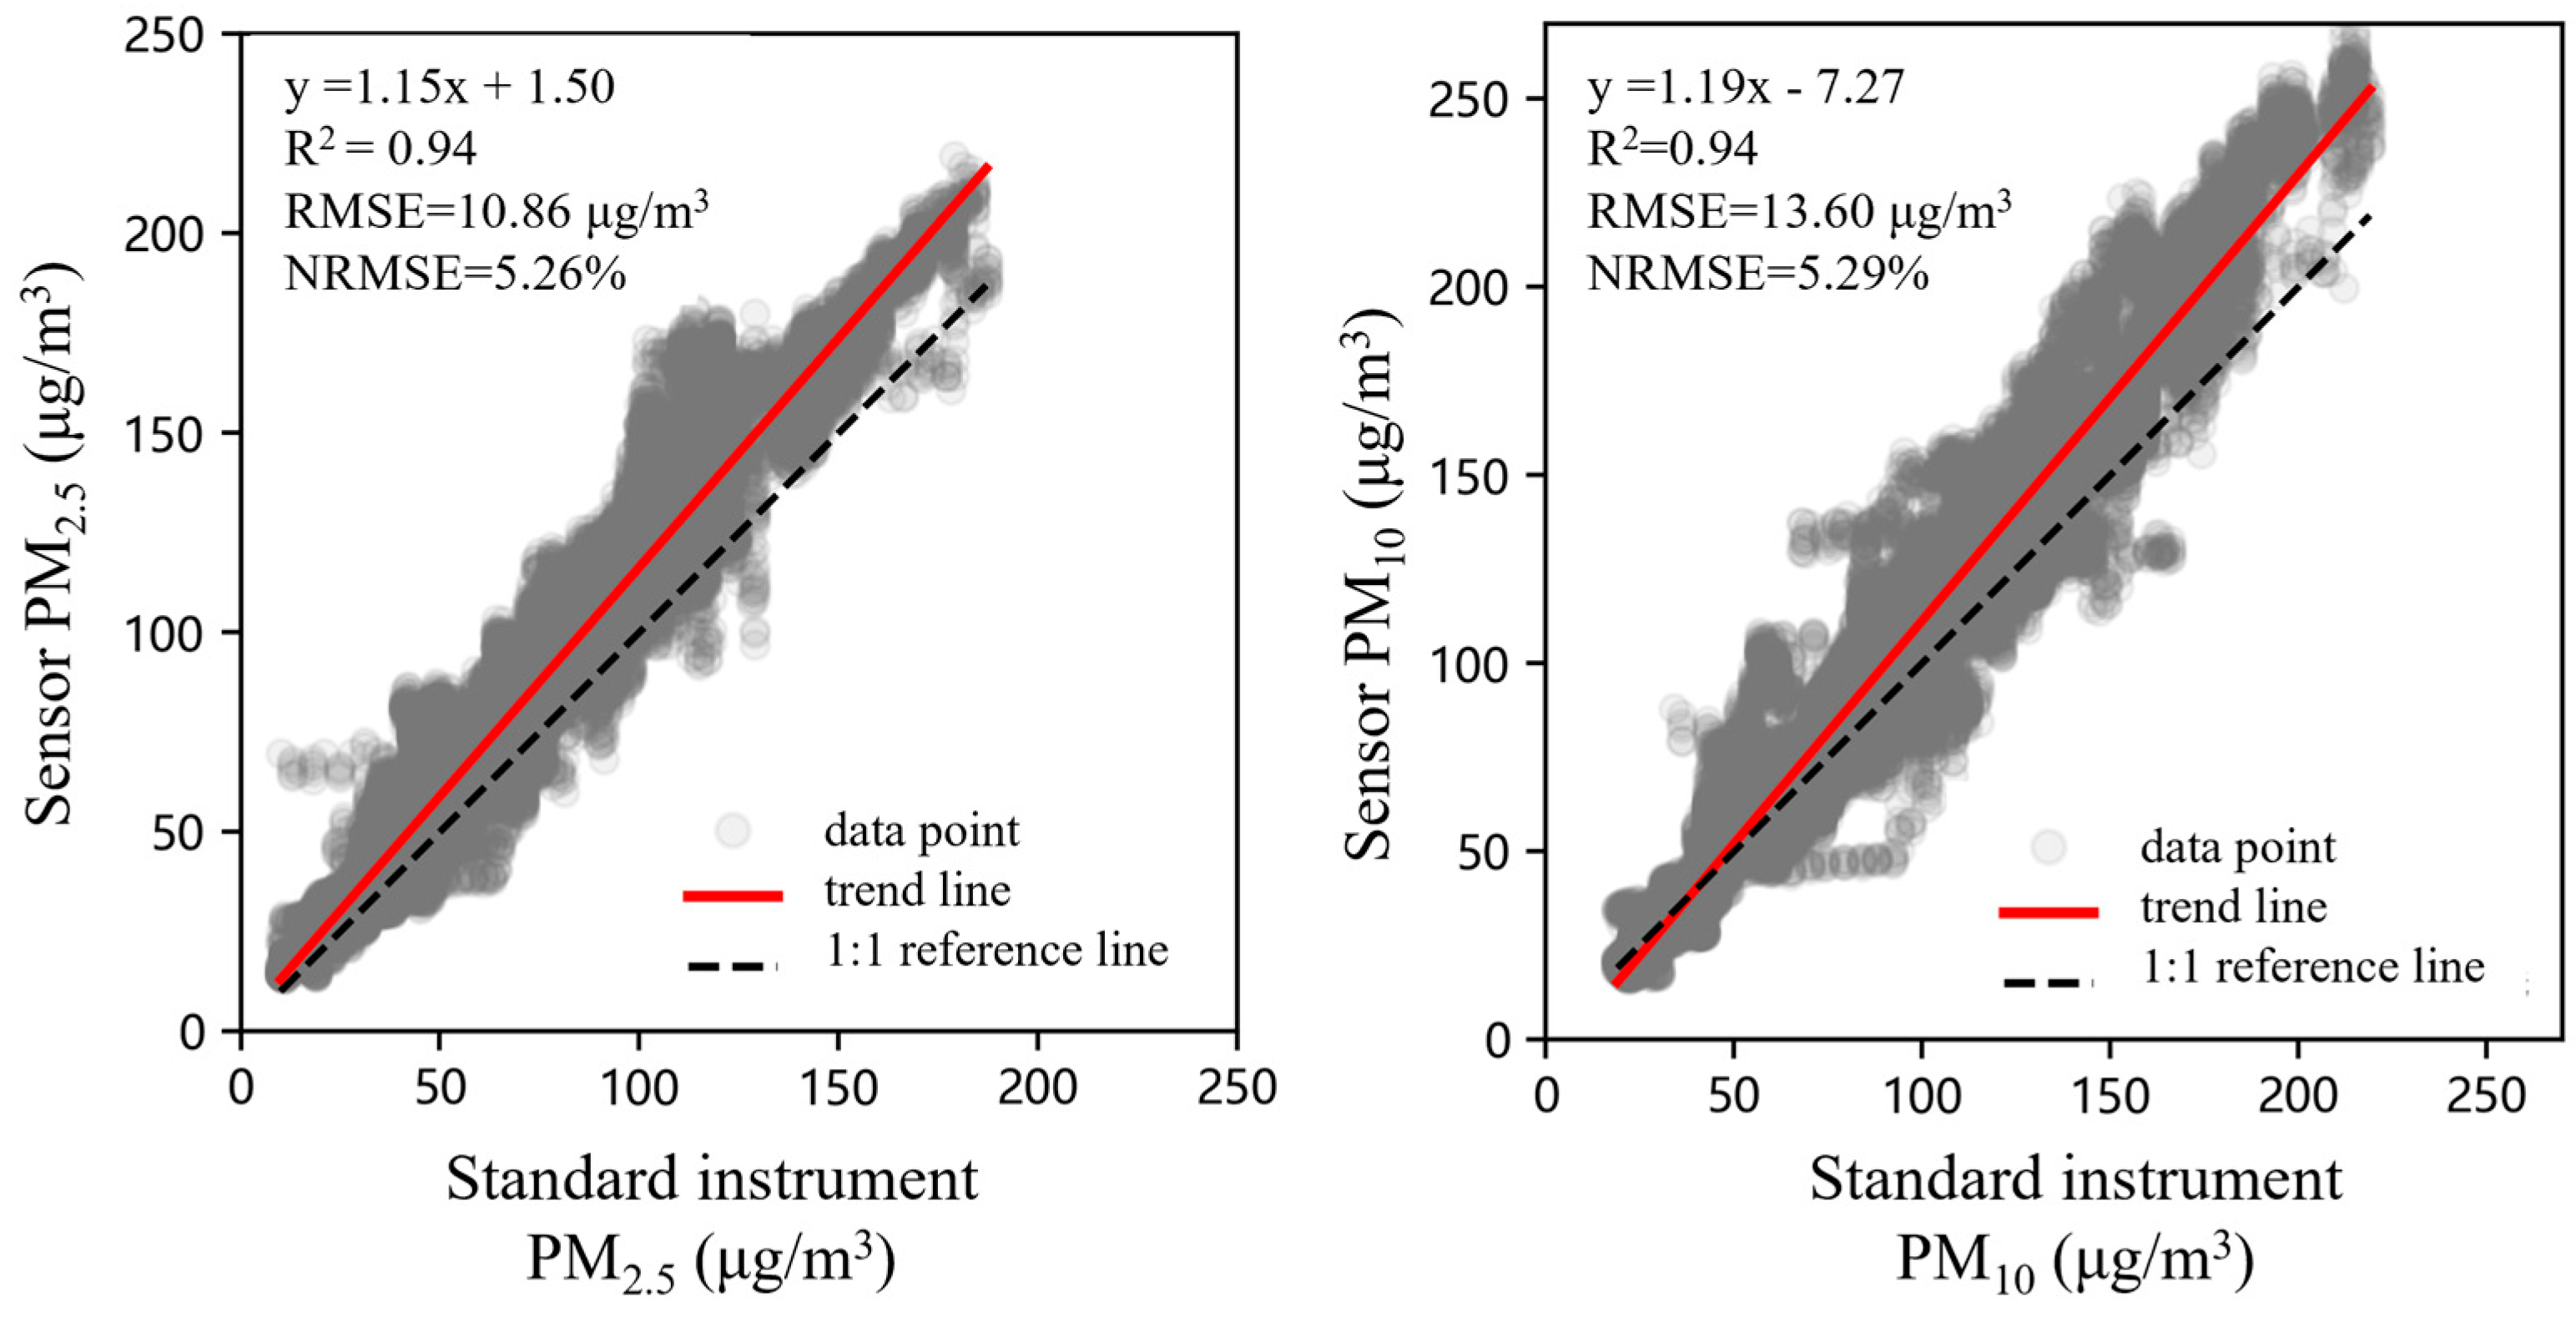
3.2. Sensor Performance Test and Results

This study utilizes sensors to monitor meteorological parameters (P, T, and RH) and particulate matter (PM2.5 and PM10) concentrations. To ensure the performance of these sensors, comparisons with measurements from standard instrument data were conducted during five distinct periods: July 30~August 1, September 1~4, November 19~23, December 11~14, and December 19~28, 2023. These measurements were carried out at the Supersite of the Chengdu Academy of Environmental Sciences (30°56′ N, 104°05′ E). The standard instruments for meteorological parameters (Lufft WS600-UMB, Fellbach, Germany) and particulate matter (Thermo Fisher TEOM 1405-F, Waltham, MA, USA), were applied. Figure S4 presents the time-series comparison of sensor outputs with the standard instrument measurements across five time periods. The results indicate that both the meteorological sensors and the particulate matter sensors exhibit strong predictive capability and stability, effectively reflecting the dynamic changes in environmental variables.
Figure S5 and Figure 4 present the regression fitting relating the sensor outputs to the standard instrument measurements along with the error metrics of the quantification model—the root means square error (RMSE) and the normalized root mean square error (NRMSE). The experimental data demonstrate a robust correlation between the sensor outputs and the standard measurements, with all R2 values exceeding 0.85. Because ambient atmospheric pressure exhibits minimal fluctuation, the pressure sensor showed a very high correlation with the standard instruments. Similarly, the temperature and relative humidity sensors performed well, with RMSE values of 1.76 °C and 4.26%, respectively. Regarding particulate matter monitoring, both PM2.5 and PM10 sensors demonstrated excellent correlation with the standard measurements, with R2 values of 0.94. The regression slopes for PM2.5 and PM10 were 1.15 and 1.19, respectively, indicating that the sensors systematically overestimate the concentrations, particularly for certain peak values. Additionally, the RMSE values for PM2.5 and PM10 were 10.86 μg/m3 and 13.60 μg/m3, respectively. In summary, the temporal fluctuations of the sensor signals are consistent with the measurements from the standard instruments, effectively capturing the overall trends in the environmental variables with correlation coefficients exceeding 0.85. The observed systematic overestimation issue can be addressed by revising the calibration curves.

3.3. Simulation of Sampling Flow Field of Four-Rotor UAV

To evaluate airflow disturbances around the UAV, simulations were conducted at rotor speeds of 5489 rpm, 2685 rpm, and 1500 rpm, representing ascent, hovering, and descent states, respectively. Figure 5a presents the velocity distribution cloud map of the UAV’s external flow field at a rotor speed of 2685 rpm.
The simulation results indicate that strong airflow is present directly beneath the UAV rotors in all three flight states, with maximum airspeeds of approximately 13.73 m/s, 6.74 m/s, and 4.02 m/s, respectively. In contrast, airflow around the payload is significantly weaker, with peak velocities of 2.75 m/s, 1.35 m/s, and 0.80 m/s, respectively, while airflow outside the UAV rotors remains largely undisturbed. Although the rotor speed is lower during descent compared to ascent, the UAV passes through its own wake while descending, causing air recirculation due to rotor-induced disturbances. This suggests that during descent, the payload may sample the same air volume multiple times. However, during ascent, the UAV moves away from its wake, minimizing vertical measurement errors and improving sampling accuracy.
Figure 5b illustrates the profile of atmospheric velocity along the z-axis from −2 m to +1.5 m. The results show that velocity initially decreases before increasing upward, with minimal airflow velocity between the payload and the UAV. Airflow speed gradually increases above the UAV. These findings confirm that placing the payload directly beneath the UAV fuselage is a viable approach, as the rotors are sufficiently distant from the UAV’s center (sampling inlet). The airflow beneath the UAV’s center is milder compared to the intense airflow directly under the rotors, experiencing minimal rotor-induced disturbances and weaker air currents.
CFD simulation results indicate that during ascent, despite the higher rotor speed, the UAV’s upward movement increases its altitude and distance from the wake generated along its previous flight path. As the UAV climbs, it moves out of the disturbed air region and enters a new area unaffected by its rotors, thereby reducing the wake’s influence on its current flight and sampling. This effectively prevents resampling of the same air volume, which could be caused by rotor-induced air disturbances during descent, thereby reducing measurement errors and ensuring the accuracy and reliability of the sampling data. Thus, it was determined that sampling would be conducted during the ascent phase. To minimize disturbances caused by the propellers, the sampling inlet was positioned between the UAV’s fuselage and the payload, where airflow velocity is lowest. Additionally, mounting the payload directly beneath the UAV fuselage enhances flight stability and ensures operational safety. Figure S6 displays a photograph of the fully assembled monitoring and sampling platform.

3.4. Field Experiments

3.4.1. Sampling Site

To evaluate the usability of the UAV-based vertical atmospheric pollutant monitoring and sampling platform, a field observation campaign was conducted on 23 September 2024 along the Chengdu Metropolitan Circle Ring Expressway. Six road junctions were selected as sampling sites (Figure S7): Xinchang (XC: 30°33.82′ N, 103°24.45′ E), Datong (DT: 30°25.84′ N, 103°21.41′ E), Shouanxi (SAX: 30°15.83′ N, 103°33.27′ E), Duoyue (DY: 30°09.54′ N, 103°43.00′ E), Meishanbei (MSB: 30°09.25′ N, 103°52.04′ E), and Heilongtan (HLT: 30°09.81′ N, 104°03.91′ E). The campaign lasted from 4:30 a.m. to 10:30 a.m. local time. During the 4:00~6:30 a.m. time window, the atmospheric boundary layer has not yet risen, resulting in weak vertical mixing of atmospheric pollutants. This condition facilitated the investigation of the accumulation characteristics of pollutants in the lower atmosphere and minimized the interference from daytime photochemical reactions.
During the drone’s ascent, real-time measurements of pressure, temperature, relative humidity, and particulate matter (PM2.5 and PM10) were conducted, using sensors to capture the vertical distribution characteristics of these parameters within the boundary layer. Additionally, fixed-point VOC sampling was performed at altitudes of 150 m and 250 m, and quartz canisters were also used to manually collect air samples at approximately 2 m above ground level, which served as reference data for comparative analysis with the aerial samples. Prior to each flight, all sensors underwent a preheating period of at least 30 min to ensure stable data acquisition. Table S5 lists the execution times for each flight mission and the boundary layer heights (BLH) at each sampling site during the sampling period. (The BLH data derived from ERA5, the fifth-generation global climate reanalysis dataset from ECMWF). All air samples were transported to the laboratory immediately after the campaign to prevent sample degradation.

3.4.2. Vertical Profile of Meteorological Parameters

Figure S8 illustrates the vertical variations in temperature and relative humidity at different altitudes across the six sampling sites. Except for HLT, temperatures at all sites gradually decreased with altitude, showing minimal overall variation within the range of 20 °C to 25 °C. The temperature difference between the ground and higher altitudes was approximately 4 °C, indicating stable stratification in the lower atmosphere. At the HLT sampling site, the ground temperature was 29 °C, while at 250 m it dropped to 23 °C, showing a larger temperature difference compared to other sites. This is likely because the sampling time was around 10:30 a.m., when traffic and human activities were more intensive and frequent than in the early morning, leading to a higher near-surface temperature at this site compared to others.
Regarding relative humidity, the XC, DT, DY, and MSB sampling sites exhibited a pattern of initially increasing and then decreasing with altitude, with this trend being most prominent at DT. The high relative humidity near the ground was likely associated with surface radiative cooling during the early morning hours, allowing water vapor to accumulate at lower temperatures. Additionally, the low nighttime boundary layer restricted the upward transport of water vapor, leading to higher humidity levels in the lower atmosphere. At the DT sampling site, relative humidity peaked at 70 m, possibly due to moisture transported by incoming air. At HLT, the ground-level relative humidity was approximately 70%, while at 250 m, it significantly increased to 90%, indicating a higher abundance of water vapor at higher altitudes.

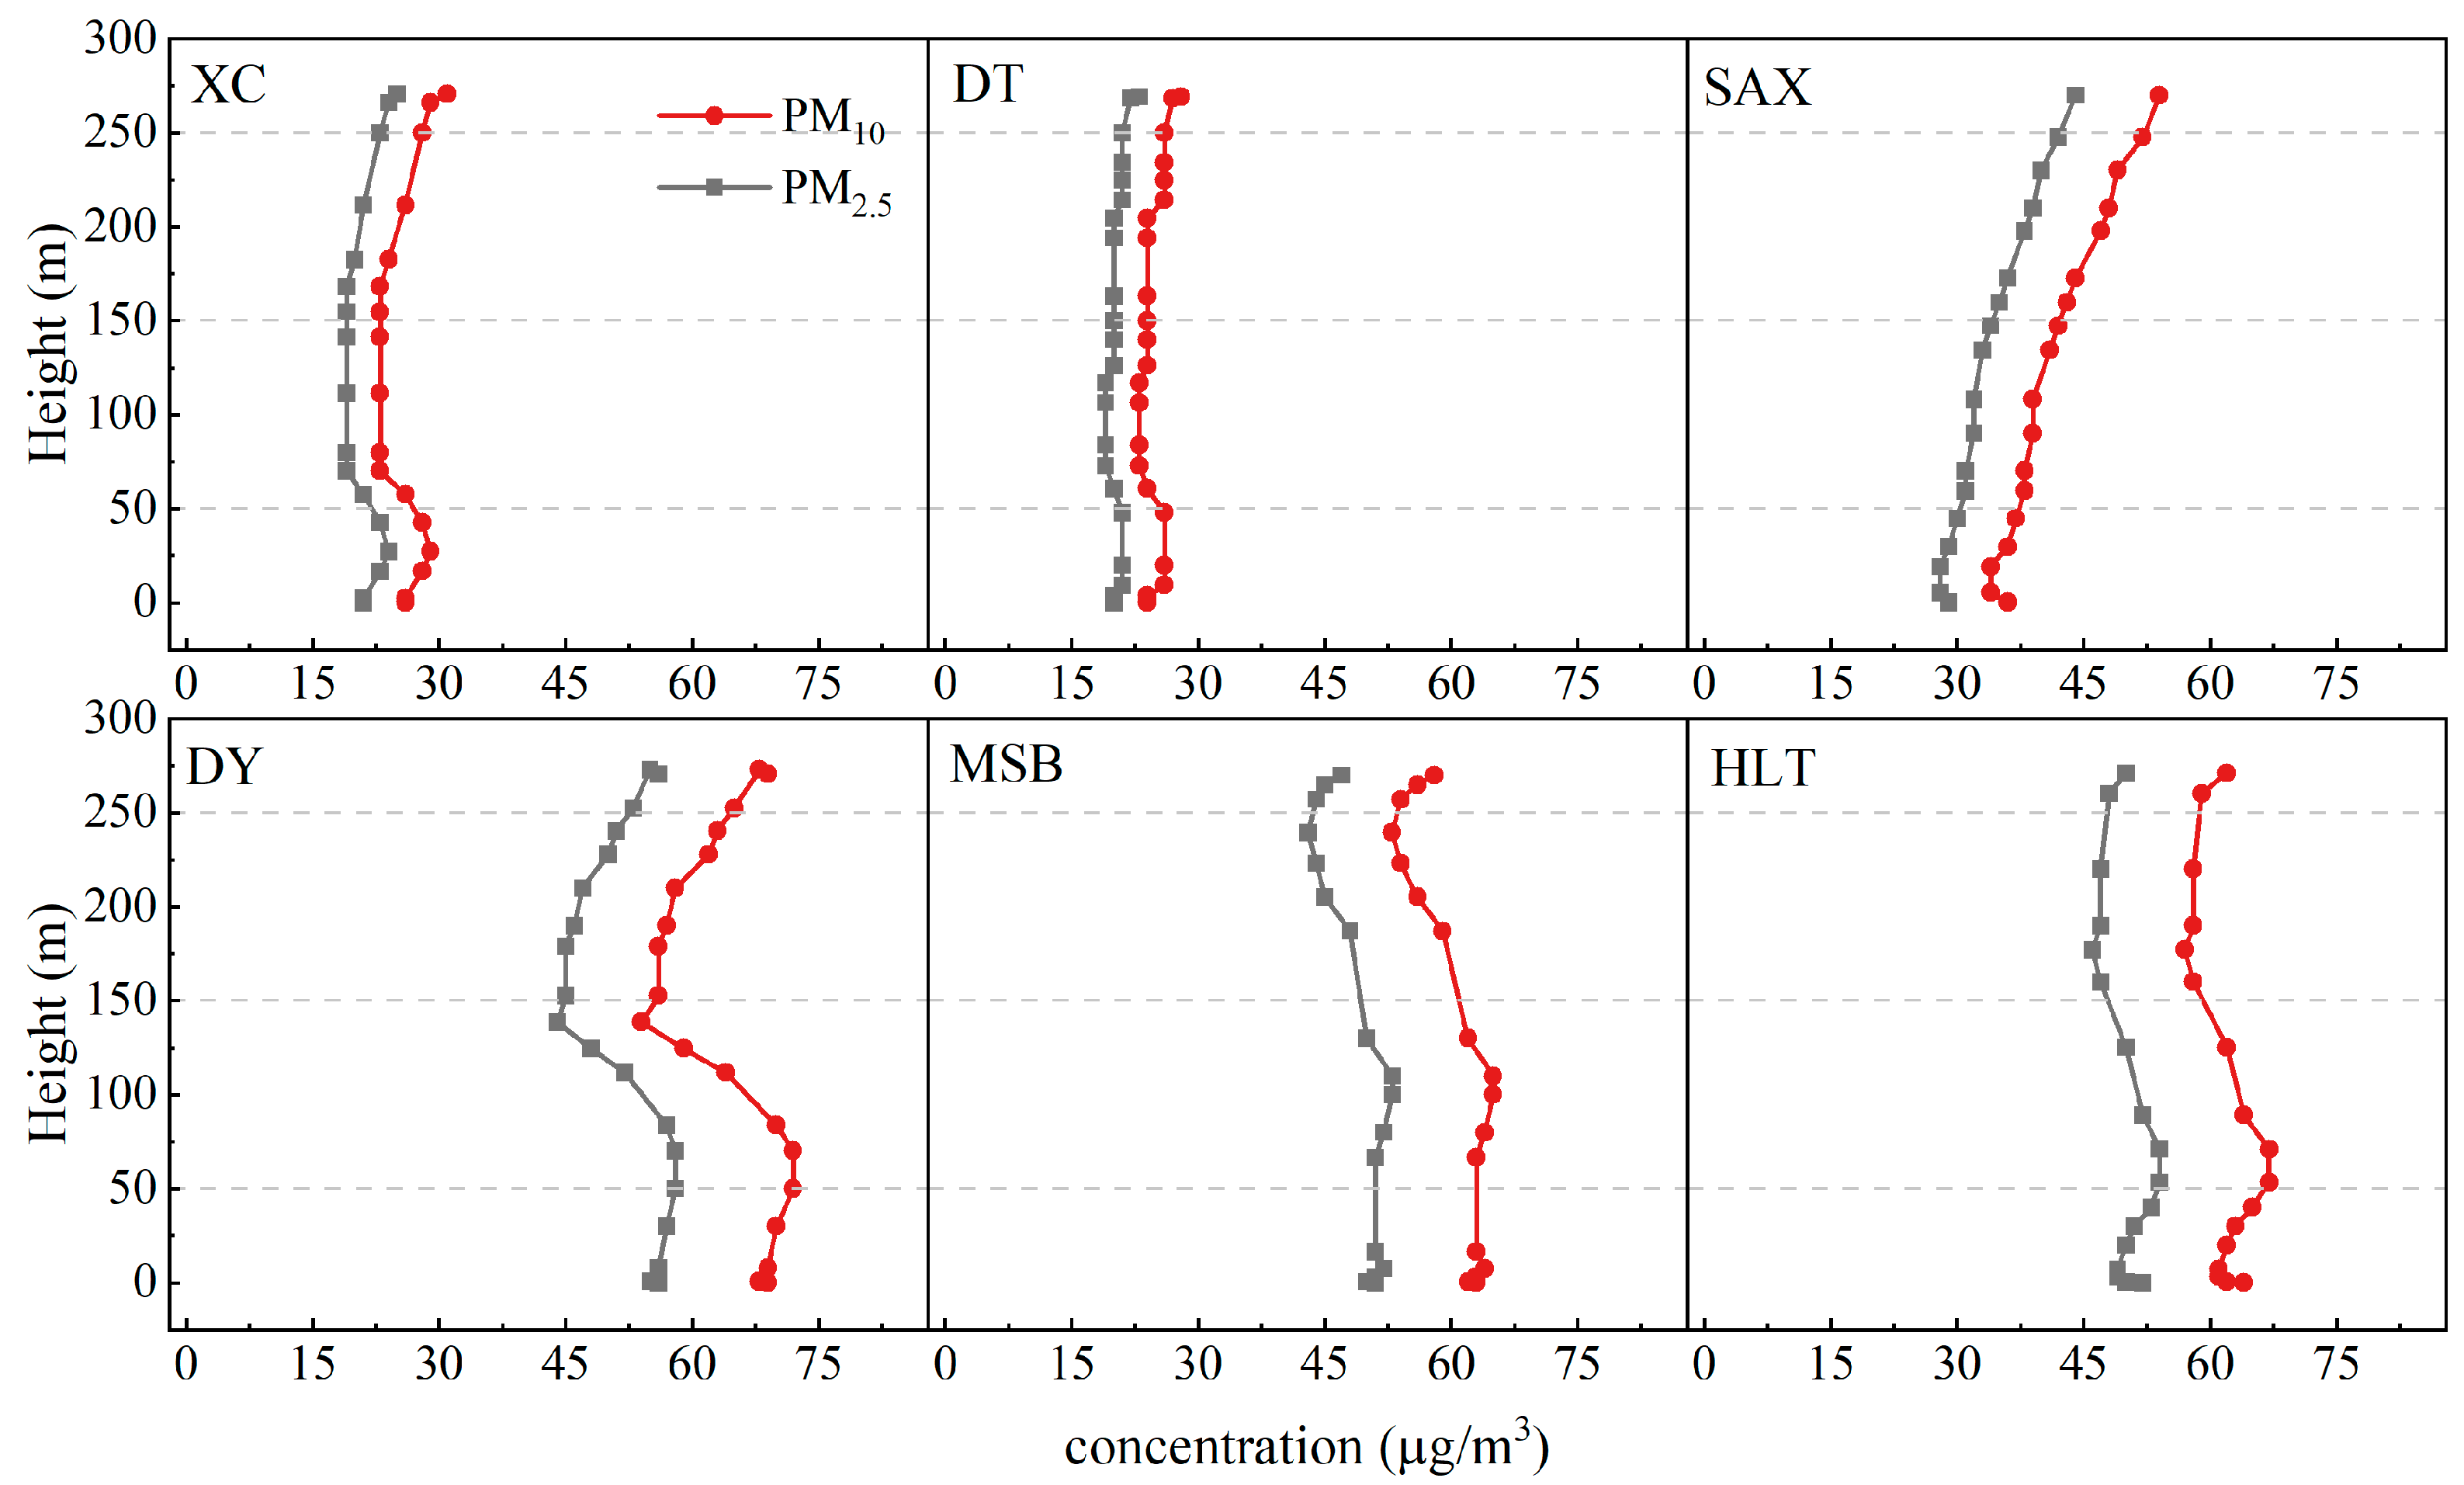
3.4.3. Vertical Profile of Particulate Matter

The vertical distribution of PM2.5 and PM10 mass concentrations within the 0~300 m range during the observation period is shown in Figure 6. Overall, variations in particulate matter concentrations at different sampling sites were influenced by boundary layer height, relative humidity, local emissions, and regional transport, though specific patterns varied across locations. At most sites, PM2.5 and PM10 concentrations exhibited localized peaks at lower altitudes, followed by fluctuating or decreasing trends with increasing height. When the boundary layer height was low, limited vertical mixing allowed local emissions to accumulate near the surface, resulting initial concentration peaks. In contrast, variations at higher altitudes were likely influenced by regional transport or external pollutant input.
Increased relative humidity typically promoted the hygroscopic growth and suspension of particulates, leading to either a gradual rise in concentrations with altitude or the appearance of secondary peaks. At the DT sampling site, the vertical profile of particulate matter concentrations appeared uniform and exhibited lower concentrations, with PM2.5 ranging from 16 to 24 µg/m3 and PM10 from 19 to 29 µg/m3. Meanwhile, the SAX site demonstrated a monotonically increasing trend in particulate concentrations, with PM2.5 rising from approximately 29 µg/m3 to 44 µg/m3 and PM10 increasing from around 36 µg/m3 to 54 µg/m3. During the observation period, most sampling sites exhibited a typical pattern of particulate matter concentration variation, characterized by accumulation in the lower atmosphere, dilution in the mid-altitudes, and remixing at higher altitudes. Local emissions and regional transport were the primary drivers of concentration fluctuations.

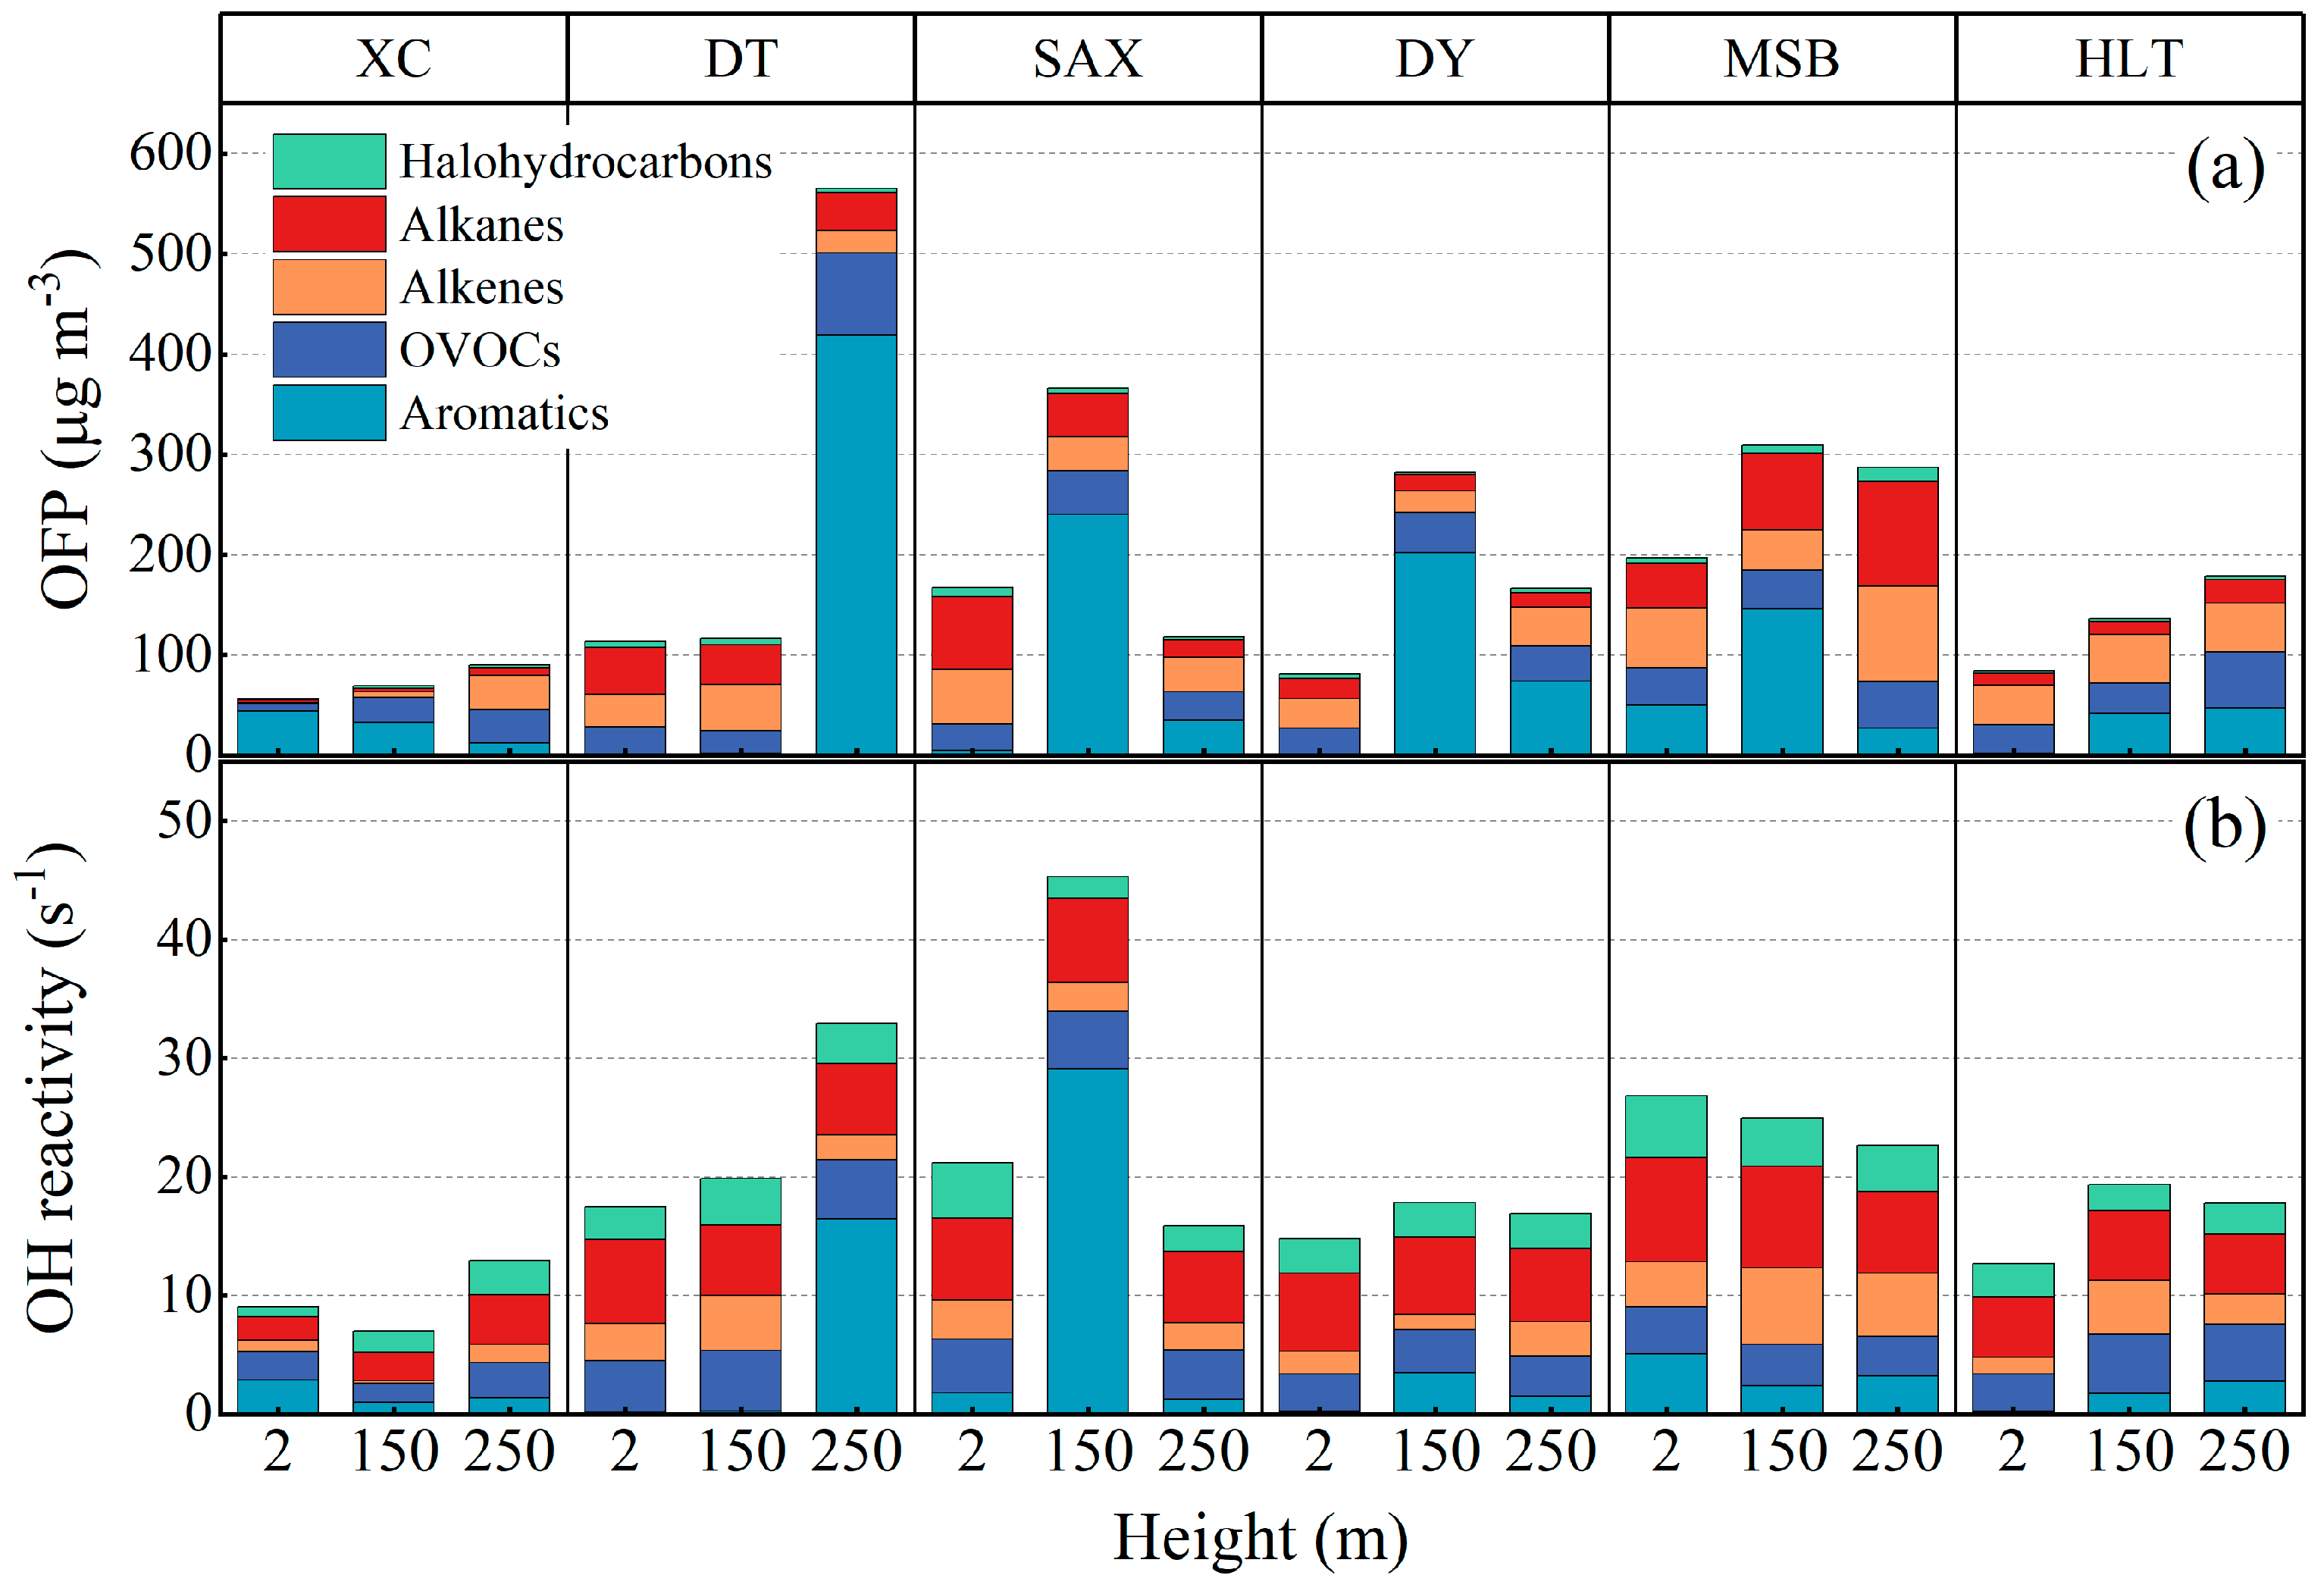
3.4.4. Vertical Profile of VOCs

All collected air samples were analyzed for VOC component within three days using an offline GC-MS/FID system. A total of 107 VOC species, including 24 alkanes, 11 alkenes, 18 aromatics, 13 OVOCs, 33 halohydrocarbons, 5 terpenes, acetonitrile, acetylene, and carbon disulfide (Table S6) were identified. Table 2 presents the volume mixing ratios of each VOC groups at three altitudes: 2 m, 150 m, and 250 m across six sampling sites. Figure S9 illustrates the relative proportions of various VOC groups at different heights and the vertical distribution characteristics of Total VOCs (TVOCs). Overall, the vertical distribution of VOCs exhibited significant heterogeneity, with mixing ratios varying considerably by altitude and location. These variations were closely linked to vertical mixing, chemical transformation, and local emissions of atmospheric pollutants.
At ground level (2 m), alkanes dominated the VOC composition. However, local emissions led to elevated concentrations of aromatics and halohydrocarbons at certain sampling sites. For instance, at the DY site, aromatics were the predominant VOCs at 2 m, whereas DT, SAX, and MSB exhibited a substantial contribution from halohydrocarbons. At 150 m and 250 m, alkanes remained the dominant species, but regional variations were more pronounced. At SAX, the mixing ratio of aromatics reached 97 ppbv at 150 m, followed by 63.4 ppbv at DT at 250 m. MSB exhibited 43.1 ppbv of halohydrocarbons at 250 m. These variations were likely influenced by the low BLH during the early morning, which maintained stable atmospheric stratification, limiting vertical mixing. Additionally, the stagnation of nocturnal photochemical reactions reduced VOC consumption, resulting in pollutant accumulations between 150 m and 250 m.
The top ten VOC species with the highest volume mixing ratios at each sampling site were primarily alkanes, aromatics, and halohydrocarbons, with the latter showing a significant contribution. At the MSB site, dichloromethane had a mixing ratio of 31.8 ppbv at 250m, which may be due to the horizontal transport of industrial emissions from the surrounding area. Similarly, m/p-xylene concentrations were 43.6 ppbv at 150 m and 19.9 ppbv at 250 m at SAX and DT, while near-ground levels were lower, suggesting possible regional transport effects. Propane and ethane contributed to VOC levels across all altitudes, likely originating from traffic emissions.
To evaluate the chemical reactivity of VOCs and their potential for ozone formation, we calculated OH reactivity (LOH) and ozone formation potential (OFP) for five VOC categories—alkanes, alkenes, aromatics, OVOCs, and halohydrocarbons—at different altitudes. The results are presented in Figure 7. Regarding OH reactivity, the XC site exhibited consistently low OH reactivity at all altitudes, whereas higher OH reactivity was observed at 250 m in DT and 150 m in SAX. Aromatics made the most significant contribution to OH reactivity, followed by alkanes. OFP calculations indicated that aromatics were the dominant contributors at 150 m and 250 m across most sampling sites, including DT, SAX, DY, and MSB. At 250 m at MSB, propylene, ethylene, and n-hexane also had substantial OFP contributions. At 150 m, toluene was particularly dominant, contributing 83.6 µg/m3, followed by n-hexane at 42.2 µg/m3. At the DY site, m/p-xylene and o-xylene contributed 92 µg/m3 and 68.6 µg/m3, respectively. At 150 m in SAX, m/p-xylene, o-xylene, and toluene contributed 13.5 µg/m3, 58.3 µg/m3 and 31.3 µg/m3, respectively. Similarly, at 250 m in DT, these three aromatic compounds remained significant, reaching 53.6 µg/m3, 278 µg/m3, and 38.2 µg/m3, respectively. Overall, aromatics dominated both LOH and OFP across most sampling sites, particularly benzene derivatives such as toluene, m/p-xylene, and o-xylene at 150 m and 250 m. Alkenes (propylene and ethylene) and n-hexane also contributed notably. Additionally, the high OH reactivity and significant OFP contributions at DT and SAX suggest that VOC emissions in these areas may strongly influence atmospheric oxidation capacity and ozone formation.
At nighttime, the high OH reactivity and ozone formation potential of VOCs at 150 m and 250 m indicate that under stable atmospheric conditions, highly reactive VOCs can accumulate at these altitudes, forming a “potential reaction reservoir”. Although this accumulation does not immediately trigger photochemical reactions at night, it provides sufficient precursors for rapid reactions during the daytime when the boundary layer rises and solar radiation intensifies, thereby exacerbating ozone formation.
The field observation results demonstrate the practical value of the UAV-based vertical monitoring and sampling platform for obtaining atmospheric pollutant distribution data. This platform offers valuable support for future data collection and enhances the understanding of the vertical distribution of atmospheric pollutants.

4. Conclusions

In this study, we developed a vertical atmospheric pollutant monitoring and sampling platform based on quadcopter UAV technology. This platform, equipped with lightweight quartz air sampling canisters and miniaturized sensors, collects whole air samples and vertical data on meteorological parameters and particulate matters. Through the performance test, the quartz canisters exhibited less than 15% adsorption loss, with three-day sample storage stability exceeding 80%. All sensors demonstrated a good correlation with standard instruments, with R2 above 0.80. Additionally, CFD simulations were used to analyze airflow around the quadcopter UAV during sampling, optimizing the inlet position for samplers and identifying ascending flight as the most effective sampling method. The platform was deployed in a field campaign at six sites along the Chengdu Metropolitan Circle Ring Expressway. During the drone’s ascent, real-time measurements of meteorological parameters and particulate matter concentrations were taken to capture the vertical distribution characteristics of these parameters within the 0~300 m range. Fixed-point VOC sampling was conducted at altitudes of 2 m, 150 m, and 250 m for subsequent VOC analysis. The results showed non-uniform pollutant mixing at higher altitudes, with particulate matter peaking at 50~70 m. Near the surface (2 m), VOCs were predominantly alkanes, while aromatic hydrocarbon concentrations were higher at 150~250 m, indicating significant regional transport impacts. Notably, high reactivity VOCs accumulated at 150~250 m in the early morning, enhancing secondary pollutant formation during the day. This study provides valuable insights into the evolution of vertical profiles of atmospheric pollutants within the boundary layer and the photochemical reactions occurring in the upper atmosphere. By incorporating weather conditions and regional transport processes, it also opens the door to applying various numerical modeling approaches, such as box models and air quality models, to quantify the vertical distribution of reactive VOCs under different environmental conditions. This allows for a more precise analysis of secondary pollution mechanisms and their contribution to pollution formation, thus providing a solid foundation for atmospheric environmental management and pollution prevention strategies. Moreover, the study highlights the potential of drone platforms for vertical atmospheric observations. Their compact size and mobility enable high spatiotemporal resolution measurements, making them ideal for capturing dynamic changes in pollutant distribution. However, a limitation of this study is that only one flight was conducted at each location and altitude. This could affect the statistical robustness of the findings due to the inherently variable nature of atmospheric conditions. In future research, we plan to conduct more flight measurements at various heights and times of day. This will help increase the sample size and enhance the robustness of the dataset, leading to a more comprehensive understanding of the regional VOC vertical distribution. Additionally, future research should focus on integrating additional atmospheric pollutant monitoring tools into these platforms to further enhance their capabilities.

Supplementary Materials

The following supporting information can be downloaded at: https://www.mdpi.com/article/10.3390/atmos16050613/s1.

Author Contributions

Conceptualization, L.Z.; methodology, X.K., X.D. and H.L.; software, H.L.; validation, X.K., L.Z. and X.X.; formal analysis, X.K.; investigation, X.K., L.Z., X.X. and G.S.; resources, G.S., H.L., Q.T., D.S., X.Z. and F.H.; data curation, X.K. and H.L.; writing—original draft preparation, X.K.; writing—review and editing, L.Z., H.L., F.Y., X.D., G.S., X.X., Q.T., D.S., F.H., X.Z., H.J. and P.W.; visualization, X.K.; supervision, L.Z., F.Y. and X.Z.; project administration, L.Z. and G.S.; funding acquisition, L.Z. and F.Y. All authors have read and agreed to the published version of the manuscript.

Funding

This work was funded by National Natural Science Foundation of China (No. 22276128) and the Fundamental Research Funds for the Central Universities, China (No. 2023CDSN-18).

Institutional Review Board Statement

Not applicable.

Informed Consent Statement

Not applicable.

Data Availability Statement

Data are contained within the article.

Acknowledgments

We are grateful for the financial support provided by the funding agencies.

Conflicts of Interest

The authors declare no conflicts of interest.

Abbreviations

The following abbreviations are used in this manuscript:
PM2.5fine particulate matter
O3ozone
VOCsvolatile organic compounds
OVOCsoxygenated VOCs
NOxnitric oxide
COcarbonic oxide
UAVunmanned aerial vehicle
CFDcomputational fluid dynamics
ppbvparts per billion by volume
Patmospheric pressure
Ttemperature
RHrelative humidity
SiO2silicon dioxide
RDrelative deviation
RMSEthe root means square error
NRMSEthe normalized root mean square error
TVOCtotal volatile organic compounds
BLHboundary layer heights
OFPozone formation potential

References

  1. Nault, B.A.; Jo, D.S.; McDonald, B.C.; Campuzano-Jost, P.; Day, D.A.; Hu, W.; Schroder, J.C.; Allan, J.; Blake, D.R.; Canagaratna, M.R.; et al. Secondary organic aerosols from anthropogenic volatile organic compounds contribute substantially to air pollution mortality. Atmos. Chem. Phys. 2021, 21, 11201–11224. [Google Scholar] [CrossRef]
  2. Li, K.; Jacob, D.J.; Liao, H.; Zhu, J.; Shah, V.; Shen, L.; Bates, K.H.; Zhang, Q.; Zhai, S. A two-pollutant strategy for improving ozone and particulate air quality in China. Nat. Geosci. 2019, 12, 906–910. [Google Scholar] [CrossRef]
  3. Liu, C.; Chen, R.; Sera, F.; Vicedo-Cabrera, A.M.; Guo, Y.; Tong, S.; Lavigne, E.; Correa, P.M.; Ortega, N.V.; Achilleos, S.; et al. Interactive effects of ambient fine particulate matter and ozone on daily mortality in 372 cities: Two stage time series analysis. Br. Med. J. 2023, 383, e075203. [Google Scholar] [CrossRef] [PubMed]
  4. Hien, V.T.D.; Lin, C.; Thanh, V.C.; Oanh, N.T.K.; Thanh, B.X.; Weng, C.E.; Yuan, C.S.; Rene, E.R. An overview of the development of vertical sampling technologies for ambient volatile organic compounds (VOCs). J. Environ. Manag. 2019, 247, 401–412. [Google Scholar] [CrossRef]
  5. Liu, Z.; Li, X.; Yuan, B.; Mo, Z.; Tan, X.; Zhou, J.; Wang, S.; He, X.; Shao, M. Progress on the vertical observation methods of volatile organic compounds and their applications within the atmospheric boundary layer. Chin. Sci. Bull. 2021, 66, 4098–4111. [Google Scholar] [CrossRef]
  6. Sun, X.; Zhao, T.; Tang, G.; Bai, Y.; Kong, S.; Zhou, Y.; Hu, J.; Tan, C.; Shu, Z.; Xu, J.; et al. Vertical changes of PM(2.5) driven by meteorology in the atmospheric boundary layer during a heavy air pollution event in central China. Sci. Total Environ. 2023, 858, 159830. [Google Scholar] [CrossRef] [PubMed]
  7. Xing, C.; Liu, C.; Hong, Q.; Liu, H.; Wu, H.; Lin, J.; Song, Y.; Chen, Y.; Liu, T.; Hu, Q.; et al. Vertical distributions and potential sources of wintertime atmospheric pollutants and the corresponding ozone production on the coast of Bohai Sea. J. Environ. Manage. 2022, 319, 115721. [Google Scholar] [CrossRef]
  8. Sun, X.; Zhou, Y.; Zhao, T.; Fu, W.; Wang, Z.; Shi, C.; Zhang, H.; Zhang, Y.; Yang, Q.; Shu, Z. Vertical distribution of aerosols and association with atmospheric boundary layer structures during regional aerosol transport over central China. Environ. Pollut. 2024, 362, 124967. [Google Scholar] [CrossRef]
  9. Chen, D.; Xu, Y.H.; Xu, J.C.; Lian, M.L.; Zhang, W.; Wu, W.H.; Wu, M.Y.; Zhao, J.B. The Vertical Distribution of VOCs and Their Impact on the Environment: A Review. Atmosphere 2022, 13, 1940. [Google Scholar] [CrossRef]
  10. Mo, Z.; Huang, S.; Yuan, B.; Pei, C.; Song, Q.; Qi, J.; Wang, M.; Wang, B.; Wang, C.; Li, M.; et al. Deriving emission fluxes of volatile organic compounds from tower observation in the Pearl River Delta, China. Sci. Total Environ. 2020, 741, 139763. [Google Scholar] [CrossRef]
  11. Liu, Z.; Zha, F.; Wang, Y.; Yuan, B.; Liu, B.; Tang, G. Vertical evolution of the concentrations and sources of volatile organic compounds in the lower boundary layer in urban Beijing in summer. Chemosphere 2023, 332, 138767. [Google Scholar] [CrossRef] [PubMed]
  12. Guo, H.; Ling, Z.H.; Cheng, H.R.; Simpson, I.J.; Lyu, X.P.; Wang, X.M.; Shao, M.; Lu, H.X.; Ayoko, G.; Zhang, Y.L.; et al. Tropospheric volatile organic compounds in China. Sci. Total Environ. 2017, 574, 1021–1043. [Google Scholar] [CrossRef]
  13. Mo, Z.; Huang, S.; Yuan, B.; Pei, C.; Song, Q.; Qi, J.; Wang, M.; Wang, B.; Wang, C.; Shao, M. Tower-based measurements of NMHCs and OVOCs in the Pearl River Delta: Vertical distribution, source analysis and chemical reactivity. Environ. Pollut. 2022, 292, 118454. [Google Scholar] [CrossRef] [PubMed]
  14. Liu, Y.H.; Wang, H.L.; Jing, S.A.; Zhou, M.; Lou, S.R.; Qu, K.; Qiu, W.Y.; Wang, Q.; Li, S.L.; Gao, Y.Q.; et al. Vertical Profiles of Volatile Organic Compounds in Suburban Shanghai. Adv. Atmos. Sci. 2021, 38, 1177–1187. [Google Scholar] [CrossRef]
  15. Travis, K.R.; Heald, C.L.; Allen, H.M.; Apel, E.C.; Arnold, S.R.; Blake, D.R.; Brune, W.H.; Chen, X.; Commane, R.; Crounse, J.D.; et al. Constraining remote oxidation capacity with ATom observations. Atmos. Chem. Phys. 2020, 20, 7753–7781. [Google Scholar] [CrossRef] [PubMed]
  16. Wang, B.; Chen, Y.; Yu, G.; Li, X.; Wang, H.; Zheng, Z.; Zeng, L.; Huang, X. Vertical distribution monitoring of near-surface atmospheric VOCs in Shenzhen based on UAV-borne. China Environ. Sci. 2024, 44, 3021–3029. [Google Scholar] [CrossRef]
  17. Murphy, J.G.; Oram, D.E.; Reeves, C.E. Measurements of volatile organic compounds over West Africa. Atmos. Chem. Phys. 2010, 10, 5281–5294. [Google Scholar] [CrossRef]
  18. Geng, F.; Zhang, Q.; Tie, X.; Huang, M.; Ma, X.; Deng, Z.; Yu, Q.; Quan, J.; Zhao, C. Aircraft measurements of O3, NOx, CO, VOCs, and SO2 in the Yangtze River Delta region. Atmos. Environ. 2009, 43, 584–593. [Google Scholar] [CrossRef]
  19. Koßmann, M.; Vogel, H.; Vogel, B.; Vögtlin, R.; Corsmeier, U.; Fiedler, F.; Klemm, O.; Schlager, H. The composition and vertical distribution of volatile organic compounds in southwestern Germany, eastern France and northern Switzerland during the TRACT campaign in September 1992. Phys. Chem. Earth 1996, 21, 429–433. [Google Scholar] [CrossRef]
  20. Decker, Z.C.J.; Robinson, M.A.; Barsanti, K.C.; Bourgeois, I.; Coggon, M.M.; Di Gangi, J.P.; Diskin, G.S.; Flocke, F.M.; Franchin, A.; Fredrickson, C.D.; et al. Nighttime and daytime dark oxidation chemistry in wildfire plumes: An observation and model analysis of FIREX-AQ aircraft data. Atmos. Chem. Phys. 2021, 21, 16293–16317. [Google Scholar] [CrossRef]
  21. Hong, Q.; Zhu, L.; Xing, C.; Hu, Q.; Lin, H.; Zhang, C.; Zhao, C.; Liu, T.; Su, W.; Liu, C. Inferring vertical variability and diurnal evolution of O3 formation sensitivity based on the vertical distribution of summertime HCHO and NO2 in Guangzhou, China. Sci. Total Environ. 2022, 827, 154045. [Google Scholar] [CrossRef] [PubMed]
  22. Zhao, K.; Bao, Y.; Huang, J.; Wu, Y.; Moshary, F.; Arend, M.; Wang, Y.; Lee, X. A high-resolution modeling study of a heat wave-driven ozone exceedance event in New York City and surrounding regions. Atmos. Environ. 2019, 199, 368–379. [Google Scholar] [CrossRef]
  23. Zhang, K.; Xiu, G.; Zhou, L.; Bian, Q.; Duan, Y.; Fei, D.; Wang, D.; Fu, Q. Vertical distribution of volatile organic compounds within the lower troposphere in late spring of Shanghai. Atmos. Environ. 2018, 186, 150–157. [Google Scholar] [CrossRef]
  24. Geng, C.; Wang, J.; Yin, B.; Zhao, R.; Li, P.; Yang, W.; Xiao, Z.; Li, S.; Li, K.; Bai, Z. Vertical distribution of volatile organic compounds conducted by tethered balloon in the Beijing-Tianjin-Hebei region of China. J. Environ. Sci. 2020, 95, 121–129. [Google Scholar] [CrossRef]
  25. Bisht, D.S.; Tiwari, S.; Dumka, U.C.; Srivastava, A.K.; Safai, P.D.; Ghude, S.D.; Chate, D.M.; Rao, P.S.P.; Ali, K.; Prabhakaran, T.; et al. Tethered balloon-born and ground-based measurements of black carbon and particulate profiles within the lower troposphere during the foggy period in Delhi, India. Sci. Total Environ. 2016, 573, 894–905. [Google Scholar] [CrossRef]
  26. Wang, D.; Huo, J.; Duan, Y.; Zhang, K.; Ding, A.; Fu, Q.; Luo, J.; Fei, D.; Xiu, G.; Huang, K. Vertical distribution and transport of air pollutants during a regional haze event in eastern China: A tethered mega-balloon observation study. Atmos. Environ. 2021, 246, 118039. [Google Scholar] [CrossRef]
  27. Wu, S.; Tang, G.; Wang, Y.; Mai, R.; Yao, D.; Kang, Y.; Wang, Q.; Wang, Y. Vertical Evolution of Boundary Layer Volatile Organic Compounds in Summer over the North China Plain and the Differences with Winter. Adv. Atmos. Sci. 2021, 38, 1165–1176. [Google Scholar] [CrossRef]
  28. Sun, J.; Wang, Y.; Wu, F.; Tang, G.; Wang, L.; Wang, Y.; Yang, Y. Vertical characteristics of VOCs in the lower troposphere over the North China Plain during pollution periods. Environ. Pollut. 2018, 236, 907–915. [Google Scholar] [CrossRef] [PubMed]
  29. Toscano, P.; Gioli, B.; Dugheri, S.; Salvini, A.; Matese, A.; Bonacchi, A.; Zaldei, A.; Cupelli, V.; Miglietta, F. Locating industrial VOC sources with aircraft observations. Environ. Pollut. 2011, 159, 1174–1182. [Google Scholar] [CrossRef]
  30. Xue, L.K.; Wang, T.; Simpson, I.J.; Ding, A.J.; Gao, J.; Blake, D.R.; Wang, X.Z.; Wang, W.X.; Lei, H.C.; Jing, D.Z. Vertical distributions of non-methane hydrocarbons and halocarbons in the lower troposphere over northeast China. Atmos. Environ. 2011, 45, 6501–6509. [Google Scholar] [CrossRef]
  31. Xue, L.; Ding, A.; Gao, J.; Wang, T.; Wang, W.; Wang, X.; Lei, H.; Jin, D.; Qi, Y. Aircraft measurements of the vertical distribution of sulfur dioxide and aerosol scattering coefficient in China. Atmos. Environ. 2010, 44, 278–282. [Google Scholar] [CrossRef]
  32. Li, C.; Stehr, J.W.; Marufu, L.T.; Li, Z.; Dickerson, R.R. Aircraft measurements of SO2 and aerosols over northeastern China: Vertical profiles and the influence of weather on air quality. Atmos. Environ. 2012, 62, 492–501. [Google Scholar] [CrossRef]
  33. Wei, J.; Li, Z.; Lyapustin, A.; Sun, L.; Peng, Y.; Xue, W.; Su, T.; Cribb, M. Reconstructing 1-km-resolution high-quality PM2.5 data records from 2000 to 2018 in China: Spatiotemporal variations and policy implications. Remote Sens. Environ. 2021, 252, 112136. [Google Scholar] [CrossRef]
  34. Jiang, Z.; Wang, S.; Yan, Y.; Zhang, S.; Xue, R.; Gu, C.; Zhu, J.; Liu, J.; Zhou, B. Constructing the 3D Spatial Distribution of the HCHO/NO2 Ratio via Satellite Observation and Machine Learning Model. Environ. Sci. Technol. 2025, 59, 4047–4058. [Google Scholar] [CrossRef] [PubMed]
  35. Hong, Q.Q.; Liu, C.; Hu, Q.H.; Zhang, Y.L.; Xing, C.Z.; Ou, J.P.; Tan, W.; Liu, H.R.; Huang, X.Q.; Wu, Z.F. Vertical distribution and temporal evolution of formaldehyde and glyoxal derived from MAX-DOAS observations: The indicative role of VOC sources. J. Environ. Sci. 2022, 122, 92–104. [Google Scholar] [CrossRef]
  36. Benavent, N.; Garcia-Nieto, D.; Wang, S.; Saiz-Lopez, A. MAX-DOAS measurements and vertical profiles of glyoxal and formaldehyde in Madrid, Spain. Atmos. Environ. 2019, 199, 357–367. [Google Scholar] [CrossRef]
  37. McKinney, K.A.; Wang, D.; Ye, J.H.; de Fouchier, J.B.; Guimaraes, P.C.; Batista, C.E.; Souza, R.A.F.; Alves, E.G.; Gu, D.; Guenther, A.B.; et al. A sampler for atmospheric volatile organic compounds by copter unmanned aerial vehicles. Atmos. Meas. Tech. 2019, 12, 3123–3135. [Google Scholar] [CrossRef]
  38. Clarke, R. Understanding the drone epidemic. Comput. Law Secur. Rev. 2014, 30, 230–246. [Google Scholar] [CrossRef]
  39. Yang, S.D.; Li, X.; Zeng, L.M.; Yu, X.A.; Liu, Y.; Lu, S.H.; Huang, X.F.; Zhang, D.M.; Xu, H.B.; Lin, S.C.; et al. Development of multi-channel whole-air sampling equipment onboard an unmanned aerial vehicle for investigating volatile organic compounds’ vertical distribution in the planetary boundary layer. Atmos. Meas. Tech. 2023, 16, 501–512. [Google Scholar] [CrossRef]
  40. Berman, E.S.F.; Fladeland, M.; Liem, J.; Kolyer, R.; Gupta, M. Greenhouse gas analyzer for measurements of carbon dioxide, methane, and water vapor aboard an unmanned aerial vehicle. Sens. Actuators B 2012, 169, 128–135. [Google Scholar] [CrossRef]
  41. Asher, E.; Hills, A.J.; Hornbrook, R.S.; Shertz, S.; Gabbard, S.; Stephens, B.B.; Helmig, D.; Apel, E.C. Unpiloted Aircraft System Instrument for the Rapid Collection of Whole Air Samples and Measurements for Environmental Monitoring and Air Quality Studies. Environ. Sci. Technol. 2021, 55, 5657–5667. [Google Scholar] [CrossRef] [PubMed]
  42. Wang, D.; Wang, Z.; Peng, Z.R.; Wang, D. Using unmanned aerial vehicle to investigate the vertical distribution of fine particulate matter. Int. J. Environ. Sci. Technol. 2019, 17, 219–230. [Google Scholar] [CrossRef]
  43. Vo, T.D.H.; Lin, C.T.; Weng, C.E.; Yuan, C.S.; Lee, C.W.; Hung, C.H.; Bui, X.T.; Lo, K.C.; Lin, J.X. Vertical stratification of volatile organic compounds and their photochemical product formation potential in an industrial urban area. J. Environ. Manag. 2018, 217, 327–336. [Google Scholar] [CrossRef] [PubMed]
  44. Li, Y.W.; Liu, B.; Ye, J.H.; Jia, T.J.; Khuzestani, R.B.; Jia, Y.S.; Cheng, X.; Zheng, Y.; Li, X.; Wu, C.; et al. Unmanned Aerial Vehicle Measurements of Volatile Organic Compounds over a Subtropical Forest in China and Implications for Emission Heterogeneity. ACS Earth Space Chem. 2021, 5, 247–256. [Google Scholar] [CrossRef]
  45. Cheng, W.-H.; Lin, C.-H.; Yuan, C.-S. VOC Sampler on a Drone Assisting in Tracing the Potential Sources by a Dispersion Model—Case Study of Industrial Emissions. Aerosol Air Qual. Res. 2023, 23, 230169. [Google Scholar] [CrossRef]
  46. Brady, J.M.; Stokes, M.D.; Bonnardel, J.; Bertram, T.H. Characterization of a Quadrotor Unmanned Aircraft System for Aerosol-Particle-Concentration Measurements. Environ. Sci. Technol. 2016, 50, 1376–1383. [Google Scholar] [CrossRef]
  47. Mijling, B.; Jiang, Q.; de Jonge, D.; Bocconi, S. Field calibration of electrochemical NO2 sensors in a citizen science context. Atmos. Meas. Tech. 2018, 11, 1297–1312. [Google Scholar] [CrossRef]
  48. Spinelle, L.; Gerboles, M.; Villani, M.G.; Aleixandre, M.; Bonavitacola, F. Field calibration of a cluster of low-cost available sensors for air quality monitoring. Part A: Ozone and nitrogen dioxide. Sens. Actuators B 2015, 215, 249–257. [Google Scholar] [CrossRef]
  49. Pang, X.; Shaw, M.D.; Gillot, S.; Lewis, A.C. The impacts of water vapour and co-pollutants on the performance of electrochemical gas sensors used for air quality monitoring. Sens. Actuators B 2018, 266, 674–684. [Google Scholar] [CrossRef]
  50. Tsai, H.H.; Liu, Y.F.; Yuan, C.S.; Chen, W.H.; Lin, Y.C.; Hung, C.H.; Lin, C.; Jen, Y.H.; Ie, I.R.; Yang, H.Y. Vertical Profile and Spatial Distribution of Ozone and Its Precursors at the Inland and Offshore of an Industrial City. Aerosol Air Qual. Res. 2012, 12, 911–922. [Google Scholar] [CrossRef]
  51. Yang, J.J.; Liu, C.C.; Chen, W.H.; Yuan, C.S.; Lin, C. Assessing the altitude effect on distributions of volatile organic compounds from different sources by principal component analysis. Environ. Sci. Process. Impacts 2013, 15, 972–985. [Google Scholar] [CrossRef]
  52. Villa, T.F.; Salimi, F.; Morton, K.; Morawska, L.; Gonzalez, F. Development and Validation of a UAV Based System for Air Pollution Measurements. Sensors 2016, 16, 2202. [Google Scholar] [CrossRef] [PubMed]
  53. Tang, Q.; Zhang, R.; Chen, L.; Deng, W.; Xu, M.; Xu, G.; Li, L.; Hewitt, A. Numerical simulation of the downwash flow field and droplet movement from an unmanned helicopter for crop spraying. Comput. Electron. Agr. 2020, 174, 105468. [Google Scholar] [CrossRef]
  54. Menter, F.R. Two-equation eddy-viscosity turbulence models for engineering applications. AIAA J. 1994, 32, 1598–1605. [Google Scholar] [CrossRef]
  55. Pajcin, M.; Simonovic, A.; Ivanov, T.; Komarov, D.; Stupar, S. Numerical analysis of a hypersonic turbulent and laminar flow using a commercial CFD solver. J. Therm. Sci. 2016, 20, 198. [Google Scholar] [CrossRef]
  56. Rao, G.; Zhao, H. Analysis of internal flow field performance of hydrocyclone based on CFD. J. Phys. Conf. Ser. 2022, 2383, 012027. [Google Scholar] [CrossRef]
  57. Urech, P.R.W.; Mughal, M.O.; Bartesaghi-Koc, C. A simulation-based design framework to iteratively analyze and shape urban landscapes using point cloud modeling. Comput. Environ. Urban. Syst. 2022, 91, 101731. [Google Scholar] [CrossRef]
  58. Zheng, Y.J.; Yang, S.H.; Liu, X.X.; Wang, J.; Norton, T.; Chen, J.; Tan, Y. The computational fluid dynamic modeling of downwash flow field for a six-rotor UAV. Front. Agric. Sci. Eng. 2018, 5, 159–167. [Google Scholar] [CrossRef]
  59. Li, T.; Qin, D.; Zhang, J.Y. Effect of RANS Turbulence Model on Aerodynamic Behavior of Trains in Crosswind. Chin. J. Mech. Eng. 2019, 32, 85. [Google Scholar] [CrossRef]
  60. Hsieh, C.-C.; Horng, S.-H.; Liao, P.-N. Stability of Trace-Level Volatile Organic Compounds Stored in Canisters and Tedlar bags. Aerosol Air Qual. Res. 2003, 3, 17–28. [Google Scholar] [CrossRef]
  61. Ochiai, N.; Tsuji, A.; Nakamura, N.; Daishima, S.; Cardin, D.B. Stabilities of 58 volatile organic compounds in fused-silica-lined and SUMMA polished canisters under various humidified conditions. J. Environ. Monit. 2002, 4, 879–889. [Google Scholar] [CrossRef]
Figure 1. Connection diagram of sampling device (blue lines represent airflow routes, green lines represent electric current routes.
Atmosphere 16 00613 g001
Figure 2. Comparison of wall adsorption loss between quartz and SUMMA canisters.
Atmosphere 16 00613 g002
Figure 3. Comparison of 3-day sample storage stability for various VOC samples in s quartz and SUMMA canisters.
Atmosphere 16 00613 g003
Figure 4. Comparison of linear correlation between particulate matter sensor signals and standard instrument monitoring values.
Atmosphere 16 00613 g004
Figure 5. (a) Velocity distribution cloud map of UAV external flow field at a rotor speed of 2689 rpm; (b) UAV airflow velocity profiles along the gravity direction.
Atmosphere 16 00613 g005
Figure 6. Vertical distribution of PM2.5 and PM10 at six sampling sites during the sampling.
Atmosphere 16 00613 g006
Figure 7. VOCs at six sampling sites at different heights: (a) OFP levels; (b) OH reactivity levels.
Atmosphere 16 00613 g007
Table 1. Measurement results of wall adsorption losses for quartz and SUMMA canisters.
SpeciesQuartz (ppbv)SUMMA (ppbv)RD-QuartzRD-SUMMA
Alkanes9.9 ± 0.909.7 ± 0.82−1.29%−3.32%
Alkenes9.8 ± 0.339.8 ± 0.54−1.87%−2.00%
Halohydrocarbons9.8 ± 0.889.1 ± 1.20−1.82%−8.92%
Aromatics10.0 ± 1.648.8 ± 1.95−0.30%−12.53%
OVOCs8.4 ± 1.818.0 ± 2.18−16.35%−20.26%
Terpenes9.7 ± 2.829.2 ± 2.37−2.74%−8.10%
Organosulfur8.8 ± 0.3510.0 ± 1.11−11.76%−0.33%
Nitrile7.2 ± 0.404.9 ± 0.31−28.05%−51.19%
Alkynes9.8 ± 0.7010.3 ± 0.05−1.98%3.27%
RD = 10   ppbv - [ VOC ] i 10   ppbv   ×   100 % , [VOC]i represents the volumetric mixing ratio concentration of each VOC species quantified in the sampling canisters.
Table 2. Mixing ratios of various VOC components and TVOC at six sampling sites at different heights (ppbv).
VOC Groups2 m150 m250 m2 m150 m250 m
XCDT
Alkanes1.42.75.418.11910.8
Alkenes0.010.321.631.1
Aromatics1.91.70.90.60.463.4
OVOCs0.51.32.22.525.6
Halohydrocarbons1.822.719.318.912.1
TVOCs5.67.913.342.143.392.9
SAXDY
Alkanes1613.39.511.28.911.4
Alkenes3.52.22.42.422.6
Aromatics0.797.11.912.39.23.5
OVOCs2.43.21.92.92.82.6
Halohydrocarbons13.612.33.54.94.85.5
TVOCs36.212819.133.627.625.7
MSBHLT
Alkanes18.625.536.310.19.813.1
Alkenes3.75.46.22.63.73.6
Aromatics3.394.50.72.38.4
OVOCs2.53.63.322.63.9
Halohydrocarbons11.521.443.14.54.45.2
TVOCs39.664.893.419.922.834.2
Disclaimer/Publisher’s Note: The statements, opinions and data contained in all publications are solely those of the individual author(s) and contributor(s) and not of MDPI and/or the editor(s). MDPI and/or the editor(s) disclaim responsibility for any injury to people or property resulting from any ideas, methods, instructions or products referred to in the content.

