Article

The Development and Application of a Three-Dimensional Corona Discharge Numerical Model Considering the Thunderstorm Electric Field Polarity Reversal Process

1
School of Electronic and Information Engineering, Nanjing University of Information Science and Technology, Nanjing 211544, China
2
State Key Laboratory of Disaster Weather of China Academy of Meteorological Sciences/Key Laboratory of Lightning, China Meteorological Administration, Beijing 100081, China
3
College of Atmosphere and Remote Sensing, Wuxi University, Wuxi 214105, China
*
Author to whom correspondence should be addressed.
Atmosphere 2025, 16(5), 612; https://doi.org/10.3390/atmos16050612 (registering DOI)
Submission received: 31 March 2025 / Revised: 24 April 2025 / Accepted: 10 May 2025 / Published: 17 May 2025
(This article belongs to the Section Meteorology)

Abstract

:
The study of the ground tip corona discharge is an important part of the lightning strike mechanism and lightning warning research. Because the characteristics of the corona charge distribution are difficult to observe directly, simulation research is indispensable. However, most of the previous models have been unipolar models, which cannot reflect the characteristics of the tip corona discharge under electric field reversal during real thunderstorms. Therefore, the development of three-dimensional positive and negative corona discharge models is of great significance. In this study, a three-dimensional corona discharge numerical model considering the polarity reversal process of the electric field was developed with or without a wind field and simulated the tip corona discharge characteristics under this reversal. The reliability of the model was verified by comparing the observed results. Compared with the unipolar corona discharge model, this model could effectively evaluate the impact of the first half-cycle corona discharge on the second half-cycle opposite-polarity corona discharge and invert the spatial separation distribution characteristics of different polar corona charges released in both cycles under the influence of wind and the spatial electric field distribution characteristics generated by the corresponding corona charges. Comparing unipolar corona discharges under the same wave pattern and amplitude of the background electric field, it was assumed that the unipolar corona discharge occurred in the half cycle after the polarity reversal of an electric field, and there was also an opposite-polarity corona discharge process before it. Due to the influence of the first half cycle, the background electric field required for a corona discharge was smaller, and the corona current was generated earlier, but the end time was equivalent. At the same time, due to the neutralization effect of positive and negative corona charges, the peak value of the total corona charge in the second half cycle was significantly smaller than that of the unipolar model. At different building heights, the peak difference in the corona current and the peak difference in the corona charge between the two models increased linearly with an increase in height. It could be seen that this model had better simulation results and wider application value.

1. Introduction

A corona discharge refers to the phenomenon where the electric field intensity on the tip surface exceeds the air breakdown threshold [1,2]. When the ground environment electric field exceeds the threshold, ground grounding objects (such as grounding towers, trees, buildings, and windmills) will produce corona discharge phenomena [3,4]. When the height of the ground grounding object increases, the probability of charge accumulation increases [5,6,7]. In a thunderstorm environment, the higher the tip of the ground grounding object is, the stronger the corona discharge phenomenon is. The corona charge layer generated by the tip corona discharge will affect the distribution of the space electric field. During thunderstorms, the enhancement of the environmental electric field will cause a corona discharge at the tip of the ground object [8,9,10,11,12]. In an actual situation, when a thunderstorm cloud passes through, the ground electric field has a positive and negative polarity alternating charge. Therefore, a three-dimensional positive and negative corona discharge model has an important practical role in studying the corona discharge of ground grounding objects.
Corona discharges are divided into two types: positive and negative corona discharges. The research on the characteristics of corona discharges is divided into three types: laboratory gap discharge experiments, ground tip observation experiments, and corona discharge numerical simulations.
Luo [13] studied tip corona discharge characteristics through a combination of laboratory tests and numerical calculations and obtained the variation trend of positive and negative corona discharge characteristics along with the electric field strength. Tian [14] obtained the motion law and electric field distribution characteristics of charged particles in an AC corona discharge by establishing a microscopic physical model of an AC corona discharge. Yosho et al. [15] measured the corona discharge characteristics of a needle electrode tip on the ground and obtained the variation characteristics of the tip corona current and the relationship between the corona current and the ground electric field intensity.
Some characteristics of a corona discharge can be obtained through laboratory and observation experiments, but there are limitations such as the inability to study multiple influencing factors at the same time. In contrast, numerical simulation provides a powerful tool to overcome these limitations. In addition, a numerical simulation can also be simulated at different time and space scales, which provides important theoretical support for the in-depth study of corona discharges. Aleksandrov et al. [16,17,18] established a one-dimensional tip corona ion diffusion model and studied the characteristics of a positive corona discharge at the tip of the grounding object through analysis and numerical methods. Bazelyan et al. [19] established a two-dimensional corona electric field model to simulate the influence of the geometric characteristics of different grounding objects on the tip corona discharge. Based on the one-dimensional model established by Aleksandrov et al. [16,17,18], Becerra [20] established a two-dimensional axisymmetric corona model. This study realized the simulation of the tip corona discharge process with a symmetrical structure and considered the corona initiation phenomenon at the top of the tip. Guo et al. [21] established a two-dimensional asymmetric corona discharge model to better simulate the tip corona discharge process under actual thunderstorm clouds. On the basis of the previous two-dimensional model, Guo et al. [22] established a three-dimensional variable grid tip corona discharge model and simulated the corona discharge characteristics for the tip shapes of different buildings. The smaller the radius of the curvature of the tip, the easier it was to produce a corona discharge and the greater the corona current was on the tip. Qie et al. [23] simulated the evolution of corona ions generated by a natural tip using an established one-dimensional numerical model and simulated the evolution of the positive and negative corona current density on the ground. Beccera et al. [24] established a two-dimensional space charge numerical model and obtained the influence of positive and negative space charges on the electric field.
At present, most of the existing numerical simulation studies have mainly been based on the single-polarity corona discharge model, especially considering a positive-polarity corona. Although Qie et al. [23] and Beccera et al. [24] introduced the evolution process of a bipolar charge in their models, their research objects did not involve the corona discharge at the tip of ground buildings, and the models used were only one-dimensional or two-dimensional, which made it difficult to fully reflect the complex discharge process in a real thunderstorm environment. In an actual observation, Soula et al. [25] and Guo et al. [26] pointed out that in the thunderstorm cloud environment, the polarity reversal of the electric field often occurs. In this context, the corona charge formed at an early stage may have a significant impact on the subsequent heteropolar corona discharge. Therefore, in order to further explore the dynamic evolution and interaction mechanism of the corona discharge at the tip of the building during the polarity reversal process of the electric field in the thunderstorm environment, it is particularly important to develop a three-dimensional positive and negative corona discharge model. The model can simultaneously simulate the development process of positive and negative corona discharges, which can provide a theoretical basis and simulation support for a comprehensive understanding of the spatial and temporal distribution of the corona discharge in thunderstorms. The relevant simulation results will be introduced in detail in the subsequent chapters of this article.
The wind field will affect the motion of the corona charge. When a wind field exists, the corona charge will produce a diffusion motion, which will affect the corona discharge characteristics. Bazelyan et al. [27] evaluated the influence of the wind speed on the corona current based on Aleksandrov et al.’s [17] one-dimensional model and Zou et al.’s [28] two-dimensional model. By proposing a three-dimensional variable grid positive corona discharge model, Guo et al. [29] revealed the multiple effects of wind speed changes on corona discharge characteristics.
Therefore, based on the three-dimensional variable grid positive corona discharge model established by Guo et al. [30], a three-dimensional positive and negative corona discharge model was developed, which included two cases with or without a wind field. The corona discharge characteristics of the whole thunderstorm process were comprehensively simulated, and the results will be introduced in this paper.

2. Establishment and Verification of Model

2.1. The Establishment of the Model

In order to reflect the actual electric field variation law when the thunderstorm cloud is in transit as much as possible, this paper referred to the atmospheric electric field data presented in the articles of Yosho et al. [15] and Guo et al. [26] and extracted three typical waveforms and their electric field amplitude variation characteristics. The background electric field Eb included a positive and negative symmetric sawtooth wave (waveform A), a positive and negative symmetric triangular wave (waveform B), and a positive and negative asymmetric triangular wave (waveform C). The positive and negative symmetric sawtooth waves were referenced from the article by Yosho et al. [15], and the positive and negative symmetric triangular waves and the positive and negative asymmetric triangular waves were referenced from the article by Guo et al. [26]. The electric field amplitudes of the three waveforms were also determined according to the above literature: the positive and negative peaks of waveforms A and B were both ±10 kV/m, representing the typical strength of the electric field under common thunderstorm conditions; the positive peak value for waveform C was +10 kV/m, and the negative peak value was −20 kV/m, which reflected the asymmetric electric field situation in an actual thunderstorm. These settings not only considered physical authenticity but also facilitated the comparative analysis of the correlation between the change in the electric field polarity and discharge characteristics. The total simulation time was 4 s, and the time resolution was 0.0004 s. Setting the forward simulation time to 4 s enabled us to control the length of the simulation calculation and improve the simulation efficiency while ensuring a good time resolution. The calculation formula for the background electric field Eb is shown in Equations (1)–(3), and the change trend is shown in Figure 1.
E b = 5 t + 10 ( k V / m ) , 0 s t 4 s
E b = 10 t ( k V / m ) , 0 s t 1 s 10 t + 20 ( k V / m ) , 1 s < t 3 s 10 t 40 ( k V / m ) , 3 s < t 4 s
E b = 10 t ( k V / m ) , 0 s t 1 s 10 t + 20 ( k V / m ) , 1 s < t 2 s 20 t + 40 ( k V / m ) , 2 s < t 3 s 20 t 80 ( k V / m ) , 3 s < t 4 s
The background electric field waveform will significantly affect the characteristics of positive and negative corona discharges. Therefore, it was necessary to briefly analyze the physical mechanism of positive and negative corona discharges before modeling. Under the two polarities, during the discharge process, electrons, ions, and neutral gas molecules interact with each other, involving multiple physical processes such as collision, recombination, and adsorption.
A positive corona discharge usually begins with the ionization of gas on the tip surface. The initial electrons accelerate to the tip under the action of a strong electric field and collide with neutral molecules to produce more electrons, forming an electron avalanche. Since the velocity of electrons is much larger than that of positive ions, electrons are mainly concentrated in the front region of the avalanche, while positive ions are retained in situ, resulting in charge accumulation and spatial electric field distortion. In the process of an electron avalanche, positive and negative ions recombine violently to release energy, and the excited particles decay to emit photons. These photons can further ionize neutral molecules, generate photoelectrons and trigger secondary electron avalanches, and promote the continuous development of the discharge.
In contrast, a negative corona is mainly caused by electrons escaping from the tip and away from the electrode along the direction of the electric field, causing collision ionization during motion. Since negative ions can be formed through the electron attachment process and their migration speed is slow, the negative corona discharge area is usually more dispersed, and the space charge distribution is wider. In addition, due to the high density of electrons in a negative corona, the local electric field is easily weakened, resulting in a relatively weak discharge intensity but a longer duration.
On this basis, this paper establishes a positive and negative corona discharge model, and the Peek formula [31], Kaptzov’s assumption [32,33,34], and the ion convection–diffusion equation are the three main equations of the three-dimensional positive and negative corona discharge model established in this paper.
First of all, the threshold for the corona onset electric field Ecor is calculated using the Peek formula, with the corresponding calculation formula shown in Equation (4):
E c o r = 27.2 ( 1 + 0.54 r r o d )
rrod is the radius of the curvature of the lightning rod, the value of it is 0.0005 m, and the value of Ecor can be calculated as 3.75 × 10⁶ V/m.
Kaptzov’s hypothesis points out that the electric field on the tip surface remains unchanged at the threshold Ecor after the tip surface coronas. The specific performance is as shown in Equation (5):
E t i p ( t 0 ) E c o r
Here, Etip(t0) is the electric field value of the tip surface after a time of t0.
With the generation of the corona on the tip surface, the generated corona charge will undergo convection–diffusion motion. This mainly involves a conversion between large and small positive and negative ions and neutral aerosol particles, including four processes: diffusion motion caused by different ion (particle) concentrations, composite action between opposite polarity ions, the migration motion of ions (particles) under the electric field force or wind field, and the adsorption of small positive and negative ions by aerosol particles. The convection–diffusion equation is shown in Equation (6):
n + t = D · 2 n + k n + N 0 · n + · N 0 k n + N · n + · N α · n + · n · ( n + · μ n + · E ) n t = D · 2 n k n N 0 · n · N 0 k n N + · n · N + α · n + · n · ( n · μ n · E ) N + t = D · 2 N + + k n + N 0 · n + · N 0 k n N + · n · N + · ( N + · μ N + · E ) N t = D · 2 N + k n N 0 · n · N 0 k n + N · n + · N · ( N · μ N · E ) N 0 t = D · 2 N 0 + k n N + · n · N + + k n + N · n + · N k n + N 0 · n + · N 0 k n N 0 · n · N 0
Here, n+ and n are the concentrations of small positive and negative ions, N+ and N are the concentrations of large positive and negative ions, N0 is the concentrations of neutral aerosol particles, D = 1 m2·s−1 is the turbulent diffusion coefficient of the ions, and μn+ and μn are the mobility of small positive ions and small negative ions, respectively, and their values are 1.5 × 10⁻⁴ m2·(V·s)−1 and −2 × 10⁻⁴ m2·(V·s)−1, respectively. μN+ and μN− are the mobility of small positive ions and small negative ions, and their values are 1.5 × 10⁻⁶ m2·(V·s)−1 and −2 × 10⁻⁶ m2·(V·s)−1, respectively. kn+N0 = 2.9 × 10⁻¹² m3·s−1 is the adsorption rate of small positive ions by aerosol particles, kn−N0 = 3.5 × 10⁻¹² m3·s−1 is the adsorption rate of small negative ions by aerosol particles, kn+N− = 5 × 10⁻¹² m3·s−1 is the recombination coefficient of small positive ions and large negative ions, kn−N+ = 6 × 10⁻¹² m3·s−1 is the recombination coefficient of small negative ions and large positive ions, α = 1.6 × 10⁻¹² m3·s−1 is the recombination coefficient of small positive ions and small negative ions, t is the time, and E represents the environmental electric field [23,24,35].
When a wind field is added, the ion convection–diffusion equation is shown in Equation (7):
n + t = D · 2 n + k n + N 0 · n + · N 0 k n + N · n + · N α · n + · n · ( n + · μ n + · E + n + · v ) n t = D · 2 n k n N 0 · n · N 0 k n N + · n · N + α · n + · n · ( n · μ n · E + n · v ) N + t = D · 2 N + + k n + N 0 · n + · N 0 k n N + · n · N + · ( N + · μ N + · E + N + · v ) N t = D · 2 N + k n N 0 · n · N 0 k n + N · n + · N · ( N · μ N · E + N · v ) N 0 t = D · 2 N 0 + k n N + · n · N + + k n + N · n + · N k n + N 0 · n + · N 0 k n N 0 · n · N 0 · ( N 0 · v )
where v is the wind field.
When solving the above ion convection–diffusion equation, the range of the whole simulation domain is set to 500 m × 500 m × 500 m. For the convection–diffusion module, the upper horizontal boundary is set as a convection edge and the remaining boundaries (except for the rod surface boundary) are considered as zero flux boundaries. The surface of the rod where the local electric field is equal to or larger than the corona onset field Ecor is defined as a concentration boundary, generating a corona according to Kaptzov’s assumption. The point where a corona discharge occurs on the tip of a building is a fixed boundary, and the other boundaries of the building are approximated by the forward difference.
In this paper, the upper boundary, ground, and building in the three-dimensional simulation domain were set as the first boundary, and the other four boundaries are set as the second boundary. In this paper, the over-relaxation iteration method was used to calculate the potential value of each lattice point. The corresponding electric field value can be obtained by calculating the potential value. The calculation formula for the electric field is shown in Equation (8):
E = φ
where E is the electric field value.
The potential value of each grid point in the three-dimensional space can be obtained by solving the Poisson equation. The formula for obtaining the potential value is shown in Equation (9):
2 φ = ρ ε 0
Here, is the Laplace operator, φ is the electric potential, ρ is the volume density of the corona charge, and ε 0 is the vacuum capacitance rate (vacuum dielectric constant), which is 8.854 × 10⁻¹² F·m−1.
The volume density of the corona charge can be calculated using the small and large positive and negative ions. According to the above Formulas (8) and (9), the calculation formulas for the electric field and potential can be further obtained. The calculation formula is shown in Equation (10):
2 φ = e 0 ( n + + N + n N ) ε 0
Here, e 0 is the amount of elemental charge, and ε 0 is the vacuum capacitance rate.

2.2. Model Validation

In order to verify the accuracy and reliability of the model established in this paper, considering that a change in the background electric field waveform is realized by adjusting the change in the electric field with time, in this section we describe the selection of the positive and negative symmetric sawtooth wave background electric field for comparative verification. In this paper, the observation results of Yosho et al. [15] were selected as the basis for comparative analysis, and the simulation results were compared with them in detail.
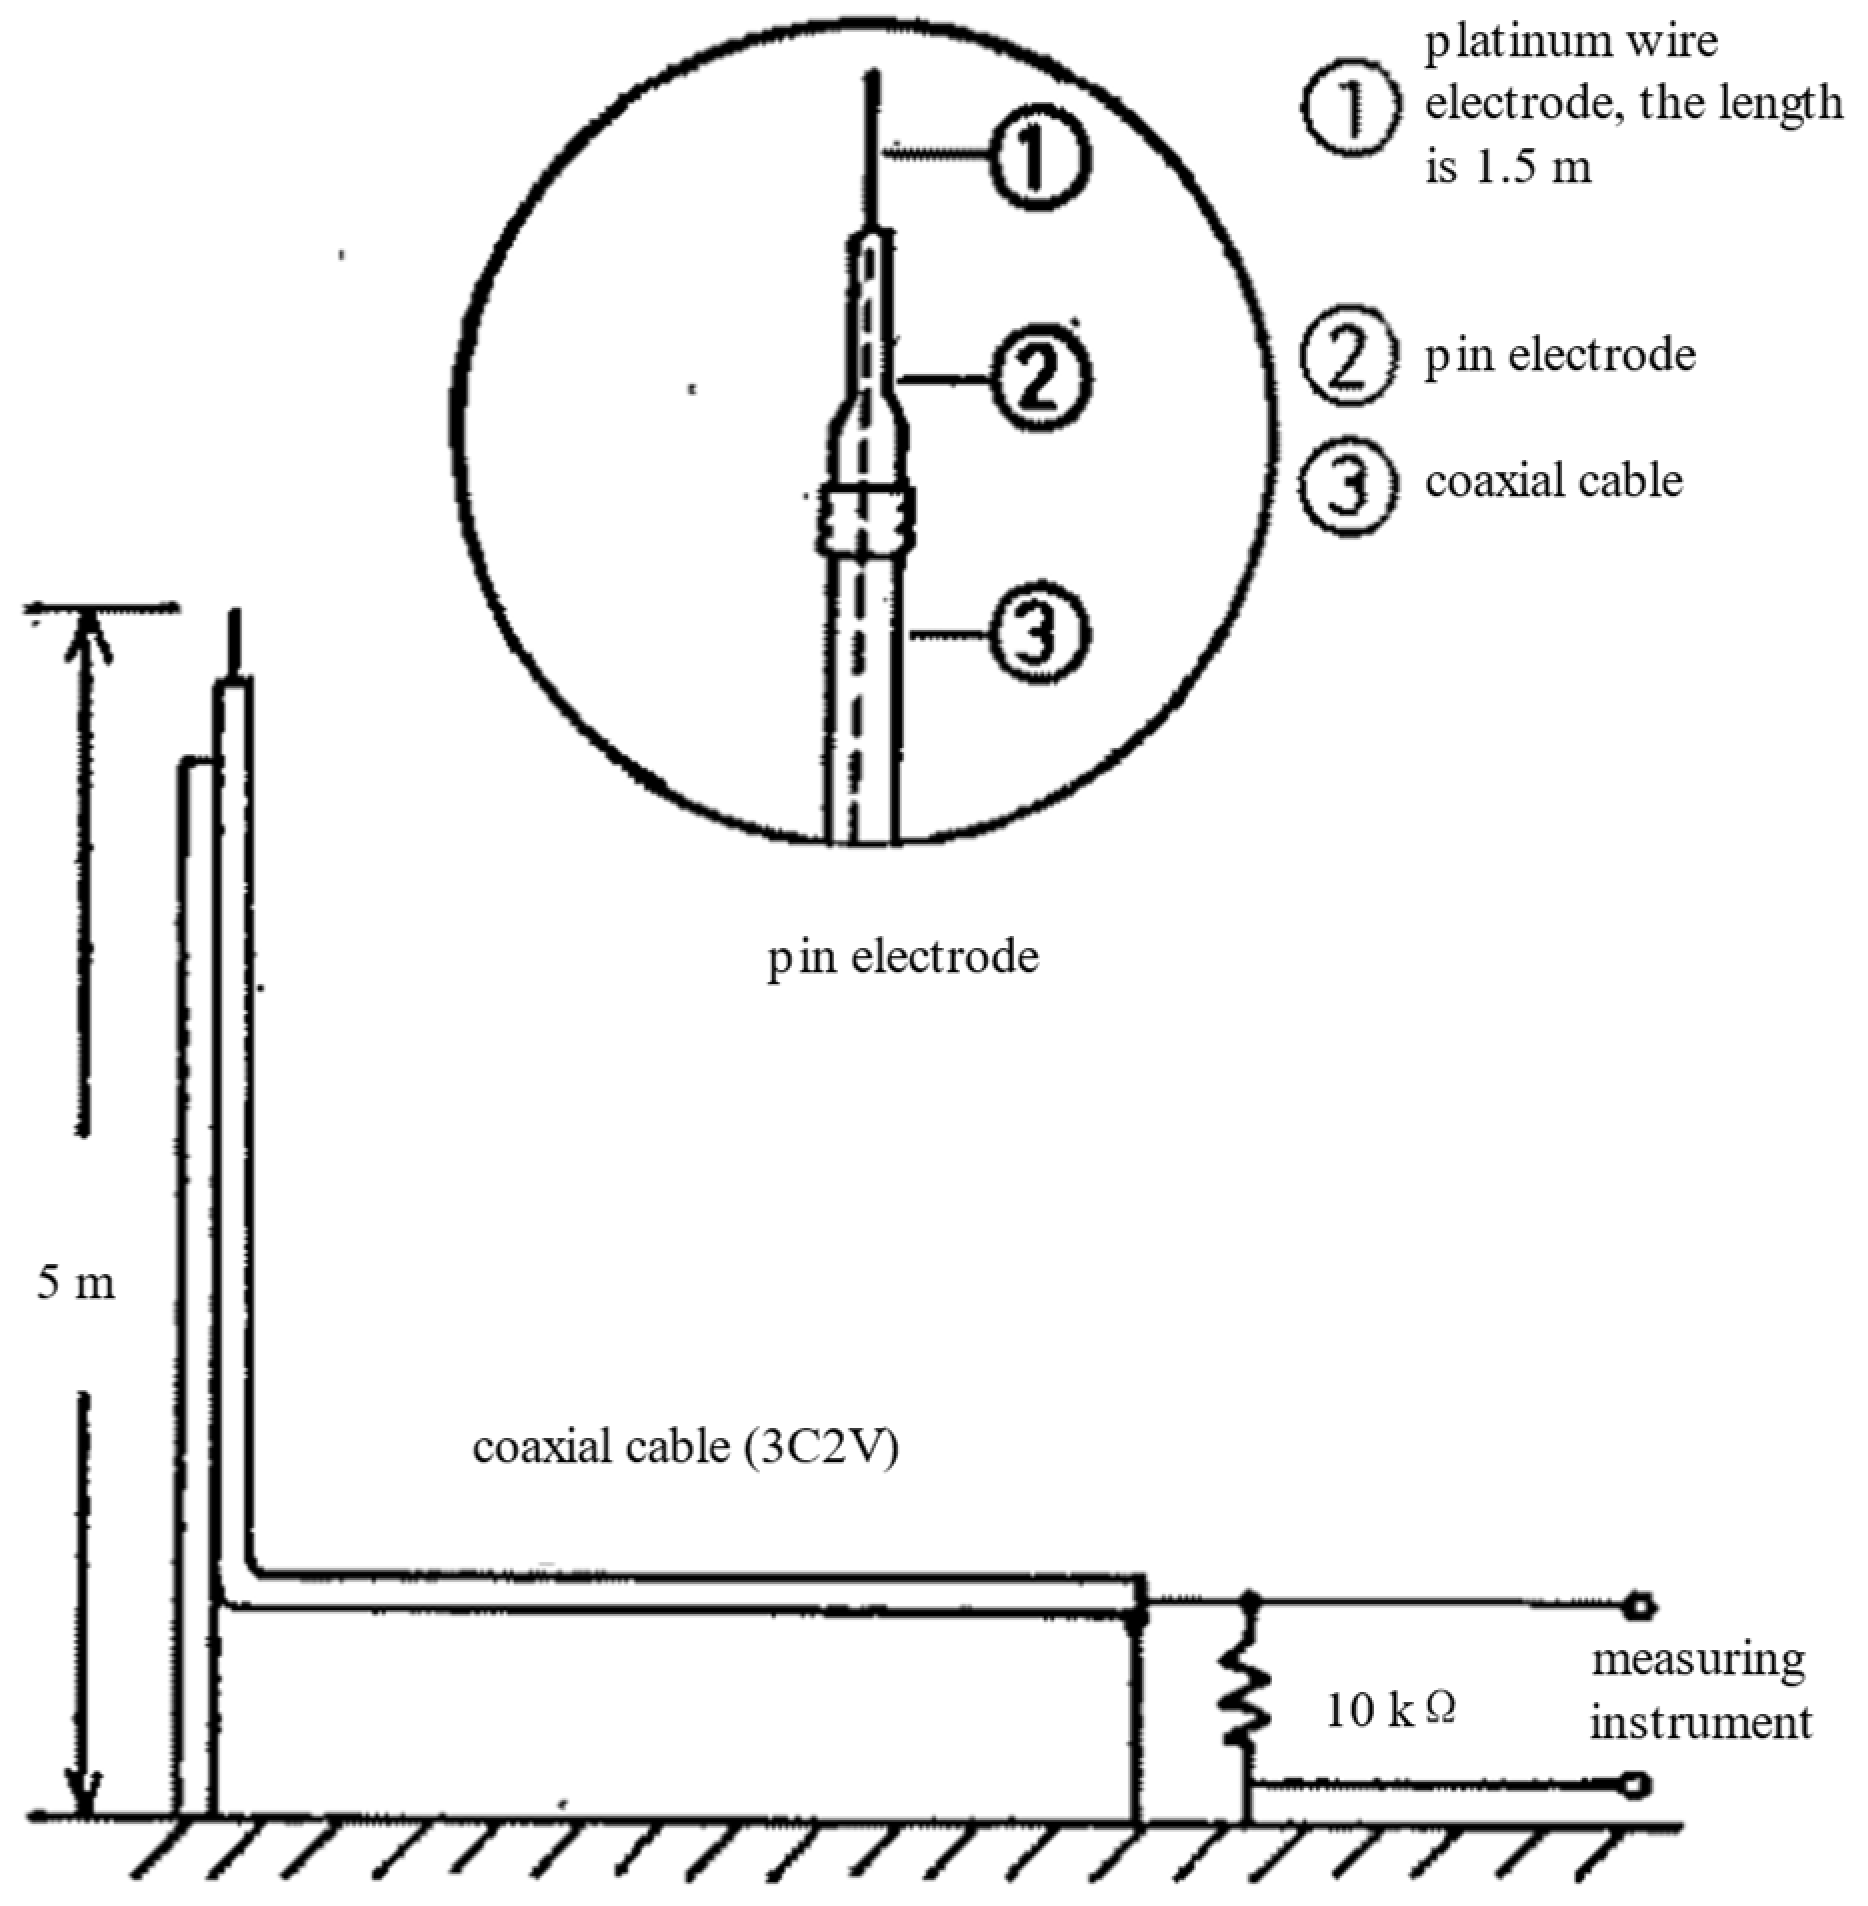
Yosho et al. [15] fixed a 1.5 m long platinum wire on a grounding needle electrode with a total height of 5 m and connected it to a measuring device about 10 m away from the needle electrode using a coaxial cable to measure the corona current and the near-ground electric field. The specific measurement device layout is shown in Figure 2. In this paper, the background electric field waveform was set to be a positive and negative symmetrical sawtooth wave. The absolute value of the background electric field peak was set to be 10 kV/m, the three-dimensional space simulation domain was 500 m × 500 m × 500 m, the total simulation time was 4 s, the time resolution was set to be 0.0004 s, and the building height was 5 m.
Since the total simulation time of the observation was at the minute level and there were certain limitations in the calculation of this model due to the calculation of the cornerstone, only a simulation study at the second time scale could be carried out at the time. Considering that this paper mainly focuses on the influence of the electric field waveform on the corona discharge, we selected observation results from a specific period of time for simulation verification, and the total simulation time was set to 4 s. Figure 3 shows the comparison results under approximate environmental conditions. In Figure 3a, the first image shows the observation results over the whole time period, while the second image shows the electric field waveform of a time period within it. In Figure 3b, the first image shows the background electric field waveform used in this model, the second image shows the change trend of the tip corona current, and the third image shows the change trend of the near-surface electric field with time.
It can be seen from Figure 3 that the tip corona current reached its maximum at the peak of the background electric field. When the background electric field was converted from a positive polarity to a negative polarity, there was a certain time delay in the generation of the negative corona current. This was mainly due to the fact that the electric field threshold for the negative corona discharge was not reached after the electric field direction was reversed, which led to the current generation lagging behind the electric field change. The variation trend of the corona current simulated by the model proposed in this paper was basically consistent with that from the observation results, but there were some differences in the peak value.
In the observation, the corona current was measured using a coaxial cable at a distance of 10 m from the needle electrode, and the model proposed in this paper was simulated based on the current near the tip. In a thunderstorm environment, a coaxial cable will produce a shielding effect, resulting in corona current attenuation, especially in long-distance transmission [36], which may lead to errors between the measured value and the actual value. At the same time, the tip material will also affect the current size [37]. This model assumed that the tip was a good conductor, and platinum wire was used in the observation experiment. The latter had low conductivity, so the corona current was different. In addition, the corona current may have been affected by the background electric field in the previous period.
In the lightning experiment conducted by Yosho et al. [15], in the second half of the observation, when the ground electric field increased from 1.5 kV/m to 14 kV/m, the corona current generated on the tip at a height of 5 m increased from 8 μA to 10 μA, indicating that the corona current can reach several microamperes. Due to the difference between the model setting and the observation, the current could not be completely consistent, but the change trend was basically consistent, so the model had a certain amount of reliability.
In addition, the near-ground electric field changes were numerically simulated at 5 m, 10 m, and 15 m from the ground. The results show that the ground electric field was obviously distorted when the horizontal distance was 5 m. When the horizontal distance was 10 m, the position was consistent with the observation point. Although there was still some distortion, it was close to the observation result. When the horizontal distance increased to 15 m, the difference between the ground electric field and the background electric field was the smallest, indicating that the smaller the horizontal distance, the greater the distortion of the ground electric field. In addition, in the background electric field reduction stage, there was a certain morphological difference between the simulated electric field change curve and the observed data, which may have been related to factors such as the change rate of the electric field; the change in the ground electric field may also have been affected by the electric field in the previous time period. However, based on the overall trend, it can be seen that the variation in the near-surface electric field simulated by the model with time was consistent with the observation results, meaning the model could reasonably simulate the evolution characteristics of the near-surface atmospheric electric field and could simulate more corona discharge characteristics.
In summary, the variation trend of the corona current and ground electric field for the model proposed in this paper was basically consistent with the observation results. Therefore, the model established in this paper had high accuracy and reliability as a whole.
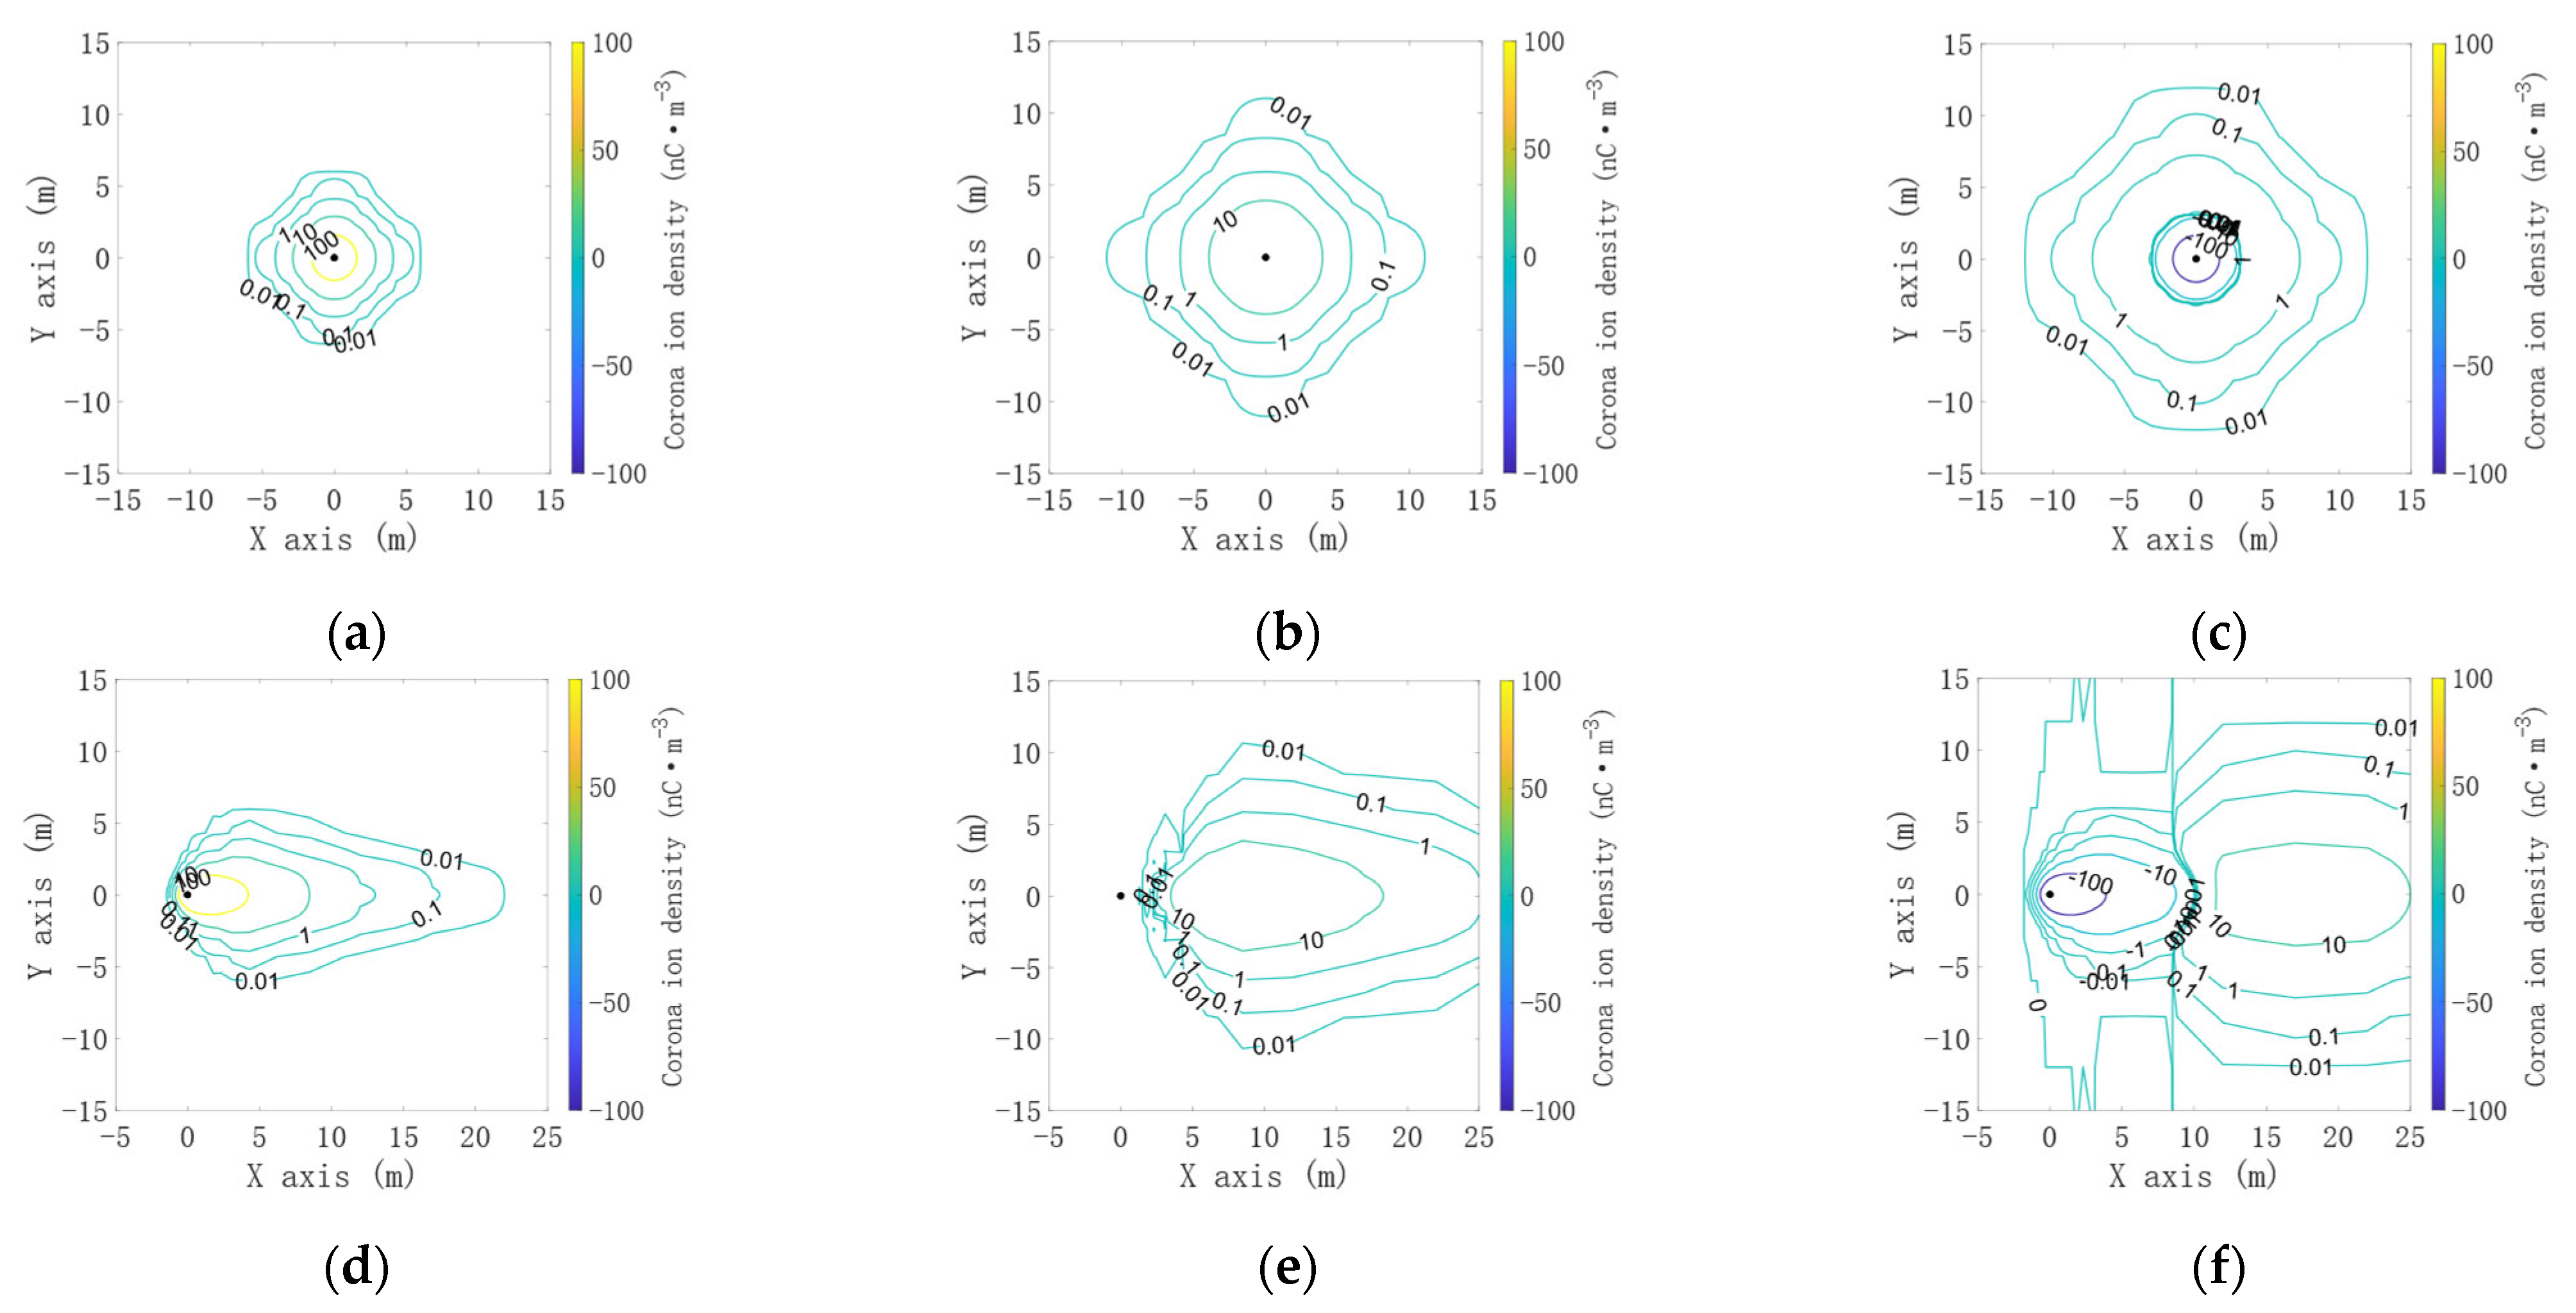
Using the established three-dimensional positive and negative corona discharge model, the corona discharge characteristics of a single building with a height of 10 m at a horizontal wind speed of 10 m/s were simulated, so as to verify the accuracy and applicability of the model. This paper only studied the influence of the horizontal wind speed on the model. The tip positive and negative corona discharge characteristics of a single building with a height of 10 m at a horizontal wind speed of 10 m/s were studied when the wind field was added. The wind field affected the corona charge generated by the tip corona discharge and caused it to migrate, thus changing the spatial distribution of the corona charge and the corona electric field. Figure 4 and Figure 5 show the spatial distribution maps of the corona charge, including the XZ section (side view) and XY section (top view), respectively. Figure 6 shows the spatial distribution map of the corona electric field as the XZ section (side view).
It can be seen from Figure 4 that when a wind field did not exist, the corona charge was symmetrically distributed at each moment. However, it can be seen from Figure 5 that the presence of a wind field caused the corona charge generated at the tip of the building to shift significantly. When the background electric field was 0, the tip no longer produced a corona discharge. At this time, the corona charge shifted and left the tip due to the influence of the wind field. At the time of the negative peak of the background electric field, positive and negative corona charges existed at the same time. At this time, the wind field formed a positive corona charge region on the right side of the tip. It can be seen from Figure 6 that when there was no wind field, the corona electric field was consistent with the corona charge distribution, both of which were symmetrically distributed. Under the action of the wind field, the corona electric field also shifted, which was closely related to the change in the corona charge. At the negative peak of the background electric field, positive and negative electric field regions coexisted on the right side of the tip. Therefore, the existence of a wind field will significantly affect the characteristics of the tip corona discharge, and the model established in this paper can reasonably reflect this effect and has high reliability.

3. Model Application

3.1. Comparison of Positive and Negative Corona Discharge Model and Unipolar Corona Discharge Model

In this section, the established positive and negative corona discharge model is compared with the unipolar corona discharge model. The background electric field waveform was a positive and negative symmetrical triangular wave. The absolute value of the background electric field amplitude was 10 kV/m. The simulation time was 4 s. The time resolution was 0.0004 s. In order to simplify the geometric modeling process, the building was considered to be equivalent to an independent lightning rod with a height of 5 m and a radius of 0.0005 m. The environment surrounding the lightning rod was assumed to be an open and uniform area. The comparison results are shown in Figure 7. In the change trend diagram for the background electric field, the diagram of the positive and negative polarity model overlaps with the diagram of the unipolar model in the negative half cycle.
It can be seen from Figure 7 that compared with the unipolar corona discharge model under the same waveform and amplitude of the background electric field, the negative corona current of the positive and negative corona discharge model was generated earlier, the peak value of the negative corona current was larger, and the duration of the negative corona discharge was longer. The reason for this was that due to the influence of the first half cycle, the background electric field required for a corona discharge was smaller, and the corona current was generated earlier, but the end time was equivalent. At the same time, due to the neutralization effect of positive and negative corona charges, the peak value of the total corona charge in the second half cycle was significantly smaller than that of the unipolar model.
In summary, the positive and negative corona discharge model can demonstrate the influence of background electric field changes before and after a reversal of polarity. Compared with the unipolar corona discharge model, it considers the corona discharge characteristics more comprehensively. Therefore, the development of the positive and negative corona discharge model has important practical significance.

3.2. Comparison of Positive and Negative Corona Discharge Models and Unipolar Corona Discharge Models at Different Building Heights

The characteristics of the tip corona discharge at different building heights are different. The building was simplified to an independent lightning rod with a radius of 0.0005 m, and the heights were set to 5 m, 10 m, 20 m, 30 m, and 60 m, respectively. The environment surrounding the lightning rod was assumed to be an open and uniform area. Figure 8 shows the variation characteristics of the tip corona current corresponding to buildings at different heights under the two models.
It can be seen from Figure 8 that the peak value of the corona current in both models appeared at the peak value of the background electric field. The tip corona current increased with an increase in the building height, and the generation time for the negative corona current also increased with an increase in the building height. However, at different heights, the peak value of the negative corona current in the positive and negative polarity model was larger than that in the unipolar model, the generation time for the negative corona current was earlier than that in the unipolar model, and the duration of the negative corona discharge was longer. Due to the influence of the first half cycle, the background electric field required for a tip corona discharge in the positive and negative polarity model was smaller, the negative corona current was generated earlier, and the end time was equivalent.
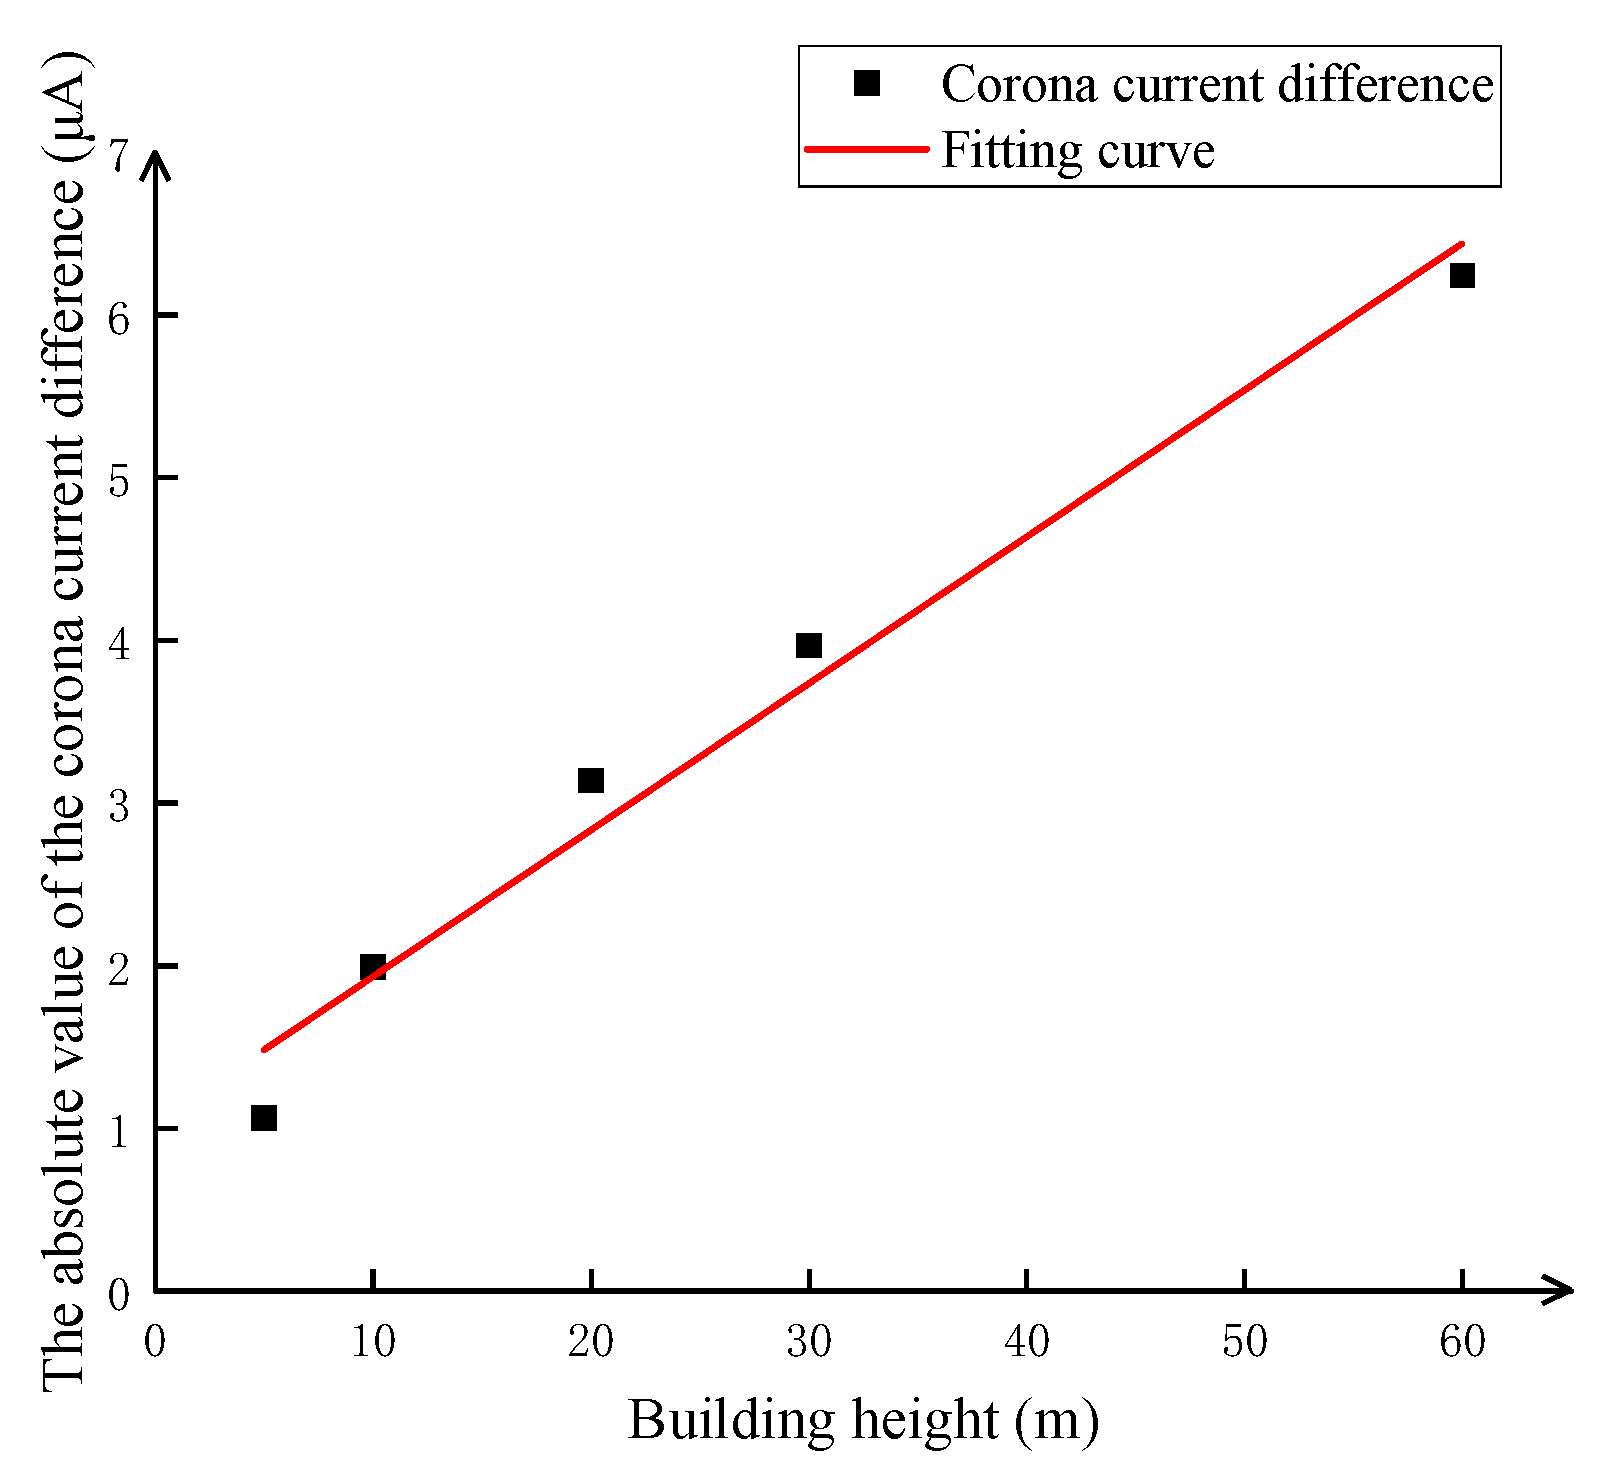
Therefore, the absolute value of the difference (ΔI) between the negative corona current obtained using the positive and negative polarity model and the unipolar model was fitted with the building height (H) to obtain a fitting curve, as shown in Figure 9. The fitting curve reached a significant level of 0.05.
It can be seen from Figure 9 that the corona current difference had a linear relationship with the height of the building, and the corona current difference increased with an increase in the height of the building. The relationship between the two was obtained as follows:
ΔI = 0.090·H + 1.025
where the unit for ΔI was μA, the unit for H was m, and the applicable range for the relationship was 5–60 m.
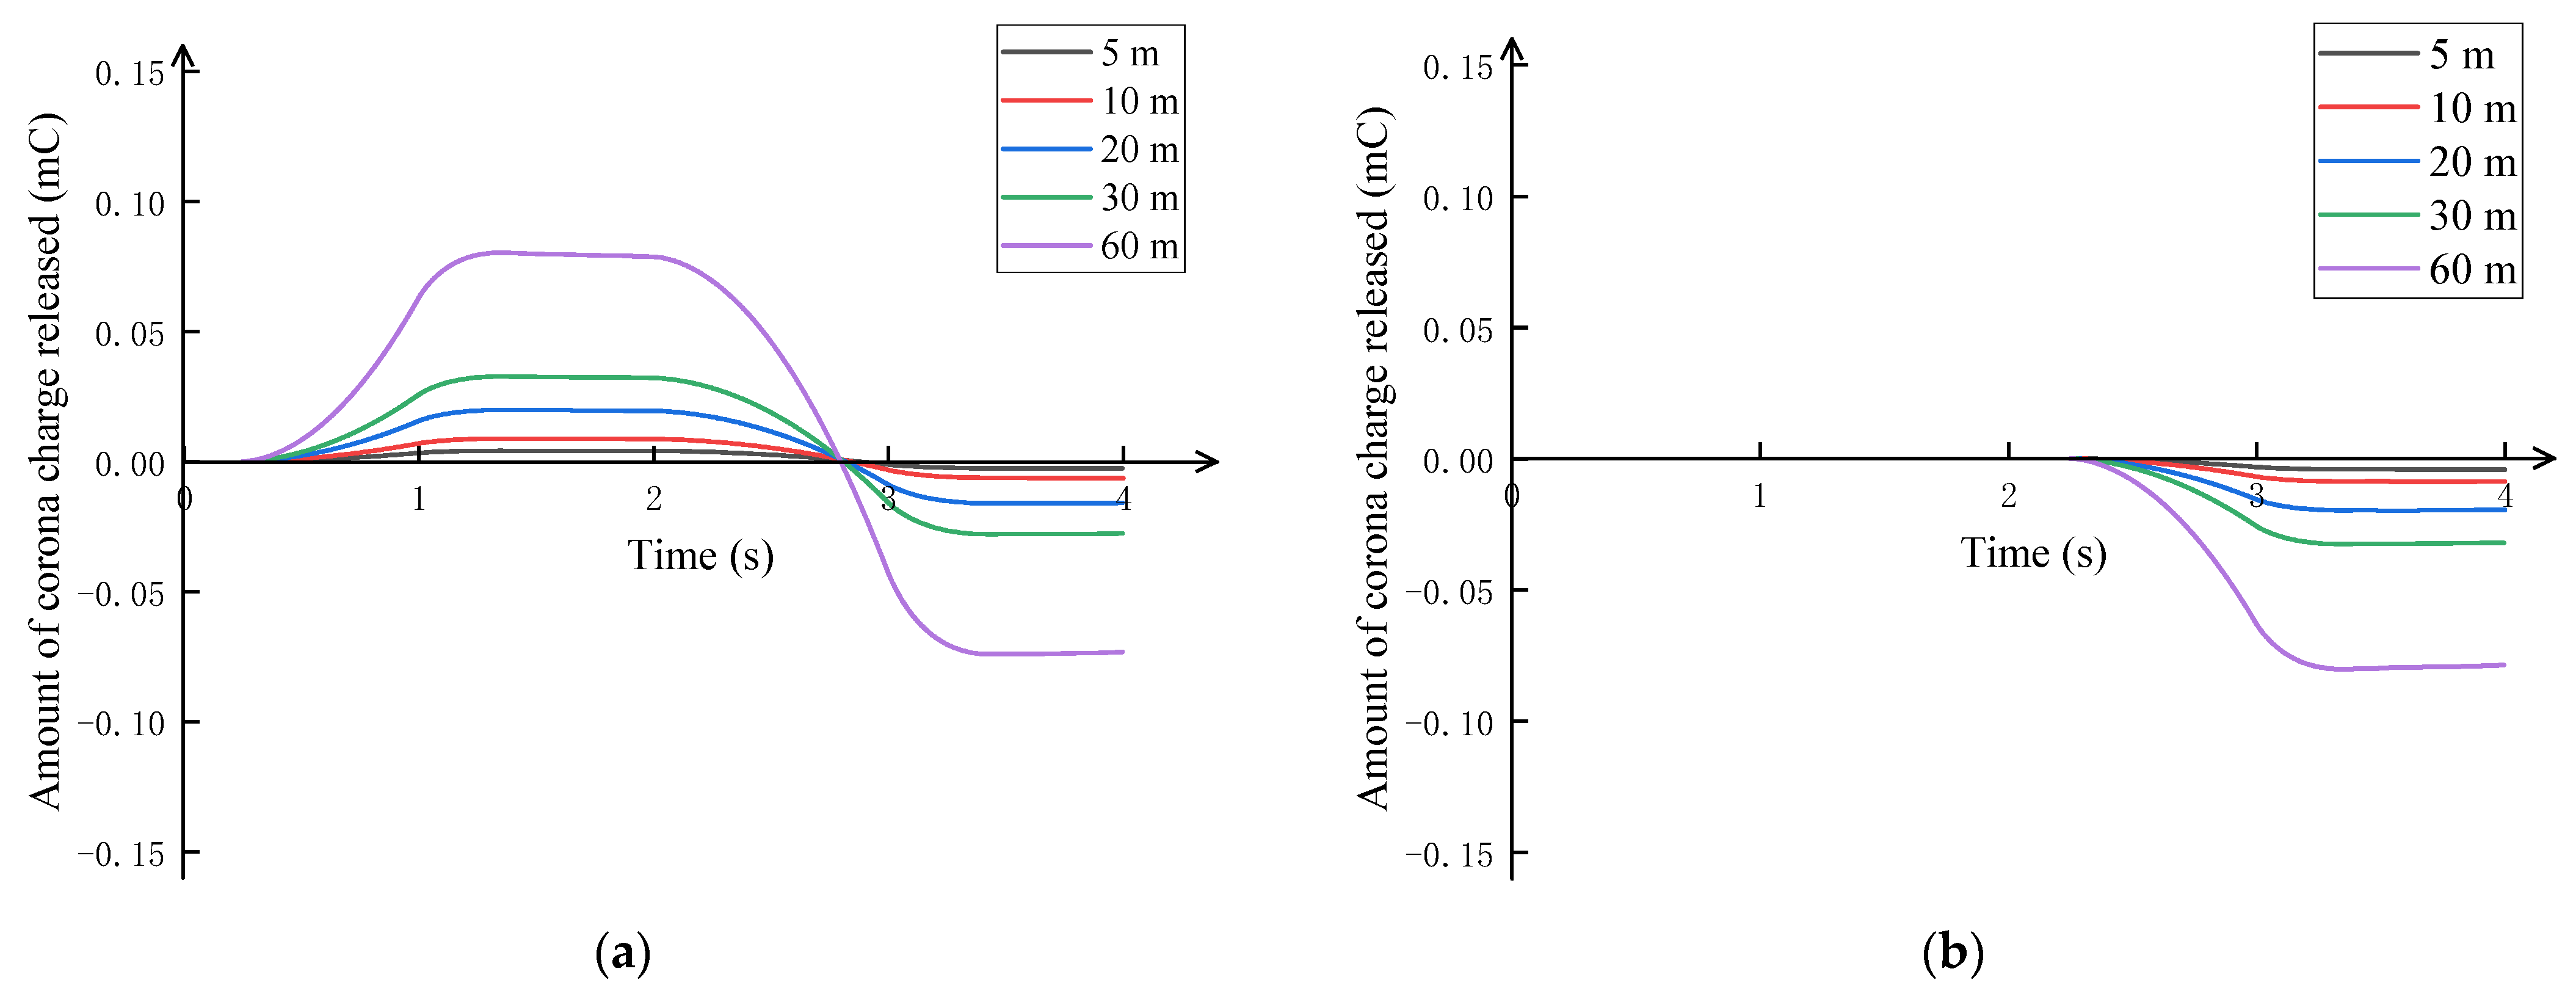
Figure 10 shows the variation characteristics of the tip corona charge corresponding to buildings of different heights under the two models.
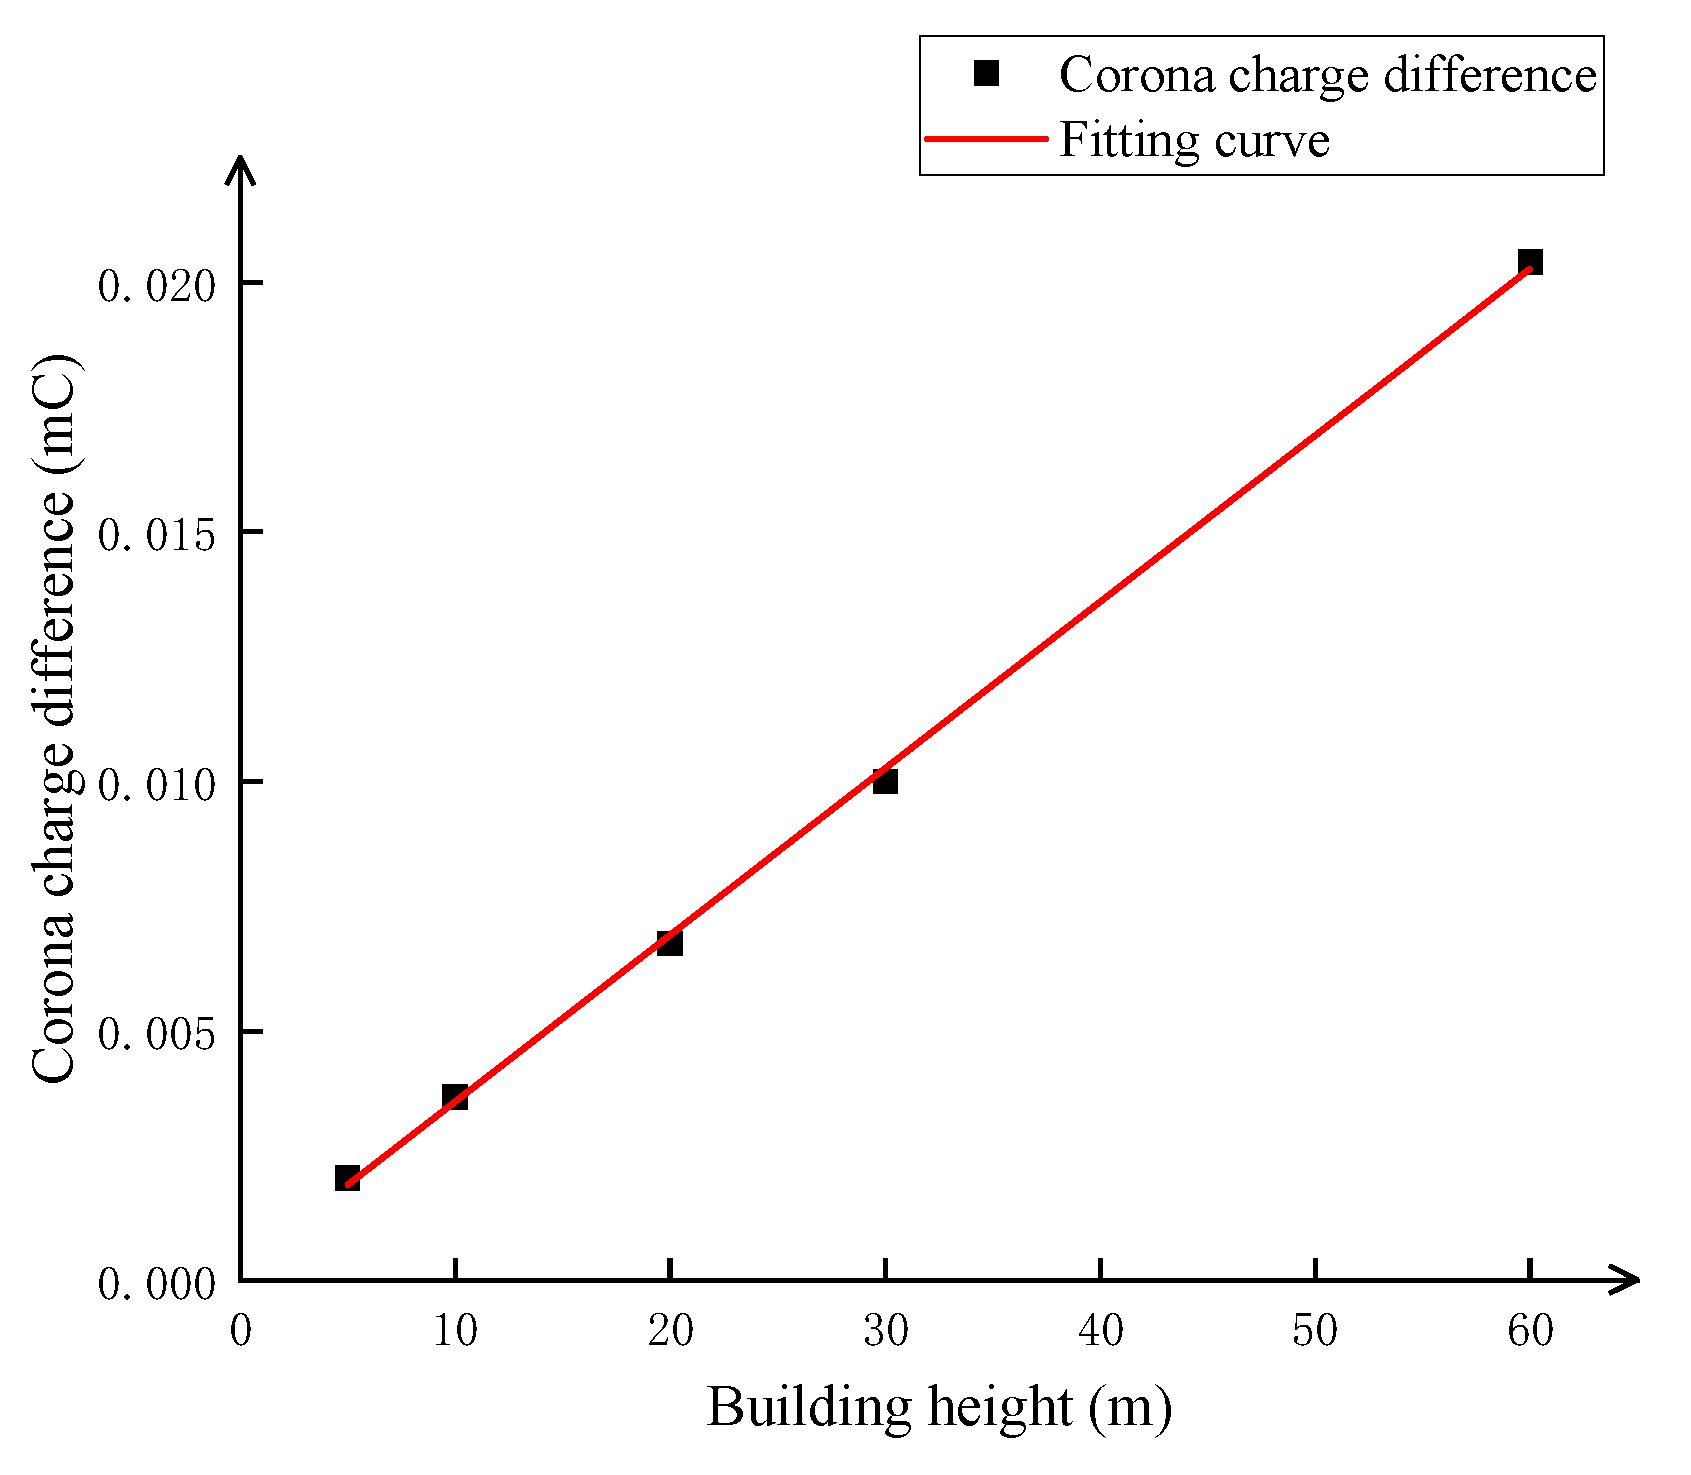
It can be seen from Figure 10 that the higher the height of the building, the more significant the increase in the corona charge released. At different building heights, the negative corona charge in the positive and negative polarity model was smaller than the negative corona charge in the unipolar model. The reason for this was that the positive and negative charges were neutralized when the polarity of the electric field was reversed, resulting in the final amount of the corona charge released. The amount was negative, and the absolute value of the negative corona charge was slightly smaller than that of the positive corona charge released.
Therefore, the value of the difference (ΔQ) between the negative corona charges in the positive and negative polarity model and the unipolar model was fitted with the building height (H) to obtain a fitting curve, as shown in Figure 11. The fitting curve reached a significant level of 0.05.
It can be seen from Figure 10 that the negative corona charge difference had a linear relationship with the height of the building. The negative corona charge difference increased with an increase in the height of the building. The relationship between the two was obtained as follows:
ΔQ = 3.337 × 10⁻⁴·H + 2.332 × 10⁻⁴
where the unit for ΔQ was mC, the unit for H was m, and the applicable range for the relationship was 5–60 m.
In summary, the tip corona discharge characteristics of buildings at different heights were in line with those in an actual situation, and the previous unipolar model could not simulate the tip corona discharge characteristics under electric field reversal, with the ability to do so being an advantage of this model.

4. Discussion

Compared with the previous unipolar corona discharge model, the positive and negative corona discharge model established in this paper had more advantages in terms of the scope of application and physical integrity. The unipolar model is usually based on the simulation of a positive or negative corona discharge, ignoring the influence of heteropolar corona discharges, and makes it difficult to accurately reflect the temporal and spatial distribution characteristics of a corona discharge under complex background electric field conditions. Especially in a thunderstorm environment, where the electric field changes rapidly and the polarity is reversed, the unipolar model often fails to capture the dynamic characteristics of charge polarity conversion and space charge accumulation and dissipation, and its descriptive ability has certain limitations. The positive and negative corona discharge model established in this paper comprehensively considers the migration, recombination, and attachment of positive and negative ions and can describe the evolution process of positive and negative corona discharges more comprehensively. The simulation results show that the first half-cycle corona discharge has a significant effect on the second half-cycle heteropolar corona discharge, which is often ignored in the unipolar model. At the same time, the model established in this paper also provides theoretical support for studying the discharge intensity, space charge accumulation, and its influence on the near-earth electric field during different polarity conversion processes.
Therefore, the model not only has more applicability and physical authenticity under the condition of a multi-polar and multi-waveform background electric field, but also provides theoretical support for studying the influence of a corona discharge on the near-ground electric field. Furthermore, the establishment of this model can provide basic support and a theoretical basis for the subsequent revision of atmospheric electric field measurement instruments and the optimization of lightning warning systems.

5. Conclusions

In this paper, a three-dimensional corona discharge numerical model considering the electric field polarity reversal process was developed for two cases with or without a wind field. The reliability of the model was verified by comparing the model with observation results. Furthermore, the positive and negative polarity model proposed in this paper was compared with the previous unipolar model. The results show that the corona discharge in the positive and negative polarity model is affected by the first half cycle. The required background electric field is smaller, the negative corona current is generated earlier and its peak value is larger, and the negative corona discharge duration is longer. At the same time, due to the neutralization effect of positive and negative corona charges, the peak value of the total corona charge in the second half cycle is significantly lower than that of the unipolar model. For example, when the building height was 5 m, the peak negative corona current in the positive and negative polarity model was −20.672 μA, and the peak negative corona current in the unipolar model was −19.609 μA. The peak negative corona current in the positive and negative polarity model was 5.42% larger than that in the unipolar model. The peak value of the negative corona charge in the positive and negative polarity model was—2.69 × 10⁻³ mC, and the peak value of the negative corona charge in the unipolar model was—4.11 × 10⁻³ mC. The peak negative corona charge in the positive and negative polarity model was 34.55% smaller than that in the unipolar model.
Based on the established three-dimensional positive and negative corona discharge model, the characteristics of a corona discharge at the tip of buildings at different heights under the two models were compared, including the characteristics of the corona current and total corona charge released. The results show that the corona current and corona charge increase with an increase in the building height, and the generation time for a negative corona current increases with an increase in the building height, and the duration of a negative corona discharge increases with an increase in the building height. In addition, the absolute value of the negative corona current difference and the negative total corona charge difference between the two models increased linearly with an increase in the building height, which proves that the model proposed in this paper is not only applicable to buildings of different heights but also has high accuracy and reliability.

Author Contributions

Conceptualization, Z.W., B.W. and X.G.; methodology, B.W. and X.G.; software, Z.W.; validation, Z.W. and X.G.; writing—original draft preparation, Z.W.; checking, N.Z., H.Z., Y.Z. (Yubin Zhao) and Y.Z. (Yuhang Zheng). All authors have read and agreed to the published version of the manuscript.

Funding

This research was funded by the National Natural Science Foundation of China (grant number 42205078); the Young Talent Support Project, Jiangsu Association for Science and Technology (grant number JSTJ-2023-077); the Key Laboratory of Lightning, China Meteorological Administration (grant number 2025KELL-B001); and the ‘Qinglan Project’ of Jiangsu University.

Institutional Review Board Statement

Not applicable.

Informed Consent Statement

Not applicable.

Data Availability Statement

Due to the confidentiality of laboratory data, we can not provide raw data.

Conflicts of Interest

The authors declare that this research was conducted in the absence of any commercial or financial relationships that could be construed as a potential conflict of interest.

References

  1. Townsend, J.S. Electricity in gases. J. Rőntgen Soc. 1915, 11, 87. [Google Scholar] [CrossRef]
  2. Moreau, E.; Audier, P.; Benard, N. Ionic wind produced by positive and negative corona discharges in air. J. Electrost. 2018, 93, 85–96. [Google Scholar] [CrossRef]
  3. Zhang, Y.J.; Meng, J. Lightning detection technology development and data application. J. Appl. Meteor. 2006, 17, 10. [Google Scholar]
  4. Mokrov, M.S.; Raizer, Y.P. Development of a positive corona from a long grounded wire in a growing thunderstorm field. J. Phys. D Appl. Phys. 2013, 46, 5202. [Google Scholar] [CrossRef]
  5. Wang, Y.J.; Zhou, B.Q. Lightning law and lightning protection design analysis of super high-rise buildings. Guangdong Meteor. 2019, 41, 70–72. [Google Scholar]
  6. Moore, C.B.; Rison, W. Lightning rod improvement studies. J. Appl. Meteor. 2000, 39, 593–609. [Google Scholar] [CrossRef]
  7. Zipse, D.W. Lightning protection systems: Advantages and disadvantages. IEEE Trans. Ind. Appl. 1994, 30, 1351–1361. [Google Scholar] [CrossRef]
  8. Qie, X. Lightning Physics; Science Press: Beijing, China, 2013. [Google Scholar]
  9. Chen, S.S. Simulation Study on Corona Space Charge Distribution Characteristics of UHV DC Transmission Lines During Thunderstorms. Master’s Thesis, Huazhong University of Science and Technology, Wuhan, China, 2019. [Google Scholar]
  10. Zeng, F.H.; Guo, F.X. Formation mechanism of positive charge region at the bottom of thunderstorm clouds over inland plateau of China. Sci. Tech. Eng. 2019, 19, 25–33. [Google Scholar]
  11. Tan, Y.; Guo, X. Influence on simulation accuracy of atmospheric electric field around a building by space resolution. Atmos. Res. 2014, 138, 301–307. [Google Scholar] [CrossRef]
  12. Tan, Y.B.; Liang, Z.W. Numerical simulation of the effect of lower positive charge region in thunderstorms on different types of lightning. Sci. China Earth Sci. 2014, 57, 2125–2134. [Google Scholar] [CrossRef]
  13. Luo, H. Study on Corona Discharge Characteristics of Metal Tip. Master’s Thesis, Nanjing University of Information Science and Technology, Nanjing, China, 2021. [Google Scholar]
  14. Tian, Y. Study on the Microscopic Physical Process of AC and DC Corona Discharge. Master’s Thesis, Xi’an University of Electronic Science and Technology, Xi’an, China, 2017. [Google Scholar]
  15. Higashiyama, Y. Characteristics of discharge current from a needle electrode and its application to detection of a thundercloud approach. Electr. Eng. Jpn. 1979, 99, 411–418. [Google Scholar] [CrossRef]
  16. Aleksandrov, N.L.; Bazelyan, E.M. The effect of coronae on leader initiation and development under thunderstorm conditions and in long air gaps. J. Phys. D Appl. Phys. 2001, 34, 3256–3266. [Google Scholar] [CrossRef]
  17. Aleksandrov, N.L.; Bazelyan, E.M. Corona discharge at the tip of a tall object in the electric field of a thundercloud. Plasma Phys. Rep. 2002, 28, 953–964. [Google Scholar] [CrossRef]
  18. Aleksandrov, N.L.; Bazelyan, E.M. Initiation and development of first lightning leader: The effects of coronae and position of lightning origin. Atmos. Res. 2005, 76, 307–329. [Google Scholar] [CrossRef]
  19. Bazelyan, E.M.; Raizer, Y.P. The effect of space charge produced by corona at ground level on lightning attachment to high objects. Atmos. Res. 2015, 153, 74–86. [Google Scholar] [CrossRef]
  20. Becerra, M. Glow corona generation and streamer inception at the tip of grounded objects during thunderstorms: Revisited. J. Phys. D Appl. Phys. 2013, 46, 135205. [Google Scholar] [CrossRef]
  21. Guo, X.F.; Zhang, Q.L. Establishment and application of corona discharge model with asymmetric structure. Sci. Tech. Eng. 2018, 18, 13–20. [Google Scholar]
  22. Guo, X.F.; Ji, Z.Y. Research on the influence of lightning rod tip shape on corona discharge. Compu. D. Eng. 2022, 50, 2802. [Google Scholar]
  23. Qie, X.S. Numerical simulation of temporal and spatial evolution of corona discharge ions at the natural tip of the ground under thunderstorms. J. Geophys. 1996, S1, 43–51. [Google Scholar]
  24. Becerra, M.; Cooray, V. Effect of the space charge layer created by corona at ground level on the inception of upward lightning leaders from tall towers. J. Geophys. Res. Atmos. 2007, 112, D12. [Google Scholar] [CrossRef]
  25. Soula, S.; Chauzy, S. Multilevel measurement of the electric field underneath a thundercloud: 2. Dynamical evolution of a ground space charge layer. J. Geophys. Res. Atmos. 1991, 96, 22327–22336. [Google Scholar] [CrossRef]
  26. Guo, F.X.; Zhang, Y.J. Correlation between thunderstorm cloud electrical activity and microphysical field characteristics in the Northwest Inland Plateau. J. Atmos. Sci. 2012, 35, 205–213. [Google Scholar]
  27. Bazelyan, E.M.; Raizer, Y.P. Corona processes and lightning attachment: The effect of wind during thunderstorms. Atmos. Res. 2009, 94, 436–447. [Google Scholar] [CrossRef]
  28. Zou, Y.; He, J.; He, H. Effect of wind on the distribution of the corona discharge ionized field generated from grounded wire during thunderstorms. In Proceedings of the International Conference on Lightning Protection, New York, NY, USA, 11–18 October 2014. [Google Scholar]
  29. Guo, X.F.; Ji, Z.Y. 3D corona discharge model and its use in the presence of wind during a thunderstorm. Front. Environ. Sci. 2022, 10, 2–8. [Google Scholar] [CrossRef]
  30. Guo, X.F.; Zhang, L. Development and application of three-dimensional corona discharge model. Sci. Tech. Eng. 2024, 24, 3997–4004. [Google Scholar]
  31. Peek, F.W. Dielectric Phenomena in High Voltage Engineering; McGraw-Hill Book Company: London, UK, 1920. [Google Scholar]
  32. Cristina, S.; Dinelli, G. Numerical computation of corona space charge and VI characteristic in DC electrostatic precipitators. IEEE Trans. Ind. Appl. 1991, 27, 147–153. [Google Scholar] [CrossRef]
  33. Caron, A.; Dascalescu, L. Numerical modeling of combined corona-electrostatic fields. J. Electrostat. 2004, 61, 43–55. [Google Scholar] [CrossRef]
  34. Nouri, H.; Zebboudj, Y. Analysis of positive corona in wire-to-plate electrostatic precipitator. Eur. Phys. J. Appl. Phys. 2010, 49, 11001. [Google Scholar] [CrossRef]
  35. Yan, M.H. Numerical calculation of space charge layer distribution due to metal tip discharge under thunderstorms. Atmos. Sci. 1986, 10, 80–87. [Google Scholar]
  36. Johnson, H.; Graham, M. High Speed Digital Design: A Handbook of Black Magic; Pearson Education India: Hoboken, NJ, USA, 1993. [Google Scholar]
  37. Mekious, M.; Megherbi, M. Active electrode material influence on the characteristics of corona discharge reactor at atmospheric pressure. Russ. Elect. Eng. 2022, 93, 277–283. [Google Scholar] [CrossRef]
Figure 1. Trend of background electric field. (a) Waveform A; (b) waveform B; (c) waveform C.
Atmosphere 16 00612 g001
Figure 2. Measuring device used in observation.
Atmosphere 16 00612 g002
Figure 3. Results of comparison. (a) Observation results; (b) simulation results for this model.
Atmosphere 16 00612 g003
Figure 4. Side view of corona charge distribution. (a) Time of positive peak of electric field, no wind; (b) time with zero electricity, no wind; (c) time of negative peak of electric field, no wind; (d) time of positive peak of electric field, with horizontal wind speed of 10 m/s; (e) time with zero electricity, with horizontal wind speed of 10 m/s; (f) time of negative peak of electric field, with horizontal wind speed of 10 m/s.
Atmosphere 16 00612 g004aAtmosphere 16 00612 g004b
Figure 5. Top view of corona charge distribution. (a) Time of positive peak of electric field, no wind; (b) time with zero electricity, no wind; (c) time of negative peak of electric field, no wind; (d) time of positive peak of electric field, with horizontal wind speed of 10 m/s; (e) time with zero electricity, with horizontal wind speed of 10 m/s; (f) time of negative peak of electric field, with horizontal wind speed of 10 m/s.
Atmosphere 16 00612 g005
Figure 6. Spatial distribution map of corona electric field. (a) Time of positive peak of electric field, no wind; (b) moment with zero electricity, no wind; (c) time of negative peak of electric field, no wind; (d) time of positive peak of electric field, with horizontal wind speed of 10 m/s; (e) moment with zero electricity, with horizontal wind speed of 10 m/s; (f) time of negative peak of electric field, with horizontal wind speed of 10 m/s.
Atmosphere 16 00612 g006aAtmosphere 16 00612 g006b
Figure 7. Comparison of positive and negative corona discharge model and unipolar corona discharge model. (a) Background electric field; (b) corona current; (c) amount of corona charge released.
Atmosphere 16 00612 g007
Figure 8. Variation characteristics of corona current. (a) Positive and negative corona discharge model; (b) unipolar corona discharge model.
Atmosphere 16 00612 g008
Figure 9. The fitting curve of the absolute value of the current difference.
Atmosphere 16 00612 g009
Figure 10. Variation characteristics of amount of corona charge released. (a) Positive and negative corona discharge model; (b) unipolar corona discharge model.
Atmosphere 16 00612 g010
Figure 11. The fitting curve of the negative corona charge difference.
Atmosphere 16 00612 g011
Disclaimer/Publisher’s Note: The statements, opinions and data contained in all publications are solely those of the individual author(s) and contributor(s) and not of MDPI and/or the editor(s). MDPI and/or the editor(s) disclaim responsibility for any injury to people or property resulting from any ideas, methods, instructions or products referred to in the content.