1. Introduction
The negative health effects of particle emissions from exhaust are well established. Thanks to the EURO emissions standards and electrification of the vehicle fleet, particulate matter (PM) from exhaust has been significantly reduced. However, non-exhaust emissions—arising from the wear of brakes [
1], tyres [
2], road surfaces [
3] and even dry clutches [
4]—have increased. This trend is partly due to the greater weight of electric vehicles compared to those with internal combustion engines [
5], which can substantially influence tyre and road wear [
6].
In Europe, the non-exhaust emissions of PM
2.5 and PM
10 now exceed exhaust emissions, and their contribution is expected to grow [
7,
8]. A significant proportion of these emissions is believed to originate from tyre and road wear particles (TRWPs) [
9]. In response, the European Commission has introduced the EURO [
7] proposal, marking the first time legal requirements for brake and tyre wear particles will be included in emission regulations. However, road wear is not addressed in EURO [
7], despite the evidence of its significant influence on TRWPs characteristics [
10].
Literature reviews suggest that airborne TRWPs have been assessed to contribute between 5% and 30% of total road transport-related PM
10 emissions, depending on various factors such as road type and environmental conditions [
11]. In Sweden, for example, passenger cars contribute to more than half of tyre wear particle (TWP) emissions, followed by domestic heavy-duty vehicles, which account for approximately one-third [
12]. Meanwhile, the non-airborne fraction of TRWP emissions can accumulate as microplastics in surface waters and soils, leading to adverse (eco)toxicological effects [
13].
Given these concerns, the need for reliable TRWP measurement methods has been highlighted in the literature to improve the overall understanding of different non-exhaust PM contributions [
14]. This knowledge is crucial in assessing whether airborne TRWPs pose a public health risk in urban environments. A recent study [
15] showed that PM
10 tyre wear emissions are about four times lower than commonly used estimates in the literature due to
“misunderstandings and misquotations that have been prevalent since the year 1995”.
The contact between the tyre and road can be divided into a rolling and a sliding (tyre slip) part. Most primary TRWPs are generated from the sliding part of the interaction between road and tyre contact surfaces when the vehicle is moving. The wear depends on the slip ratio, local contact pressure and temperature distribution, surface roughness, and materials of the tyre and road surface in contact. Studies on airborne TRWPs typically involve particle collection in controlled laboratory setups (e.g., [
2,
16]), or on-vehicle in the field (e.g., [
16,
17]).
Single-wheel roller [
16] and chassis dynamometers [
18] can be used to study TWP emissions under controlled parameters such as slip ratio, load, ambient particle concentration, and temperature. The drawback with these setups is that the road surface is modelled with a drum coated with a wear resistant material and therefore cannot capture the importance of the road surface material on local contact pressure and temperature distribution, surface roughness as well as porosity [
19] that have a strong influence on the wear mechanisms active and resulting emissions during driving. Another test setup found in the literature is the road simulator [
2] that consists of four wheels that run along a circular track with a diameter of about 5 m where specimens of real road materials can be evaluated at speeds up to 70 km/h. However, the above setups are complicated, time-consuming, and expensive to use.
An alternative to the above setups is therefore a scaled experimental method. Several scaled experimental methods can be found in the literature (e.g., [
20,
21,
22]). These approaches can be good when trying to isolate the main tribological mechanisms active during real driving on road and to screen the effect of different types of studded tyres and road materials on the wear. However, none of the aforementioned studies includes both contact surfaces (real tyres and road materials), which is essential to simulate the actual tribological mechanisms and resulting emissions occurring during real driving.
Therefore, the present study presents an experimental method that includes both contact surfaces, i.e., both tyre and road materials. The test setup is much smaller than one comprising a whole tyre in contact with the road surface, i.e., down-sized, while keeping the contact conditions such as contact pressure and sliding speed unchanged. It focuses on identifying representative urban load and speed conditions that can be used to investigate CoF, wear, and TRWP emissions from commercial tyre and road materials. Finally, preliminary results are presented for these conditions.
2. Materials and Methods
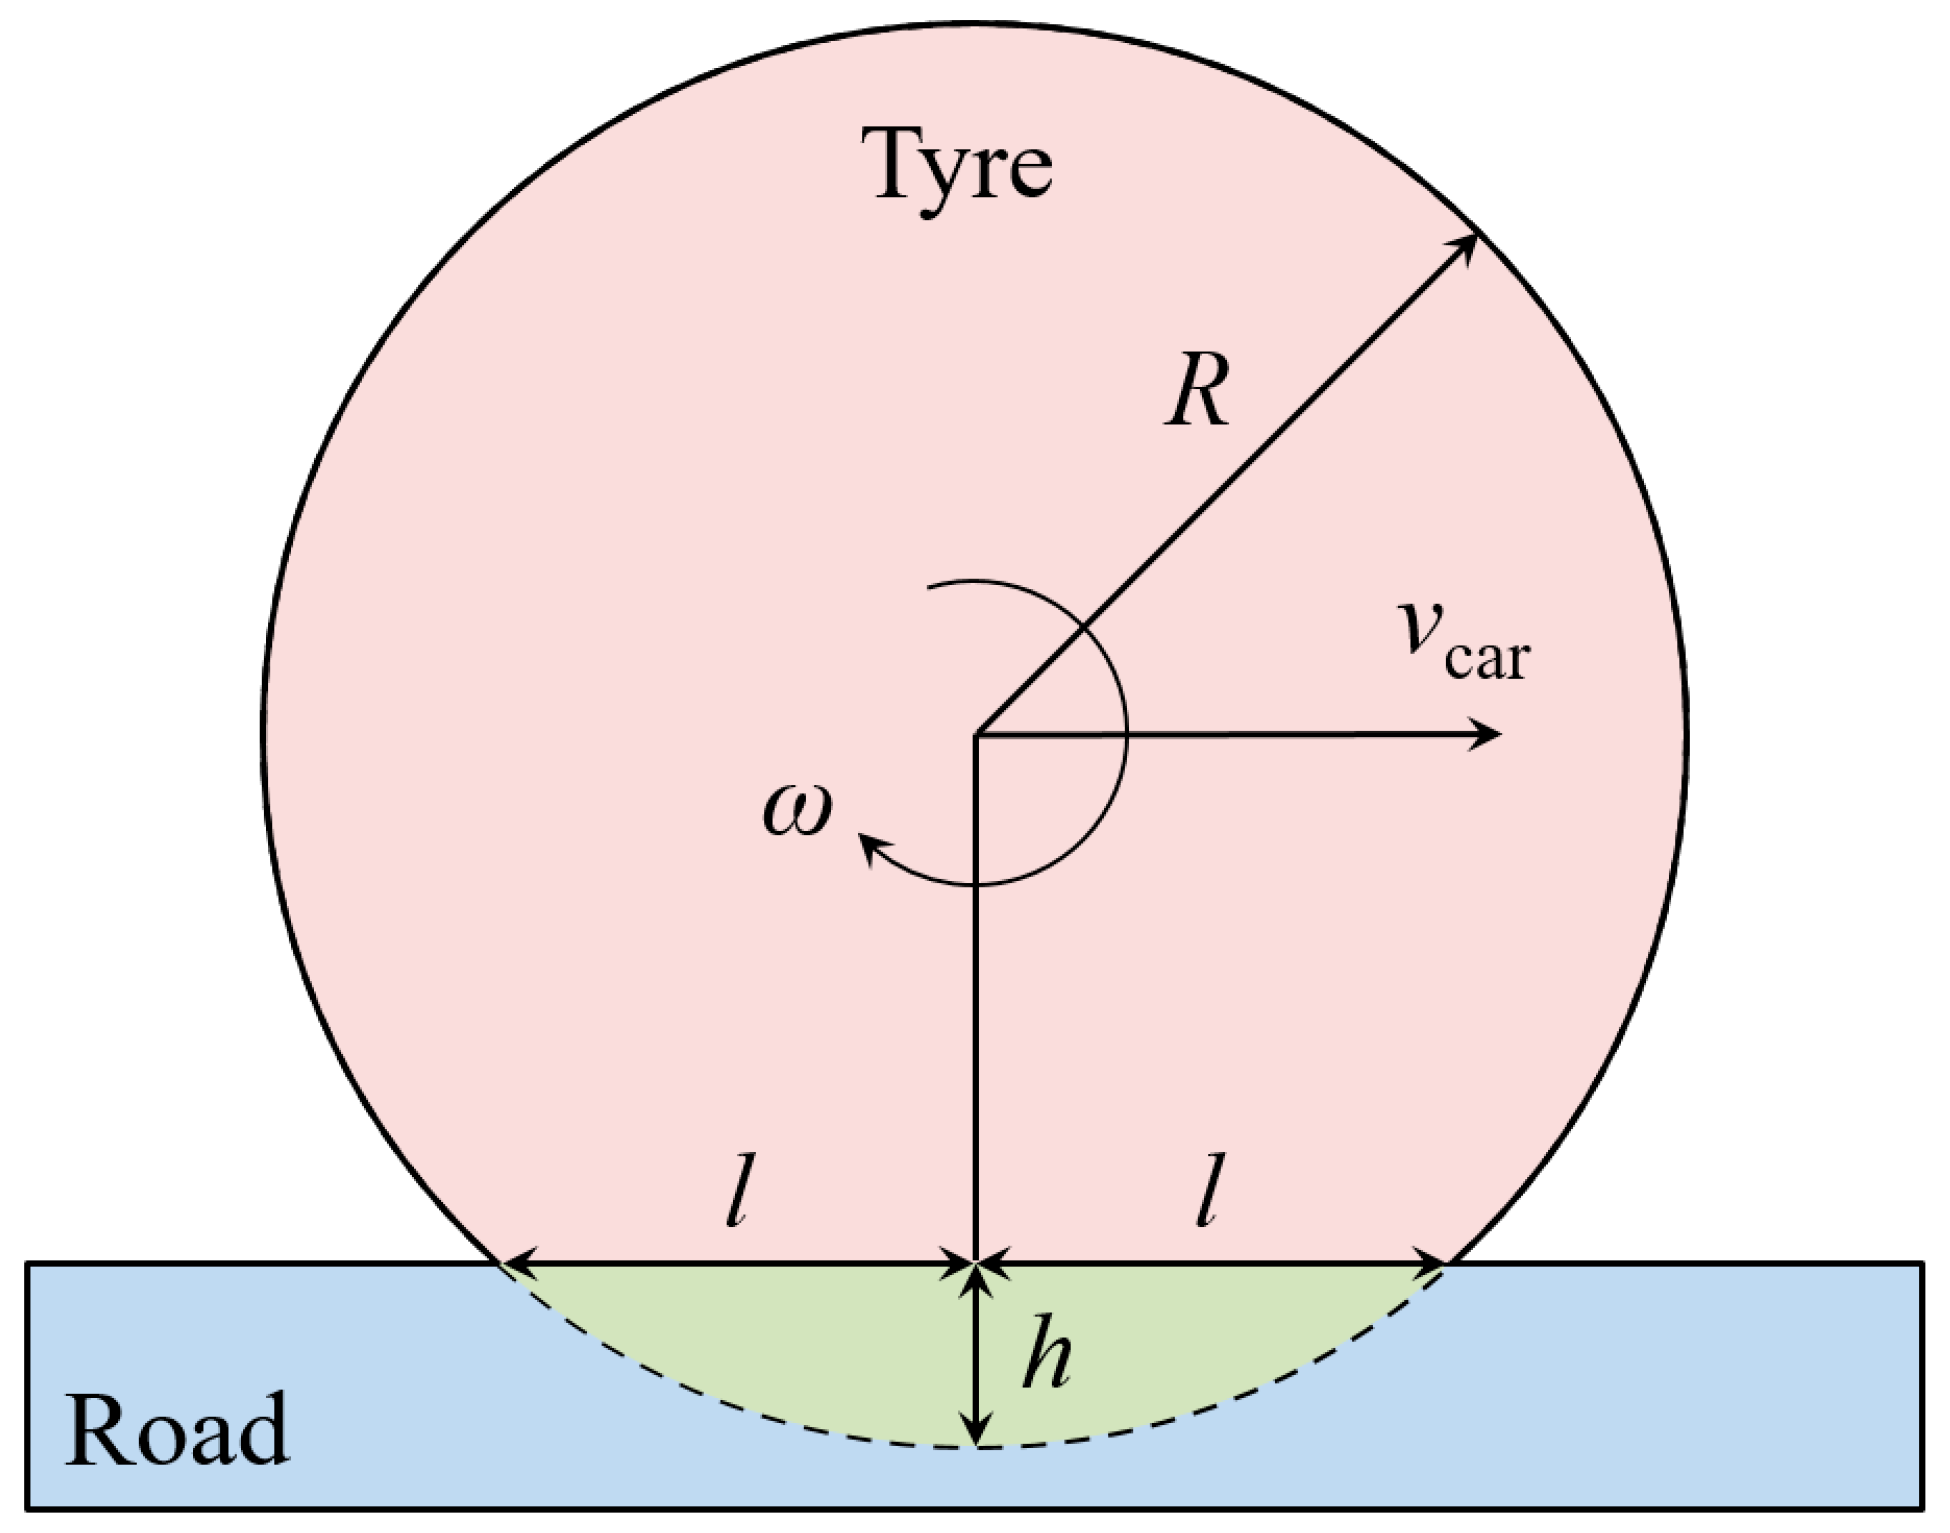
To combat the problems described above, this study proposes a scaled laboratory test method using real tyre and road materials. The idea behind the method is that tyre and road wear occur mostly due to sliding, not rolling. Due to the mass of the car, the tyre is elastically deformed a distance
h, see
Figure 1. This creates a contact zone with a length of 2
l. Slip will occur in this zone with a maximum slip at the trailing edge. Slip is defined as the relative motion between a tyre and the road surface it is moving on. In this study, slip is assumed to be 1%; i.e., the sliding speed in the contact zone is 1% of the car speed
vcar. This corresponds to driving straight on a road during moderate driving conditions [
23]. By isolating the sliding portion of the motion, i.e., the only portion contributing to wear, a PoD tribometer can be used instead of, e.g., a large setup using a whole tyre against a rotating drum. In turn, this means that test bodies can be made of real tyre and road materials but at a much smaller size.
A Nanovea T50 PoD tribometer, specifically designed for NEE studies, was used to examine friction, wear, and emissions from a tyre and road material. A schematic view of the setup is presented in
Figure 2. The PoD is a conventional tribometer used for the tribological testing of various material combinations for friction and wear. The machine runs under stationary conditions with constant applied normal forces of up to 100 N and constant rotational speeds of up to 5000 rpm. A load cell is used to measure the tangential force acting on the pin. The coefficient of friction is calculated as the measured tangential force divided by the applied normal force. The tribometer was enclosed in a sealed box with an internal air volume of approximately 130 L. During testing, clean (particle-free) compressed air was supplied at a flow rate of 35 L/min, resulting in an air exchange rate of 0.27 times per minute. The airflow was directed at the contact zone to maintain a clean chamber environment and to facilitate the suspension of wear particles. It was intentionally set to a high level, corresponding to a vehicle speed of 100 km/h, to make the wear particles airborne. The airflow in the box carried the generated particles to the air outlet, where the sampling points for particle measurements were positioned.
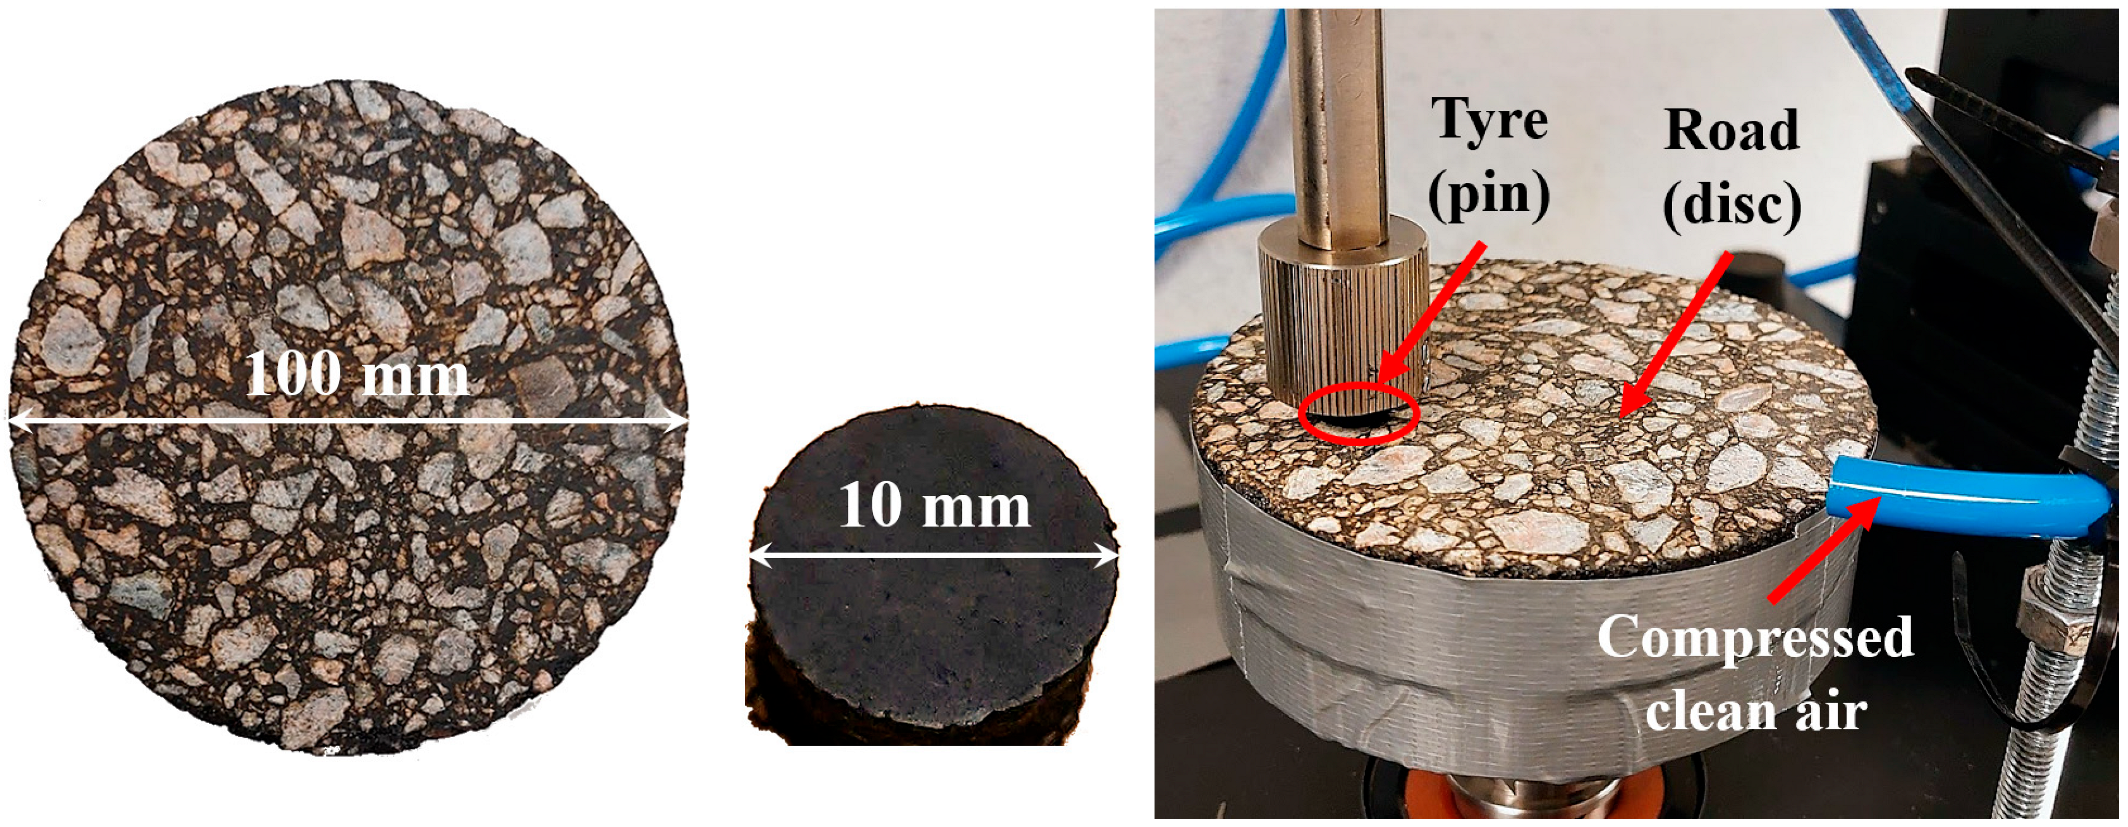
The test specimens included tyre pins and a road disc, prepared from a used commercial summer tyre (Michelin X-Green 205/60R16 96H) and an asphalt road disc. According to the tyre manufacturer, the rubber compound contains silicon and silica, with the tread composed of 14 different substances. The asphalt road disc consisted of Stone Mastic Asphalt with a maximum nominal aggregate size of 11 mm (SMA11) in accordance with the Swedish specifications [
24] and manufactured according to the SS-EN standard 12697-30:2019 [
25], resulting in a Marshall sample with a diameter of 100 mm. Aggregate types consisting of [
24] and 70/100 penetration-grade bitumen were used. Cylindrical tyre pins were cut from the tread blocks between the grooves to a diameter of 10 mm, while the road disc measured 100 mm in diameter. The same road disc was used for all tests and was cleaned with pressurised air between each test. A new pin for used for each test. A photograph of the test specimens before the testing and test setup is shown in
Figure 3.
A TSI CPC 3775 and a GRIMM MiniWRAS 1371 were used to measure online particle number concentration (PNC) inside the box. The CPC operates by generating vapour from a working fluid, which condenses onto passing particles, causing them to grow in size. This enlargement allows the particles to be optically detected and counted by a laser. The CPC maintains a constant airflow rate of 0.3 L/min, enabling it to measure PNC by counting the number of particles passing through the laser counter per time unit. It can detect particles within a size range of 4 nm to 3 µm. Any size information is lost in the condensation process, and thus, it cannot determine the size of individual particles. The MiniWRAS instrument measures particles using an electrical particle detector for sizes ranging from 10 to 193 nm and an optical aerosol spectrometer for sizes between 0.253 and 35 µm. It can provide data on particle number concentration, along with the particle size distribution across 41 size channels. The number concentration can be assessed. It operates with an airflow rate of 1.2 L/min and a measurement interval of 1 min. Thus, the CPC and MiniWRAS instruments complement each other’s measurement ranges. As it can be suspected that TRWPs can be larger than 3 µm, it is beneficial to use both instruments.
The non-airborne TRWPs, i.e., emitted particles that fell onto the floor of the tribometer, were collected on Teflon filters (2 µm, 47 mm) after each test by suction with a Dekati PM10 impactor. The mass loss of the pins was measured by weighing them before and after testing with an analytical balance (Radwag model AS 520.R2 PLUS) with an accuracy of 0.1 mg. The wear scars of the tyre pins and road disc and the filters were analysed with a KEYENCE VHX-7000 digital optical microscope.
Load and speed were stepwise increased based on CoF, mass loss, and TRWP emissions, as well as visual comparisons of tyre wear scars to those observed on real, used car tyres. The pin was mounted such that its midpoint was at a 30 mm disc radius. Nominal contact pressure was varied between 0.64 and 2.56 bar, with sliding speeds ranging from 0.08 to 0.32 m/s (30 to 120 km/h car speed assuming a tyre slip of 1%). Test durations ranged from 30 to 120 min, corresponding to a total sliding distance of 576 m (57.6 km of driving assuming a tyre slip of 1%). The test conditions can be found in
Table 1.
3. Results and Discussion
Figure 4 presents the time histories of the CoF and PNC as measured by the CPC and MiniWRAS instruments. Note that only the optical range of the MiniWRAS instrument is reported, as the PNCs detected by the electrical sensor were below the limit of detection.
Figure 5 shows the mean PNC recorded by the CPC and MiniWRAS instruments, along with the average CoF and tyre pin mass loss of the five tests.
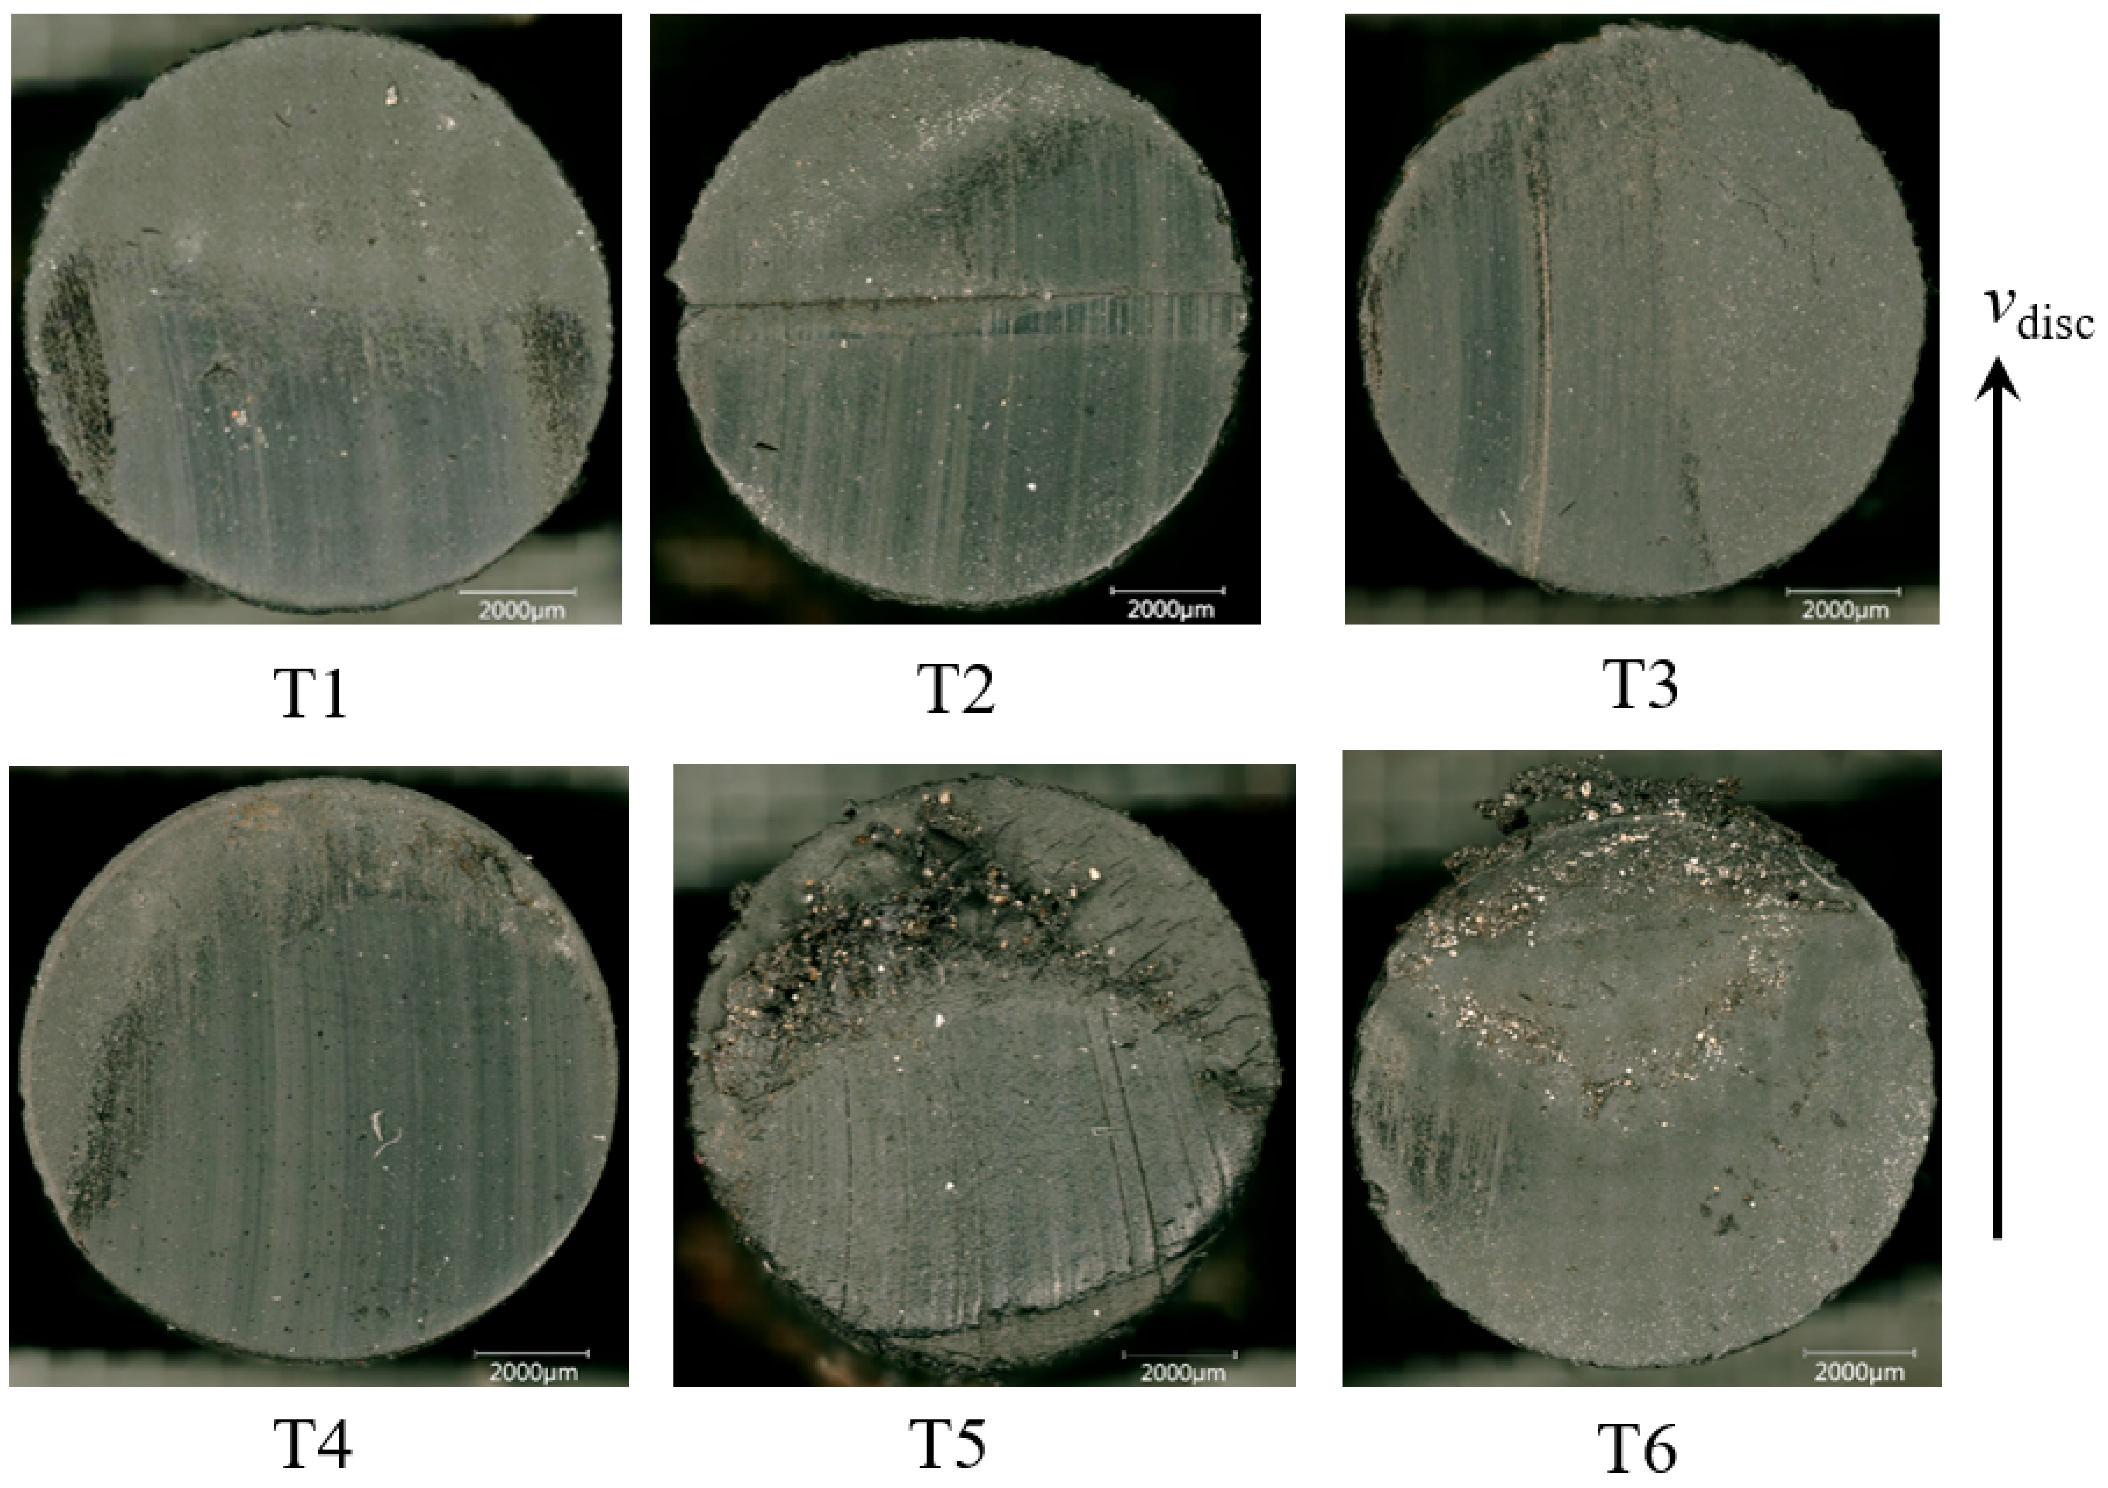
Light optical microscope images of the pin wear scars after testing are displayed in
Figure 6, while
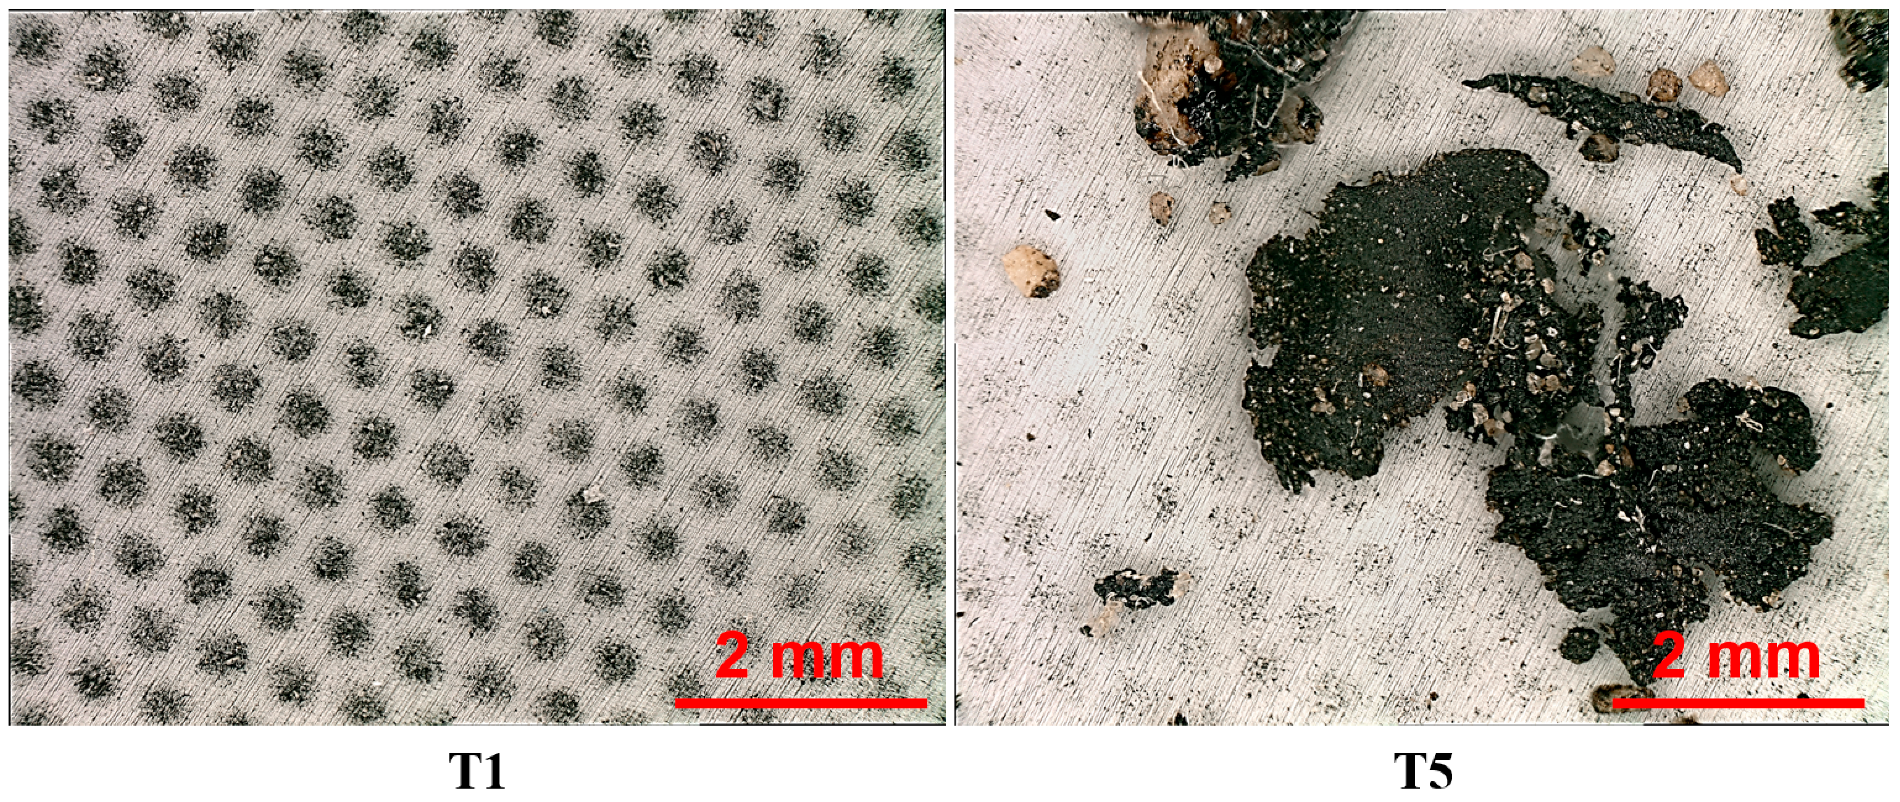
Figure 7 shows the wear track of the road disc. Examples of non-airborne particles collected on filters after testing for test T1 and T5 are presented in
Figure 8, with a more detailed view provided in
Figure 9 for test T1 and T2. In
Figure 9, magnified images of the tyre wear scar for test T1 are shown.
The CoF plots (
Figure 4a) reveal a relatively smooth running-in period during the first half of tests T1–T4, during which the CoF gradually increases. It then stabilises, maintaining a relatively constant value in the later stages of the tests. In contrast, during test T5, the CoF remains steady until approximately 200 m of sliding (marked with a dashed line in
Figure 4), after which it increases sharply until the end of the test. The mean CoF (
Figure 5b) ranges from 0.59 to 0.95 for tests T1–T4, which are typical values for dry asphalt driving [
26]. The CoF of T5, see
Figure 4a, increases to about 1.5 by the end of the test, which is an unusually high value for a typical passenger car. Additionally, in test T6, the tribometer stopped due to excessively high friction (>2); therefore, no data are available for this test except for the pin wear scar.
Both particle instruments (
Figure 4b,c) detect a peak in PNC at the beginning of tests T1–T4, followed by a decline to a lower, steady level that persists until the tests conclude. This initial peak in PNC may be attributed to the removal of surface contaminants, such as dirt, oxide layers, surface irregularities, and the initial removal of weaker materials and bitumen residue, at the start of the tests. However, the increase in PNC in T5 along with the corresponding increase in CoF suggests a transition from moderate to harsh wear that can be detected in real time by the CoF and CPC instruments.
About 60, 80, 60, and 80%, respectively, of the tyre pin surfaces T1–T4 seems to have been in contact with the road surface (
Figure 6). The change in wear mechanism is also evident in the wear scars shown in
Figure 6, where tests T1–T4 produced smooth wear scars, whereas tests T5 and T6 resulted in severe, catastrophic wear with substantial material loss. This observation aligns with the nearly tenfold increase in mass loss recorded in test T5 (
Figure 5b). Additionally, images of non-airborne particles (
Figure 8) indicate that test T5 generated significantly larger particles, including road material fragments from the disc and rubber debris from the tyre pin, compared to test T1, where the particles were considerably smaller. The loss of aggregates from the road wear scar is visible in
Figure 7.
Figure 10 illustrates the difference between the surfaces of the tyre pin for T1, i.e., one that has been in contact with the road (
Figure 10b) and one that has not (
Figure 10a). Even at a low load and speed, aggregates worn off from the road surface become embedded in the relatively soft rubber material (
Figure 10b). Additionally, road material particles can be observed on the tyre surface that was not in direct contact during testing (
Figure 10a). These hard aggregates can, in turn, scratch the road surface (
Figure 7), similarly to studded tyres. It appears that the hard peaks of the road material have caused abrasive wear scratches on the tyre surface (
Figure 10b). Notably, small holes near the edges of the tyre pin surface (
Figure 10b) are similar in size to the particles observed on the filters in
Figure 9. The holes appear near the contact boundaries between the surfaces. This suggests a possible lack of support or increased bending in these areas, leading to additional loading and stress on the tyre surface. In T5 and T6, more aggregates seem to be pressed into the tyre specifically where the holes form. These aggregates may adhere to the rubber surface, contributing to particle detachment and hole formation. At the same time, they may be embedded deeply enough to remain in the tyre rather than being ejected with the worn particles.
Using the mass loss of the tyre pins (
Figure 5b), the scaling factor (i.e., the ratio of whole tyre contact area and pin area), and a slip ratio of 1%, the estimated non-airborne EFs for a vehicle are about 50, 100, 40, 80, and 720 mg/km for T1–T5, respectively. The scaling between the tyre and pin is approximately 250, assuming a nominal tyre contact area of about 2 dm
2. The T1–T4 values align with Giechaskiel et al. [
11], who reported an EF of 110 mg/km per vehicle based on recent studies published in the literature.
For tests T1–T4, the mean PNC measured by the CPC inside the closed box was below 2 cm
−3. Hesse et al. investigated [
16] methods for sampling particulate emissions from tyres on-road and in laboratory tests with a single-wheel dynamometer. In the single-wheel dynamometer test, they noted that the PNC is strikingly low for different driving scenarios according to a RDE test cycle when testing a C-segment car. Saladin et al. [
15] reported that the PM
10 values from TWP is probably much lower than what can be found in the literature. Similarly, the PNC observed in the present work is lower than what is typically reported in the literature.
Zhang et al. [
27] studied brake and tyre wear particle emissions under real-world driving conditions, including urban, rural, and highway environments for passenger cars. They presented airborne EFs for PM
2.5 and PM
10 from both sources. Even at these driving conditions, the ratio of brake to tyre PM
2.5 and PM
10 EFs remained approximately 10 in both cases. Nevertheless, as shown in
Figure 8, a number of non-airborne rubber wear particles from the tyre pins are generated under moderate running conditions, and these could end up as microplastics in surface waters and soils [
12], or as road dust on roads. It should be noted that large tyre particles may degrade, decrease in size, resuspend, and thus become part of the PM
10 through indirect emissions.
Only the CPC instrument registers a higher PNC in test T5, indicating that particles smaller than 0.25 µm are predominantly generated under harsh friction and wear conditions generating thread temperatures that may not be representative for urban driving, even if the sliding speed is only 0.16 m/s.
Grigoratos et al. [
2] conducted a road simulator study to examine tread wear and particle emissions from tyres. In their setup, four wheels equipped with tyres ran along a circular track with a radius of approximately 2.5 m at a speed of 70 km/h (19.4 m/s). Under these conditions, they measured airborne particles ranging from a few nanometres to 10 micrometres in size. For comparison, a typical passenger car has a turning radius of around 5 m, given that it drives slowly. Due to the small turning radius and the high speed in the experiment in [
2], the slip ratio was significantly overestimated (approaching 100%) leading to excessively high wear rates and elevated contact temperatures. As a result, the sliding speed in their study was more than 100 times higher than in the present work. Consequently, the airborne TRWPs generated and analysed under such extreme conditions may not accurately reflect real-world tyre and road wear, particularly for nanosized TRWPs.
Similarly, high TRWP emissions are typically linked to very high tread temperatures (see, e.g., Zhang et al. [
28]). Park et al. [
29] reported a considerable increase in PNCs at 160 °C, which is well over tread temperature under normal vehicle operation. Thus, Refs. [
28,
29] are in line with the present study, as low PNCs are observed for normal operating temperatures. This further emphasises the importance of using representative conditions. Kim and Lee [
30], who studied TWP with a tyre simulator under various driving conditions, also discussed the importance of using a representative road material in testing.
The present study has some limitations. Firstly, only one road disc was used for all tests, meaning all tests were conducted within the same wear track. To mitigate this, tests were performed in order of increasing load and sliding speed. Future studies could explore the influence of different tyre types, road materials, pavement types, and surface properties [
19], on friction, wear, and emissions. Additionally, collecting non-airborne particles on filters would allow for an assessment of the ecotoxicity effects [
12] and health effects, of various tyre and road materials. Further repetitions are also needed to evaluate the robustness of the test setup.
Secondly, the tyre pin is relatively small, which may introduce edge effects that are not present in full-scale tyres. Moreover, the stiffness of the scaled setup is higher than that of a real tyre, where air deformation occurs when rolling over uneven surfaces. In the tests, rolling is accounted for as the slip is based on the deformation of the tyre since it is flattened in its contact with the road and round elsewhere. However, the rolling effect of loading and unloading the contact is neglected, which may affect the fatigue wear of the tyre pin. However, this effect is accounted for on the road disc, where a certain point experiences cyclic loading and unloading. A potential improvement for both these issues would be to use varying load by pneumatic loading instead of a dead weight on the tyre pin during testing.
To put the low measured PNCs in context, a comparison can be made with NEEs from brakes. Varriale et al. [
31] used the same experimental setup but with a doubled dilution rate of clean supplied air to study the brake wear particle emissions from commercial brake materials during equivalent urban driving conditions according to the Los Angeles City Traffic (LACT) cycle [
32]. They reported a PNC measured by a CPC (TSI 3775) instrument of 124 cm
−3 inside the box. This indicates that the number of airborne wear particles generated from tyre and road contact is approximately one hundred times lower than from disc brakes, assuming the contact area between the brake pads and disc is roughly the same as between one tyre and the road surface.
The proposed method can be a tool for investigating wear mechanisms and particle emissions from existing and novel tyre and road materials. Its results could be used as an input when formulating representative test conditions and setting EF limit levels for airborne and/or non-airborne wear particles for the upcoming Euro 7 regulations. Moreover, a deeper understanding of the wear mechanisms of road surfaces can enhance the knowledge of how non-studded tyres affect road wear. This, in turn, allows for the more precise modelling of both abrasion and polishing processes.


