Article

Evaluating the Historical Performance and Future Change in Extreme Precipitation Indices over the Missouri River Basin Based on NA-CORDEX Multimodel Ensemble

by
Ifeanyi Chukwudi Achugbu
1,*,
Liang Chen
1,
Qi Hu
1,2 and
Francisco Muñoz-Arriola
2,3
1
Department of Earth and Atmospheric Sciences, University of Nebraska-Lincoln, Lincoln, NE 68588, USA
2
School of Natural Resources, University of Nebraska-Lincoln, Lincoln, NE 68583, USA
3
Department of Biological Systems Engineering, University of Nebraska-Lincoln, Lincoln, NE 68583, USA
*
Author to whom correspondence should be addressed.
Atmosphere 2025, 16(5), 579; https://doi.org/10.3390/atmos16050579
Submission received: 25 March 2025 / Revised: 18 April 2025 / Accepted: 6 May 2025 / Published: 12 May 2025
(This article belongs to the Section Climatology)

Abstract

:
This study evaluates the performance of the North American Coordinated Regional Climate Downscaling Experiment (NA-CORDEX) models in simulating the historical precipitation extremes and uses the best-performing model to project changes in extreme precipitation indices over the Missouri River Basin (MRB) in the United States. Five extreme precipitation indices are calculated to quantify the frequency and intensity of precipitation extremes, and the results are compared with gridded observations for summer (June–August, JJA) and winter (December–February, DJF). A majority of the NA-CORDEX models fairly reproduce the spatial patterns of the extreme precipitation indices and the seasonal patterns of mean precipitation with varying degrees of biases. Overall, the ensembles (either from all 16 NA-CORDEX members or grouped by individual regional climate models) show a reasonable performance in representing the spatial patterns of the precipitation extremes, but some models outperform the ensembles for individual precipitation indices in different seasons. By the end of the century, in a high-emission scenario, there is a significant increase in heavy precipitation intensity during the summer but with a projected increase in drought duration in the central areas. The winter season also shows a significant increase in heavy precipitation intensity, frequency, and duration, with a decrease in dry spells. Our results demonstrate variability in seasonal precipitation extremes over the MRB, highlighting the need for adaptive infrastructure and water resource planning to reduce vulnerability to extreme events.

1. Introduction

Extreme precipitation events have a wide range of effects within the MRB, such as flash flooding, the flooding of agricultural fields, and dangerous ice flows, all of which can lead to infrastructure damage and agricultural loss. For instance, a flood in March 2019 [1] caused the abandonment of 20 million acres of agricultural land and an estimated USD 2.9 billion in direct damages [2]. The MRB covers more than 1.29 million km2 and experiences extreme precipitation frequently. The complex terrain in the west and various meteorological and climate factors, such as low-level jets [3], mesoscale convective systems [4], and extreme cold air intrusions [5], have posed challenges to achieving a good understanding of the past and future variability of precipitation extremes, which is important to local and regional stakeholders such as farmers, investors, and suppliers for effective decision-making and planning [6]. Therefore, the goal of this study is to analyze the spatial and temporal changes in extreme precipitation within the MRB.
Although there have been various studies conducted on the precipitation changes in the Missouri basin (e.g., [7,8,9,10,11,12,13]), most of those assessments are based on station data and river channel assessment, which do not consider the spatial variations over the basin. Utilizing the data collected from 131 sites by the United States Historical Climatology Network (USHCN), ref. [13] examined the characteristics of extreme precipitation between 1950 and 2019 and found that the MRB’s yearly station maximum precipitation events and 99th-percentile occurrences are becoming more frequent.
Climate models are commonly used to understand the temporal and spatial variability of precipitation in the past and future. Studies such as Di Luca et al. [14], Ashfaq et al. [15], and Lucas-Picher et al. [16] have demonstrated that dynamically downscaled General Circulation Model (GCM) simulations using high-resolution regional climate models (RCMs) can offer an additional benefit in capturing smaller-scaled climate processes compared to using GCMs. This is because RCMs can capture a greater proportion of the mesoscale systems, which produce extreme precipitation. Additionally, RCMs provide more accurate depictions of the atmospheric circulation and surface forcing [17], both of which support the more accurate representation of precipitation extremes.
In this study, we assess the ability of the Coordinated Regional Climate Downscaling Experiment (CORDEX) models to accurately represent historical extreme precipitation both spatially and temporally. We use the best-performing models to project future extreme precipitation events over the MRB. CORDEX comprises high-resolution climate simulations over a specific region using multiple RCMs, which dynamically downscaled GCM simulations from the Climate Model Intercomparison Project Phase 5’s (CMIP5) output. Its purpose is to evaluate and enhance regional climate downscaling models and techniques, as well as investigate regional climate processes. For our analysis of extreme precipitation events in the MRB, the North American Coordinated Regional Climate Downscaling Experiment (NA-CORDEX) provides simulations from different RCM and GCM combinations under different climate scenarios. These ensemble members sample a wide range of climate sensitivity within CMIP5 [18], enabling a realistic representation of model uncertainty in future warming scenarios. Hence, the hypothesis of this research is to examine whether the NA-CORDEX data are good for the analysis of extreme precipitation events or not, i.e., how different models diagnose extreme precipitation events and the future change over the MRB. Although global CMIP6 simulations and CMIP6-based statistical downscaling (such as Localized Constructed Analogs version 2, LOCA2 [19], NASA Earth Exchange Global Daily Downscaled Projections, NEX-GDDP-CMIP6 [20]) are available, there is no CMIP6-based multi-model dynamical downscaling framework (like NA-CORDEX or other coordinated regional modeling efforts) available for North America or the Missouri River Basin. When analyzing extreme precipitation events in the MRB with complex terrain and climate conditions, dynamical downscaling would provide several important advantages over statistical downscaling, including a better representation of physical processes and being suitable for non-stationary future climates, since they are not limited by historical analogs as in statistical approaches.
While previous studies, such as Karmalkar [21] and Bukovsky and Mearns [18], primarily focused on broader domains such as the continental United States or all of North America, our study distinctively centers on the MRB—a region of significant hydrological and socioeconomic importance. Unlike Fisel et al. [22], which applied an object-oriented method to identify contiguous short- and extended-period precipitation events, our analysis evaluates a broader suite of standardized extreme precipitation indices (e.g., rx5day, cdd, r10mm) based on the ETCCDI framework using a multi-model ensemble from NA-CORDEX to assess historical performance and projected changes. This has not yet been conducted. This study aims to (1) evaluate the historical performance of NA-CORDEX regional climate models in simulating extreme precipitation indices over the Missouri River Basin and (2) project future changes in these extremes using the best-performing models under a high-emission scenario. This would be achieved by undertaking an analysis of historical changes in extreme precipitation using simulations from 16 high-resolution, dynamically downscaled simulations from NA-CORDEX over the MRB. The study will provide a detailed evaluation of the NA-CORDEX model’s performance in simulating the frequency and intensity of precipitation extremes and an assessment of projected changes in precipitation extremes over MRB.

2. Data and Methodology
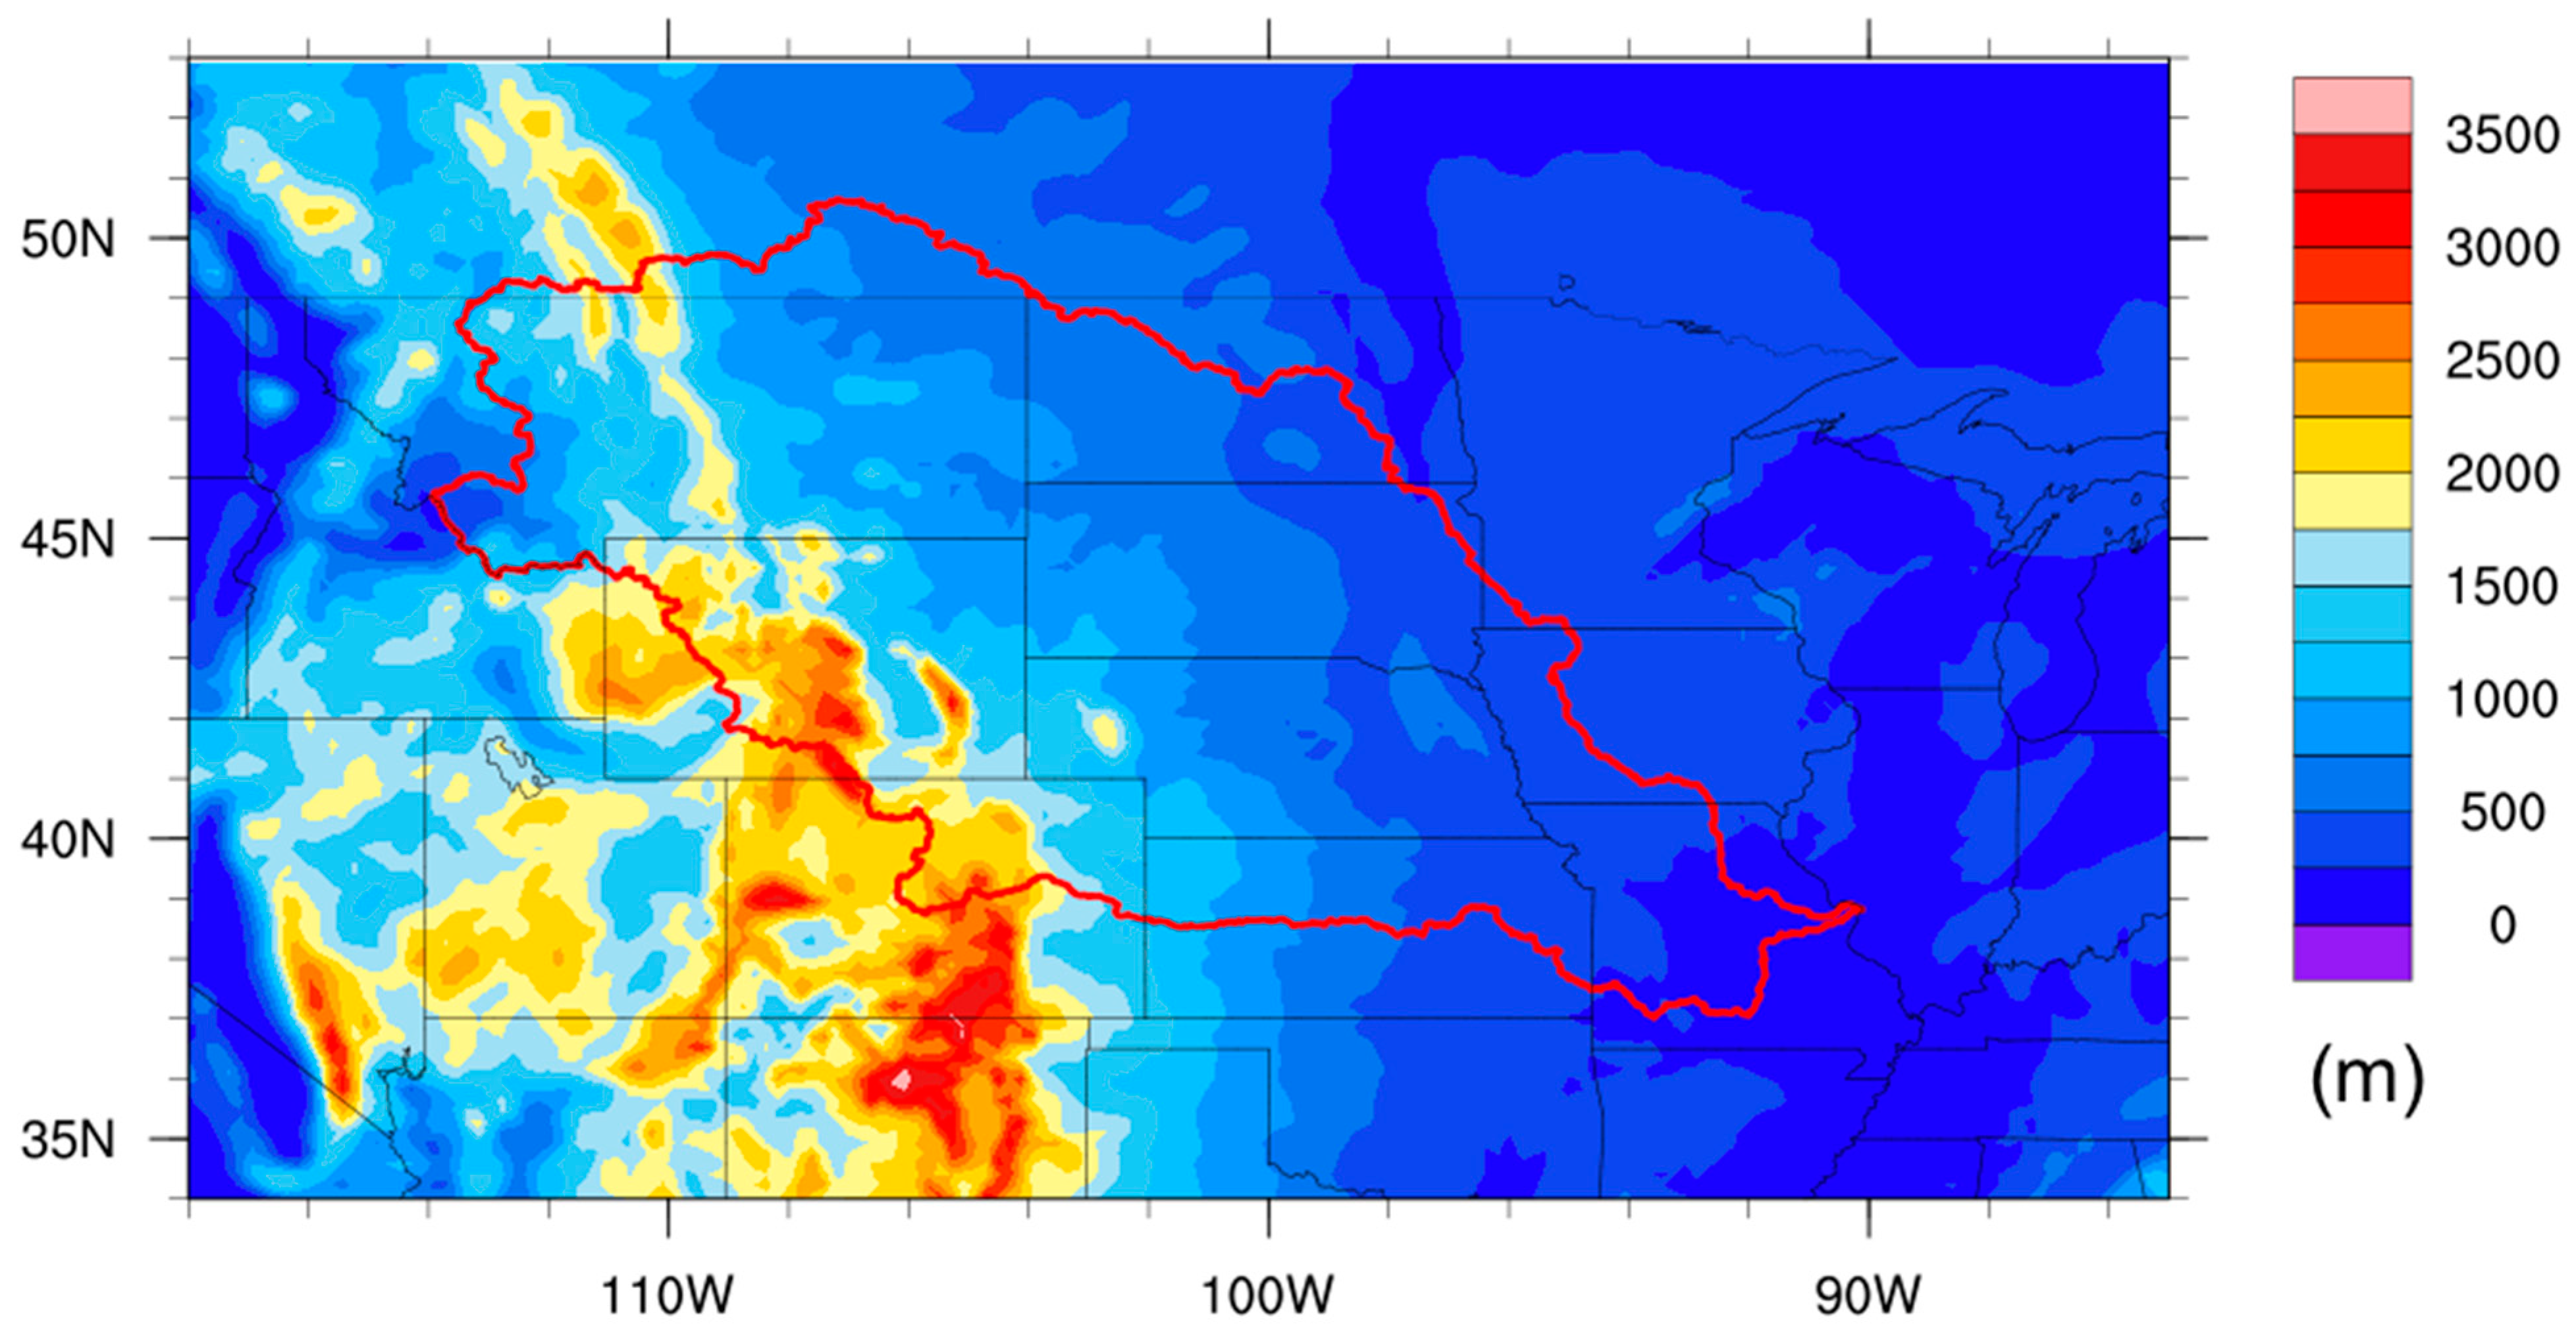
2.1. Study Area

Figure 1 shows the geographic location of the MRB. The MRB stands as the largest single river basin within the United States. Encompassing over 25 Native American tribal land regions and portions of 10 U.S. states and 2 Canadian provinces, it spans an area exceeding 1.3 million km2 [23]. The Missouri River stretches for over 4000 km (2500 miles), extending from its origin in Montana to the basin’s terminus at Hermann, Missouri, where it maintains an average monthly flow of approximately 2800 m3s−1 [11]. The highest point in the basin is about 3000 m, as shown in Figure 1. The MRB holds significant importance across various natural and human systems, including wetlands, transportation, entertainment, the generation of hydroelectric power, the agricultural sector, and general water resources. These facets collectively contribute to the economic vitality of the region. Notably, agriculture within the basin accounts for nearly half of U.S. wheat production, alongside significant yields of corn and soybeans [23].

2.2. Data

The NA-CORDEX simulations provide dynamic downscaling using multiple RCMs over a domain covering most of North America, with boundary conditions from GCM simulations in the CMIP5 archive. Table 1 lists the 16 pairs of GCMs and RCMs that are used in this study. All simulations are at a spatial resolution of 25 km. There are five different RCMs involved, including CanRCM4, CRCM with two alternative configurations (CRCM5-UQAM and CRCM5-OUR), RegCM4, and WRF. More details about the NA-CORDEX setup can be found in Mearns et al. [24]. All these pairs provide climate simulations during the historical period (1950–2005) and future climate projections by the end of the century. Here, we use a high-emission scenario, Representative Concentration Pathway (RCP) 8.5, for our future analysis. Although other scenarios, such as RCP 4.5 and RCP 2.6, are also available, the availability of the high-emission RCP 8.5 scenario is more consistent [25], and previous studies have used it as the primary future scenario.
To evaluate the performance of NA-CORDEX, daily precipitation was obtained from the Climate Prediction Center’s unified gauge-based analysis (CPCU [26]) at a spatial resolution of 0.25° from 1948 to the present. This dataset has been used in precipitation variability studies [27,28,29]. CPCU gridded precipitation will be referred to as observed precipitation in this study for the sake of simplicity.

2.3. Extreme Precipitation Indices

To characterize precipitation extreme events in the MRB, five precipitation indices were calculated. The rx5day index is calculated by finding the maximum 5-day accumulated precipitation during the study period. The cdd index is defined as the maximum/largest number of consecutive days, where precipitation is ≤1 mm during the period. The cwd index is the largest number of consecutive days where precipitation is ≥1 mm during the period. The r10mm index is calculated by counting the number of times daily precipitation exceeds 10 mm (precipitation ≥ 10 mm). So, the number of days where precipitation is more than 10 mm is counted. The r20mm index is calculated by counting the number of times daily precipitation exceeds 20 mm during the period. All calculations were carried out for the summer and winter seasons throughout the entire study period per year, and the definitions of the indices are summarized in Table 2. These indices have been successfully applied to climate projections and detection studies (e.g., [30,31,32,33,34]). More information on the precipitation indices can be found at the Expert Team on Climate Change Detection and Indices (ETCCDI) website: http://etccdi.pacificclimate.org/indices_def.shtml (accessed on 10 August 2024).
The five extreme precipitation indices are calculated for summer (June–August, JJA) and winter (December–February, DJF) individually from the observations and CORDEX historical and future simulations. We focused on the JJA and DJF periods because they are the general summer (wet) and winter (dry) periods over the basin and the United States in general and for consistency with previous studies (e.g., [11,13,25]). Although DJF is considered a dry season, extreme precipitation, such as heavy snowfall, could have significant socioeconomic impacts, making it essential to assess its past and future changes. For the ensemble analysis, we calculated the ensemble from all 16 models (hereafter called ENSEMBLE) and the ensembles from individual RCM groups (hereafter called RCM ensemble).

2.4. Method of Evaluation and Analysis

To assess the performance of each set of models (Table 1) in simulating the seasonal extreme precipitation indices over the MRB, we used the Taylor diagram [35], which provides a concise statistical summary of the model’s skill. The Taylor diagram illustrates the degree of similarity between modeled and observed patterns. Their relationships are quantified using standard deviations, the centered root mean square difference, and the correlation of individual patterns. It is particularly effective for comparing the relative skills of multiple models or evaluating different components of complex models [36]. In this framework, a model’s proximity to the reference point (representing observations) on the diagram indicates how well it replicates the observed behavior.

2.5. Extreme Precipitation Analysis

Using the metrics described in the previous section, we compare individual CORDEX models with observation-derived precipitation indices during the historical period (1951–2005). Instead of relying solely on full-ensemble projections as used in previous work (e.g., [22,25,37], we select the best-performing models per index in order to reduce projection uncertainty and improve reliability. The 5 best-performing models are selected for the future projection of the extreme events. Hence, we use the ensemble mean of the 5 best-performing models to assess the projected changes in summer and winter precipitation extremes (including rx5day, cdd, cwd, r10mm, and r20mm) over the period 2050–2099 under the RCP 8.5 scenario relative to the reference period 1951–2005. Using Student’s t-test, we identify the locations where extreme precipitation differs significantly between the reference period 1951–2005 and the projected period 2050–2099.

3. Results and Discussion

3.1. Mean Climatology of Precipitation

Figure 2 shows the climatological monthly precipitation from CPCU, individual NA-CORDEX models, and ENSEMBLE. According to the observations, there is a clear seasonality of precipitation in the MRB, with higher precipitation from May to August and lower precipitation from November to February. The NA-CORDEX models revealed consistent wet biases over the MRB, with the largest biases between April and June. Compared to the individual models, ENSEMBLE can better capture the seasonal variability, and the biases are considerably smaller than a majority of the models, although there are still evident wet biases.
The NA-CORDEX models can reasonably capture precipitation seasonality; however, these seasonal variations are quite different in GFDL-ESM2M.WRF, GEMatm-Can.CRCM5-UQAM, GFDL-ESM2M.CRCM5-OUR, CanESM2.CRCM5-OUR, and CanESM2.CRCM5-UQAM, indicating certain deficiencies of the driving GCM, GFDL-ESM2M, and CanESM2 in representing the temporal variability of precipitation in this region. The discrepancy in model performance underscores the significant impact that biases in GCMs can have on the performance of RCMs [38,39]. Despite the general overestimated precipitation in NA-CORDEX, ENSEMBLE did represent the observed seasonality of precipitation in MRB better than some models, while some models performed better.

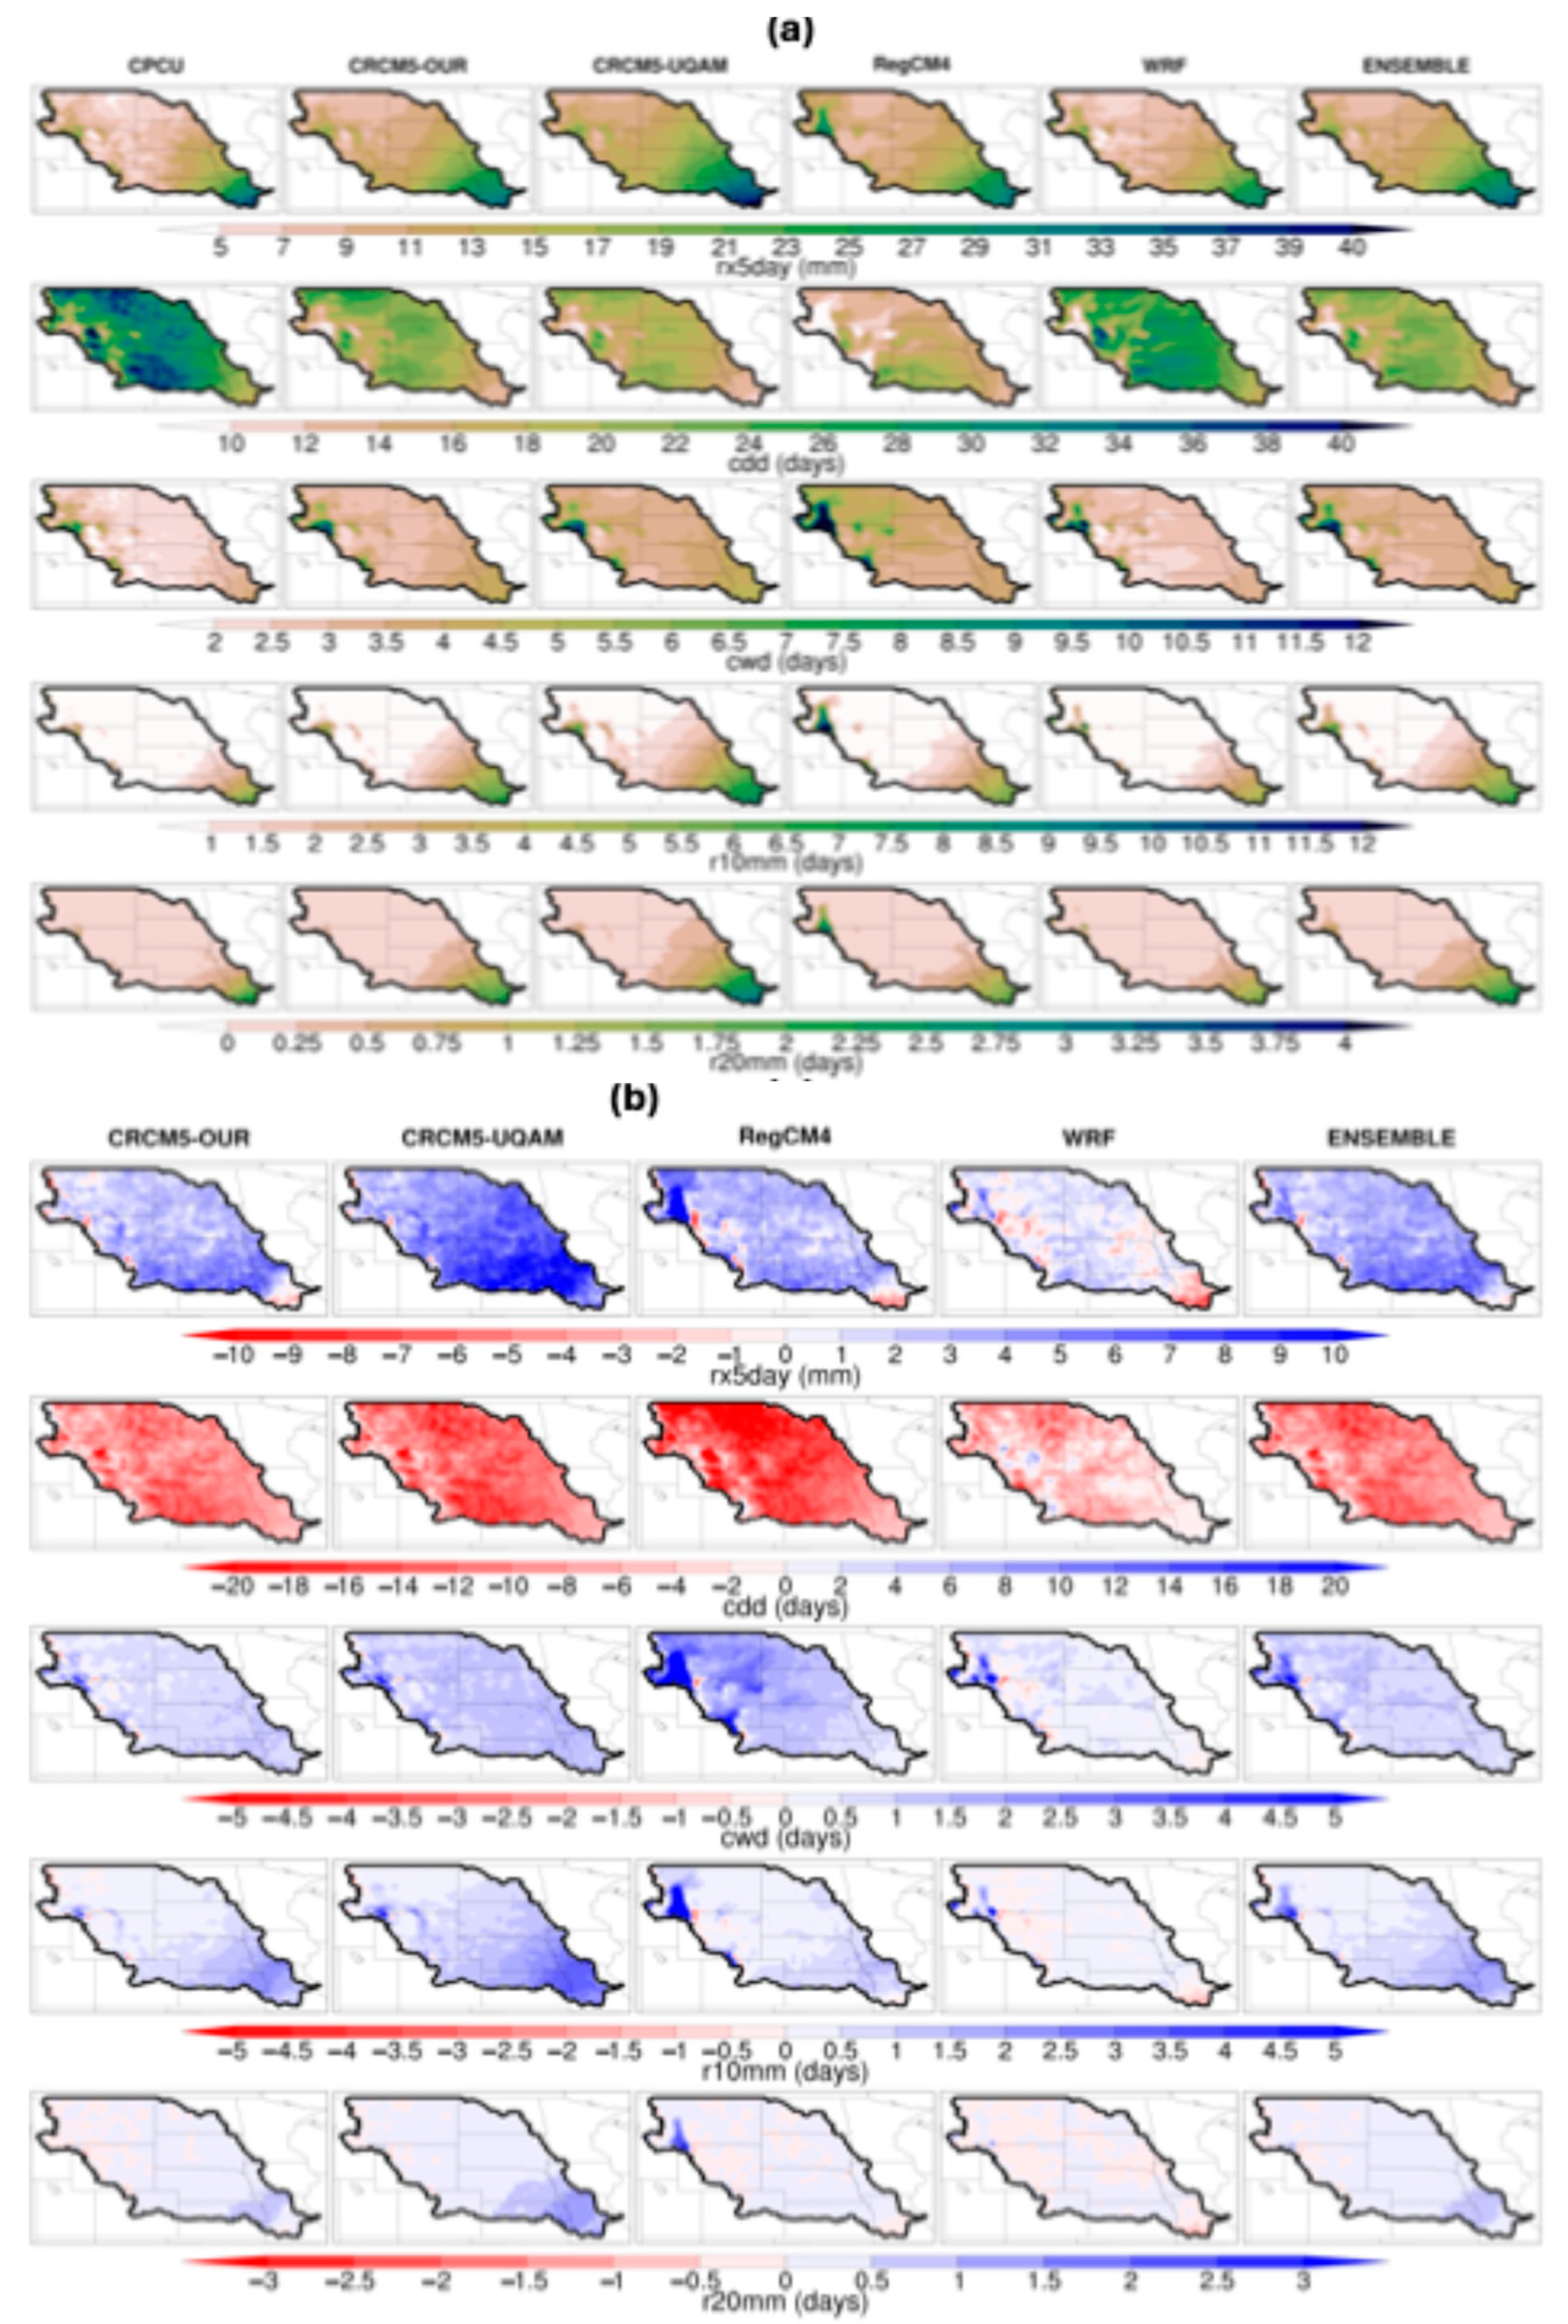
3.2. Spatial Distribution of Historical Extreme Precipitation Indices

Figure 3a shows the summertime rx5day, cdd, cwd, r10mm, and r20mm for individual RCM ensembles and all-model ensemble (ENSEMBLE) during the period 1951–2005. rx5day shows the spatial distribution of the total sum of the maximum 5-day precipitation. The highest rx5day during the study period mostly occurred around the southeastern edge of the basin, while the northern area had lower values and ranged between 10 and 55 mm. All the RCM ensembles represented rx5day well over the basin during the JJA season in comparison with the observation. The cdd (longest consecutive dry days where precipitation is less than 1 mm) is the highest in the northwestern part of the basin and lowest at the downstream end, with a range between 4 and 26 days. The WRF RCM ensemble shows the lowest value of cdd. However, cwd (the longest consecutive wet days where precipitation is ≥1 mm) was the highest with the WRF RCM ensemble, especially at the upstream of the basin, with ranges between 2 and 12 days. The r10mm and r20mm are also the highest in the WRF RCM ensemble and the lowest in the CRCM5-UQUAM RCM ensemble, ranging between 1–12 and 0–8 days, respectively, over the basin.
Figure 3b presents the spatial biases in summertime rx5day, cdd, cwd, r10mm, and r20mm for each RCM ensemble and ENSEMBLE during the period 1951–2005. The RCM ensembles show positive bias in rx5day, with biases up to 14 mm in most parts of the basin except for the RegCM4 RCM ensemble, which shows clear negative biases in the eastern part. The WRF RCM ensembles exhibited a notable underestimation of about 10 days, particularly in the upstream region, for cdd. The CRCM5-UQAM RCM ensemble shows lower spatial bias in estimating cwd with a range of ±1 day compared to other models. Also, WRF RCM ensembles did have a stronger positive bias for cwd and r10mm. ENSEMBLE did not show the best spatial agreement with CPCU for some of the indices, like cdd and cwd, over the basin, as seen in Figure 3a,b.
For the individual models in the summer, the results in Figure S1 indicate that the models generally exhibit rx5day biases within ±20 mm, while cdd (Figure S2) has spatial biases ranging between ±14 days. In Figure S3, the findings suggest that CNRM-CM5.CRCM5-OUR, GFDL-ESM2M.WRF, and MPI-ESM-LR.WRF have the highest overestimation for cwd over the western area of the basin characterized by rough terrain. This observation raises the possibility that these models may not perform optimally over high terrains. The r10mm in Figure S4 shows that the highest bias from the individual model is between ±10 days, and Figure S5 also reveals that CanESM2 drivers tend to underestimate r20mm. In general, ENSEMBLE fairly shows low spatial bias in some individual models, while some provide a better representation of the extreme indices.
Figure 4a shows the rx5day, cdd, cwd, r10mm, and r20mm for individual RCM ensembles and ENSEMBLE during winter. Similarly to summer, the highest rx5day in the winter mainly occurs around the southeastern edge of the basin and ranges between 3 and 40 mm. The highest cdd is noted around the northwestern part of the basin, and the lowest is noted at the downstream end, with a range between 4 and 40 days. The WRF RCM ensembles show the highest value of cdd during the winter. Also, CPCU shows more dry days than the models, as the range of cwd is between 2 and 12 days, with the highest value around the northwestern part of the basin. r10mm and r20mm are highest in the CRCM5-UQUAM RCM ensemble and range between 1–12 and 0–4 days, respectively, during the winter. Figure 4b presents the spatial variation of rx5day, cdd, cwd, r10mm, and r20mm for each RCM ensemble and ENSMEAN biases during the winter. It is noteworthy that despite showing high spatial bias for most of the indices in the summer, the WRF RCM ensemble exhibits the least spatial bias in the winter in most indices. For rx5day, the CRCM5-UQAM RCM ensemble shows more bias over the southern part of the basin, with ranges between ±10 mm. The RegCM4 RCM ensemble shows the highest spatial bias for cdd and cwd, with ranges of ±20 days and ±5 days, respectively, while CRCM5-UQAM has the highest bias for r10mm and r20mm, with ranges of ±5 and ±1.5, respectively.
For the individual models in the winter, Figure S6 indicates that all models generally have a bias of ±4 mm in most of the areas. Figure S7 shows that some models have positive biases up to 26 days, while some have a range of about ±6 days for cdd. Most models show less than ±3 days bias for cwd (Figure S8). Figures S9 and S10 show that most models tended to estimate DJF r10mm and r20mm well, with biases of ±4 and ±1.5, respectively. Though some individual models exhibit smaller spatial biases than the ENSEMBLE, overall, ENSEMBLE reasonably displays good spatial agreement with CPCU for some of the indices.

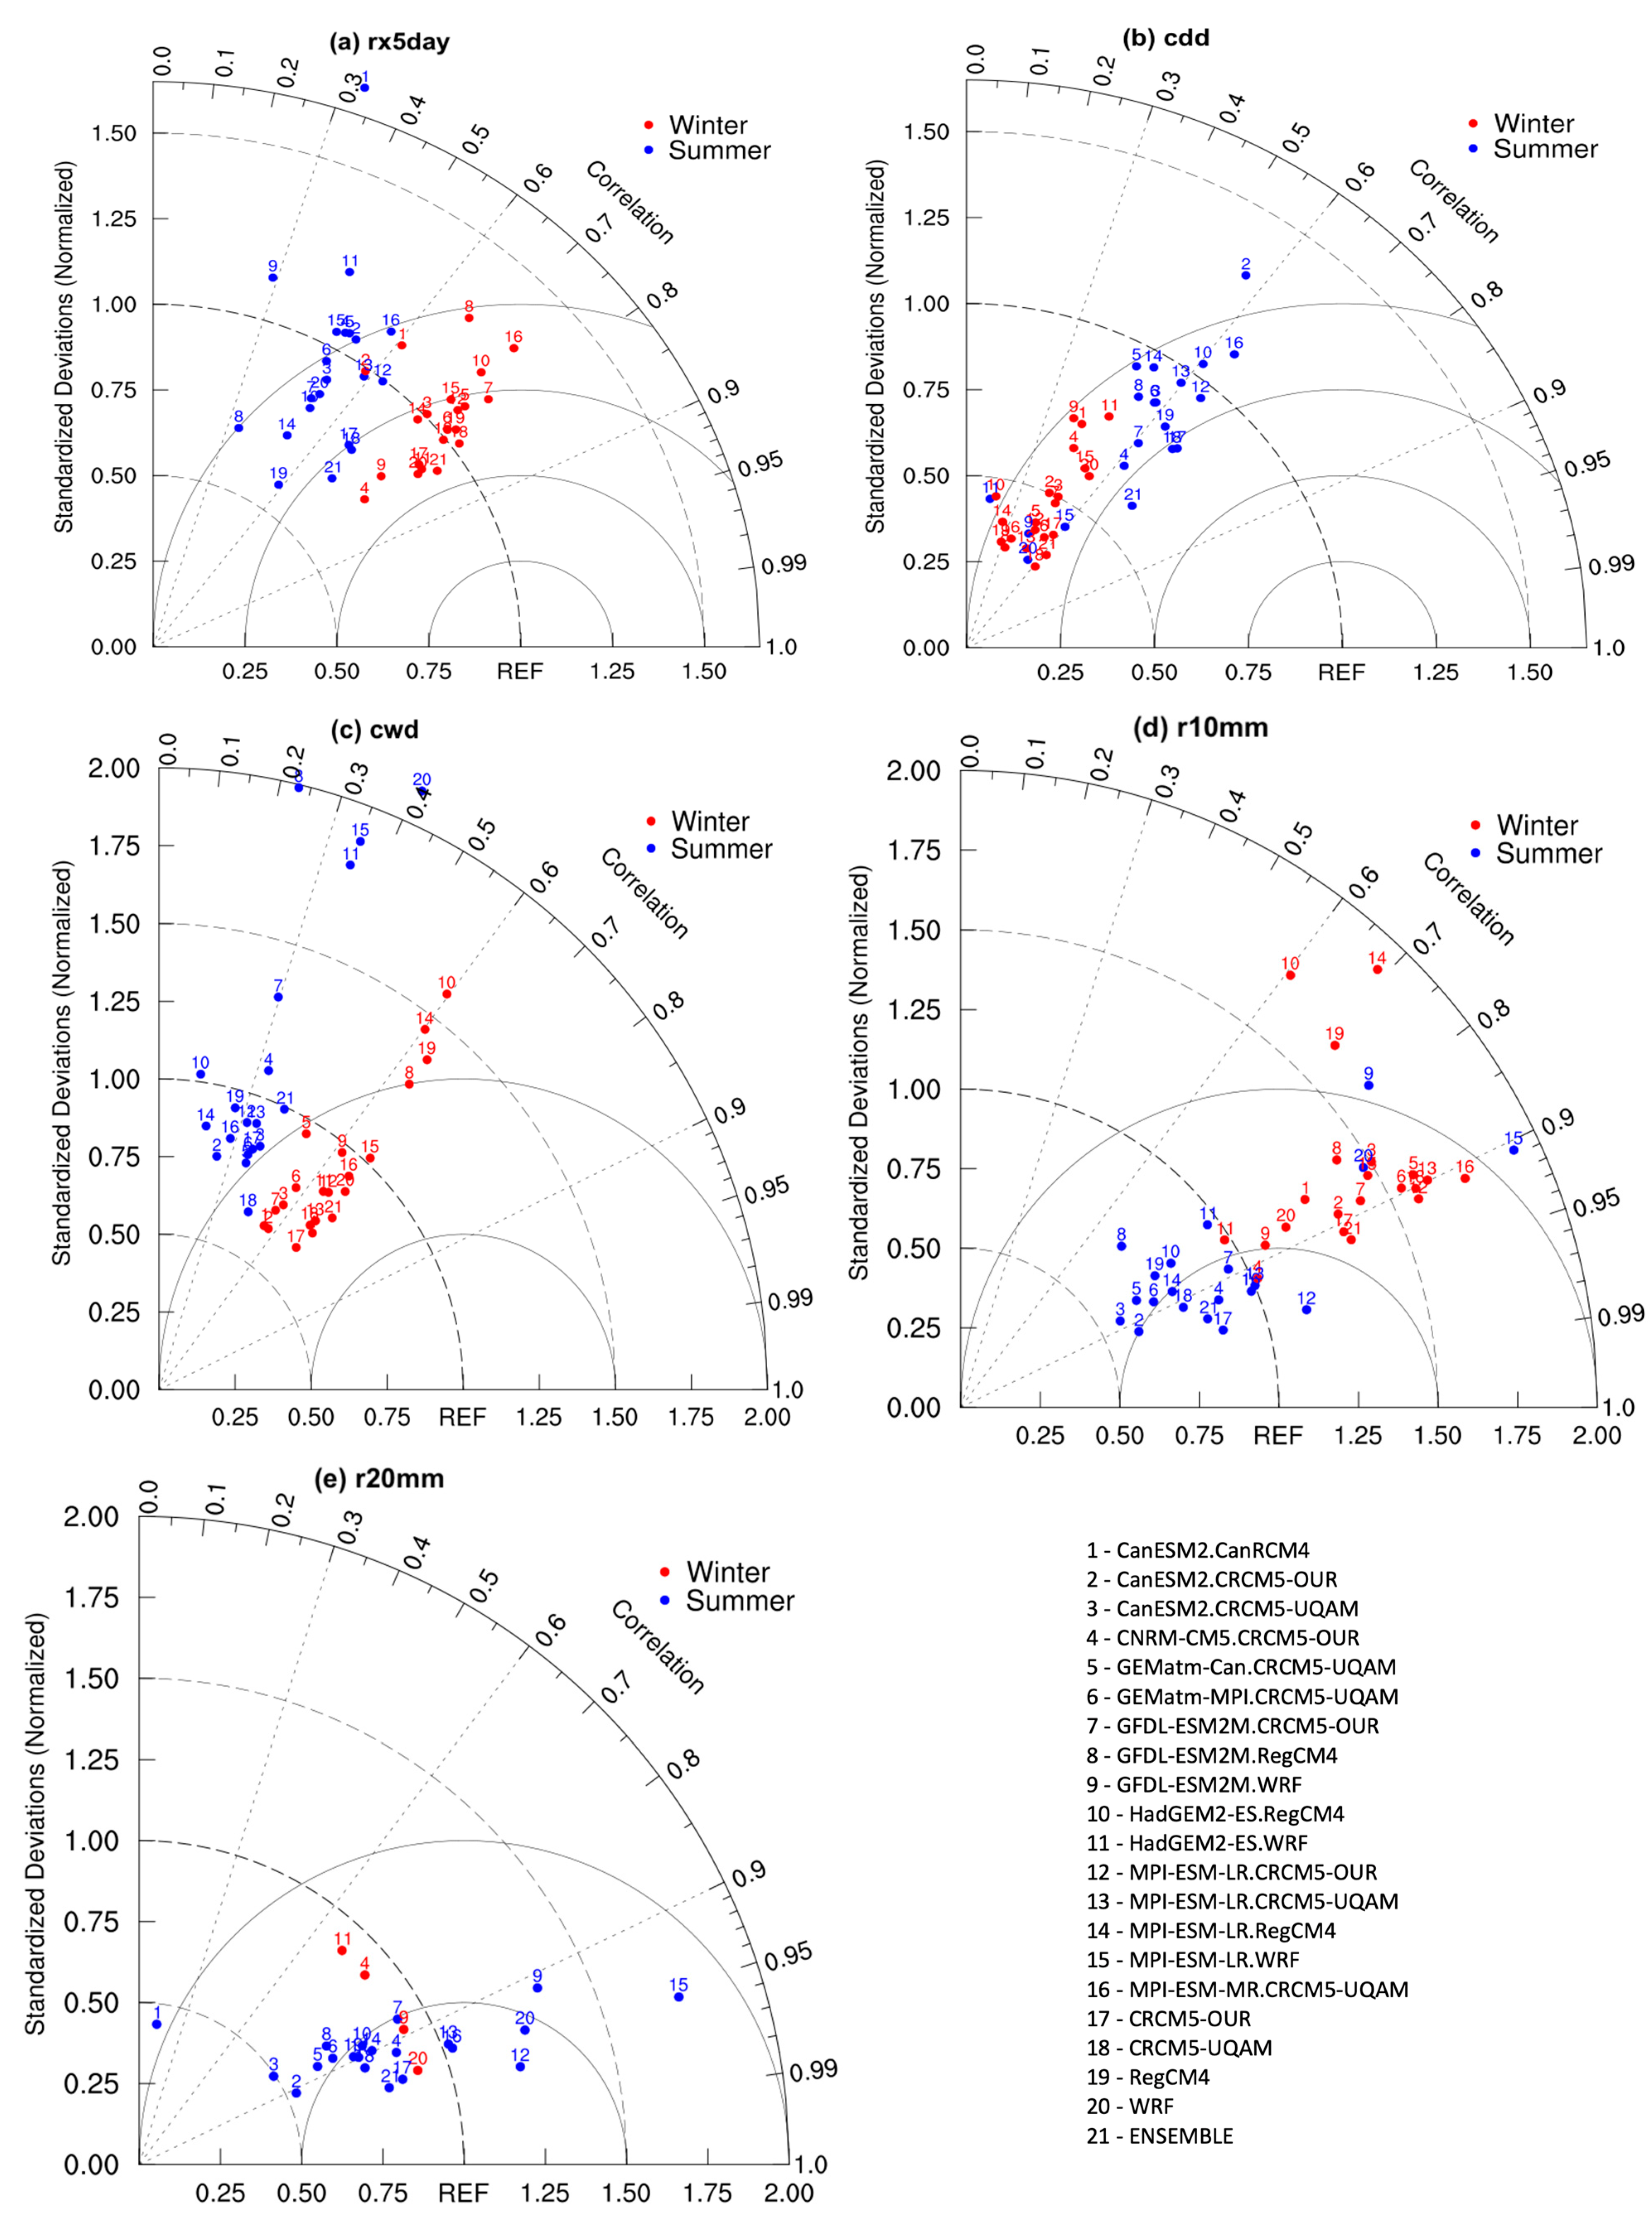
3.3. Statistical Evaluation of the Model’s Extreme Precipitation Indices

Taylor diagrams are used to evaluate the performance of models in simulating historical extreme precipitation events over the MRB compared with CPCU data as the observational reference. The position of each model on the diagram indicates how closely its simulated pattern of extreme precipitation indices aligns with the observed data. The 16 individual NA-CORDEX models, RCM ensembles, and ENSEMBLE are denoted using numbers 1–21, while blue and red colors indicate the summer and winter analyses, respectively. According to Figure 5a, HadGEM2-ES.WRF performs the best among all the individual models, with RCM ensembles and the ENSEMBLE also demonstrating good performance during the winter. During the summer, MPI-ESM-LR.CRCM5-OUR performed the best among the individual models. Overall, the models perform better during winter for rx5day. The ability of the individual and ensemble models to represent the cdd over the MRB is presented in Figure 5b. Among individual models, CNRM-CM5.CRCM5-OUR performs the best for the JJA period, while GEMatm-MPI.CRCM5-UQAM is the best for winter. From Figure 5c, GEMatm-Can.CRCM5-UQAM exhibits the best performance for the summer period, while CNRM-CM5.CRCM5-OUR performs the best during the winter season in depicting the cwd in the basin. MPI-ESM-LR.CRCM5-OUR demonstrates the best performance during the summer, while CNRM-CM5.CRCM5-OUR performs the best during the winter in representing r10mm, as seen in Figure 5d. From Figure 5e, MPI-ESM-LR.CRCM5-OUR performs best during the summer, while GFDL-ESM2M.WRF exhibits the best performance during the winter in representing r20mm. It should be noted that some models perform poorly, so their metrics (such as correlation and standard deviation) exceed or fall outside the scale of the plot (Figure 5e) and hence do not appear in the plots. Overall, although the ENSEMBLE and the RCM ensembles demonstrate a generally robust performance compared to the observations, some individual models outperform the other ensemble models in various extreme precipitation indices.

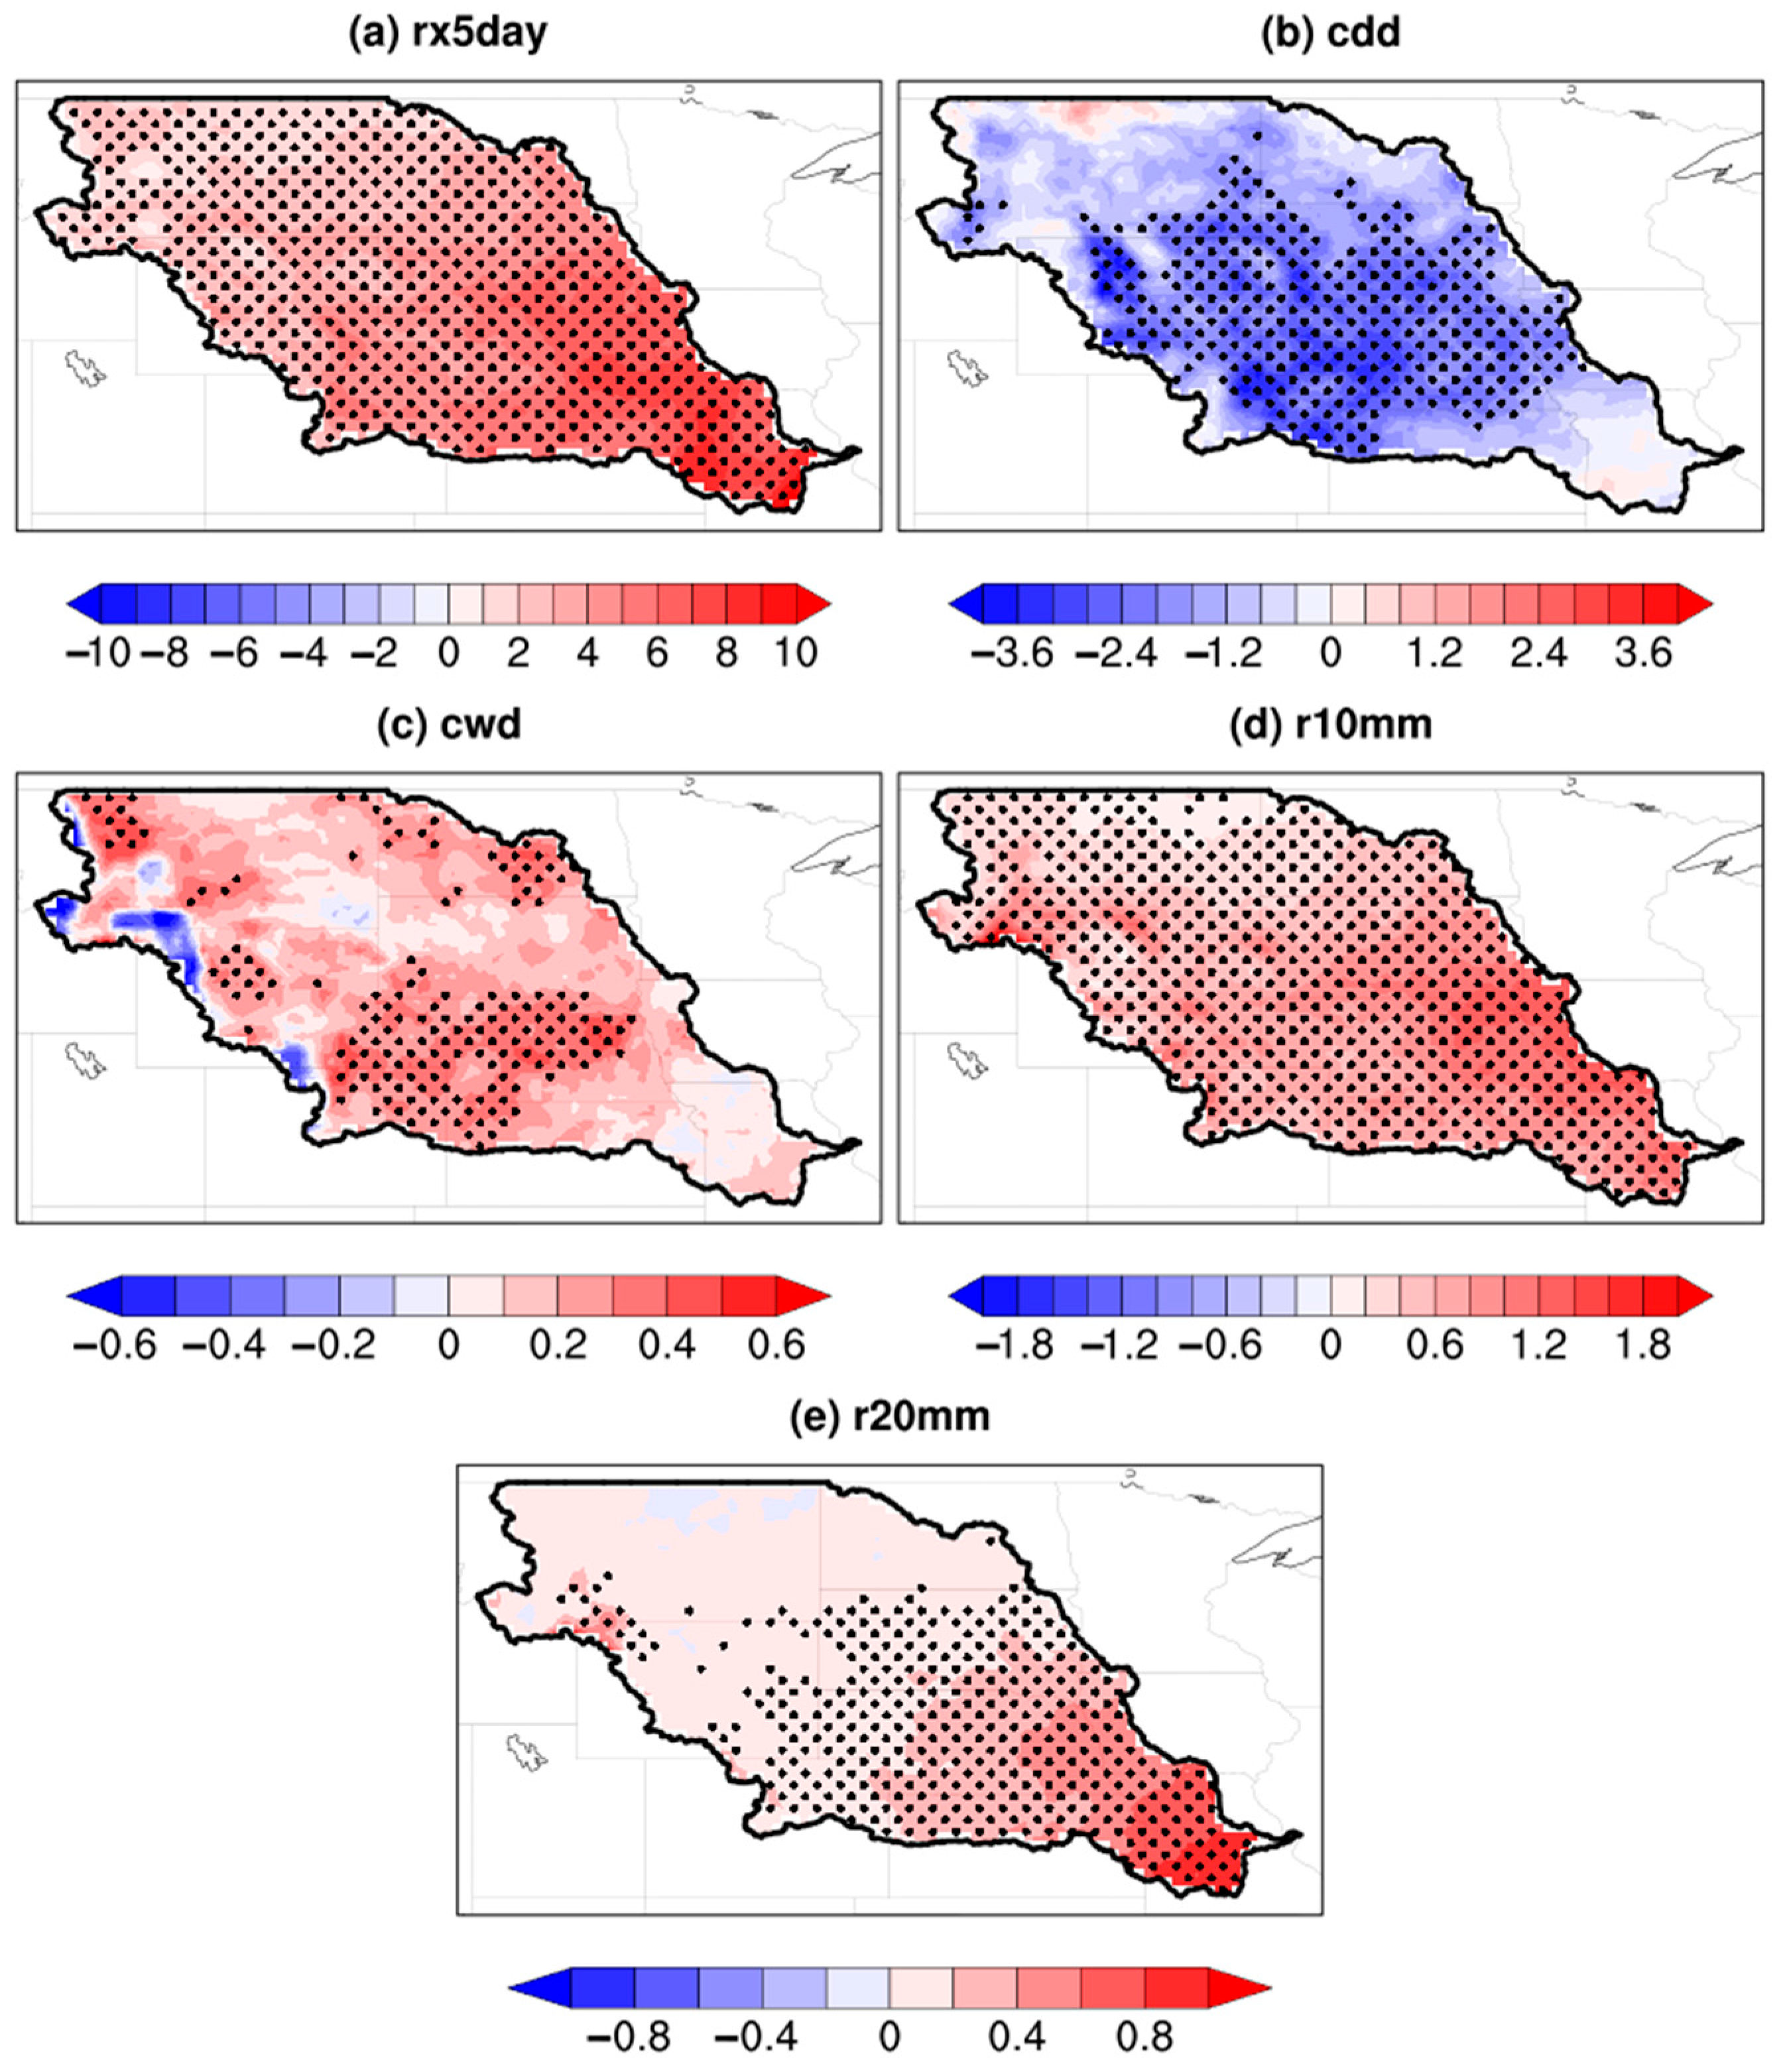
3.4. Future Change in Extreme Precipitation Indices

Considering the model biases discussed in the previous section, some of the individual models performed fairly well compared to ENSEMBLE for different indices. In order to limit the uncertainties of precipitation projections, here, we identified the 5 best-performing models for each index from the individual 16 NA-CORDEX models based on the analysis from the Taylor diagrams described in the previous section. The selected five best-performing models for each index are shown in Table 3, and they are used to assess future changes in extreme precipitation indices over the MRB. This ensures that we use the most reliable models for future projections.
Figure 6 presents the projected changes in summer precipitation extremes over the period 2050–2099 under the RCP 8.5 scenario relative to the reference period 1951–2005. There is a significant increase (about +12 mm) in summer rx5day, mostly over the eastern part of the basin, indicating that heavy precipitation events will become more intense during the second half of the century, while there will be a minor change, either an increase or decrease to near-normal, of about ±3 to 4 mm in the western or upstream parts of the basin.
Despite a significant increase in heavy precipitation intensity, a significant increase in cdd (about +3 days) was also found in most areas of the basin (Figure 6b), while the downstream area showed mild differences (±1 day). The cdd index helps determine how long dry weather will persist. Therefore, an increase in cdd suggests that the dry spell will become significantly longer over large areas of the MRB in the summer. In Figure 6c, it is evident that during the JJA season, most parts of the basin will experience a decrease in cwd, but this is not statistically significant, except for some central and upstream areas. Additionally, the downstream area shows a slight increase. As the cwd index measures the number of days that rainy weather persists, our results indicate a decrease in consecutive rainy days in the future, which is also supported by the significant increase in cdd over the basin (Figure 6b).
Figure 6d illustrates the projected changes in the total number of days with precipitation ≥ 10 mm in the MRB during the summer. There is a significant increase in r10mm in the downstream area and a significant decrease in the upstream area, with a range of about ±2 days. This provides information about the frequency of heavy rainfall events and gives insight into the potential future impacts on hydrology, agriculture, and available infrastructure. The r20mm index shows a similar spatial pattern as r10mm (Figure 6e), but the changes are not statistically significant in most areas of the basin. Only the downstream areas in the south show a significant increase from the baseline period. Overall, this suggests a significant increase in heavy precipitation events in most parts of the basin [40].
During winter, there is a significant increase in rx5day (up to 10 mm) across the basin, suggesting that the maximum amount of 5-day precipitation (either rain or snow) in 2050–2099 will be significantly higher (Figure 7a). Meanwhile, there is a widespread decrease in winter cdd in the entire basin, with the most central part of the basin showing a statistically significant decrease (up to −4 days), suggesting that there is a considerably lower chance of dry events occurring in the future. The analysis of the cwd projections (Figure 7c) shows significantly longer wet days, especially in the southwestern and central parts of the basin. Figure 7d illustrates a widespread increase in r10mm events across the entire basin, with a statistically significant increase of about +2 days, suggesting more frequent heavy precipitation events in the projected period. Similarly, r20mm demonstrates a statistically significant increase (up to +1 day) mostly downstream of the MRB. This result suggests that extreme precipitation events will become more common in the future, as indicated by the substantial increase in rx5day, significant decrease in cdd, notable increase in cwd, and significant increase in both r10mm and r20mm [41]. It is important to note that the projected changes are somewhat sensitive to the choice of models. The selection of the five best-performing models for each index was guided by their performance in simulating historical extremes, as measured by the correlation, standard deviation, and RMSE from Taylor diagrams. This approach ensures that only the most reliable models contribute to future projections, helping reduce uncertainty.

4. Discussions

Understanding the changes in mean precipitation and other hydroclimatic variables is crucial for comprehending the Earth’s hydroclimatic response to global warming [42]. This study utilized the projections from five top-performing NA-CORDEX models to examine long-term (2050–2099, under RCP 8.5) extreme daily precipitation indices (rx5day, cdd, cwd, r10mm, and r20mm) on seasonal scales over the MRB. The ensemble’s mean enables the examination of externally induced alterations in precipitation by minimizing the impact of internal variability [43], and large ensembles may prevent the challenge of complicated model uncertainties [44]. Our findings indicate that the MRB is projected to experience increased winter precipitation extremes with respect to rx5day, cdd, cwd, r10mm, and r20mm by the end of the twenty-first century under the high emission scenario. This aligns with previous studies highlighting a consistent wetting pattern in the Great Plains during the winter [37,40,41,45,46]. During the winter, precipitation variability presents a considerably complex scenario. For instance, a large portion of the hydrological system may be covered in ice because temperatures in many MRB regions are below freezing during the winter [11,47]. Consequently, an excessive water equivalent precipitation event could have a significant impact since surfaces are frozen and impermeable. While runoff would likely be increased due to frozen or saturated soil, existing water reservoirs, storage infrastructure, and climate resilience systems would mitigate the impacts. Therefore, as the future poses an increased threat of extreme precipitation events over the basin, stakeholders must prioritize building additional structures to reduce vulnerability and risks and enhance resilience in this regard. Additionally, changes in the compound extremes of precipitation and temperature over the basin in a warming climate are essential to understanding how the projected increase in winter precipitation could be followed by a warm condition that rapidly melts accumulated snow [48,49], potentially leading to disastrous flooding in the basin.
Besides the projected increase in winter precipitation extremes, summer precipitation indices show different patterns in most regions of the basin. For instance, most regions of the basin are projected to experience a significant decrease in r10mm and a significant increase in cdd and rx5day, implying a growing risk of both extreme wet and dry conditions during the summer. The MRB’s infrastructure and agriculture are greatly impacted by intense precipitation events. For example, due to the 2019 summer flood [1], planting was delayed, farmland was flooded, and vital infrastructure like levees, bridges, and roadways was devastated [50]. The agricultural industry was particularly hard hit, with about 20 million acres remaining unplanted and crops needing more time to dry out because of delayed development [2]. The floods in the MRB underscore the necessity for enhanced infrastructure resilience to handle extreme weather brought on by climate change [51]. Also, future dry conditions are imminent, especially in the central areas of the basin, which can be seen from our results for cdd and r10mm. This may indicate a rise in the frequency and intensity of summer droughts, which could have a major impact on the region’s water supplies and agricultural output. The 2012 drought resulted in reduced navigation channels and numerous vessels grounded on the Mississippi River near the Missouri shoreline [52]. The ensuing effects on navigation endangered residential and commercial water users alongside the Missouri River and cost the area more than USD 275 million [52]. Hence, proactive measures should be taken to ameliorate the impacts of extreme summer precipitation events.
This study builds upon and extends prior research that has primarily focused on broader domains, such as the continental U.S. or all of North America (e.g., [18,21]). By concentrating specifically on the MRB, we provide a more localized and actionable understanding of future changes in precipitation extremes. Unlike Fisel et al. [22], who applied an object-oriented framework to analyze event-based precipitation characteristics, our approach evaluates a broader suite of standardized extreme precipitation indices (e.g., rx5day, cwd, r20mm) using the NA-CORDEX multi-model ensemble. This methodological distinction allows for a more comprehensive assessment of both historical model performance and projected seasonal-scale changes in extremes, which are highly relevant for climate adaptation planning in the MRB.
Also, these projections offer valuable insights for stakeholders across the MRB. The increase in extreme precipitation and longer dry spells has implications for infrastructure planning, including stormwater and flood control systems. They also highlight the need for improved agricultural drought resilience and emergency preparedness. Integrating these results into land-use planning and water resource management can support long-term climate adaptation and regional resilience. While this study offers valuable insights into future changes in extreme precipitation, it should be noted that the CPCU observational dataset, while widely used and reliable at larger scales, may still carry uncertainties related to gauge density and spatial interpolation, particularly in regions with complex terrain. It is important to note that our study only considered the high-emission RCP8.5 scenario; alternative pathways, such as RCP4.5, may yield different outcomes. Previous research has shown that precipitation, particularly its response to emission reductions, is less pronounced compared to temperature changes [53]. It should also be mentioned that this study’s climate projections are derived from downscaled CMIP5 models. While the next generation of climate models, CMIP6, offers climate simulations using upgraded model physics [54], RCMs have a dynamical core that refines these global outputs for a specific region. Also, at the time of this study, dynamically downscaled CMIP6 data were not yet available for the Missouri River Basin, and dynamically downscaled CMIP5 data from NA-CORDEX were preferred over statistically downscaled alternatives due to their ability to better capture physical processes and spatial coherence that are critical for basin-scale extreme precipitation analysis.

5. Conclusions

Extreme precipitation events can profoundly impact society, making it crucial to predict their future changes accurately. Global and regional climate models serve as valuable tools for predicting these changes. The initial step in this process is to assess the precision of the NA-CORDEX models in representing extreme precipitation within the MRB. This evaluation can serve as the foundation for generating dependable forecasts of future extreme events. In this study, we evaluated the performance of 16 NA-CORDEX downscaling products in simulating historical extreme precipitation over the MRB. We utilized five sets of extreme precipitation indices defined by ETCCDI and compared the results with CPCU gridded observations for both summer and winter seasons. Considering the uncertainties in precipitation projections and the fact that some individual models outperformed the ENSEMBLE, the top 5 performing models for each index were identified from the 16 NA-CORDEX models based on the analysis of Taylor diagrams. The ensemble mean of those selected models was used to project future extreme precipitation events under the RCP 8.5 scenario. Overall, most NA-CORDEX models were found to fairly accurately reproduce the spatial patterns of extreme precipitation indices and the seasonal patterns of mean precipitation, albeit with varying biases. The majority of models adequately represented DJF and JJA cwd, with most ensemble means performing fairly well in capturing extreme precipitation events across some of the indices.
In the future projection of extreme indices during the JJA season, there is a notable increase in rx5day events, especially in the eastern part of the basin. Additionally, there are significant increases in the projected cdd around the central area, substantial changes in the cwd in the central and southwestern parts, and a noteworthy increase in r10mm in the downstream area and a considerable decrease in the upstream area. Conversely, the projection for the DJF season indicated a significant increase in rx5day occurrences over the basin at a 95% confidence level, alongside a statistically significant decrease in cdd and a significant increase in cwd, r10mm, and r20mm.
As the future presents an elevated risk of extreme precipitation events over the basin, it is imperative that the stakeholders prioritize infrastructural development to reduce vulnerability and enhance resilience.

Supplementary Materials

The following supporting information can be downloaded at: https://www.mdpi.com/article/10.3390/atmos16050579/s1, Figure S1. Spatial Mean distribution of summer rx5day (mm) for each model’s biases (model minus Observation) for period 1951–2005 for the 16 NA-CORDEX models and their ENSEMBLE; Figure S2. Spatial Mean distribution of summer cdd (days) for each model’s biases (model minus Observation) for period 1951–2005 for the 16 NA-CORDEX models and their Ensemble mean; Figure S3. Spatial Mean distribution of summer cwd (days) for each model’s biases (model minus Observation) for period 1951–2005 for the 16 NA-CORDEX models and their Ensemble mean; Figure S4. Spatial Mean distribution of summer r10mm (days) for each model’s biases (model minus Observation) for period 1951–2005 for the 16 NA-CORDEX models and their Ensemble mean; Figure S5. Spatial Mean distribution of summer r20mm (days) for each model’s biases (model minus Observation) for period 1951–2005 for the 16 NA-CORDEX models and their Ensemble mean; Figure S6. Spatial Mean distribution of winter rx5day (mm) for each model’s biases (model minus Observation) for period 1951–2005 for the 16 NA-CORDEX models and their Ensemble mean; Figure S7. Spatial Mean distribution of winter cdd (days) for each model’s biases (model minus Observation) for period 1951–2005 for the 16 NA-CORDEX models and their Ensemble mean; Figure S8. Spatial Mean distribution of winter cwd (days) for each model’s biases (model minus Observation) for period 1951–2005 for the 16 NA-CORDEX models and their Ensemble mean; Figure S9. Spatial Mean distribution of winter r10mm (days) for each model’s biases (model minus Observation) for period 1951–2005 for the 16 NA-CORDEX models and their Ensemble mean; Figure S10. Spatial Mean distribution of winter r20mm (days) for each model’s biases (model minus Observation) for period 1951–2005 for the 16 NA-CORDEX models and their Ensemble mean.

Author Contributions

Conceptualization, I.C.A.; Methodology, I.C.A., L.C. and F.M.-A.; Software, I.C.A.; Validation, L.C. and F.M.-A.; Formal analysis, I.C.A.; Writing—original draft, I.C.A.; Writing—review & editing, L.C. and F.M.-A.; Visualization, I.C.A.; Supervision, L.C., Q.H. and F.M.-A.; Project administration, Q.H. All authors have read and agreed to the published version of the manuscript.

Funding

This work is partially supported by University of Nebraska Collaboration Initiative.

Institutional Review Board Statement

Not applicable.

Informed Consent Statement

Not applicable.

Data Availability Statement

Data are contained within the article.

Acknowledgments

We thank the National Center for Atmospheric Research (NCAR) for granting access to the Derecho supercomputer’s computational resources, which have been crucial to the data analysis and research reported in this work.

Conflicts of Interest

The authors declare no conflict of interest.

References

  1. Flanagan, P.X.; Mahmood, R.; Umphlett, N.A.; Haacker, E.; Ray, C.; Sorensen, W.; Shulski, M.; Stiles, C.J.; Pearson, D.; Fajman, P. A Hydrometeorological Assessment of the Historic 2019 Flood of Nebraska, Iowa, and South Dakota. Bull. Am. Meteorol. Soc. 2020, 101, E817–E829. [Google Scholar] [CrossRef]
  2. USDA, Farmers Prevented from Planting Crops on More than 19 Million Acres. Farm Service Agency. 2019. Available online: https://www.fsa.usda.gov/news-room/news-releases/2019/report-farmers-prevented-from-planting-crops-on-more-than-19-million-acres (accessed on 30 June 2020).
  3. Yang, Z.; Qian, Y.; Liu, Y.; Berg, L.K.; Gustafson, W.I.; Feng, Z.; Sakaguchi, K.; Fast, J.D.; Tai, S.-L.; Yang, B.; et al. Understanding irrigation impacts on low-level jets over the Great Plains. Clim. Dyn. 2020, 55, 925–943. [Google Scholar] [CrossRef]
  4. Song, F.; Leung, L.R.; Feng, Z.; Chen, X.; Yang, Q. Observed and projected changes of large-scale environments conducive to spring MCS initiation over the US Great Plains. Geophys. Res. Lett. 2022, 49, e2022GL098799. [Google Scholar] [CrossRef]
  5. Millin, O.T.; Furtado, J.C. The role of wave breaking in the development and subseasonal forecasts of the February 2021 Great Plains cold air outbreak. Geophys. Res. Lett. 2022, 49, e2022GL100835. [Google Scholar] [CrossRef]
  6. Rosenzweig, C.; Tubiello, F.N.; Goldberg, R.; Mills, E.; Bloomfield, J. Increased crop damage in the US from excess precipitation under climate change. Glob. Environ. Change 2002, 12, 197–202. [Google Scholar] [CrossRef]
  7. Maurer, E.P.; Lettenmaier, D.P. Potential effects of long-lead hydrologic predictability on Missouri River main-stem reservoirs. J. Climate 2004, 17, 174–186. [Google Scholar] [CrossRef]
  8. Ettema, R.; Zabilansky, L. Ice influences on channel stability: Insights from Missouri’s fort peck reach. J. Hydraul. Eng. 2004, 130, 279–292. [Google Scholar] [CrossRef]
  9. Qiao, L.; Pan, Z.; Herrmann, R.B.; Hong, Y. Hydrological variability and uncertainty of lower Missouri River basin under changing climate. J. Amer. Water Resour. Assoc. 2014, 50, 246–260. [Google Scholar] [CrossRef]
  10. Najibi, N.; Devineni, N.; Lu, M. Hydroclimate drivers and atmospheric teleconnections of long duration floods: An application to large reservoirs in the Missouri River basin. Adv. Water Resour. 2017, 100, 153–167. [Google Scholar] [CrossRef]
  11. Wise, E.K.; Woodhouse, C.A.; McCabe, G.J.; Pederson, G.T.; St-Jacques, J.-M. Hydroclimatology of the Missouri River basin. J. Hydrol. 2018, 19, 161–182. [Google Scholar] [CrossRef]
  12. Lopez-Cantu, T.; Prein, A.F.; Samaras, C. Uncertainties in future U.S. extreme precipitation from downscaled climate projections. Geophys. Res. Lett. 2020, 47, e2019GL086797. [Google Scholar] [CrossRef]
  13. Flanagan, P.; Mahmood, R. Spatiotemporal Analysis of Extreme Precipitation in the Missouri River Basin from 1950 to 2019. J. Appl. Meteorol. Climatol. 2021, 60, 811–827. [Google Scholar] [CrossRef]
  14. Di Luca, A.; De Elía, R.; Laprise, R. Potential for added value in precipitation simulated by high-resolution nested Regional Climate Models and observations. Clim. Dyn. 2011, 38, 1229–1247. [Google Scholar] [CrossRef]
  15. Ashfaq, M.; Rastogi, D.; Mei, R.; Kao, S.C.; Gangrade, S.; Naz, B.S.; Touma, D. High-resolution ensemble projections of near-term regional climate over the continental United States. J. Geophys. Res. Atmos. 2016, 121, 9943–9963. [Google Scholar] [CrossRef]
  16. Lucas-Picher, P.; Laprise, R.; Winger, K. Evidence of added value in North American regional climate model hindcast simulations using ever-increasing horizontal resolutions. Clim. Dyn. 2016, 48, 2611–2633. [Google Scholar] [CrossRef]
  17. Leung, L.R.; Mearns, L.O.; Giorgi, F.; Wilby, R.L. Regional climate research: Needs and opportunities. Bull. Amer. Meteor. Soc. 2003, 84, 89–95. [Google Scholar] [CrossRef]
  18. Bukovsky, M.S.; Mearns, L.O. Regional climate change projections from NA-CORDEX and their relation to climate sensitivity. Clim. Change 2020, 162, 645–665. [Google Scholar] [CrossRef]
  19. Pierce, D.W.; Cayan, D.R.; Feldman, D.R.; Risser, M.D. Future Increases in North American Extreme Precipitation in CMIP6 Downscaled with LOCA. J. Hydrometeorol. 2003, 24, 951–975. [Google Scholar] [CrossRef]
  20. Thrasher, B.; Wang, W.; Michaelis, A.; Melton, F.; Lee, T.; Nemani, R. NASA Global Daily Downscaled Projections, CMIP6. Sci. Data 2022, 9, 262. [Google Scholar] [CrossRef]
  21. Karmalkar, A.V. Interpreting Results from the NARCCAP and NA-CORDEX Ensembles in the Context of Uncertainty in Regional Climate Change Projections. Bull. Am. Meteorol. Soc. 2018, 99, 2093–2106. [Google Scholar] [CrossRef]
  22. Fisel, B.J.; Erickson, N.E.; Young, C.R.; Ellingworth, A.L.; Gutowski, W.J., Jr. Evaluating Contemporary and Future-Scenario Substantial-Precipitation Events in the Missouri River Basin Using Object-Oriented Analysis. Climate 2023, 11, 112. [Google Scholar] [CrossRef]
  23. Mehta, V.M.; Knutson, C.L.; Rosenberg, N.J.; Olsen, J.R.; Wall, N.A.; Bernadt, T.K.; Hayes, M.J. Decadal Climate Information Needs of Stakeholders for Decision Support in Water and Agriculture Production Sectors: A Case Study in the Missouri River Basin. Weather. Clim. Soc. 2013, 5, 27–42. [Google Scholar] [CrossRef]
  24. Mearns, L.O.; McGinnis, S.; Korytina, D.; Arritt, R.; Biner, S.; Bukovsky, M.; Chang, H.-I.; Christensen, O.; Herzmann, D.; Jiao, Y.; et al. The NA-CORDEX Dataset, version 1.0; NCAR Climate Data Gateway: Boulder, CO, USA, 2017. [Google Scholar] [CrossRef]
  25. Meyer, J.D.D.; Wang, S.-Y.S.; Gillies, R.R.; Yoon, J.-H. Evaluating NA-CORDEX historical performance and future change of western U.S. precipitation patterns and modes of variability. Int. J. Climatol. 2021, 41, 4509–4532. [Google Scholar] [CrossRef]
  26. Chen, M.; Shi, W.; Xie, P.; Silva, V.B.; Kousky, V.E.; Wayne Higgins, R.; Janowiak, J.E. Assessing objective techniques for gauge-based analyses of global daily precipitation. J. Geophys. Res. 2008, 113, D04110. [Google Scholar] [CrossRef]
  27. Mallakpour, I.; Sadeghi, M.; Mosaffa, H.; Asanjan, A.A.; Sadegh, M.; Nguyen, P.; Sorooshian, S.; AghaKouchak, A. Discrepancies in changes in precipitation characteristics over the contiguous United States based on six daily gridded precipitation datasets. Weather. Clim. Extremes 2022, 36, 100433. [Google Scholar] [CrossRef]
  28. Rahmani, V.; Harrington, J. Assessment of climate change for extreme precipitation indices: A case study from the central United States. Int. J. Climatol. 2018, 39, 1013–1025. [Google Scholar] [CrossRef]
  29. Funk, C.; Peterson, P.; Landsfeld, M.; Pedreros, D.; Verdin, J.; Shukla, S.; Husak, G.; Rowland, J.; Harrison, L.; Hoell, A.; et al. The climate hazards infrared precipitation with stations—A new environmental record for monitoring extremes. Sci. Data 2015, 2, 150066. [Google Scholar] [CrossRef]
  30. Sillmann, J.; Kharin, V.V.; Zhang, X.; Zwiers, F.W.; Bronaugh, D. Climate extremes indices in the CMIP5 multimodel ensemble: Part 1. Model evaluation in the present climate. J. Geophys. Res. 2013, 118, 1716–1733. [Google Scholar] [CrossRef]
  31. Singh, D.; Tsiang, M.; Rajaratnam, B.; Diffenbaugh, N.S. Precipitation extremes over the continental United States in a transient, high-resolution, ensemble climate model experiment. J. Geophys. Res. Atmos. 2013, 118, 7063–7086. [Google Scholar] [CrossRef]
  32. Ngai, S.T.; Juneng, L.; Tangang, F.; Chung, J.X.; Supari, S.; Salimun, E.; Cruz, F.; Ngo-Duc, T.; Phan-Van, T.; Santisirisomboon, J.; et al. Projected mean and extreme precipitation based on bias-corrected simulation outputs of CORDEX Southeast Asia. Weather Clim. Extremes 2022, 37, 100484. [Google Scholar] [CrossRef]
  33. Akinsanola, A.A.; Ongoma, V.; Kooperman, G.J. Evaluation of CMIP6 models in simulating the statistics of extreme precipitation over Eastern Africa. Atmos. Res. 2021, 254, 105509. [Google Scholar] [CrossRef]
  34. Gbode, I.E.; Babalola, T.E.; Diro, G.T.; Intsiful, J.D. Assessment of ERA5 and ERA-Interim in reproducing mean and extreme climates over West Africa. Adv. Atmos. Sci. 2023, 40, 570–586. [Google Scholar] [CrossRef]
  35. Taylor, K.E. Summarizing multiple aspects of model performance in a single diagram. J. Geophys. Res. Atmos. 2021, 106, 7183–7192. [Google Scholar] [CrossRef]
  36. Houghton, J.; Ding, Y.; Griggs, D.J.; Noguer, M.; van der Linden, P.J.; Xiaosu, D. Climate Change 2001: The Scientific Basis; Contribution of Working Group I to the 3rd Assessment Report of the Intergovernmental Panel on Climate Change; Cambridge University Press: Cambridge, UK, 2001. [Google Scholar]
  37. Nazarian, R.H.; Vizzard, J.V.; Agostino, C.P.; Lutsko, N.J. Projected Changes in Future Extreme Precipitation over the Northeast United States in the Na-Cordex Ensemble. J. Appl. Meteorol. Clim. 2022, 61, 1649–1668. [Google Scholar] [CrossRef]
  38. Bukovsky, M.S.; Gochis, D.J.; Mearns, L.O. Towards assessing NARCCAP regional climate model credibility for the North American monsoon: Current climate simulations. J. Clim. 2013, 26, 8802–8826. [Google Scholar] [CrossRef]
  39. Meyer, J.D.D.; Jin, J. Bias correction of the CCSM4 for improved regional climate modeling of the North American monsoon. Clim. Dyn. 2016, 46, 2961–2976. [Google Scholar] [CrossRef]
  40. Grady, K.A.; Chen, L.; Ford, T.W. Projected Changes to Spring and Summer Precipitation in the Midwestern United States. Front. Water 2021, 3, 780333. [Google Scholar] [CrossRef]
  41. Dollan, I.J.; Maggioni, V.; Johnston, J.; Coelho, G.d.A.; Kinter, J.L., III. Seasonal variability of future extreme precipitation and associated trends across the Contiguous U.S. Front. Clim. 2022, 4, 954892. [Google Scholar] [CrossRef]
  42. Giorgi, F.; Raffaele, F.; Coppola, E. The response of precipitation characteristics to global warming from climate projections. Earth Syst. Dyn. 2019, 10, 73–89. [Google Scholar] [CrossRef]
  43. Zhang, H.; Delworth, T.L. Robustness of anthropogenically forced decadal precipitation changes projected for the twenty-first century. Nat. Commun. 2018, 9, 1150. [Google Scholar] [CrossRef]
  44. Deser, C.; Phillips, A.; Bourdette, V.; Teng, H. Uncertainty in climate change projections: The role of internal variability. Clim. Dyn. 2012, 38, 527–546. [Google Scholar] [CrossRef]
  45. Pendergrass, A.G.; Gerber, E.P. The rain is askew: Two idealized models relating vertical velocity and precipitation distributions in a warming world. J. Climate 2016, 29, 6445–6462. [Google Scholar] [CrossRef]
  46. Wrzesien, M.L.; Pavelsky, T.M. Projected Changes to Extreme Runoff and Precipitation Events from a Downscaled Simulation Over the Western United States. Front. Earth Sci. 2020, 7, 355. [Google Scholar] [CrossRef]
  47. Flanagan, P.X.; Basara, J.B.; Xiao, X. Long-term analysis of the asynchronicity between temperature and precipitation maxima in the United States Great Plains. Int. J. Climatol. 2017, 37, 3919–3933. [Google Scholar] [CrossRef]
  48. Pokorný, J.; Rejšková, A. Water Cycle Management. In Elsevier eBooks; Elsevier: Amsterdam, The Netherlands, 2008; pp. 3729–3737. [Google Scholar] [CrossRef]
  49. Ford, C.M.; Kendall, A.D.; Hyndman, D.W. Effects of shifting snowmelt regimes on the hydrology of non-alpine temperate landscapes. J. Hydrol. 2020, 590, 125517. [Google Scholar] [CrossRef]
  50. NWS (National Weather Service) Report on Mississippi River Flood History 1543–Present. 2019. Available online: https://www.weather.gov/lix/ms_flood_history (accessed on 3 August 2024).
  51. Byrne, M.P.; O’Gorman, P.A. The response of precipitation minus evapotranspiration to climate warming: Why the “Wet-Get-Wetter, Dry-Get-Drier” scaling does not hold over land. J. Clim. 2015, 28, 8078–8092. [Google Scholar] [CrossRef]
  52. EPA (United States Environmental Protection Agency). What Climate Change Means for Missouri. 2016. Available online: https://19january2017snapshot.epa.gov/sites/production/files/2016-09/documents/climate-change-mo.pdf (accessed on 28 July 2024).
  53. Wuebbles, D.; Angel, J.; Petersen, K.; Lemke, A.M. An Assessment of the Impacts of Climate Change in Illinois; The Nature Conservancy: Chicago, IL, USA, 2021. [Google Scholar] [CrossRef]
  54. Eyring, V.; Bony, S.; Meehl, G.A.; Senior, C.A.; Stevens, B.; Stouffer, R.J.; Taylor, K.E. Overview of the couple model intercomparison project phase 6 (CMIP6) experimental design and organization. Geosci. Model Dev. 2016, 9, 1937–1958. [Google Scholar] [CrossRef]
Figure 1. The geographic location of the MRB, which is delineated with a thick red line. Color shading indicates elevation (in meters).
Atmosphere 16 00579 g001
Figure 2. Climatological monthly precipitation (mm) over the MRB in 1951–2005 based on the observed data (CPCU), individual CORDEX models, and the ensemble mean of all the models (ENSEMBLE). ENSEMBLE and CPCU are thick red and black lines with markers, respectively.
Atmosphere 16 00579 g002
Figure 3. (a) Spatial mean distribution of rx5day, cdd, cwd, r10mm, and r20mm for each RCM ensemble and ENSEMBLE and (b) the biases (models minus observations) for the period 1951–2005 during the summer.
Atmosphere 16 00579 g003
Figure 4. (a) Spatial mean distribution of rx5day, cdd, cwd, r10mm, and r20mm for each RCM ensemble and ENSEMBLE and (b) the biases (model minus CPCU) for the period 1951–2005 during the winter.
Atmosphere 16 00579 g004
Figure 5. Taylor diagrams for individual CORDEX models, the RCM ensembles, and ENSEMBLE compared to CPCU-based extreme precipitation indices ((a) rx5day, (b) cdd, (c) cwd, (d) r10mm, and (e) r20mm) over the MRB.
Atmosphere 16 00579 g005
Figure 6. Projected changes in summer season precipitation extremes over the period 2050–2099 under the RCP 8.5 scenario relative to the reference period 1951–2005 for rx5day (mm), cdd (days), cwd (days), r10mm (days), and r20mm (days) using the 5 best ensemble members. Filled patterns show the difference between projections and historical reference periods. Stippling shows areas with statistically significant differences at the 95% level.
Atmosphere 16 00579 g006
Figure 7. Projected changes in winter season precipitation extremes over the period 2050–2099 under the RCP 8.5 scenario relative to the reference period 1951–2005 for rx5day (mm), cdd (days), cwd (days), r10mm (days) and r20mm (days) using the 5 best RCM ensemble members. Filled patterns show the difference between projections and historical reference periods. Stippling shows areas with statistically significant differences at the 95% level.
Atmosphere 16 00579 g007
Table 1. The 16 GCM-RCM combinations from NA-CORDEX used in this study.
GCMsRCMs
1HadGEM2-ESWRF
2GFDL-ESM2M
3MPI-ESM-LR
4MPI-ESM-MRCRCM5-UQAM
5CanESM2
6GEMatm-MPI
7GEMatm-Can
8MPI-ESM-LR
9CNRM-CM5CRCM5-OUR
10CanESM2
11GFDL-ESM2M
12MPI-ESM-LR
13CanESM2CanRCM4
14MPI-ESM-LRRegCM4
15HadGEM2-ES
16GFDL-ESM2M
Table 2. List of the precipitation extreme indices used in this study.
Short Name of Extreme Indices Name of Extreme Indices Definition of Indices Units
rx5day Max. 5-day precipitation Maximum 5-day precipitation total, i.e., maximum amount of rain that falls in five consecutive days mm
cdd Consecutive dry days Counting the maximum number of consecutive dry days when precipitation is less than 1 mm, i.e., the longest dry spell. days
cwd Consecutive wet days The highest number of consecutive days when precipitation is greater than or equal to 1 mm, i.e., the longest wet spell. days
r10mm Heavy precipitation days Counting the total number of days with precipitation ≥ 10 mm days
r20mm Very heavy precipitation days Counting the total number of days with precipitation ≥ 20 mm days
Table 3. Five best-performing models for each extreme precipitation index in MRB.
Summer Winter
rx5day MPI-ESM-LR.CRCM5-OUR,
MPI-ESM-LR.CRCM5-UQAM,
MPI-ESM-LR.RegCM4,
GFDL-ESM2M.CRCM5-OUR,
HadGEM2-ES.RegCM4
HadGEM2-ES.WRF, CNRM-CM5.CRCM5-OUR, MPI-ESM-LR.CRCM5-UQAM, GFDL-ESM2M.WRF, GEMatm-MPI.CRCM5-UQAM
cdd CNRM-CM5.CRCM5-OUR,
GFDL-ESM2M.CRCM5-OUR,
MPI-ESM-LR.CRCM5-OUR,
MPI-ESM-LR.WRF,
MPI-ESM-LR.CRCM5-UQAM.
GEMatm-MPI.CRCM5-UQAM,
MPI-ESM-LR.CRCM5-OUR,
MPI-ESM-LR.WRF,
CanESM2.CRCM5-UQAM,
GFDL-ESM2M.CRCM5-OUR.
cwd GEMatm-Can.CRCM5-UQAM,
GFDL-ESM2M.RegCM4,
GEMatm-MPI.CRCM5-UQAM,
MPI-ESM-LR.CRCM5-UQAM,
MPI-ESM-LR.CRCM5-OUR
CNRM-CM5.CRCM5-OUR,
MPI-ESM-LR.CRCM5-UQAM,
MPI-ESM-LR.CRCM5-OUR,
MPI-ESM-MR.CRCM5-UQAM,
HadGEM2-ES.WRF.
r10mm MPI-ESM-LR.CRCM5-OUR,
CNRM-CM5.CRCM5-OUR,
MPI-ESM-MR.CRCM5-UQAM,
MPI-ESM-LR.CRCM5-UQAM,
GFDL-ESM2M.CRCM5-OUR
CNRM-CM5.CRCM5-OUR,
GFDL-ESM2M.WRF,
HadGEM2-ES.WRF,
CanESM2.CRCM5-OUR,
CanESM2.CanRCM4
r20mm MPI-ESM-LR.CRCM5-OUR,
MPI-ESM-LR.CRCM5-UQAM,
MPI-ESM-MR.CRCM5-UQAM,
MPI-ESM-LR.CRCM5-UQAM,
GFDL-ESM2M.CRCM5-OUR
GFDL-ESM2M.WRF,
CNRM-CM5.CRCM5-OUR,
HadGEM2-ES.WRF, GFDL-ESM2M.RegCM4, GFDL-ESM2M.CRCM5-OUR
Disclaimer/Publisher’s Note: The statements, opinions and data contained in all publications are solely those of the individual author(s) and contributor(s) and not of MDPI and/or the editor(s). MDPI and/or the editor(s) disclaim responsibility for any injury to people or property resulting from any ideas, methods, instructions or products referred to in the content.

