Article

Number Concentration, Size Distribution, and Lung-Deposited Surface Area of Airborne Particles in Three Urban Areas of Colombia

by
Fabian L. Moreno Camacho
1,*,
Daniela Bustos Quevedo
1,
David Archila-Peña
1,
Jorge E. Pachón
2,
Néstor Y. Rojas
1,
Lady Mateus-Fontecha
1 and
Karen Blanco
1
1
Department of Chemical and Environmental Engineering, Universidad Nacional de Colombia, Bogotá 111321, Colombia
2
Environmental and Sanitary Engineering Program, Universidad de La Salle, Bogotá 111711, Colombia
*
Author to whom correspondence should be addressed.
Atmosphere 2025, 16(5), 558; https://doi.org/10.3390/atmos16050558
Submission received: 20 March 2025 / Revised: 29 April 2025 / Accepted: 5 May 2025 / Published: 7 May 2025
(This article belongs to the Special Issue Air Quality in Metropolitan Areas and Megacities (Second Edition))

Abstract

:
Airborne particulate matter is a major pollutant globally due to its impact on atmospheric processes and human health. Depending on their aerodynamic size, particles can penetrate the respiratory system, with ultrafine particles (UFPs) reaching the bloodstream and affecting vital organs. This study investigates the particle number size distribution (PNSD), particle number concentration (PNC), and lung-deposited surface area (LDSA) in Bogotá, Cali, and Palmira, Colombia. Measurements were conducted at four sites representing different urban and industrial backgrounds using an Electrical Low-Pressure Impactor (ELPI+). Due to the availability and operation of the device, observations were limited to a few days, so the results of this study are indicative and not generalized for the cities. UFP concentrations were highest in Cali (28,399 cm−3), three times higher than in San Cristóbal, Bogotá. Fine particles (FPs) exhibited similar patterns across the three cities, with higher concentrations in San Cristóbal (2421 cm−3). Coarse particles (CPs) were most prevalent in Palmira (41.37 cm−3), and the highest LDSA values were recorded in Palmira and Cali (>80 µm2/cm3), indicating a higher potential for respiratory deposition. These findings highlight the importance of PNSD in health risk assessment in urban areas, providing valuable insights for future studies and strategies to manage air quality in Colombia.

1. Introduction

Airborne particles, known as particulate matter (PM) or atmospheric aerosol, are among the most relevant pollutants worldwide [1]. Their presence and dispersion in the environment are associated with multiple risks, both for vegetation and atmospheric processes, as well as for human health. In vegetation, PM can affect morphological attributes such as growth, reproduction, and leaf size [2]. In the atmosphere, PM is susceptible to chemical reactions that contribute to new particle formation and growth, cloud formation, and precipitation [3,4]. Additionally, depending on their composition and size, PM can have a warming or cooling effect on the atmosphere. For example, black carbon (BC) contributes to global warming by converting solar radiation into heat [5], while sulfates, a secondary component of PM, partially block sunlight, generating atmospheric cooling.
Particulate matter represents a public health risk, especially for vulnerable populations such as the elderly, pregnant women, and children [6], and can lead to cardiovascular and cerebrovascular diseases [7,8]. Depending on their aerodynamic size, particles have different entry routes and effects on the respiratory system. Coarse particles (CPs, 2.5 to 10 µm) tend to deposit in the tracheobronchial region, while fine particles (FPs, 0.1 to 2.5 µm) can reach the alveolar system, and ultrafine particles (UFPs, <0.1 µm) have the potential to enter the bloodstream and affect vital organs [9,10,11]. Given that these effects vary depending on particle size and specific characteristics, understanding their size distribution in different environments—as well as the influence of meteorological variables such as wind speed and direction, relative humidity, temperature, atmospheric pressure, and local geographic and environmental characteristics—is crucial.
The particle number size distribution (PNSD) has been studied in various environments, including urban and rural areas, polar regions, traffic and industrial settings, and indoor spaces, especially in developed countries, using instruments such as the Scanning Mobility Particle Sizer (SMPS, TSI Inc., Shoreview, MN, USA), and the Electrical Low-Pressure Impactor (ELPI+, Dekati Ltd., Kangasala, Finland), among others. In Madrid, Gómez et al. [12] found that particles smaller than 80 nm predominated in urban areas, with higher concentrations in winter due to emissions from heating devices. De Marco et al. [13] measured particles of 20–50 nm in rural areas and of 0.4–0.5 µm in urban areas in Italy, highlighting vehicular emissions and biomass combustion as primary sources. Kalaiarasan et al. [14] observed that nucleation-mode particles (6–30 nm) dominated indoor environments, urban areas, and traffic zones in London. The highest concentrations were observed near traffic, with a clear correlation between wind speed and particle size. Additionally, they identified that nucleation-mode particles contribute more significantly to the respiratory deposition dose (RDD), underscoring their relevance to human health. In a long-term study across 21 sites in Europe, Leinonen et al. [15] found that particle size and concentration distributions varied according to environmental and meteorological conditions, and they classified the fitted modes into three categories—nucleation (<20 nm), Aitken (20–100 nm), and accumulation (>100 nm)—based on their geometric mean diameters.
In South America, PM concentrations have focused on mass fraction measurements (PM10 and/or PM2.5) but not on the size and number distribution of airborne particles. Particle size distribution (PSD) studies have been sparse and conducted only in Chile [16] and two Brazilian cities: Canoas [17] and Porto Alegre [18]. In Santiago, the authors used an aerosol spectrometer (GRIMM Aerosol Technik, DURAG Group, Hamburg, Germany) to analyze particle distribution between June 2018 and May 2019. The results indicated that particles with diameters less than 1 µm represented 99 percent of the total number of respirable particles. Additionally, the authors observed that low temperatures (<10 °C) and high humidity (>80%) increased the proportion of particles in the accumulation mode, suggesting a strong meteorological influence on PSD. In Canoas, three PSD modes were identified: nucleation, Aitken, and accumulation, with 33.6% directly associated with vehicular traffic. Environmental conditions affected seasonal concentration variations, while daily peaks coincided with peak traffic hours. The observed bimodal distribution suggests that both local sources and climatic conditions play a key role in particle dynamics [17]. In Porto Alegre, the three main PSD modes were also identified. However, nucleation- and Aitken-mode particles constituted more than 86% of the particles present in the air, with a prevalence of smaller particles near local sources such as vehicle exhaust [18].
The lung-deposited particle surface area (LDSA) metric, which focuses on particles with the highest alveolar deposition in the size range 10 nm to ~400 nm, has been used to assess potential respiratory impacts [19,20,21,22,23,24]. For instance, Liu et al. [21] reported that 50% of LDSA deposits are in the alveolar region, 34% in the tracheobronchial region, and 16% in the head and throat. Additionally, the authors observed LDSA values range from 20 to 85 μm2/cm3, with higher levels in traffic-dense areas. This metric enables a more direct assessment of health risks, as particle deposition is linked to lung inflammation and chronic respiratory diseases (COPD) such as asthma [8,25,26,27]. UFPs also contribute to oxidative stress and epithelial damage due to their high surface area and reactive composition [28]. Furthermore, UFPs can cross the alveolar–capillary barrier and enter systemic circulation, where they may trigger systemic inflammation linked to cardiovascular effects such as increased blood pressure [28], higher risk of myocardial infarction and arrhythmias [29], and activation of inflammatory and coagulation markers, particularly affecting vulnerable populations [30]. Additionally, their presence in the brain has been associated with neuroinflammation and potential links to neurodegenerative diseases like Alzheimer’s and Parkinson’s [28,31,32]. The cytotoxic and toxic effects of particulate matter on human lung cells have been widely demonstrated in several studies. Faruqui et al. [33], Yan et al. [34], and Moreno-Ríos et al. [32] explored the toxic effects of particulate matter on human lung cells. Faruqui et al. [33] found that exposure to traffic-related particles, particularly soot at 100 µg/mL, caused the greatest cytotoxicity and oxidative stress in alveolar epithelial cells. Similarly, Yan et al. [34] observed that acute exposure (4 h) to PM2.5 from residential, industrial, and vehicular sources led to oxidative stress, apoptosis, inflammatory damage, and DNA injury in alveolar cells, with vehicular emissions being the most toxic. Complementing these findings, Moreno-Ríos et al. [32] reviewed the literature, showing that ultrafine particle components (ions, metals, and organics) trigger oxidative stress, leading to inflammation, genotoxicity, mutagenicity, and potential neurotoxicity through organ accumulation. These findings reinforce the importance of LDSA as a key indicator for evaluating the impacts of particles on human health.
This study estimates, for the first time, PNSD, PNC, and LDSA in three cities in Colombia: Bogotá, Cali, and Palmira. Due to the availability and operation of the sampling device, observations were limited to a few days, especially in Cali, so the results of this study are indicative and not generalized to the cities. Nevertheless, this approach provides insights into a preliminary understanding of aerosol dynamics in urban and suburban areas in Colombia and contributes to understanding the potential health implications of PM exposure. We also emphasize that these results can raise the awareness of society and government, leading to new research studies and highlighting the need for continuously monitoring of PM number in addition to mass.

2. Materials and Methods

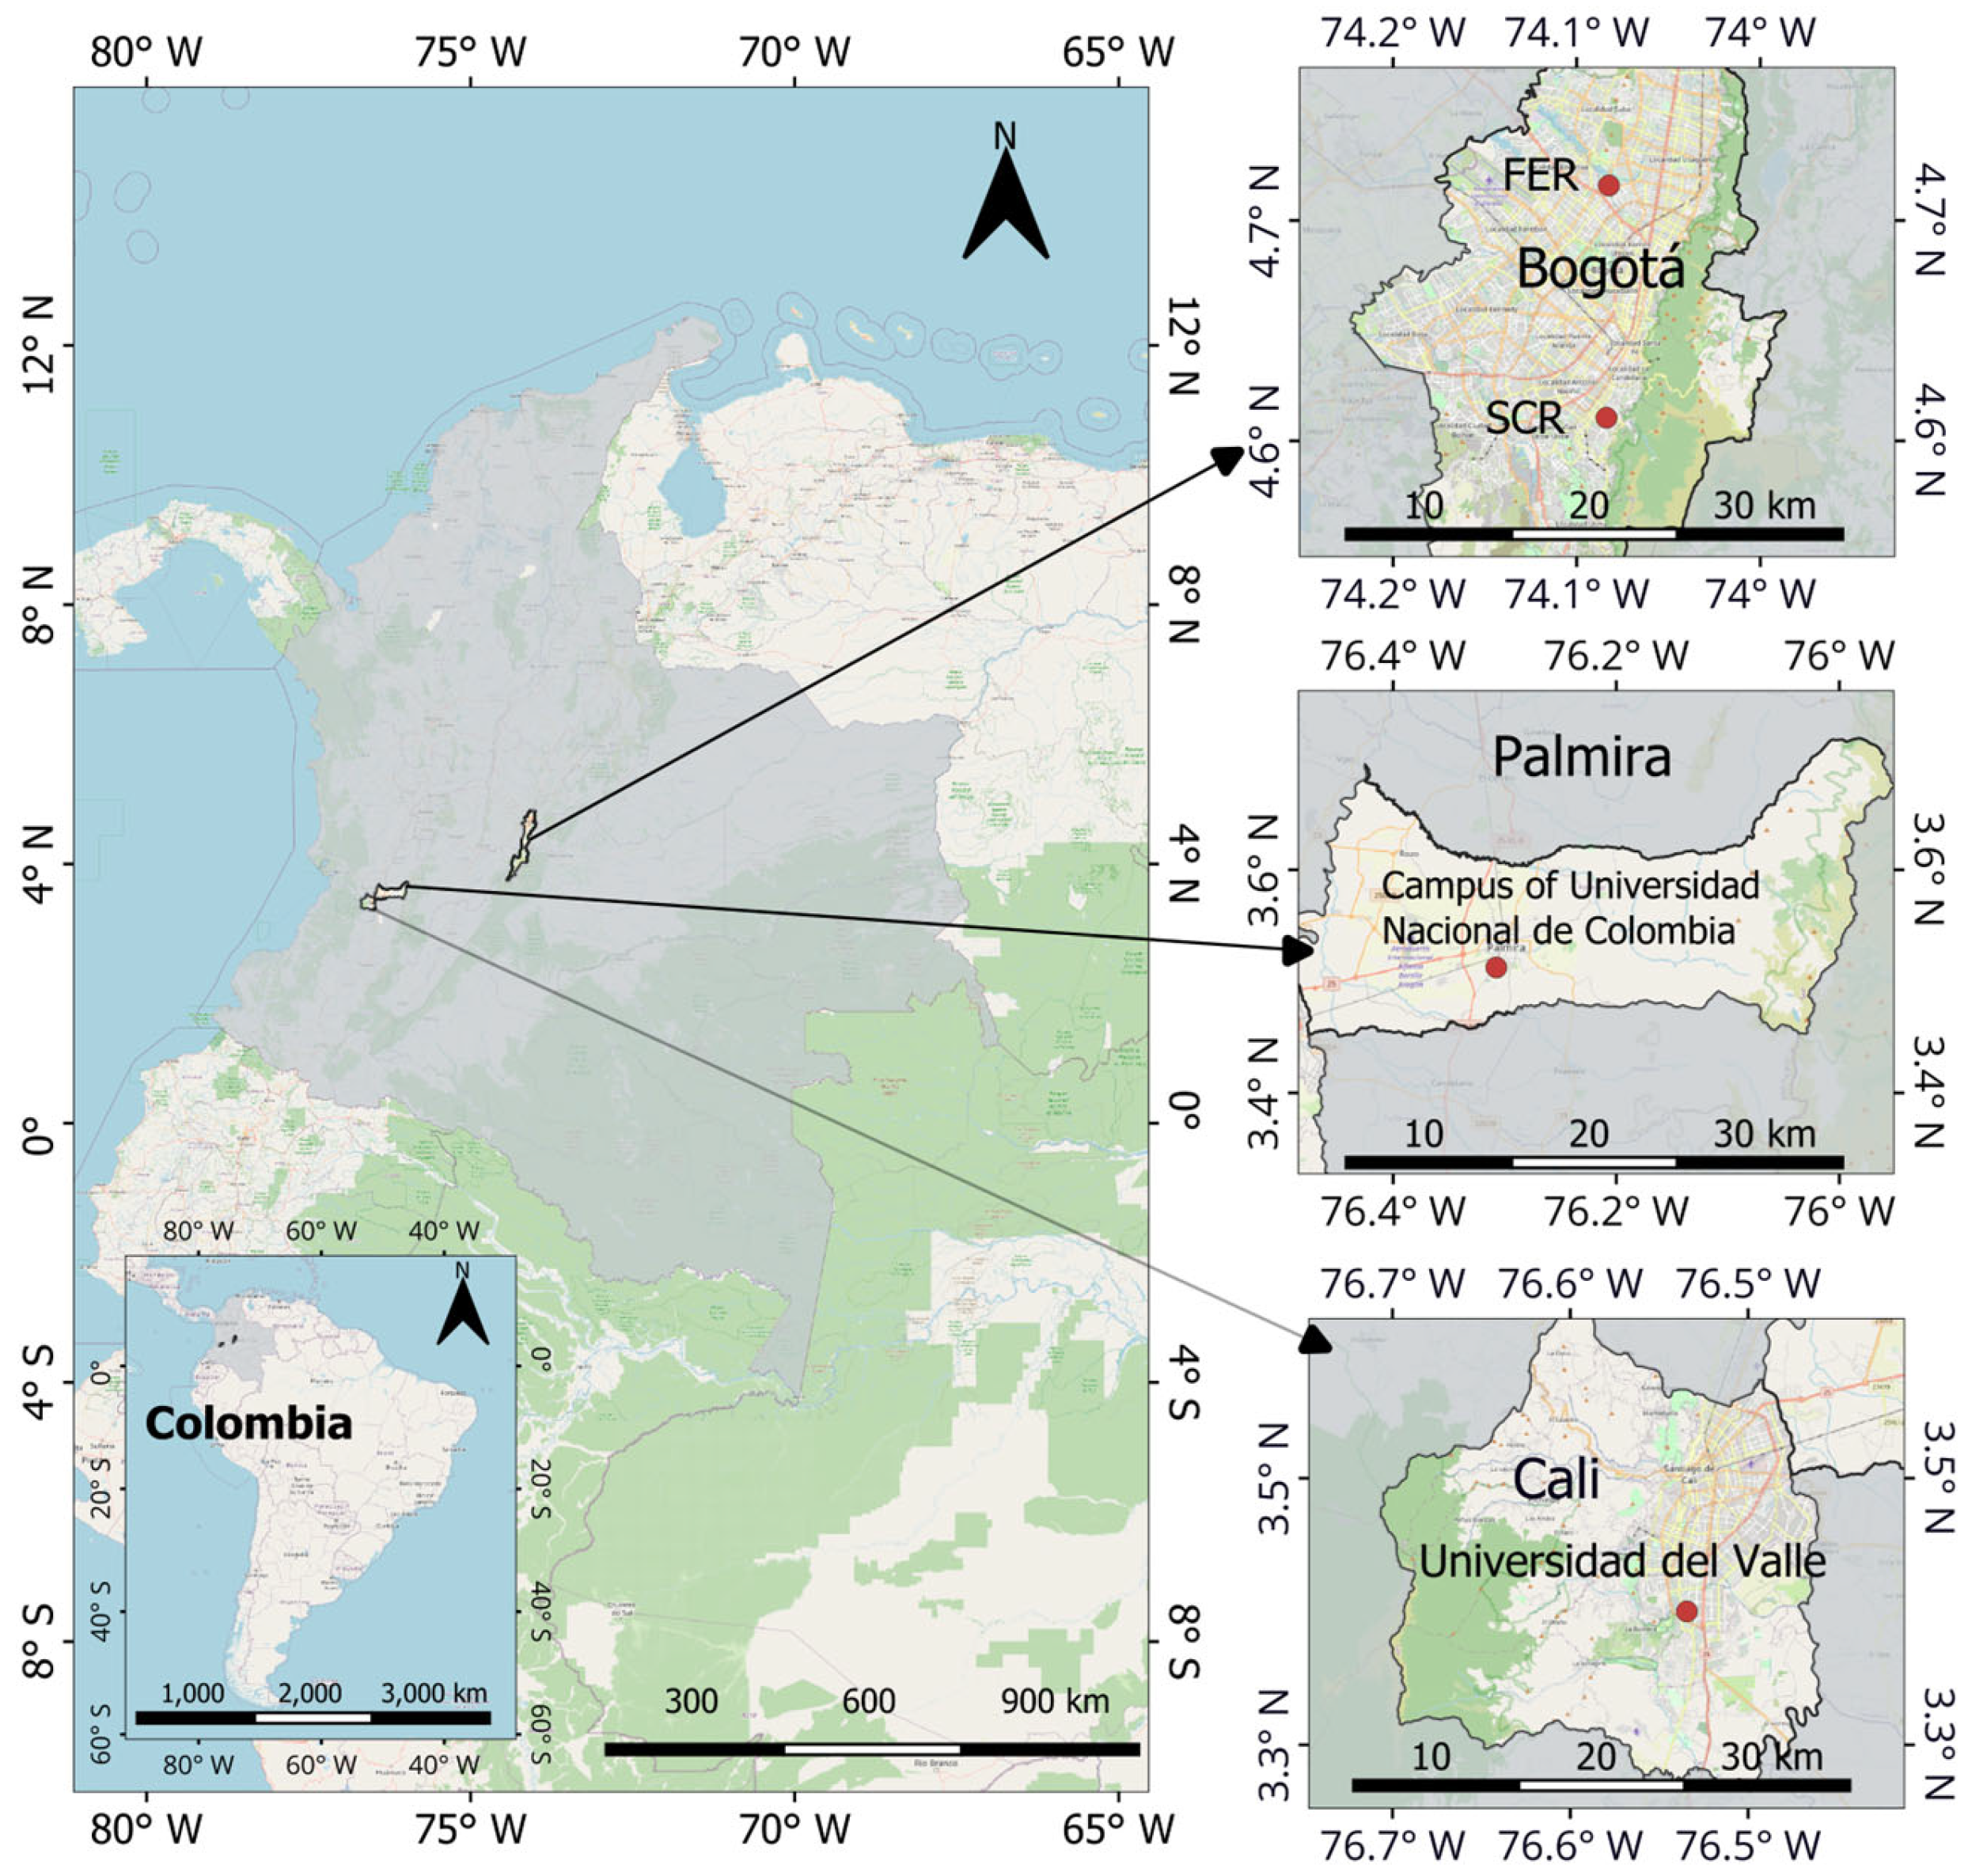
2.1. Measurement Sites

The study of PNC and PNSD was conducted in three Colombian cities: Bogotá, Cali, and Palmira (Figure 1). These cities were strategically selected due to their geographic, demographic, and environmental characteristics, making them key points for evaluating air quality in the national context. Additionally, due to the diversity of emission sources, Cali and Palmira are particularly affected by agro-industry emissions, along with traditional sources such as traffic, while Bogotá is mainly influenced by traffic emissions. PM2.5 concentration data were collected from the air quality monitoring networks.
In Bogotá, measurements were taken at two points of the Air Quality Network: Las Ferias (Lat: 4.690700°; Long: −74.082483°) and San Cristóbal (Lat: 4.572553°; Long: −74.083814°). In both campaigns, the sampler inlet was positioned 4.6 m above ground level. Las Ferias (FER) is an urban traffic station located in the geographic center of the city. San Cristóbal (SCR) is a background station located in a park in the southeastern part of the city, surrounded by vegetation and a secondary traffic route. In Palmira, the campaign was conducted at the National University of Colombia campus in an administrative building at an altitude of approximately 27 m (Lat: 3.512294°, Long: −76.307611°), a suburban area in the Cauca River valley, southwest of the country, located 27 km northeast of Cali. This monitoring point is influenced by various air pollution sources, including agro-industry and vehicle emissions. In Cali, measurements were carried out at the Universidad del Valle, Meléndez campus (Lat: 3.375000°; Long: −76.534444°), specifically on the rooftop of the CibioFi building, approximately 25 m above ground level. The campus is located in the south-central part of the city, surrounded by major and busy roads connecting the north and south of Cali. It is important to clarify that the different heights used in this study were determined primarily by logistical and security constraints specific to each monitoring site.
Table 1 presents some characteristics of each site and monitoring period for each campaign. The difference in monitoring periods between 2017 and 2023 is due to the availability of the ELPI+ equipment and funding opportunities. On numerous occasions, during sampling, the ELPI+ was out of operation due to vacuum pump failure. Furthermore, the time elapsed between the Palmira and Cali campaigns was partly a consequence of the COVID-19 pandemic, which spanned from 2020 to 2022.
In Bogotá, the Ferias (FER) station (Urban Traffic) [35] and the San Cristóbal (SCR) [36] station (Urban Background) recorded average PM2.5 concentrations of approximately 13 µg m−3 during the study period of each site. In Palmira (PAL), classified as Urban–Industrial, the average concentration was around 20 µg m−3 [37]. In Cali (CAL), an Urban Background site, PM2.5 concentrations reached 14 µg m−3 [38]. PM2.5 concentrations were taken from the air quality monitoring network in each city.

2.2. Measurement and Instrumentation

PNC and PSD were determined using an ELPI+ device [39]. The ELPI+ instrument is based on a unipolar particle charger, a cascade impactor with 15 stages—14 stages that classify particle size and an additional filter stage—and electrometers to measure the collected particles on each stage [40].
The aerosol passes through a unipolar diffusion chamber based on a needle-type corona discharge. The discharge generates a positive voltage (3.5 kV) and a constant current of 1 μA to achieve stable charging conditions for the aerosol particles passing through it. In the next stage, the remaining ions from the corona discharge are removed from the flow using an ion trap. In the ion trap, particles pass through two concentric cones with a potential difference of 20 V, resulting in an electric field that removes ions from the flow [40].
The cascade impactor classifies and captures particles according to their aerodynamic diameter, from 0.006 to 0.054 µm (ultrafine particles, UFPs, Stages 1–4), 0.09 to 2.5 µm (fine particles, FPs, Stages 5–12), and 2.5 to 10 µm (coarse particles, CPs, Stages 13–14) [41]. Stage 14 has a cutoff diameter of 10 µm (pre-separator for coarse particles), while the subsequent stages have progressively smaller cutoff diameters (for fine and ultrafine particles), reaching 17 nm in Stage 2 [42]. Järvinen et al. [40] present the collection efficiencies of the cascade impactor stages of the ELPI+, as well as the charging efficiency of the corona charger in the size range of 0.01 to 10 µm.
The 13 impactor stages and the filter stage are separated by electrical insulators and connected to a multichannel electrometer. The unipolar charged particles deposited on the impactor stages are detected by measuring the electrical current of each stage. The final stage is the filter that collects particles small enough to evade collection by impact in the preceding stages. The downstream pressure is measured and can be adjusted to the manufacturer-specified value of 40 mbar using a control valve located between the filter stage and the external vacuum connection. For the analysis, the factory-provided impactor properties for the ELPI+ were used as initial values, including a flow rate of 10 L/min, a density of 1 g/cm3, and a dilution factor of 1 [40]. Additionally, the equipment is equipped with a vacuum pump that facilitates the aspiration of the sampled air, allowing it to flow through the instrument.
Once the charge detected by the ELPI+ electrometer is obtained for each stage, it is multiplied by the conversion vectors presented in Table 2. The result allows for the calculation of the number, diameter, area, volume, and mass of particles in each ELPI+ stage.
At the beginning of the campaigns in Bogotá, the ELPI+ device was compared against a reference Scanning Mobility Particle Sizer (SMPS) to assess measurement uncertainty. The comparison indicated that the ELPI+ tends to overestimate particle number concentrations (PNCs) when Stage 1 is included, while better agreement was observed when excluding it. Specifically, the relative root mean square error (rms) between the PNC measured by the ELPI+ (excluding Stage 1) and the SMPS was 414.3 cm−3 [43].
Meteorological data for Bogotá were obtained from the official Bogotá air quality monitoring network, which systematically records atmospheric variables relevant to air quality and meteorological assessments. For the municipality of Palmira, meteorological measurements were sourced from the Universidad Nacional de Colombia, specifically from a monitoring site established and operated by the institution, where data collection began approximately one year prior to the start of the study period. In the case of Cali, meteorological data were provided by the Sistema de Vigilancia de la Calidad del Aire de Cali, managed by the Departamento Administrativo de Gestión del Medio Ambiente (DAGMA). Since these data are not publicly available, a formal request was submitted. In response, the data corresponding to a single monitoring station, operated by the Universidad del Valle (Univalle), were made available and subsequently used for the analysis.
The data were processed in hourly averages according to the monitoring periods of each campaign for subsequent correlation analysis.

2.3. Calculation of the Deposited Fraction in the Respiratory Tract

The LDSA concentration was determined based on the measured deposition efficiency for the tracheobronchial, alveolar, and head airways regions of the respiratory system. However, in this study, LDSA was specifically calculated for the alveolar region, while deposition efficiencies for the other regions of the respiratory system are presented in the Supplementary Information (Figure S1). For this purpose, we used Equation (1), recommended by Mateus-Fontecha [43], who adopted the alveolar deposition efficiency as a function of particle size, based on the dosimetric model of the International Commission on Radiological Protection—ICRP [44]. The calculation of LDSA requires the measurement of the entire PNSD followed by a summation of the surface area (S) of particles in each size stage, weighted by the lung deposition efficiency (η).
LDSA = S × η
In this study, the alveolar deposition efficiency was determined by interpolation, using the geometric mean cutoff diameter of each ELPI+ stage (Table 2). This interpolation was based on the lung deposition function for the alveolar–interstitial region, described by the ICRP [44].
The surface area assumes that particles are spherical and can therefore be estimated using Equation (2), where the surface area of each stage (Sn) is equal to the number of particles (N) multiplied by the geometric mean (Dia) of each stage (n) of the ELPI+. The hourly variability of the particle surface area was calculated using Equation (3), which indicates the sum of the surface area (St) from Stages 2 to 14 of the ELPI+.
S n = [ N D i a 2 π ] n μ m 2 / c m 3
S t = [ N D i a 2 π ] n = n = 2 n = 14   ( S ) h o u r l y μ m 2 / c m 3
Additionally, the normal distribution of the data was calculated with the Shapiro–Wilk test to indicate whether the distribution of the data was nonparametric [45]. Also, the Spearman correlation coefficient was selected, according to the data distribution, to assess the relationship between meteorological parameters and PNCs.

3. Results

This section presents the descriptive results for PNC and PSD for the three cities (Bogotá, Palmira, and Cali), along with the influence of meteorological parameters. It is important to note that the results are indicative and not generalized for the cities due to the low number of observations, and they are not comparable given the different monitoring periods between cities.

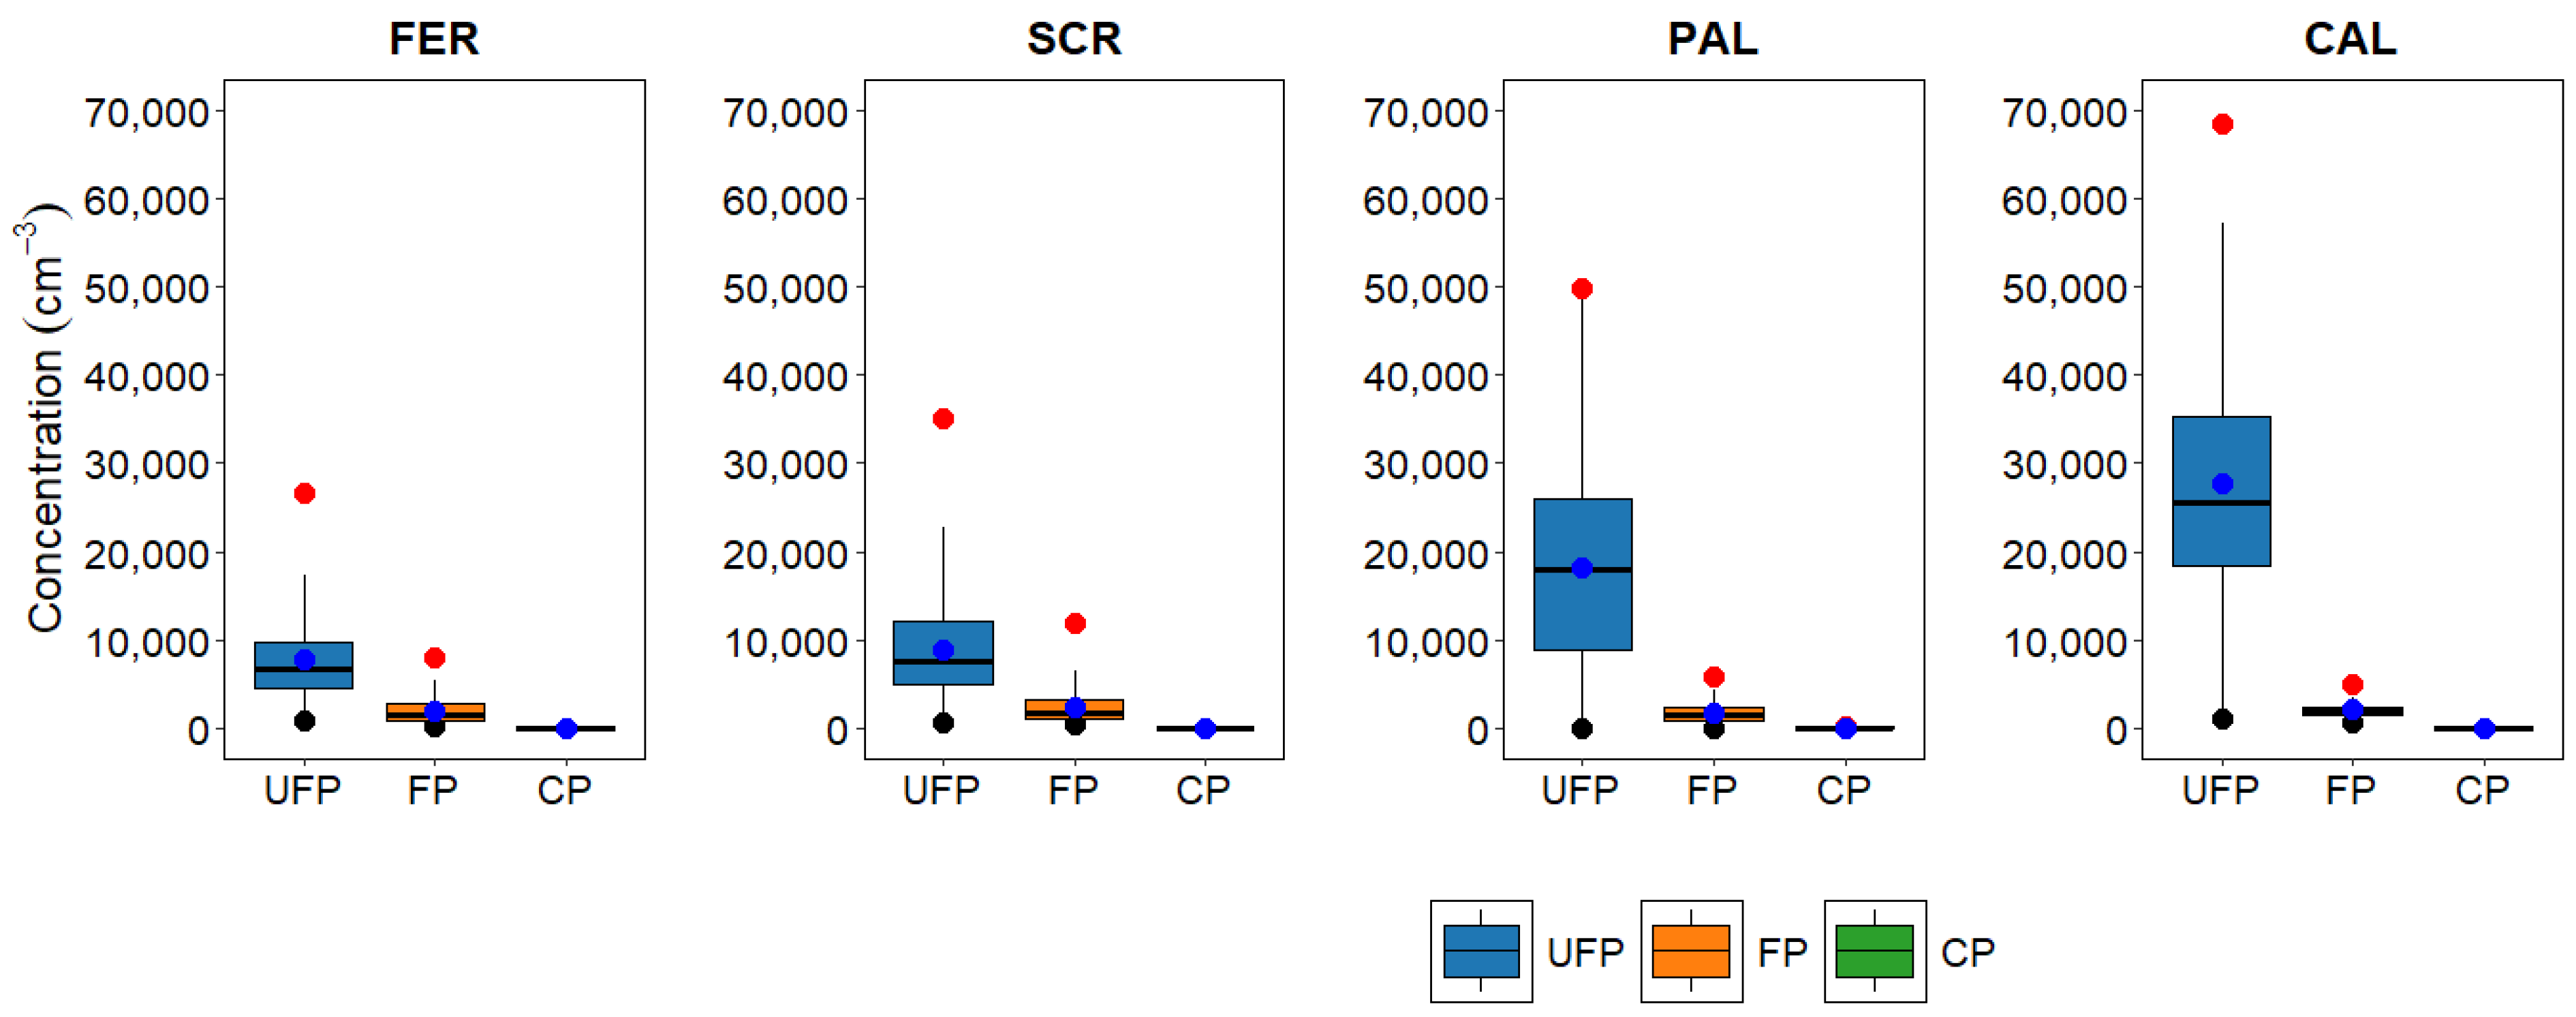
3.1. Particle Number Concentrations (PNCs)

Figure 2 presents the descriptive statistics of three particle classifications in the four sites: UFPs, FPs, and CPs. In general, San Cristóbal, Palmira, and Cali recorded higher average concentrations of UFPs, with Cali being around three times higher (28,399 cm−3) than San Cristóbal (8901 cm−3) and higher than Palmira (18,180 cm−3). Las Ferias had the lowest UFP values (7845 cm−3). The largest concentrations of UFPs at the Cali sampling point, an urban background site, might be due to the immediate surroundings including major avenues, parking lots, and industrial activities.
The FP concentrations exhibit moderate variability among the four monitoring zones, ranging from 1678 cm−3 in Palmira to 2421 cm−3 in San Cristóbal. Despite these differences, the relatively narrow range suggests that common emission sources, such as mobile and stationary activities, may contribute significantly to FP levels. FPs are primarily formed by the growth of UFPs through heterogeneous condensation, as well as through agglomeration and coagulation processes. On the other hand, CPs show relatively constant and low concentrations in all sites, suggesting that their primary source could be dust resuspension. The sampling site in Palmira records the highest concentrations, 40 times higher than the average values reported in Bogotá and Cali. Palmira is recognized as a major agricultural hub of Colombia [46], and 72% of its land is used for agriculture [47]. The farming of sugarcane stands out, which requires constant burning of residual material. Both ash and resuspended dust associated with farming and biomass burning activities could explain the high values of coarse particles in this municipality.
Figure 3 shows the diel cycle of UFPs at the four monitoring sites. In Las Ferias, San Cristóbal, and Cali, the influence of traffic is visible in the morning peak of UFPs, but in Cali, the PNC (51,836 cm−3) is much higher than that in Las Ferias (12,997 cm−3) and San Cristóbal (25,665 cm−3). In Las Ferias, PNC levels remain relatively stable throughout the day, with minor fluctuations and a maximum value in the morning. In contrast, San Cristóbal exhibits a bimodal pattern, with two pronounced peaks occurring in the morning and the afternoon. Palmira also displays a bimodal pattern, but with the highest peak around midnight, which could be influenced by agricultural burning practices that take place at night. Cali shows the highest PNC values among the four sites, explained by the surrounding emission sources, as previously mentioned.

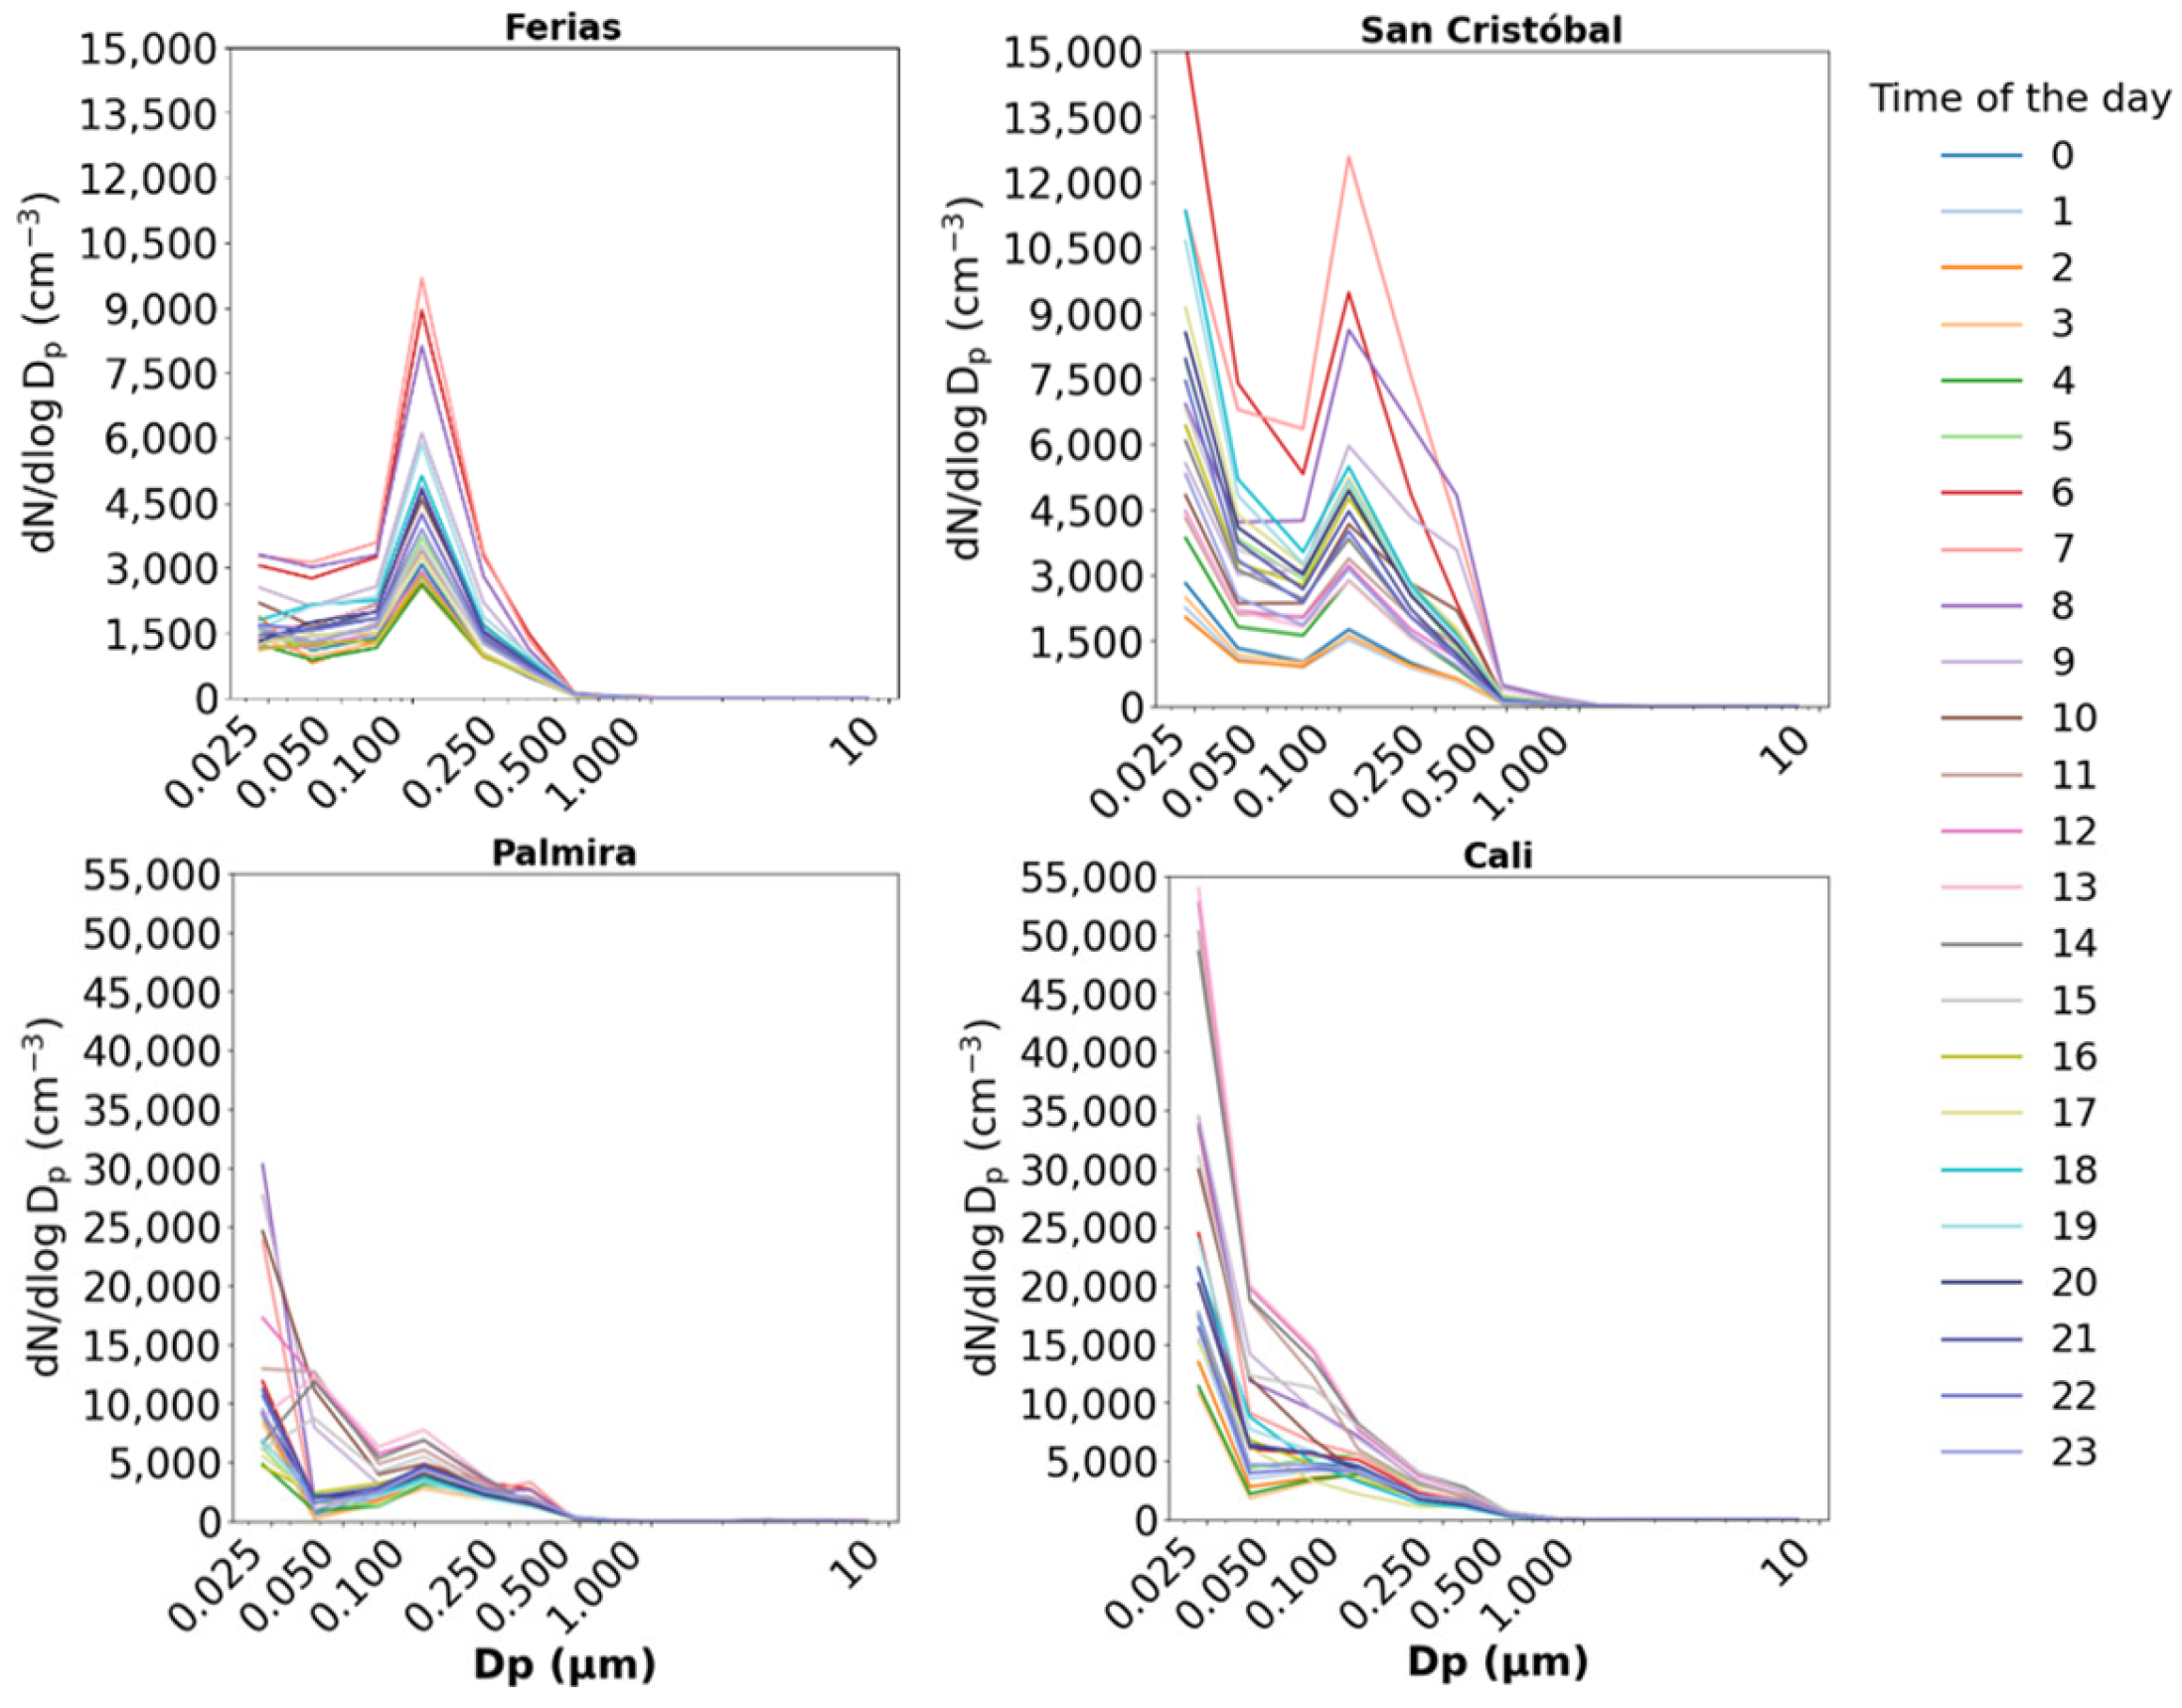
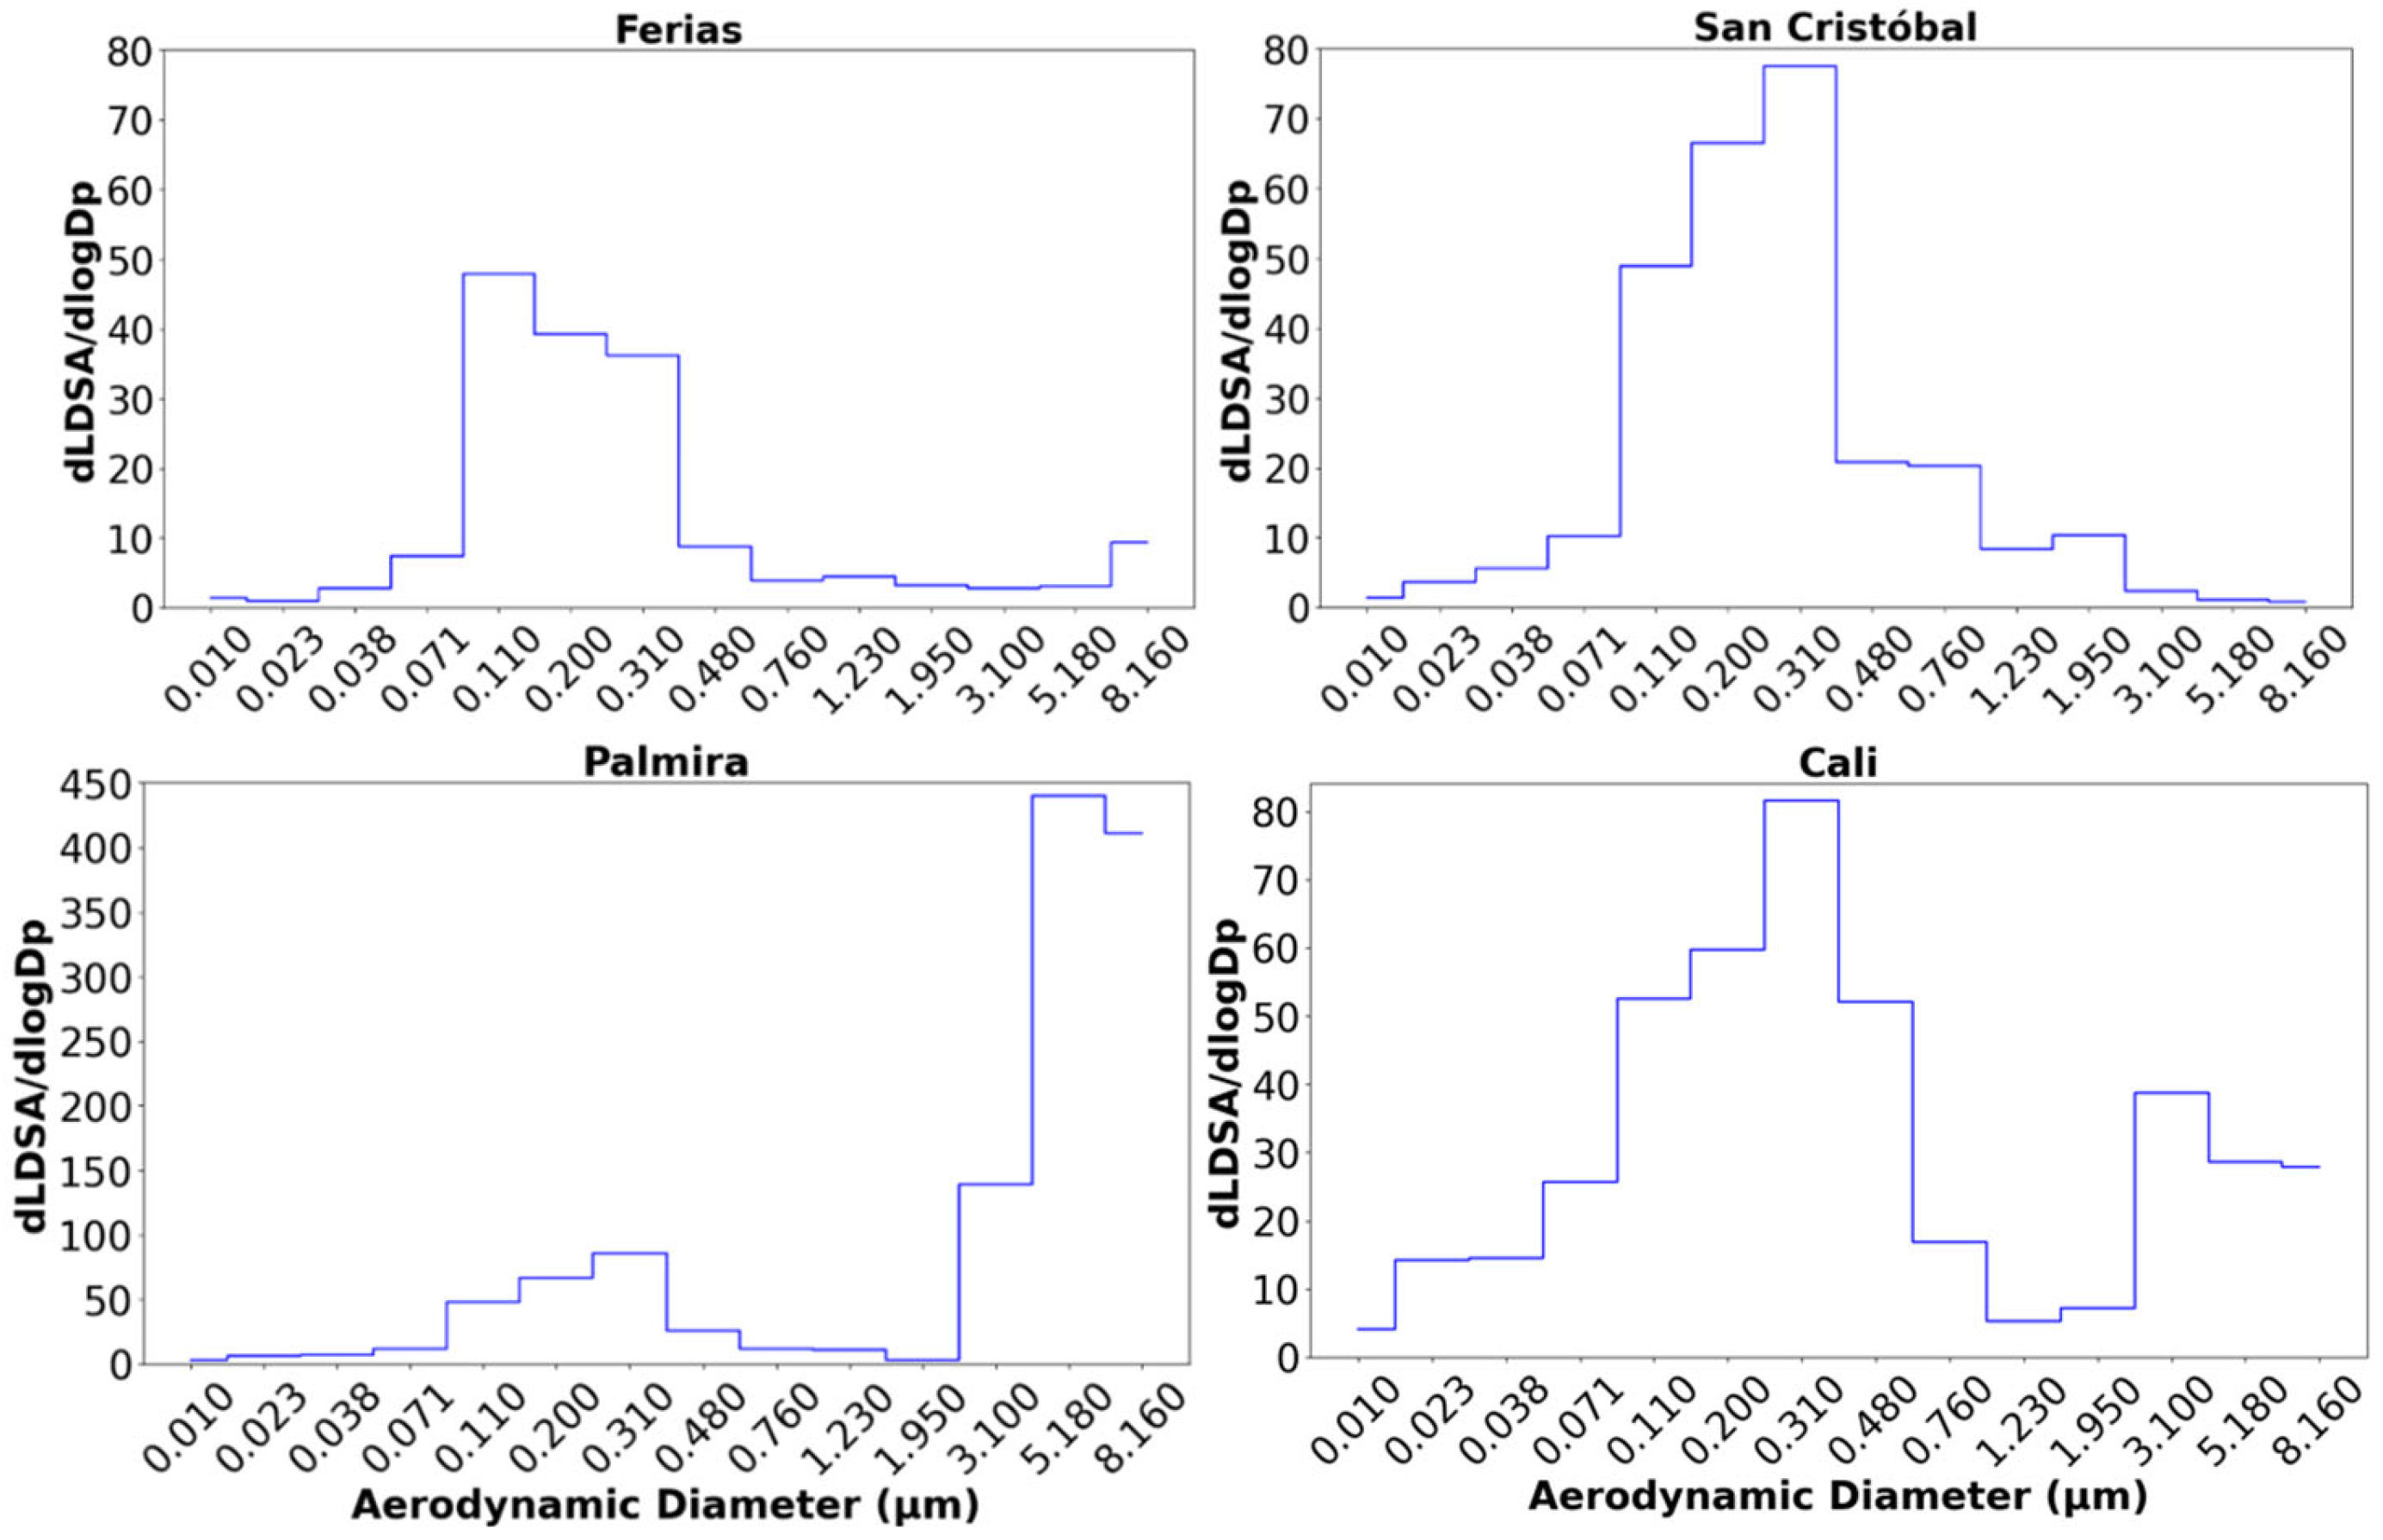
3.2. Particle Number Size and Mass Distributions

The particle number size distribution (PNSD) and particle mass size distribution (PMSD) across the four locations reveal distinct patterns (Figure 4). At all sites, the PNSD exhibits a sharp peak at small diameters (<0.025 µm), indicating a dominance of ultrafine particles, which are typically linked to combustion sources such as vehicle traffic and industrial emissions. Ferias and San Cristóbal show secondary peaks around 0.100–0.250 µm, suggesting contributions from particle growth and atmospheric aging. Cali and Palmira show higher concentrations (>30,000 cm−3) compared to Bogotá (<15,000 cm−3). This suggests the presence of more nucleation and gas condensation precursors in Cali and Palmira, probably related to a warmer environment. In Bogotá, the Aitken accumulation mode (30 to 100 nm), which consists of particles formed from the nucleation mode and additional precursors associated with combustion, is notable, showing a bimodal distribution. In Palmira, this mode is less pronounced, while it is absent in Cali, resulting in a unimodal distribution.
Regarding the particle mass size distribution (PMSD), San Cristobal shows several peaks associated with the accumulation (30 to 300 nm) and the coarse modes (>300 nm) but with relatively low concentrations (<0.03 mg m−3). These peaks might be associated with combustion sources, secondary formation, and dust resuspended by vehicles. In Las Ferias, the mass distribution is also bimodal, with the accumulation mode and coarse particles showing higher concentrations (<0.175 mg m−3) than San Cristobal due to larger traffic volumes. In Cali, coarse particles reach 0.5 mg m−3, associated with dust, and in Palmira, the largest mass distribution is observed (up to 8 mg/m3) related to particulate generation during agricultural fires and biomass burning.
As expected, the PNSD was dominated by UFPs, while the PMSD was dominated by CPs (Table 3). However, in San Cristóbal, FPs constitute 82% of the PMSD. In Palmira, 85% of the PNSD belong to the UFP category, with Stage 1 exhibiting the maximum normalized particle number concentration (32,622 cm−3). Regarding fine particles, approximately 9275 cm−3 were found (Stages 5–12 of the ELPI+). The high proportion of UFPs suggests a distinctive characteristic of Palmira, which coincides with the trends observed in Cali. It can be inferred that both cities face similar challenges in terms of air pollution from UFPs, indicating a significantly polluted environment. In Cali, UFPs constitute 89% of the PNSD. According to the statistical analysis, the sum concentrations of UFPs and FPs were 78,504 and 9709 cm−3, respectively, with no significant percentage of coarse particles (PM2.5–10).

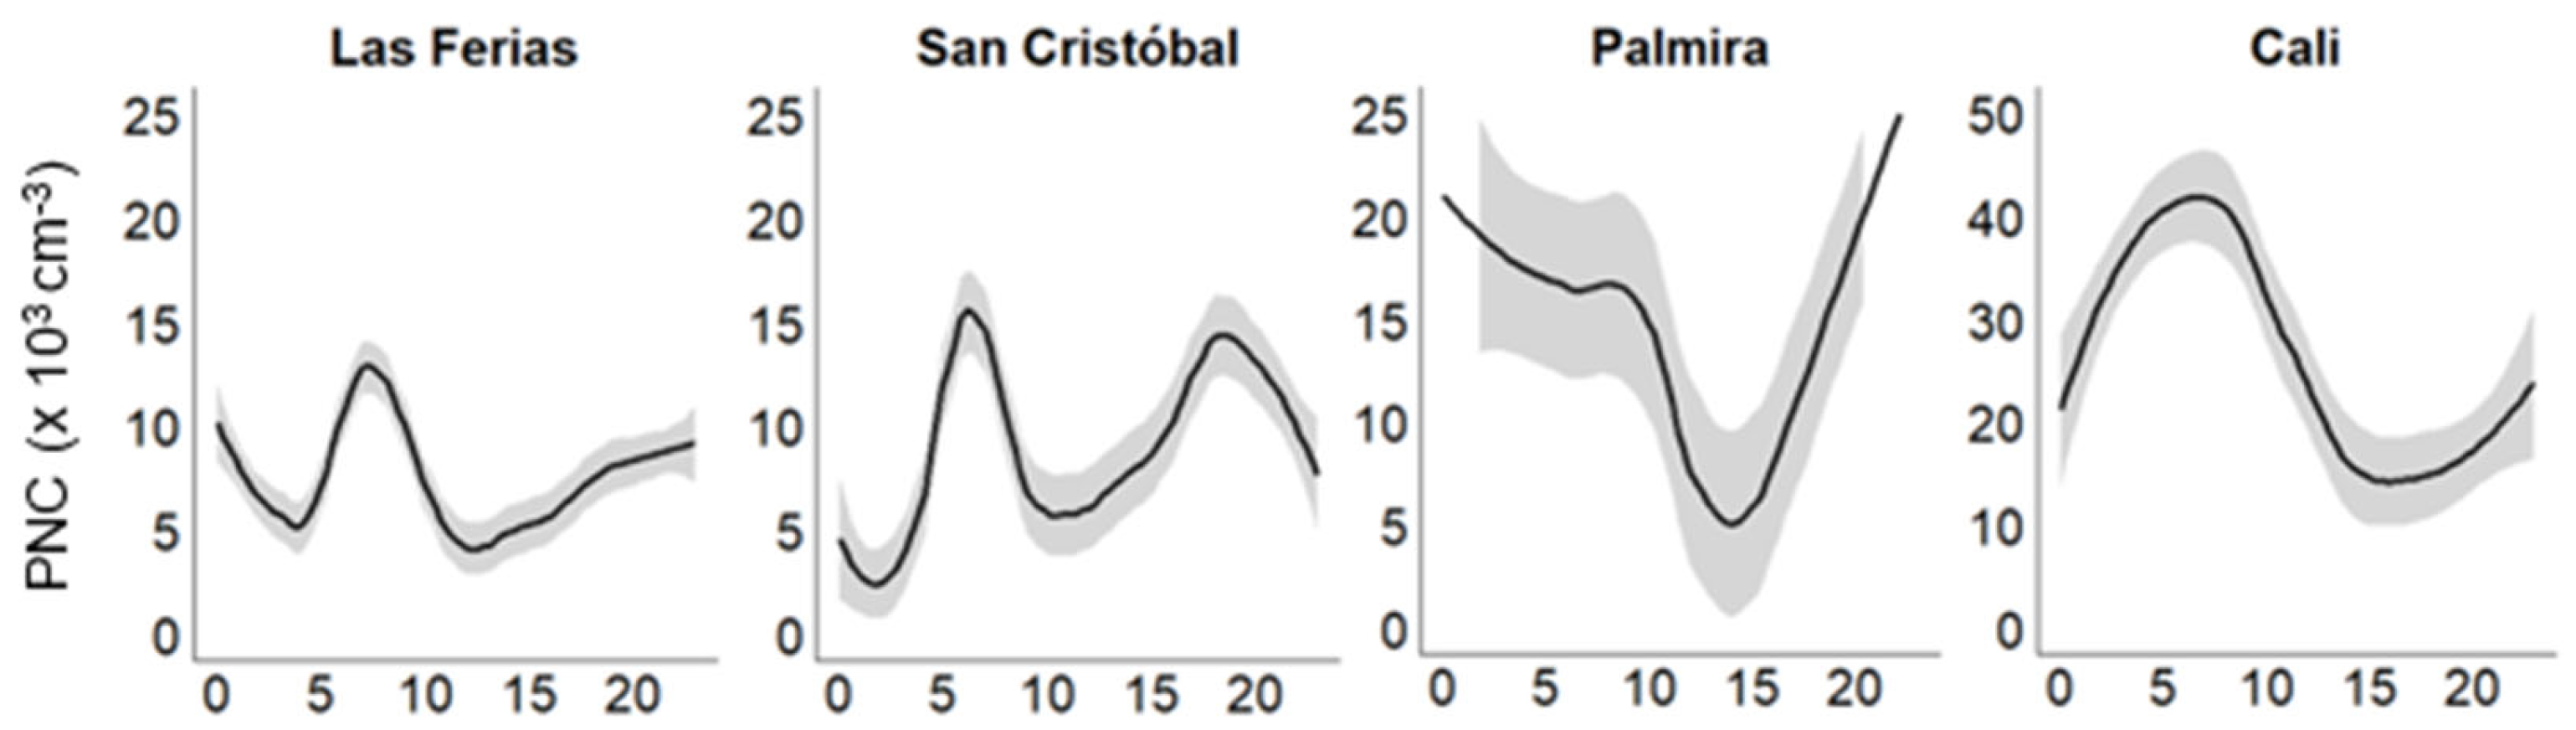
3.3. Twenty-Four-Hour PNSD Variation

Figure 5 illustrates the hourly variation in PNSD across the four different locations. Distinct diurnal patterns are evident in each location, with notable peaks observed at smaller aerodynamic diameters (<0.1 µm) during the early morning (four sites) and late afternoon (Cali), possibly due to traffic emissions. Ferias shows a maximum peak for particles with aerodynamic diameters around 0.1 µm. San Cristóbal exhibits a bimodal configuration, with higher particle concentrations at aerodynamic diameters below 0.025 µm and around 0.1 µm, primarily between 6:00 and 8:00.
The PNSD in Palmira and Cali shows a pronounced peak in the Aitken-mode region (30 to 110 nm). Larger particles show lower concentrations. Cali shows higher concentrations across all particle sizes with a peak of 5 × 104 cm−3 at Dp < 0.025 µm after midday. Palmira, on the other hand, has lower values (3 × 104 cm−3) with a peak at Dp < 0.025 µm between 6:00 and 9:00. As mentioned earlier, the presence of higher concentrations of precursors for particle condensation and coagulation processes in Cali can be inferred.

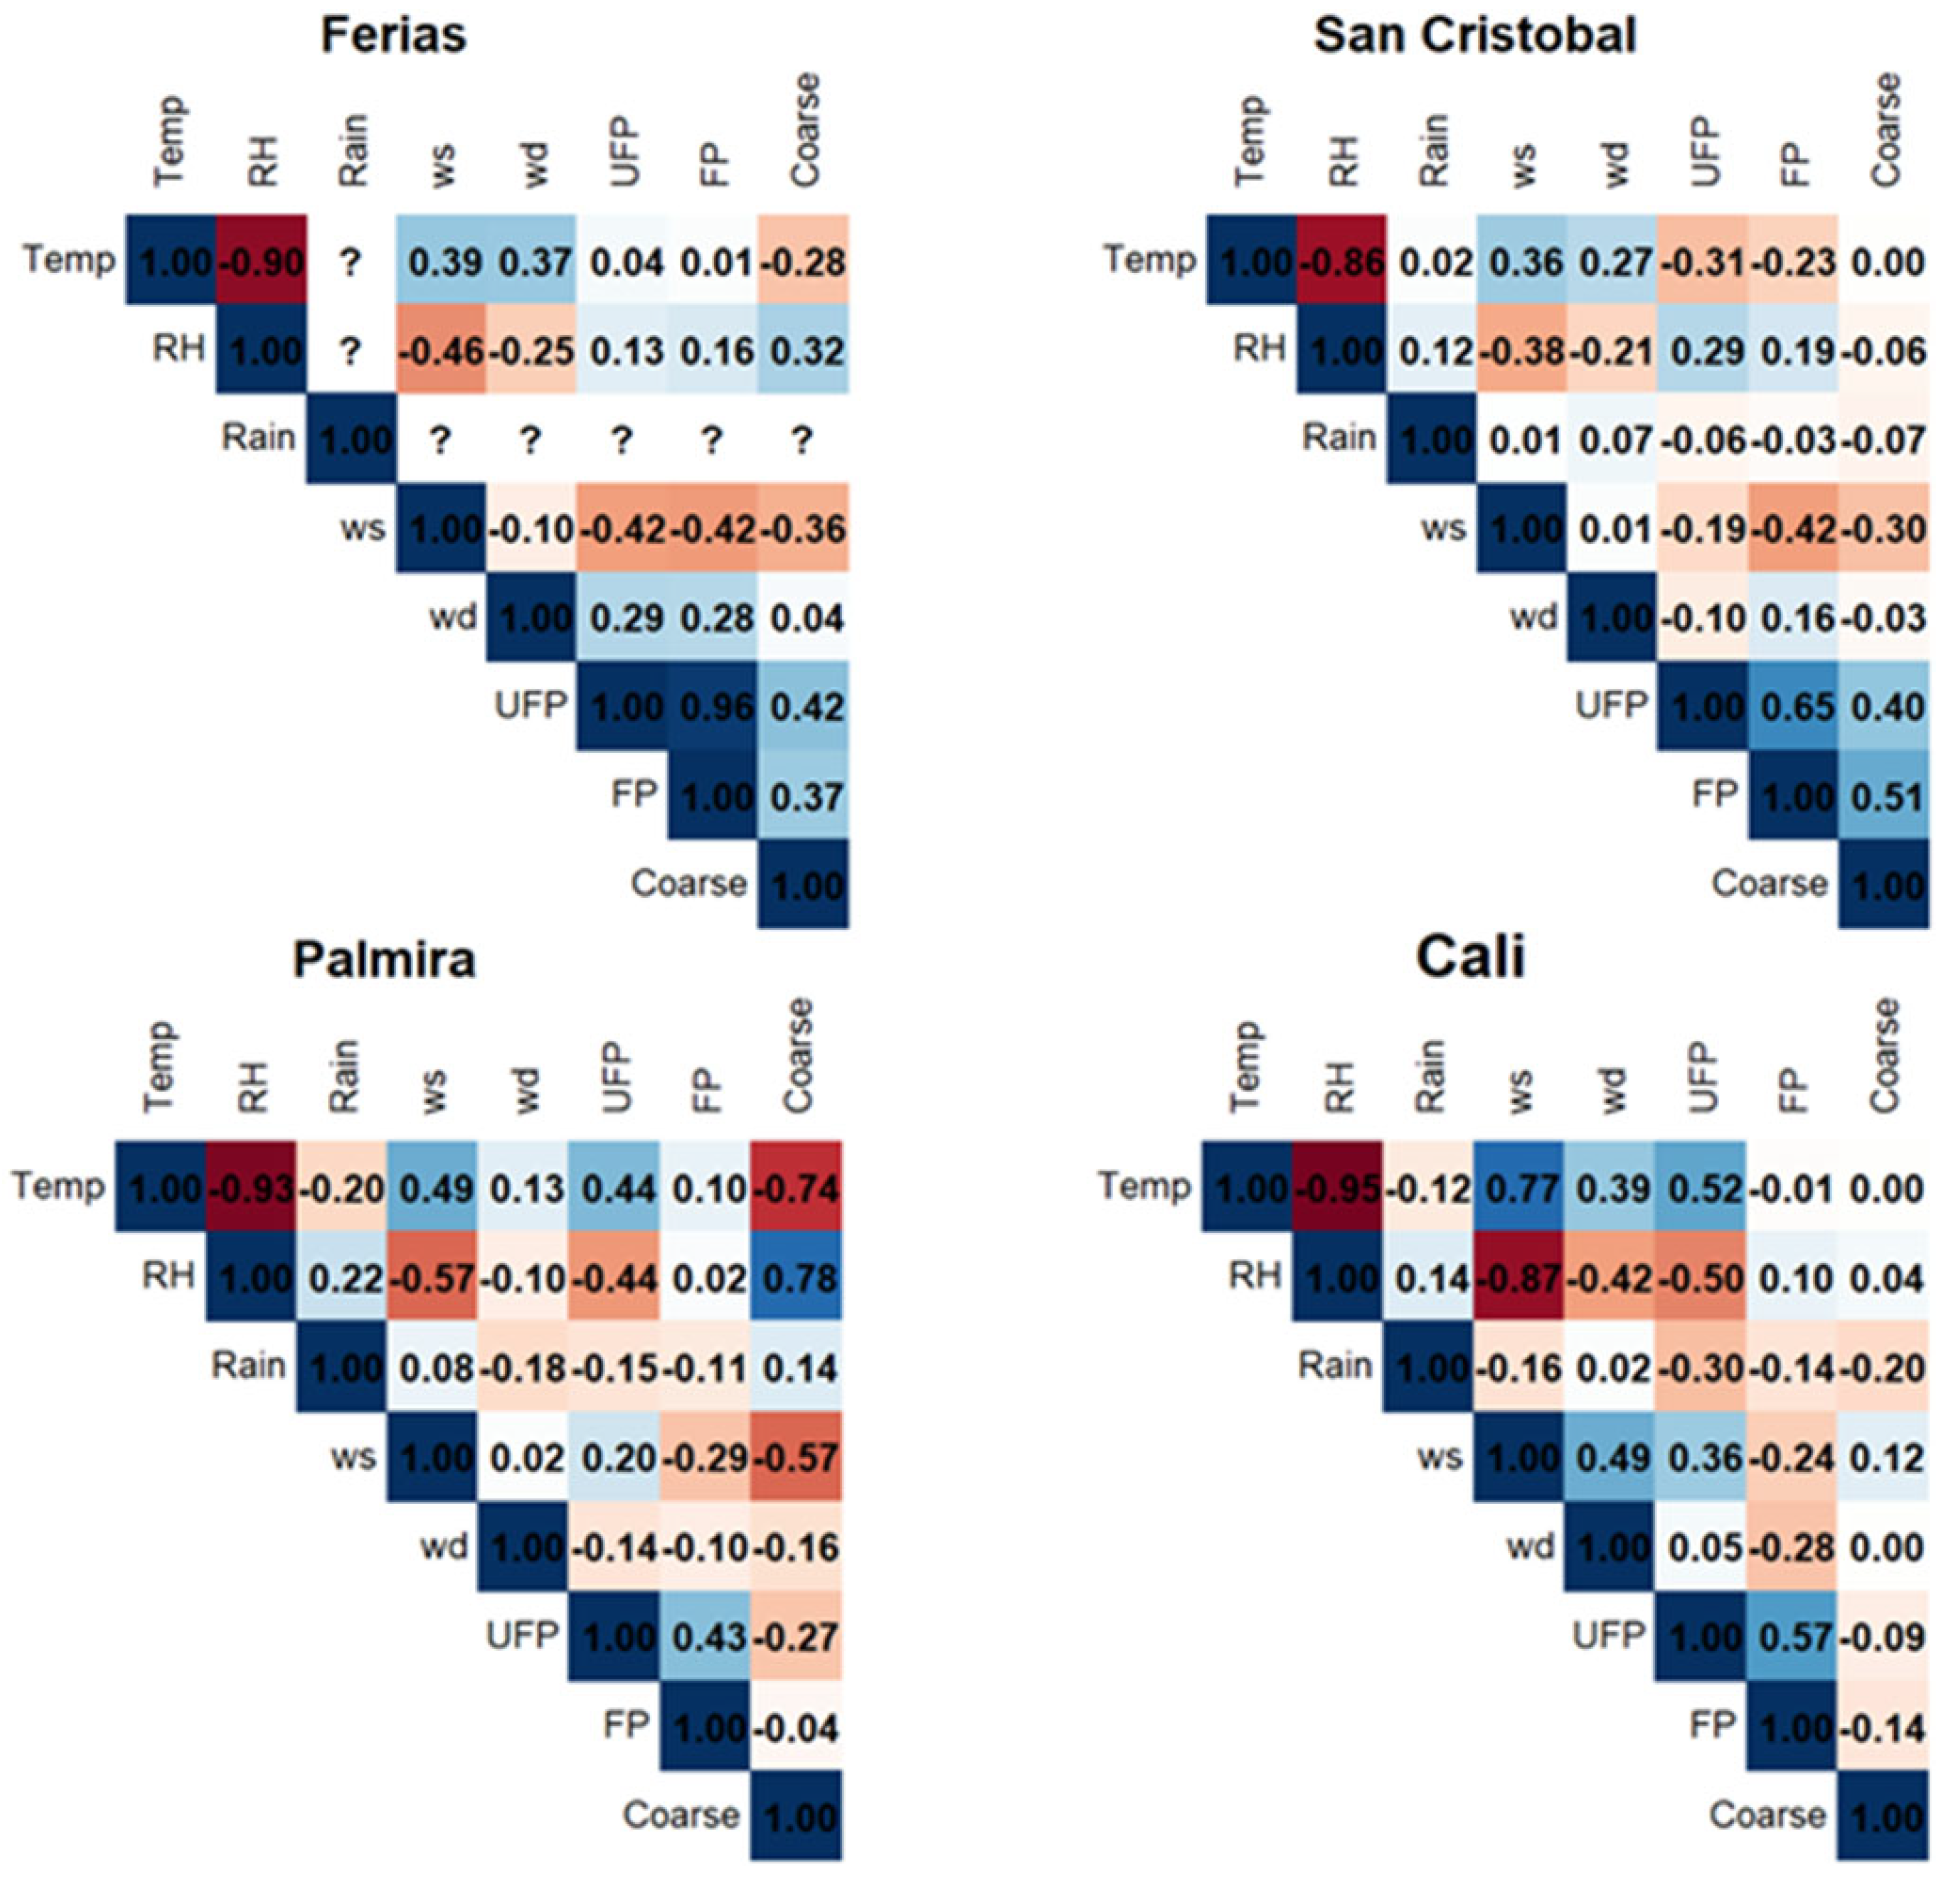
3.4. Correlation of Particle Number Concentration with Meteorological Variables

Bivariate polar concentration plots were used to relate wind speed and direction measured during the campaigns with the total particle concentration (Figure 6). This technique was used to determine the location of possible sources of these particles. The highest UFP concentration in Cali (>25,000 cm−3) was related to low wind speeds (<1.5 m/s) from the east, where the municipalities of Yumbo and Palmira are located. These are well known for their industrial and agro-industrial activities, respectively. In the other monitoring sites, the UFPs showed concentrations > 15,000 cm−3, where higher wind speeds (>4 m/s) and varying wind directions were observed. In San Cristobal, UFPs primarily originate from the north and west, with wind speeds ranging between 2 and 4 m/s. Regarding FPs, the three sites exhibit similar wind direction patterns to those of UFPs. However, it is noteworthy that Las Ferias shows higher FP concentrations compared to the other sites, although San Cristóbal also shows elevated FP concentrations (>6000 cm−3), predominantly from the north and, to a lesser extent, from the west.
For CPs, PNCs are consistently lower (<500 cm−3) across the four sites, indicating that CPs come from local sources. In Palmira, CPs primarily originate from the northwest, which corresponds to the location of nearby crop fields. In San Cristobal, CPs are mainly transported from the east–southeast direction, where a major secondary road is located. This suggests that resuspension of particulate matter due to vehicle traffic may be contributing to the observed CP concentrations.
The Spearman correlation plot (Figure 7) shows the relationship between meteorological variables (temperature, relative humidity (RH), rain, wind speed, and wind direction) and the concentrations of UFPs, FPs, and coarse particles. In Palmira and Cali, there is a positive correlation between temperature and UFPs and an inverse correlation between RH and UFPs. The Las Ferias site did not experience rain during the monitoring period, so no correlation value is presented. Wind speed shows moderate negative correlations with particles in general, indicating that higher speeds favor the dispersion of pollutants. However, the increase in particle concentration is mainly associated with wind direction, as winds from the west–south and north quadrants increase PNC.
Coarse particles show weaker correlations with meteorological variables in Las Ferias, San Cristobal, and Cali, which may reflect their predominant origin in local resuspension processes. This analysis highlights how meteorological conditions influence the concentrations of particles of different sizes in each station, with Cali showing the most marked relationships between temperature and UFPs. Nevertheless, in Palmira, CPs show high correlation with temperature (−0.74), relative humidity (0.78), and wind speed (0.57).

3.5. LDSA—Respiratory Deposition

In all cities (Figure 8), the aerodynamic diameter range between 0.071 and 0.310 µm dominates the LDSA distribution, suggesting that FPs have a significant influence on lung deposition with a contribution of 82.4% (Ferias), 90.2% (San Cristóbal), 73.6% (Cali), and 67.5% (Palmira), greater than UFPs (7.5–14.3%, respectively, Palmira and Cali) and CPs (0.6–25%, respectively, San Cristóbal and Palmira). The cities of Palmira and Cali show the highest LDSA values (>80 µm2/cm3), followed by San Cristóbal and Las Ferias (between 50 and 80 µm2/cm3). The observed differences may be attributed to variations in local emission sources (vehicular traffic, industry, and combustion), as well as meteorological factors. Figure S2 shows the variation in the Lung-Deposited Surface Area (LDSA) distribution as a function of aerodynamic diameter for the median values corresponding to ET1, ET2, BB, bb, and AI, in the three cities.
In Bogotá, the distribution at the Las Ferias station shows a more moderate peak in the same aerodynamic diameter range (0.071 and 0.310 µm) but with maximum values not exceeding 50 µm2/cm3. This result reflects a lower intensity of particles in this range compared to Palmira and Cali, possibly due to differences in emission sources or the urban configuration of the area.
In Palmira, the LDSA distribution shows a bimodal behavior, with the first peak in the aerodynamic diameter range between 0.071 and 0.310 µm, reaching values close to 80 µm2/cm3. The second peak is related to aerodynamic diameters greater than 3.10 µm. This finding suggests that particles in this size range are predominant in the city and may have a higher capacity for deposition in the respiratory tract. In Cali, the distribution shows a bimodal pattern, with the first peak in the aerodynamic diameter range at 0.310 µm and the second at 3.102 µm. The highest peak in the graph indicates that particles with an aerodynamic diameter close to 0.3 µm contribute the most to the surface area deposited in the lungs. Although the second peak represents a relevant contribution, larger particles may not reach the alveolar regions, and their interaction may impact the upper respiratory tract due to the particle size (between 3.10 and 8.16 µm).

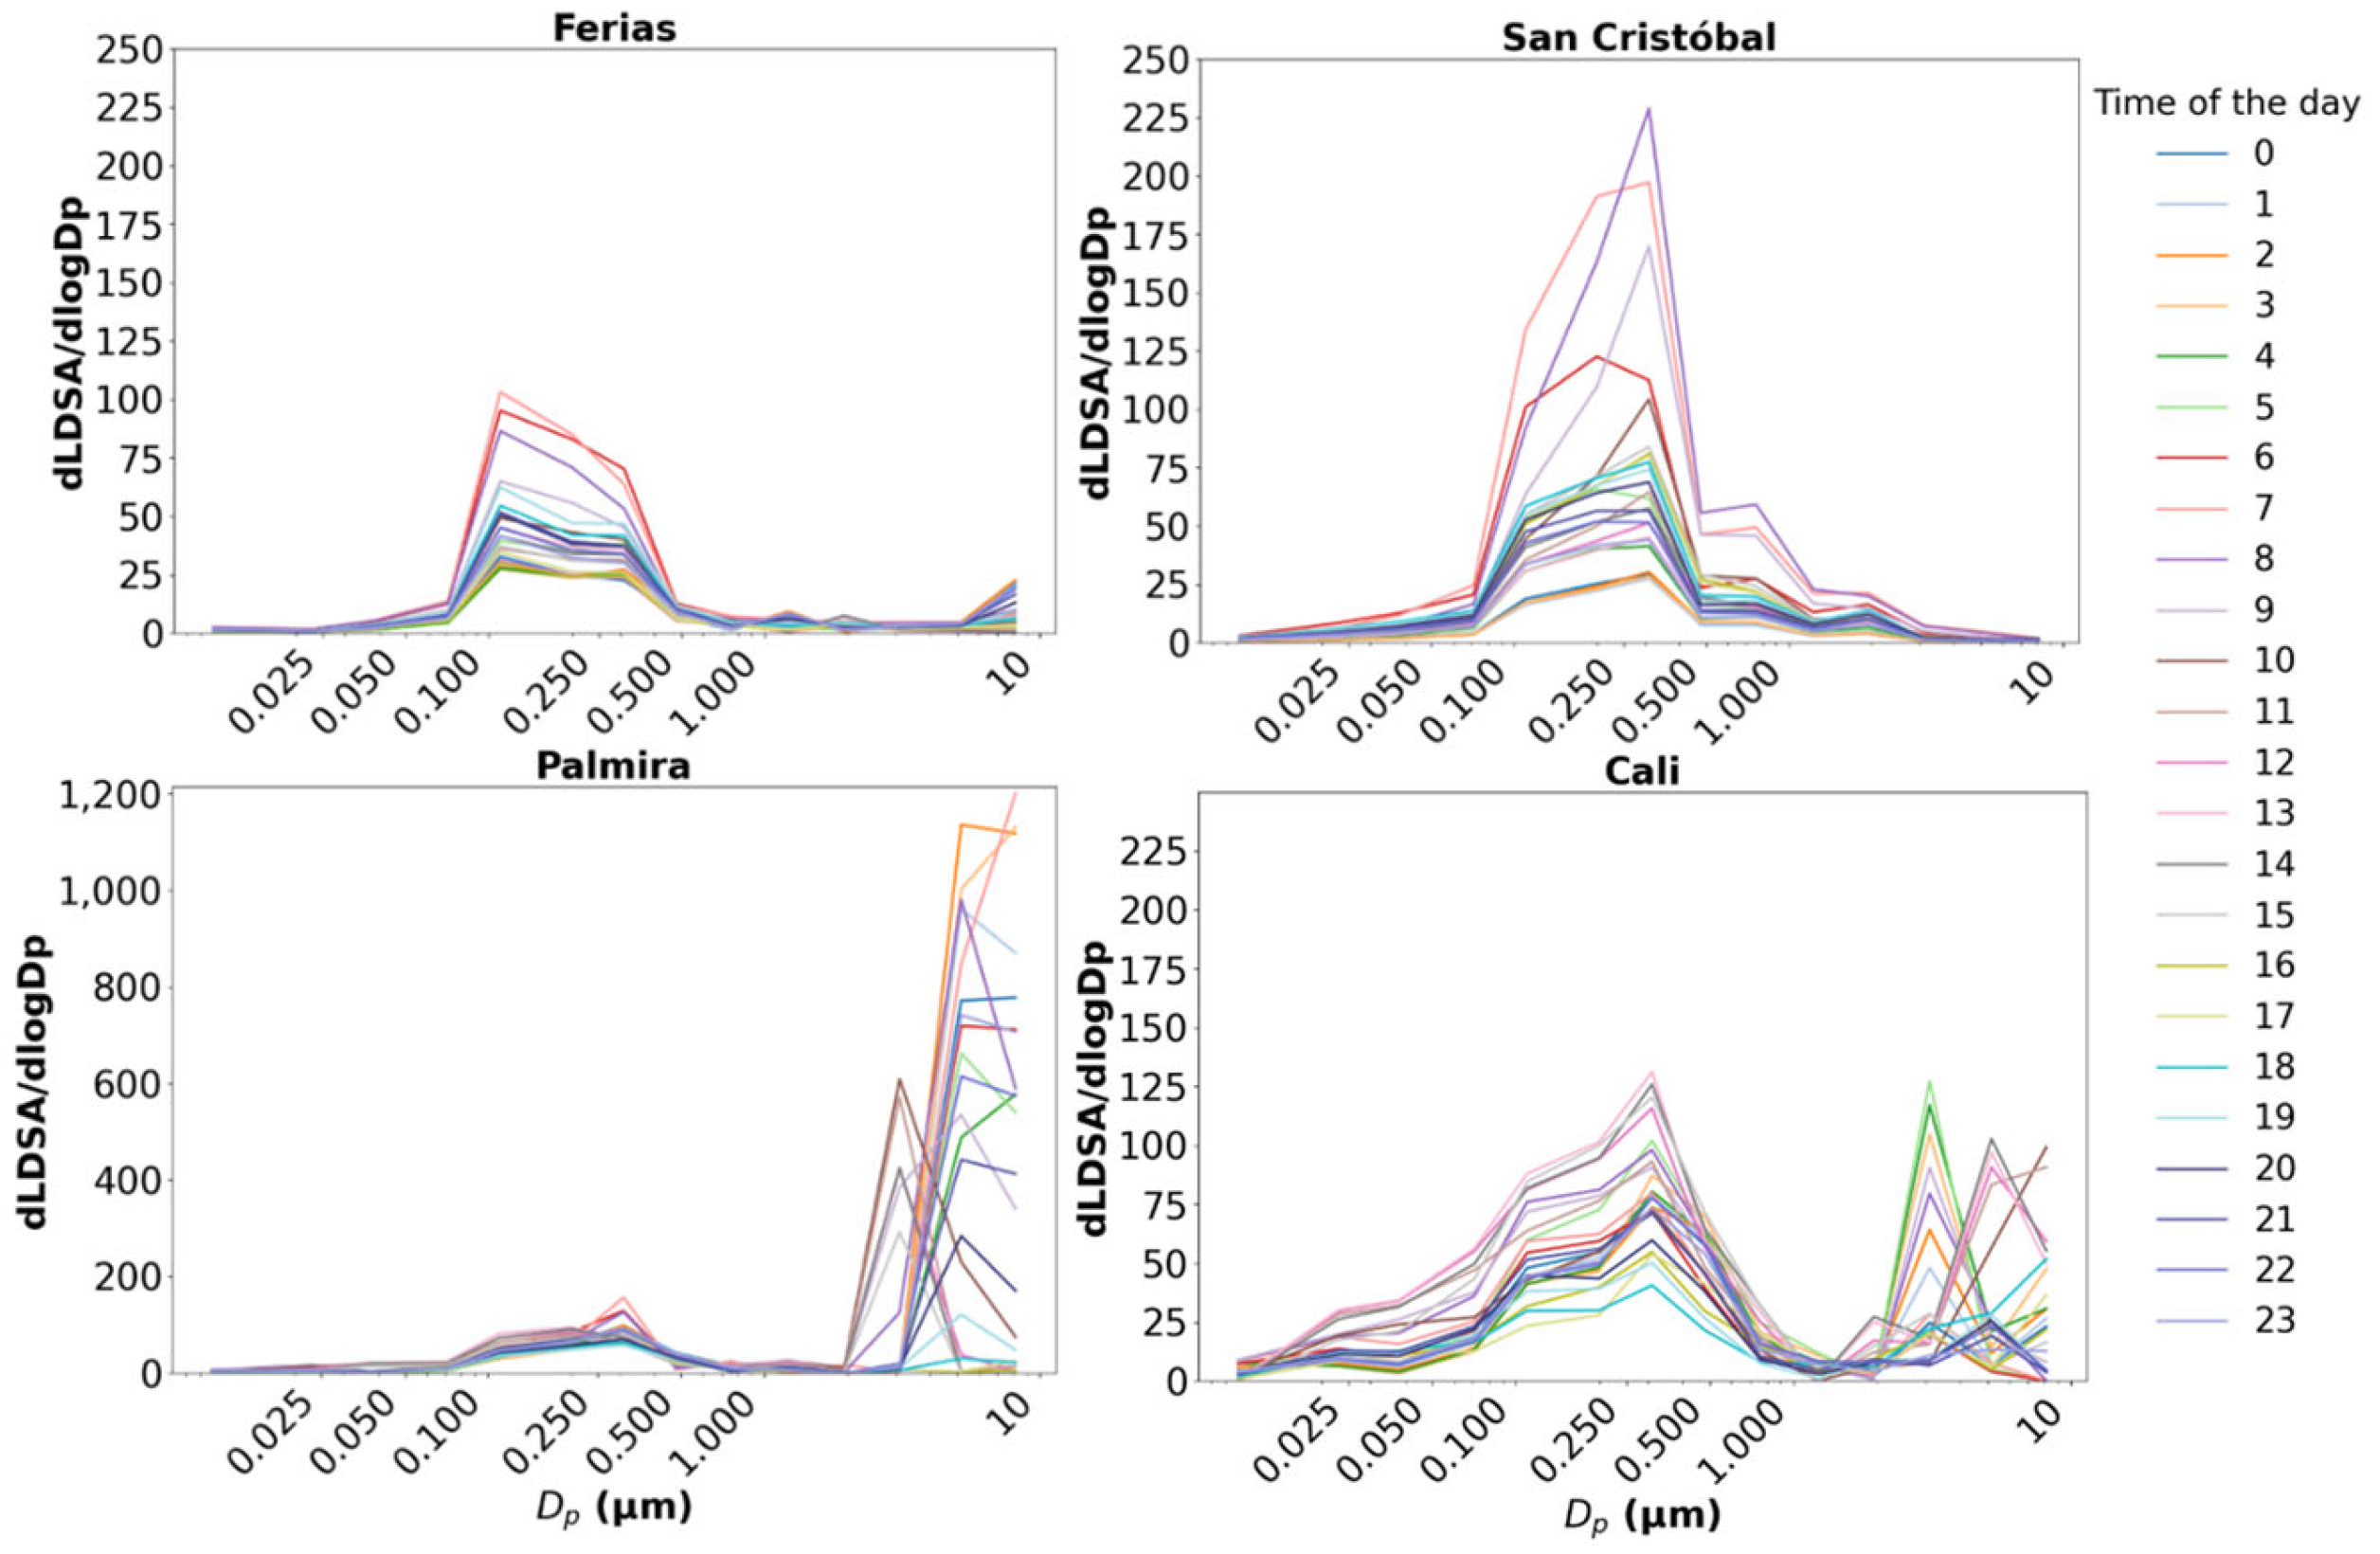
3.6. Hourly LDSA Size Distribution in Three Colombian Cities

The results highlight the spatial and temporal variability of LDSA distributions among the studied cities. FPs (0.1 to 0.3 µm) are the main contributors to LDSA in all three cities, with differences in magnitude and predominant sources. Additionally, the highest peaks were observed in Ferias, San Cristóbal, and Palmira in the morning hours (between 5:00 and 9:00), with secondary peaks occurring mainly in the afternoon–evening hours (15:00 to 21:00) (Figure 9). Bogotá (San Cristóbal) recorded the highest LDSA levels, approaching 225 µm2/cm3 in the range between 0.1 and 0.5 µm.
Bogotá and Palmira show similar FP patterns, with higher peaks in the morning and evening rush hours. The higher morning rush hour peak could be attributed to a combination of reduced atmospheric mixing due to lower boundary layer heights, along with increased emissions from on-road vehicles and local sources concentrated during early commuting hours. Nonetheless, Palmira shows the highest peak with CPs, reaching concentrations of 1200 µm2/cm3. In Cali, greater fluctuations are observed throughout the day, possibly due to a combination of more diversified sources.

4. Discussion

This study analyzes the spatial and temporal variability of UFP, FP, CP, and LDSA concentrations across four sampling sites. The preliminary results reveal distinct diurnal cycles and size distribution patterns shaped by local meteorology, emission sources, and atmospheric processes. The discussion explores the factors driving these variations, compares the findings with previous studies, and assesses the potential health risks of elevated UFP and LDSA levels in urban environments.
The elevated UFP values observed in Cali might be due to the presence of nucleation or homogeneous condensation precursors, such as sulfur compounds from fossil fuels and biogenic and anthropogenic VOCs generated by transport, commercial, and residential sectors. Kwon et al. [48] identified diesel exhaust as a major source of UFP emissions, highlighting that sulfuric acid derived from sulfur oxidation during combustion promotes nucleation and increases UFP counts. The authors also noted that road transport, industrial processes, residential and commercial activities, and agricultural sources account for 69% of total UFP emissions in urban areas across the European Union. In Palmira, the high UFP concentrations could be linked to agro-industrial emissions and the application of fertilizers on crops surrounding the monitoring station. Kammer et al. [49] observed the formation of new particles at a periurban agricultural site during nights with elevated NO2 concentrations. They suggested that two processes could drive nocturnal UFP formation: (i) the conversion of NH4NO3 from the gas phase to the particulate phase and (ii) the condensation of gases from VOC oxidation by NO3 radicals, which are influenced by NO2 levels.
CP levels in Palmira are likely associated with sugarcane agriculture. Dattamudi et al. [50] in Louisiana and Le Blond et al. [51] in Brazil and Ecuador reported that sugarcane field burning is a significant source of CP emissions. Le Blond et al. [51] specifically found that CP levels reached 1807 µg m−3 (median concentration) during pre-harvest burning. These findings suggest that the elevated CP levels observed in Palmira could be attributed to both direct emissions from biomass burning and the resuspension of ash during harvesting, highlighting the substantial impact of agricultural practices on local air quality. UFP pollution originates from both natural sources, such as biological particles, and anthropogenic sources, including suspended vehicular dust, vehicular traffic, and industrial emissions [32]. Kwon et al. [48] and Li et al. [52] confirmed that vehicular traffic remains the primary source of UFP emissions, while Al-Dabbous and Kumar [53] attributed 73% of UFPs to traffic emissions and 9% to industrial sources. UFP concentrations also tend to increase with population density. Kumar et al. [54] reported UFP concentrations ranging from 8020 cm−3 in Los Condes (Chile) to an extreme 3 × 10⁵ cm−3 in New Delhi (India) and links the high levels to urban growth and expanding road traffic. The average UFP levels in this study range between 7800 in Bogotá—Las Ferias and 28,400 cm−3 in Cali. Bogota’s urban characteristics are similar to Santiago, which is reflected in UFP levels as well as in annual average PM2.5 concentrations, namely 16 µg m−3 in Bogotá and 22 µg m−3 in Chile. Industrial and agro-industrial activities, which emit gases that can increase secondary particle formation, may explain the higher UFP levels measured in Cali and Palmira.
In Cali and Palmira, increased UFP levels around midday coincide with peak solar radiation and temperature, suggesting that nucleation or homogeneous condensation processes involving VOCs from traffic, agriculture, industry, and biogenic emissions may be taking place. This supports Ahlm et al. [55], who reported that UFPs, primarily organic (77%), tend to peak in the afternoon due to new particle formation influenced by sunlight and reactive gases such as OH, O3, SO2, and VOCs. Similar patterns were reported by Vratolis et al. [56] in Greece and Giemsa et al. [57] in Germany, where UFP concentrations peaked during morning and afternoon hours, primarily due to vehicular traffic. Giemsa et al. [57] recorded UFP values exceeding 10,000 cm−3 in Augsburg, Germany, with peaks surpassing 20,000 cm−3 at traffic monitoring stations, whereas values above 20,000 cm−3 were only observed in Cali in this study. In Palmira and San Cristóbal, UFP PNCs did not exceed 8000 cm−3, and in Las Ferias, they remained below 4000 cm−3.
In Bogotá, PNCs were lower in Las Ferias compared to in San Cristóbal. The city’s annual air quality report indicates that PM levels are typically lower from June to August, when higher wind speeds enhance atmospheric dispersion, and levels increase from September to November. At San Cristóbal, PM2.5 concentrations rose by 2 µg m−3 compared to the previous year, with a trend of increasing values from February to March, a decline in June–July, and another rise toward November. This station uniquely shows a persistent upward trend, likely linked to changes in wind patterns that hinder pollutant dispersion and to the role of VOCs in tropospheric ozone formation [58]. Blanco [41] and Mateus-Fontecha [43] characterized the number and size of particles present in the air at two air quality stations: San Cristóbal as an urban background station and Las Ferias as a traffic station, using an ELPI+. Both authors found that Aitken- and accumulation-mode particles predominate in the city, with a unimodal distribution in Las Ferias and a bimodal distribution in San Cristobal. These results suggest that vehicular sources and condensation processes play an important role in particle formation in Bogotá. Ning and Sioutas [59] explained that vehicle engines emit a complex mixture of gas vapors and particulate matter, where nucleation and condensation are key processes driving particle formation and growth. Hot exhaust gases cool rapidly during dilution, leading to the supersaturation of low-volatility compounds and subsequent particle formation through nucleation or condensation onto pre-existing particles.
Wang et al. [60] reported that combustion contributes to over 80% of PM1 formation, SO2 contributes to more than 50% of PM1–2.5 formation, and road dust accounts for 85% of PM2.5–10 formation. Consistent with this, Franco et al. [61] found that UFPs made up over 80% of particulate matter in a study conducted in Medellín, Colombia, with an average concentration of 4603 cm−3. The high concentration of UFPs (Dp > 0.027 µm), which rapidly decreases for larger diameters, reflects new particle formation through nucleation. Similar bimodal patterns have been reported by Wang et al. [60] in New York, with morning peaks corresponding to traffic and afternoon peaks reflecting frequent nucleation events.
The diurnal behavior observed in this study reflects traffic-driven patterns reported by Fung et al. [62], Lepistö et al. [20], and Liu et al. [21], where morning and evening peaks are linked to traffic emissions. Morning and evening peaks have been consistently recorded in high-traffic environments such as Street Canyon, where Lepistö et al. [20] reported LDSA values of 37.2 µm2/cm3, and Liu et al. [21] observed values between 60 and 120 µm2/cm3. In Bogotá, Palmira, and Cali, similar patterns emerged, suggesting that vehicular traffic, industrial emissions, and long-range transport contribute to the observed UFP levels. Belkacem et al. [63] found that bimodal patterns in urban sectors are directly influenced by road traffic.
The high LDSA values observed in San Cristóbal (200 µm2/cm3) surpass those recorded in other urban areas worldwide by a large margin. Reche et al. [64] reported LDSA concentrations of 37 ± 26 µm2/cm3 in Barcelona, while Kuuluvainen et al. [65] observed values between 12 µm2/cm3 in park areas and up to 94 µm2/cm3 at traffic sites. Population density and annual average PM2.5 in Bogotá (16,000 inhab/km2 and 16 µg m−3) are similar to those in Barcelona (16,000 inhab/km2 and 17 µg m−3). The observed peaks in LDSA concentrations during working hours and the decline on weekends align with patterns reported in urban environments. Fung et al. [62], for example, reported diurnal cycles with peak concentrations at the same hours, reinforcing the influence of traffic patterns on UFP levels. Nevertheless, the unexpectedly high LDSA levels in San Cristóbal are worthy of further research. One important factor may be related to the fact that the San Cristóbal site is located at the base of the Eastern hills of the city, an area with a higher density of vegetation. Biogenic emissions from this area might create condensation nuclei for UFP formation.
Although our findings point to traffic-related emissions, as well as agriculture and industrial activities, as relevant contributors to the observed UFP and LDSA concentrations, we acknowledge that, based on the short-term measurements, these attributions cannot be confirmed with certainty. Nevertheless, the spatial patterns observed, such as higher LDSA and UFP levels near traffic corridors, are consistent with the evidence presented worldwide. To strengthen source attribution in future research, it would be valuable to incorporate observations for new particle formation from complementing devices in order to characterize the physical and chemical characteristics of the aerosols. The inclusion of tracer species (e.g., black carbon for traffic, potassium for biomass burning, and sulfates for secondary aerosols) could further improve spatial resolution. Integrating these approaches with long-term datasets would allow for a more robust understanding of the sources driving LDSA and UFP exposure in urban environments like Bogotá, Cali, and Palmira.

Influence of Size and LDSA Distribution on Health

LDSA is a key indicator for assessing the respiratory impact of UFPs. In our study, particles in the 0.177–0.317 µm (FPs) range contributed most to LDSA across all cities (67.5–90.2%). This is consistent with the findings of Kuuluvainen et al. [65], who reported a strong correlation between LDSA and PM2.5 mass, but with significant variation depending on the environment, from 1.8 in suburban areas to 7.2 m2/μg in traffic-influenced sites. These findings suggest that identical PM2.5 concentrations may lead to markedly different LDSA exposures depending on particle sources. Similarly, our data show higher LDSA levels in traffic-impacted zones, even when PM2.5 levels were comparable. Conversely, UFPs accounted for a smaller fraction of LDSA (7.5–14.3%) across sites, despite being the dominant contributors to total PNC. This reflects their limited contribution to surface area deposition due to their small size. Nevertheless, consistent with the findings from Kwon et al. [48], systemic health effects linked to PM2.5 exposure may still be often attributable to the UFP fraction.
Moreover, although our study covered a limited monitoring period, our findings align with previous epidemiological evidence showing significant health risks associated with short-term UFP exposure [66,67]. For instance, Bergmann et al. [67] reported increased risks of COPD mortality (OR = 1.13), asthma-related hospital admissions (OR = 1.08), and other respiratory and cardiovascular outcomes within short exposure lags of 0–4 days. These effects were particularly pronounced at UFP concentrations above 5000 cm−3. In our measurements, UFP levels frequently reached or exceeded this threshold in all sites of monitoring, highlighting the potential health relevance of even short-term exposure episodes in urban environments.
Our findings are further supported by Zhang et al. [68], who emphasized that UFPs and FPs not only penetrate deep into the pulmonary region but also induce systemic oxidative stress and inflammation through mechanisms involving reactive oxygen species (ROS) generation and immune cell activation. These effects are amplified by the high LDSA, which increases the contact surface between inhaled particles and alveolar tissue. Therefore, even during short-term sampling campaigns, the observed LDSA peaks in urban areas possibly associated with intense vehicular activity may reflect not only increased exposure but also enhanced toxicological risk due to particle source, size, and surface reactivity.
Beyond particle size and deposition site, particle composition and source significantly influence toxicological risk. Chang et al. [69] identified aged traffic emissions and secondary aerosols as key contributors to LDSA, with concentration peaks at noon and in the evening linked to photochemical aging and poor dispersion. These periods also showed the highest excess lifetime cancer risks (ELCRs), up to 4.0 × 10⁻⁴. In our study, we observed similar LDSA levels (20–80 µm2/cm3) during these timeframes, suggesting that even without chemical speciation, short-term exposure in traffic-impacted environments may imply comparable health risks.
Despite some logistical limitations, these results represent an important starting point for future research that integrates simultaneous measurements of particle number, mass, surface area, and physicochemical characteristics alongside medical data. Notably, this study provides valuable insight into the cities of Cali and Palmira, urban areas with limited prior monitoring but increasing growth and environmental pressure, highlighting the need for continued air quality and health impact assessments in emerging urban settings.

5. Conclusions

The monitoring of particulate matter in Colombia has traditionally focused on the mass concentration of PM10 and PM2.5. The measurement of parameters such as particle number concentration and particle size distribution has been limited to research studies. FPs and UFPs are larger in number than mass and greatly contribute to LDSA across all sampling sites. In this study, Palmira and Cali, urban centers much smaller than Bogota and with smaller populations, experience larger values of PNC and PNSD due to anthropogenic (industrial, agriculture, and traffic) and natural (biogenic VOCs) sources in addition to a warmer environment. In particular, in Palmira, coarse particles are also significant (40 times larger than in Cali and Bogotá) due to burning of agricultural residues and dust resuspension. In Bogotá, the contributions of UFPs and FPs are comparable, suggesting a contribution from vehicular traffic, one of the most important sources in the city.
Cali and Palmira have the highest LDSA levels, indicating a greater capacity and risk of UFPs to deposit in the respiratory tract. San Cristóbal also records high levels, surpassing Las Ferias. In all cities, UFPs (0.1–0.3 µm) dominate the LDSA distribution, associated with vehicular traffic and local emissions.
This exploratory work highlights the importance of conducting long-term measurements with different sampling devices to characterize the physical and chemical properties of aerosols, understand new particle formation mechanisms, and assess potential health impacts.

Supplementary Materials

The following supporting information can be downloaded at https://www.mdpi.com/article/10.3390/atmos16050558/s1, Figure S1: Deposition fraction curves in alveolar, bronchiolar and head airways published by (International Commission on Radiological Protection, 2015). Each curve corresponded to ET1, anterior nasal passage; ET2, posterior nasal passage, pharynx, and larynx; BB, bronchial; bb, bronchiolar; AI, alveolar interstitial for median aerodynamic diameter; Figure S2: Variation in LDSA Distribution with Aerodynamic Diameter, to ET1, ET2, BB, bb, AI, for median aerodynamic diameter. Table S1: Deposition rate by diameter of the ELPI+ to ET1, ET2, BB, bb, AI. References [44,70,71,72,73,74] are cited in Supplementary File.

Author Contributions

Conceptualization, J.E.P. and N.Y.R.; methodology, D.B.Q., L.M.-F. and K.B.; software, D.A.-P., D.B.Q. and F.L.M.C.; validation, F.L.M.C., D.B.Q. and J.E.P.; formal analysis, F.L.M.C. and D.B.Q.; data curation, D.B.Q. and D.A.-P.; writing—original draft preparation, F.L.M.C., D.B.Q. and L.M.-F.; writing—review and editing, J.E.P. and N.Y.R.; visualization, D.A.-P., D.B.Q. and F.L.M.C.; supervision, J.E.P.; project administration, J.E.P. and D.B.Q. All authors have read and agreed to the published version of the manuscript.

Funding

This research was partially funded by the Colombian Ministry of Science, Technology, and Innovation (MinCiencias) under contract No. 1150-852-71525. Additionally, it was supported by the Universidad Nacional de Colombia through grants No. 37617 and 37718.

Institutional Review Board Statement

This requirement is not applicable because the study does not involve research on human participants or animals.

Informed Consent Statement

Not applicable in this study, as no human participants were involved.

Data Availability Statement

The data supporting the reported results are not publicly available due to confidentiality agreements and privacy restrictions. Access to the data is restricted to protect information and comply with ethical guidelines. However, the data can be provided to reviewers upon request solely for the purpose of evaluating the manuscript.

Acknowledgments

The authors would like to express their gratitude to the Universidad Nacional de Colombia for providing the facilities and resources essential for conducting this study. The authors also thank Ministerio de Ciencia Tecnología e Innovación for its support in the research process.

Conflicts of Interest

The authors declare no conflicts of interest.

References

  1. WHO. Ambient (Outdoor) Air Pollution; WHO: Geneva, Switzerland, 2024. [Google Scholar]
  2. Rai, P.K. Impacts of particulate matter pollution on plants: Implications for environmental biomonitoring. Ecotoxicol. Environ. Saf. 2016, 129, 120–136. [Google Scholar] [CrossRef]
  3. EPA. Chemical Process Overview; EPA: Washington, DC, USA, 2024. [Google Scholar]
  4. Hirshorn, N.S.; Zuromski, L.M.; Rapp, C.; McCubbin, I.; Carrillo-Cardenas, G.; Yu, F.; Hallar, A.G. Seasonal significance of new particle formation impacts on cloud condensation nuclei at a mountaintop location. Atmos. Meas. Tech. 2022, 22, 15909–15924. [Google Scholar] [CrossRef]
  5. Chen, S.-L.; Chang, S.-W.; Chen, Y.-J.; Chen, H.-L. Possible warming effect of fine particulate matter in the atmosphere. Commun. Earth Environ. 2021, 2, 208. [Google Scholar] [CrossRef]
  6. Mukherjee, A.; Agrawal, S. A Global perspective of fine particulate matter pollution and its health effects. Rev. Environ. Contam. Toxicol. 2018, 244, 5–51. [Google Scholar] [CrossRef] [PubMed]
  7. Anderson, J.O.; Thundiyil, J.G.; Stolbach, A. Clearing the Air: A Review of the Effects of Particulate Matter Air Pollution on Human Health. J. Med. Toxicol. 2012, 8, 166–175. [Google Scholar] [CrossRef]
  8. Kim, K.-H.; Kabir, E.; Kabir, S. A review on the human health impact of airborne particulate matter. Environ. Int. 2015, 74, 136–143. [Google Scholar] [CrossRef] [PubMed]
  9. Morawska, L.; Buonanno, G.; Mikszewski, A.; Stabile, L. The physics of respiratory particle generation, fate in the air, and inhalation. Nat. Rev. Phys. 2022, 4, 723–734. [Google Scholar] [CrossRef]
  10. Pratiwi, Y.E.; Taufik, F.F.; Habibi, J.; Wibowo, A. The Impact of Particulate Matter on the Respiratory System. J. Respirasi 2023, 9, 237–245. [Google Scholar] [CrossRef]
  11. Yang, L.; Li, C.; Tang, X. The Impact of PM2.5 on the Host Defense of Respiratory System. Front. Cell Dev. Biol. 2020, 8, 91. [Google Scholar] [CrossRef]
  12. Gómez-Moreno, F.; Pujadas, M.; Plaza, J.; Rodríguez-Maroto, J.; Martínez-Lozano, P.; Artíñano, B. Influence of seasonal factors on the atmospheric particle number concentration and size distribution in Madrid. Atmos. Environ. 2011, 45, 3169–3180. [Google Scholar] [CrossRef]
  13. De Marco, C.; Boselli, A.; D’anna, A.; Sannino, A.; Sasso, G.; Sirignano, M.; Spinelli, N.; Wang, X. Mutiparametric Characterization of Atmospheric Particulate in a Heavy-Polluted Area of South Italy. Atmos. Clim. Sci. 2022, 12, 493–516. [Google Scholar] [CrossRef]
  14. Kalaiarasan, G.; Kumar, P.; Tomson, M.; Zavala-Reyes, J.C.; Porter, A.E.; Young, G.; Sephton, M.A.; Abubakar-Waziri, H.; Pain, C.C.; Adcock, I.M.; et al. Particle Number Size Distribution in Three Different Microenvironments of London. Atmosphere 2024, 15, 45. [Google Scholar] [CrossRef]
  15. Leinonen, V.; Kokkola, H.; Yli-Juuti, T.; Mielonen, T.; Kühn, T.; Nieminen, T.; Heikkinen, S.; Miinalainen, T.; Bergman, T.; Carslaw, K.; et al. Comparison of particle number size distribution trends in ground measurements and climate models. Atmos. Meas. Tech. 2022, 22, 12873–12905. [Google Scholar] [CrossRef]
  16. P., L.F.S.; Manzano, C.A.; Leiva-Guzmán, M.A.; A., M.C.; Araya, R.T. Urban atmospheric particle size distribution in Santiago, Chile. Atmos. Pollut. Res. 2021, 12, 101201. [Google Scholar] [CrossRef]
  17. Agudelo-Castañeda, D.M.; Teixeira, E.C.; Braga, M.; Rolim, S.B.; Silva, L.F.; Beddows, D.C.; Harrison, R.M.; Querol, X. Cluster analysis of urban ultrafine particles size distributions. Atmos. Pollut. Res. 2019, 10, 45–52. [Google Scholar] [CrossRef]
  18. Schneider, I.L.; Teixeira, E.C.; Oliveira, L.F.S.; Wiegand, F. Atmospheric particle number concentration and size distribution in a traffic–impacted area. Atmos. Pollut. Res. 2015, 6, 877–885. [Google Scholar] [CrossRef]
  19. Lepistö, T.; Kuuluvainen, H.; Juuti, P.; Järvinen, A.; Arffman, A.; Rönkkö, T. Measurement of the human respiratory tract deposited surface area of particles with an electrical low pressure impactor. Aerosol Sci. Technol. 2020, 54, 958–971. [Google Scholar] [CrossRef]
  20. Lepistö, T.; Kuuluvainen, H.; Lintusaari, H.; Kuittinen, N.; Salo, L.; Helin, A.; Niemi, J.V.; Manninen, H.E.; Timonen, H.; Jalava, P.; et al. Connection between lung deposited surface area (LDSA) and black carbon (BC) concentrations in road traffic and harbour environments. Atmos. Environ. 2022, 272, 118931. [Google Scholar] [CrossRef]
  21. Liu, X.; Hadiatullah, H.; Zhang, X.; Trechera, P.; Savadkoohi, M.; Garcia-Marlès, M.; Reche, C.; Pérez, N.; Beddows, D.C.; Salma, I.; et al. Ambient air particulate total lung deposited surface area (LDSA) levels in urban Europe. Sci. Total. Environ. 2023, 898, 165466. [Google Scholar] [CrossRef]
  22. Silvonen, V.; Salo, L.; Raunima, T.; Vojtisek-Lom, M.; Ondracek, J.; Topinka, J.; Schins, R.P.; Lepistö, T.; Lintusaari, H.; Saarikoski, S.; et al. Lung-depositing surface area (LDSA) of particles in office spaces around Europe: Size distributions, I/O-ratios and infiltration. Build. Environ. 2023, 246, 110999. [Google Scholar] [CrossRef]
  23. Tran, P.T.M.; Ngoh, J.R.; Balasubramanian, R. Assessment of the integrated personal exposure to particulate emissions in urban micro-environments: A pilot study. Aerosol Air Qual. Res. 2020, 20, 341–357. [Google Scholar] [CrossRef]
  24. Edebeli, J.; Spirig, C.; Fluck, S.; Fierz, M.; Anet, J. Spatiotemporal Heterogeneity of Lung-Deposited Surface Area in Zurich Switzerland: Lung-Deposited Surface Area as a New Routine Metric for Ambient Particle Monitoring. Int. J. Public Health 2023, 68, 1605879. [Google Scholar] [CrossRef] [PubMed]
  25. Gong, J.; Zhu, T.; Hu, M.; Wu, Z.; Zhang, J. Different metrics (number, surface area, and volume concentration) of urban particles with varying sizes in relation to fractional exhaled nitric oxide (FeNO). J. Thorac. Dis. 2019, 11, 1714–1726. [Google Scholar] [CrossRef]
  26. Kim, J.; Kim, N.Y.; Kim, W.J. Biomarkers of particulate matter exposure in patients with chronic obstructive pulmonary disease: A systematic review. J. Thorac. Dis. 2023, 15, 3453–3465. [Google Scholar] [CrossRef]
  27. Taylor-Blair, H.C.; Siu, A.C.W.; Haysom-McDowell, A.; Kokkinis, S.; Saeid, A.B.; Chellappan, D.K.; Oliver, B.G.; Paudel, K.R.; De Rubis, G.; Dua, K. The impact of airborne particulate matter-based pollution on the cellular and molecular mechanisms in chronic obstructive pulmonary disease (COPD). Sci. Total Environ. 2024, 954, 176413. [Google Scholar] [CrossRef]
  28. Delfino, R.J.; Sioutas, C.; Malik, S. Potential role of ultrafine particles in associations between airborne particle mass and cardiovascular health. Environ. Health Perspect. 2005, 113, 934–946. [Google Scholar] [CrossRef] [PubMed]
  29. Palacio, L.C.; Durango-Giraldo, G.; Zapata-Hernandez, C.; Santa-González, G.A.; Uribe, D.; Saiz, J.; Buitrago-Sierra, R.; Tobón, C. Characterization of airborne particulate matter and its toxic and proarrhythmic effects: A case study in Aburrá Valley, Colombia. Environ. Pollut. 2023, 336, 122475. [Google Scholar] [CrossRef]
  30. Ohlwein, S.; Kappeler, R.; Joss, M.K.; Künzli, N.; Hoffmann, B. Health effects of ultrafine particles: A systematic literature review update of epidemiological evidence. Int. J. Public Health 2019, 64, 547–559. [Google Scholar] [CrossRef]
  31. Cassee, F.; Morawska, L.; Peters, A. Ambient Ultrafine Particles: Evidence for Policy Makers. October 2019. Available online: https://www.helmholtz-muenchen.de/epi (accessed on 13 December 2024).
  32. Moreno-Ríos, A.L.; Tejeda-Benítez, L.P.; Bustillo-Lecompte, C.F. Sources, characteristics, toxicity, and control of ultrafine particles: An overview. Geosci. Front. 2022, 13, 101147. [Google Scholar] [CrossRef]
  33. Faruqui, N.; Orell, S.; Dondi, C.; Leni, Z.; Kalbermatter, D.M.; Gefors, L.; Rissler, J.; Vasilatou, K.; Mudway, I.S.; Kåredal, M.; et al. Differential Cytotoxicity and Inflammatory Responses to Particulate Matter Components in Airway Structural Cells. Int. J. Mol. Sci. 2025, 26, 830. [Google Scholar] [CrossRef]
  34. Yan, Z.; Ge, P.; Lu, Z.; Liu, X.; Cao, M.; Chen, W.; Chen, M. The Cytotoxic Effects of Fine Particulate Matter (PM2.5) from Different Sources at the Air–Liquid Interface Exposure on A549 Cells. Toxics 2024, 12, 21. [Google Scholar] [CrossRef]
  35. Secretaría Distrital de Ambiente. Inventario Bogotá: RMCAB Junio 2017. Available online: https://inventariobogota.sdp.gov.co/estudios/informe-mensual-calidad-del-aire-rmcab-junio-de-2017 (accessed on 27 April 2025).
  36. Secretaría Distrital de Ambiente. Informe Mensual Calidad del Aire en Bogotá Octubre 2017. Bogotá. October 2017. Available online: http://rmcab.ambientebogota.gov.co/Pagesfiles/IM1710%20Informe%20mensual%20calidad%20del%20aire%20Octubre%202017.pdf (accessed on 27 April 2025).
  37. IDEAM. Informe del estado de la calidad del aire en Colombia. Bogotá, 2017. Available online: https://www.ideam.gov.co/sala-de-prensa/informes/Estado%20de%20la%20calidad%20del%20aire (accessed on 27 April 2025).
  38. IDEAM. Informe del Estado de la Calidad del aire en Colombia: 2022. Bogotá, 2022. Available online: https://www.ideam.gov.co/sala-de-prensa/informes/Estado%20de%20la%20calidad%20del%20aire (accessed on 27 April 2025).
  39. DEKATI. ELPI+ User Manual; DEKATI: Kangasala, Finland, 2011. [Google Scholar]
  40. Järvinen, A.; Aitomaa, M.; Rostedt, A.; Keskinen, J.; Yli-Ojanperä, J. Calibration of the new electrical low pressure impactor (ELPI+). J. Aerosol Sci. 2014, 69, 150–159. [Google Scholar] [CrossRef]
  41. Blanco, K. Caracterización de la Distribución de Tamaño de Partícula Del Material Particulado Presente en Aire Ambiente en Dos Puntos de Bogotá; Universidad Nacional de Colombia: Bogotá, Colombia, 2023. [Google Scholar]
  42. Saha, C.; Irvin, J.H. Real-time aerosol measurements in pilot scale coal fired post-combustion CO2 capture. J. Aerosol Sci. 2017, 104, 43–57. [Google Scholar] [CrossRef]
  43. Lady Mateus-Fontecha. Aerosol Size Distribution and Size Resolved Composition in Urban Areas of Colombia; Universidad Nacional de Colombia: Bogotá, Colombia, 2023. [Google Scholar]
  44. ICPR. Human Respiratory Tract Model for Radiological Protection; ICPR: Kolkata, India, 1994; Volume 24. [Google Scholar]
  45. NIST. Engineering Statistics. Available online: https://www.itl.nist.gov/div898/handbook/index.htm (accessed on 28 April 2024).
  46. Universidad Pontifica Bolivariana. Sobre la Ciudad. Available online: https://www.upb.edu.co/es/universidad/nuestro-campus/sobre-la-ciudad/palmira#:~:text=Cuenta%20con%20una%20superficie%20de,fr%C3%ADo%20y%20288%2C%20al%20p%C3%A1ramo (accessed on 10 December 2024).
  47. Alcaldía de Palmira. Diagnóstico 3. DIMENSIÓN ECONÓMICA. 2021. Available online: https://palmira.gov.co/planeacion/wp-content/uploads/pot/potmoderno/3.%20DimensionEconomica.pdf (accessed on 18 January 2025).
  48. Kwon, H.-S.; Ryu, M.H.; Carlsten, C. Ultrafine particles: Unique physicochemical properties relevant to health and disease. Exp. Mol. Med. 2020, 52, 318–328. [Google Scholar] [CrossRef]
  49. Kammer, J.; Simon, L.; Ciuraru, R.; Petit, J.-E.; Lafouge, F.; Buysse, P.; Bsaibes, S.; Henderson, B.; Cristescu, S.M.; Durand, B.; et al. New particle formation at a peri-urban agricultural site. Sci. Total. Environ. 2023, 857, 159370. [Google Scholar] [CrossRef]
  50. Dattamudi, S.; Wang, J.J.; Dodla, S.K.; DeLaune, R.; Hiscox, A.; Viator, H.; Jeong, C. Mass concentration and size distribution of particles released from harvesting and biomass burning of sugarcane. Agric. Environ. Lett. 2020, 5, e20028. [Google Scholar] [CrossRef]
  51. Le Blond, J.S.; Woskie, S.; Horwell, C.J.; Williamson, B.J. Particulate matter produced during commercial sugarcane harvesting and processing: A respiratory health hazard? Atmos. Environ. 2017, 149, 34–46. [Google Scholar] [CrossRef]
  52. Li, Q.-Q.; Guo, Y.-T.; Yang, J.-Y.; Liang, C.-S. Review on main sources and impacts of urban ultrafine particles: Traffic emissions, nucleation, and climate modulation. Atmos. Environ. X 2023, 19, 100221. [Google Scholar] [CrossRef]
  53. Al-Dabbous, A.N.; Kumar, P. Source apportionment of airborne nanoparticles in a Middle Eastern city using positive matrix factorization. Environ. Sci. Process Impacts 2015, 17, 802–812. [Google Scholar] [CrossRef]
  54. Kumar, P.; Morawska, L.; Birmili, W.; Paasonen, P.; Hu, M.; Kulmala, M.; Harrison, R.M.; Norford, L.; Britter, R. Ultrafine particles in cities. Environ. Int. 2014, 66, 1–10. [Google Scholar] [CrossRef]
  55. Ahlm, L.; Liu, S.; Day, D.A.; Russell, L.M.; Weber, R.; Gentner, D.R.; Goldstein, A.H.; DiGangi, J.P.; Henry, S.B.; Keutsch, F.N.; et al. Formation and growth of ultrafine particles from secondary sources in Bakersfield, California. J. Geophys. Res. Atmos. 2012, 117, 1–13. [Google Scholar] [CrossRef]
  56. Vratolis, S.; Gini, M.; Bezantakos, S.; Stavroulas, I.; Kalivitis, N.; Kostenidou, E.; Louvaris, E.; Siakavaras, D.; Biskos, G.; Mihalopoulos, N.; et al. Particle number size distribution statistics at City-Centre Urban Background, urban background, and remote stations in Greece during summer. Atmos. Environ. 2019, 213, 711–726. [Google Scholar] [CrossRef]
  57. Giemsa, E.; Soentgen, J.; Kusch, T.; Beck, C.; Münkel, C.; Cyrys, J.; Pitz, M. Influence of Local Sources and Meteorological Parameters on the Spatial and Temporal Distribution of Ultrafine Particles in Augsburg, Germany. Front. Environ. Sci. 2021, 8, 609846. [Google Scholar] [CrossRef]
  58. Secretaría Distrital de Ambiente. Informe Anual de Calidad Del Aire de Bogotá: 2017; Secretaría Distrital de Ambiente: Bogotá, Colombia, 2018. Available online: http://rmcab.ambientebogota.gov.co/Pagesfiles/180601_Informe%20Anual%202017_V6.pdf (accessed on 28 April 2025).
  59. Ning, Z.; Sioutas, C. Atmospheric processes influencing aerosols generated by combustion and the inference of their impact on public exposure: A review. Aerosol Air Qual. Res. 2010, 10, 43–58. [Google Scholar] [CrossRef]
  60. Wang, Q.; Wang, P.; Chen, H.; Ma, J.; Jia, Y.; Wang, C.; Qiao, L.; Fu, Q.; Mellouki, A.; Li, L. Unraveling Contributions from Combustion, Secondary, Traffic, and Dust Sources through Particle Mass Size Distribution Measurement. Aerosol Air Qual. Res. 2024, 24, 240135. [Google Scholar] [CrossRef]
  61. Franco, S.; Zuluaga, D.; Agudelo, J.; Botero, M. Temporary Variation of The Particle Number Concentration of Ultrafine Particles In Medellín, Colombia. Memorias Casap IX. Available online: https://www.researchgate.net/publication/382145205_TEMPORARY_VARIATION_OF_THE_PARTICLE_NUMBER_CONCENTRATION_OF_ULTRAFINE_PARTICLES_IN_MEDELLIN_COLOMBIA (accessed on 15 December 2024).
  62. Fung, P.L.; Zaidan, M.A.; Niemi, J.V.; Saukko, E.; Timonen, H.; Kousa, A.; Kuula, J.; Rönkkö, T.; Karppinen, A.; Tarkoma, S.; et al. Input-adaptive linear mixed-effects model for estimating alveolar lung-deposited surface area (LDSA) using multipollutant datasets. Atmos. Meas. Tech. 2022, 22, 1861–1882. [Google Scholar] [CrossRef]
  63. Belkacem, I.; Khardi, S.; Helali, A.; Slimi, K.; Serindat, S. The influence of urban road traffic on nanoparticles: Roadside measurements. Atmos. Environ. 2020, 242, 117786. [Google Scholar] [CrossRef]
  64. Reche, C.; Viana, M.; Brines, M.; Pérez, N.; Beddows, D.; Alastuey, A.; Querol, X. Determinants of aerosol lung-deposited surface area variation in an urban environment. Sci. Total Environ. 2015, 517, 38–47. [Google Scholar] [CrossRef]
  65. Kuuluvainen, H.; Rönkkö, T.; Järvinen, A.; Saari, S.; Karjalainen, P.; Lähde, T.; Pirjola, L.; Niemi, J.V.; Hillamo, R.; Keskinen, J. Lung deposited surface area size distributions of particulate matter in different urban areas. Atmos. Environ. 2016, 136, 105–113. [Google Scholar] [CrossRef]
  66. Abdillah, S.F.; Wang, Y.-F. Ambient ultrafine particle (PM0.1): Sources, characteristics, measurements and exposure implications on human health. Environ. Res. 2023, 218, 115061. [Google Scholar] [CrossRef]
  67. Bergmann, M.L.; Andersen, Z.J.; Massling, A.; Kindler, P.A.; Loft, S.; Amini, H.; Cole-Hunter, T.; Guo, Y.; Maric, M.; Nordstrøm, C.; et al. Short-term exposure to ultrafine particles and mortality and hospital admissions due to respiratory and cardiovascular diseases in Copenhagen, Denmark. Environ. Pollut. 2023, 336, 122396. [Google Scholar] [CrossRef] [PubMed]
  68. Zhang, J.; Chen, Z.; Shan, D.; Wu, Y.; Zhao, Y.; Li, C.; Shu, Y.; Linghu, X.; Wang, B. Adverse effects of exposure to fine particles and ultrafine particles in the environment on different organs of organisms. J. Environ. Sci. 2024, 135, 449–473. [Google Scholar] [CrossRef]
  69. Chang, P.-K.; Griffith, S.M.; Chuang, H.-C.; Chuang, K.-J.; Wang, Y.-H.; Chang, K.-E.; Hsiao, T.-C. Particulate matter in a motorcycle-dominated urban area: Source apportionment and cancer risk of lung deposited surface area (LDSA) concentrations. J. Hazard. Mater. 2022, 427, 128188. [Google Scholar] [CrossRef] [PubMed]
  70. Asbach, C.; Fissan, H.; Stahlmecke, B.; Kuhlbusch, T.A.J.; Pui, D.Y.H. Conceptual limitations and extensions of lung-deposited Nanoparticle Surface Area Monitor (NSAM). J. Nanopart. Res. 2009, 11, 101–109. [Google Scholar] [CrossRef]
  71. Brown, D.M.; Wilson, M.R.; MacNee, W.; Stone, V.; Donaldson, K. Size-dependent proinflammatory effects of ultrafine polystyrene particles: A role for surface area and oxidative stress in the enhanced activity of ultrafines. Toxicol. Appl. Pharmacol. 2001, 175, 191–199. [Google Scholar] [CrossRef]
  72. Oberdörster, G.; Oberdörster, E.; Oberdörster, J. Nanotoxicology: An emerging discipline evolvingfrom studies of ultrafine particles. Environ. Health Perspect. 2005, 113, 823–839. [Google Scholar] [CrossRef]
  73. Zhang, Z.H.; Hartner, E.; Utinger, B.; Gfeller, B.; Paul, A.; Sklorz, M.; Czech, H.; Yang, B.X.; Su, X.Y.; Jakobi, G. Are reactive oxygen species (ROS) a suitable metric to predict toxicity of carbonaceous aerosol particles? Atmos. Chem. Phys. 2022, 22, 1793–1809. [Google Scholar] [CrossRef]
  74. International Commission on Radiological Protection: Annals of the ICRP. 2015. Available online: www.icrp.org (accessed on 27 April 2025).
Figure 1. Geographic location of Colombia and monitoring points in Bogotá, Palmira, and Cali.
Atmosphere 16 00558 g001
Figure 2. Descriptive statistics of PNC in Las Ferias (FER) sampling 23/6/2017–5/7/2017, San Cristóbal (SCR) sampling 27/9/2017–10/10/2017, Palmira (PAL) sampling 14/8/2018–16/9/2018, and Cali (CAL) sampling 25/3/2023–29/3/2023. The red dots are the maximum values, the blue dots are the mean values, and the black dots are the minimum values.
Atmosphere 16 00558 g002
Figure 3. Average diel cycle of UFP concentration at four monitoring sites.
Atmosphere 16 00558 g003
Figure 4. Particle number and mass distribution in urban and suburban stations in Colombia. The shaded area represents the particle mass size distribution (PMSD), while the line represents the particle number size distribution (PNSD).
Atmosphere 16 00558 g004
Figure 5. Average diel cycle of PNSD at different locations.
Atmosphere 16 00558 g005
Figure 6. Polar plot of average PNCs, in Cali (CAL), Las Ferias (FER), Palmira (PAL), and San Cristóbal (SCR).
Atmosphere 16 00558 g006
Figure 7. Spearman correlation between meteorological variables and PNCs.
Atmosphere 16 00558 g007
Figure 8. Variation in LDSA distribution with aerodynamic diameter.
Atmosphere 16 00558 g008
Figure 9. Average diel cycle of LDSA concentration in three Colombian cities.
Atmosphere 16 00558 g009
Table 1. General information on monitoring campaigns.
City—Monitoring LocationPopulation (Millions of Inhabitants)Temperature a (°C)Precipitation b (mm)PM2.5 c (µg m−3)Zone ClassificationDates
Bogotá—Ferias (FER)7.913.179713 (FER)—13 (SCR)Urban Traffic23/6/2017–5/7/2017
Bogotá—San Cristóbal (SCR)Urban Background27/9/2017–10/10/2017
Palmira (PAL)0.3523.589420Urban–Industrial14/8/2018–16/9/2018
Cali (CAL)2.323.9148314 Urban Background25/3/2023–29/3/2023
a Average air temperature in each city, b accumulated annual precipitation in each city, c average of PM2.5 for the study period at Bogotás’s site, and annual average of PM2.5 at Palmira and Cali.
Table 2. Conversion vectors used to calculate current, number, diameter, area, volume, and mass from the charge detected by the electrometer in each ELPI+ stage.
Conversion Vectors1234567891011121314
Cutting diameter Di (µm)0.010.0230.0380.0710.110.200.310.480.761.231.953.105.188.16
Aerodynamic Diameter
D 50% (µm)
0.0060.0170.030.060.1080.170.260.40.6411.62.54.46.8
Current dI/dlogDp [fA]2.284.513.314.4354.474.356.134.865.284.435.684.494.495.84
Number dN/dlogDp [1/cm3]476.81345.44114.5068.7434.9917.1113.246.003.571.591.110.480.240.17
Diameter dD/dlogDp [µm/cm3]4.747.364.464.914.193.454.202.912.731.962.171.481.261.41
Area dA/dlogDp [µm2/cm3]0.150.490.551.101.582.194.194.446.567.6113.3714.4220.4436.20
Volume dV/dlogDp [µm3/cm3]0.000.000.000.010.030.070.220.360.841.564.377.4617.6649.23
Mass dM/dlogDp [mg/m3]0.000.000.000.000.000.000.000.000.000.000.000.010.020.05
Current I [fA]1.001.001.001.001.001.001.001.001.001.001.001.001.001.00
Number N [1/cm3]209.4876.6334.5615.507.833.932.161.230.680.360.200.110.050.03
Diameter D [µm/cm3]2.081.631.351.110.940.790.690.600.520.440.380.330.280.24
Area A [µm2/cm3]0.070.110.160.250.350.500.680.911.241.722.353.224.566.20
Volume V [µm3/cm3]0.000.000.000.000.010.020.040.070.160.350.771.663.948.43
Mass M [mg/m3]0.000.000.000.000.000.000.000.000.000.000.000.000.000.01
Source: Dekati 2011 [39].
Table 3. Distribution of particle size fractions (UFPs, FPs, CPs) for PMSD and PNSD across different locations.
Particle SizeFeriasSan CristóbalPalmiraCali
PMSDPNSDPMSDPNSDPMSDPNSDPMSDPNSD
UFPs0.17%73%0.46%74%0.01%85%0.16%89%
FPs21%27%82%26%6%15%27%11%
CPs78%0%17%0%94%0.12%73%0.01%
Disclaimer/Publisher’s Note: The statements, opinions and data contained in all publications are solely those of the individual author(s) and contributor(s) and not of MDPI and/or the editor(s). MDPI and/or the editor(s) disclaim responsibility for any injury to people or property resulting from any ideas, methods, instructions or products referred to in the content.

