Abstract
The agro-pastoral ecotone of Gansu Province, a critical component of the ecological security barrier in northern China, is characterized by pronounced ecological fragility and climatic sensitivity. Investigating vegetation dynamics in this region is essential for balancing ecological conservation and sustainable development. This study integrated MODIS/NDVI remote sensing data (2000–2020), climate, land, and anthropogenic factors, employing Sen’s slope analysis, coefficient of variation (Cv), Hurst index, geodetector modeling, and partial correlation analysis to systematically unravel the spatio-temporal evolution and driving mechanisms of vegetation coverage. Key findings revealed the following: (1) Vegetation coverage exhibited a significant increasing trend (0.05 decade−1), peaking in 2018 (NDVI = 0.71), with a distinct north–south spatial gradient (lower values in northern areas vs. higher values in southern regions). Statistically significant greening trends (p < 0.05) were observed in 55.42% of the study area. (2) Interannual vegetation fluctuations were generally mild (Cv = 0.15), yet central regions showed 2–3 times higher variability than southern/northwestern areas. Future projections (H = 0.62) indicated sustained NDVI growth. (3) Climatic factors dominated vegetation dynamics, with sunshine hours and precipitation exhibiting the strongest explanatory power (q = 0.727 and 0.697, respectively), while the elevation–precipitation interaction achieved peak explanatory capacity (q = 0.845). (4) NDVI correlated positively with precipitation in 43.62% of the region (rmean = 0.47), whereas average temperature, maximum temperature, ≥10 °C accumulated temperature, and sunshine hours suppressed vegetation growth (rmean = −0.06 to −0.42), confirming precipitation as the primary driver of regional vegetation recovery. The multi-scale analytical framework developed here provides methodological and empirical support for precision ecological governance in climate-sensitive transitional zones, particularly for optimizing ecological barrier functions in arid and semi-arid regions.
1. Introduction
Vegetation, as a core component of terrestrial ecosystems, serves not only as a critical biological regulator sustaining Earth’s life support systems but also as a vital indicator for assessing regional ecological functions and sustainability [1]. Changes in vegetation coverage directly reflect spatio-temporal heterogeneity in ecosystem structure and service capacity, establishing it as a fundamental parameter for quantifying environmental evolution [2,3]. The Normalized Difference Vegetation Index (NDVI), as a ratio-based spectral index, is calculated through the standardized difference between reflectance in the Red band and Near-Infrared (NIR) Radiation band (NDVI = (NIR − Red)/(NIR + Red)), effectively capturing vegetation photosynthetic activity and biomass dynamics [4]. Its core advantages lie in effectively suppressing positively correlated noise, mitigating environmental impacts such as variations in irradiance, cloud shadows, topographic relief, and atmospheric attenuation, while reducing calibration errors and instrumental biases [5]. Compared to other vegetation indices (e.g., Enhanced Vegetation Index (EVI), Soil Adjusted Vegetation Index (SAVI)), NDVI has become the “gold standard” for global or regional vegetation monitoring due to its computational simplicity and strong correlation (R2 ≥ 0.85) with biophysical parameters like Leaf Area Index (LAI) and vegetation coverage. Its long-term data continuity remains irreplaceable in detecting vegetation change trends [6]. Maximum Value Composite (MVC) and radiometric correction are widely applied to mitigate cloud contamination and aerosol effects, ensuring spatio-temporal consistency [5]. In contrast, high-resolution data (e.g., Sentinel-2 with 10 m spatial resolution) can resolve landscape fragmentation and connectivity details, yet their limited temporal resolution challenges long-term analyses, underscoring the necessity for multi-source data fusion [7]. Globally, NDVI-based studies in the Sahel region of Africa have revealed spatial differentiation patterns in vegetation recovery linked to lagged precipitation responses, while MODIS NDVI analyses in the Australian arid zone demonstrate that vegetation dynamics are predominantly driven by extreme drought events [8,9].
The spatio-temporal dynamics of vegetation are synergistically driven by climate–anthropogenic–topographic factors, necessitating multi-scale methodologies to unravel their heterogeneity. Time series decomposition techniques (e.g., Seasonal-Trend decomposition using Loess, STL) disentangle long-term trends, seasonal cycles, and residual anomalies, thereby revealing persistent vegetation patterns and abrupt disturbances [10]. Geostatistical approaches quantify spatial autocorrelation to identify dominant scales of ecological processes [11]. For instance, trend analysis in Africa’s Sahel region identified precipitation as the primary driver of desertification reversal, while in North America’s Corn Belt, the interaction between temperature and cultivation intensity explained 80% of vegetation variability [12,13]. The geodetector model, through factor detection and interaction analysis, effectively deciphers spatial differentiation mechanisms of driving forces. On the Qinghai-Tibet Plateau, elevation and precipitation are the dominant factors driving changes in NDVI, contrasting with the temperature-driven mechanism observed in the Loess Plateau region of China [14,15].
Region-specific drivers exhibit pronounced climatic zonation: Changes in precipitation patterns exert significant impacts on the vegetation of tropical rainforest regions, such as the Amazon Basin [16]. Mid-latitude arid zones (e.g., Iran’s Kavir Desert) face vegetation suppression by extreme temperatures [17], and boreal regions (e.g., Siberian tundra) experience extended growing seasons from warming, yet suffer moisture stress due to premature snowmelt [18]. In the agro-pastoral ecotone of China, the coupling effects of policy interventions and natural factors are particularly pronounced. Globally, socioeconomic drivers exhibit weaker explanatory power in developing nations compared to industrialized countries, likely attributed to disparities in data accuracy and governance efficiency [19].
As a transitional zone between grasslands and croplands, as well as between cultivation and animal husbandry, the agro-pastoral ecotone represents a typical ecologically fragile area and climate-sensitive belt [20]. The Northern Agro-Pastoral Ecotone (NAPE) in China spans 10 provinces, stretching approximately 2300 km in a northeast–southwest orientation. By intercepting 42–68% of windblown sand flux from northwestern deserts, it serves as a critical barrier for regional ecological security [21,22]. However, existing studies predominantly focus on macro-scale analyses of NAPE, while systematic investigations of key mesoscale regions remain insufficient [23,24,25]. Gansu Province, situated at the convergence of three major geomorphic units, exhibits heightened ecosystem sensitivity to climate change due to its complex topography and climatic gradients. Research indicates that the region has experienced a temperature rise exceeding 2 °C over the past 50 years, significantly surpassing the national average. Coupled with declining precipitation trends, this poses severe challenges to vegetation restoration and ecological security [26]. Current studies often employ the CASA model to assess climate-driven responses of net primary productivity (NPP) or utilize MODIS data to analyze spatio-temporal vegetation dynamics in small areas, yet systematic research on vegetation coverage in the agro-pastoral ecotone of Gansu Province remains lacking [27,28]. Existing investigations in this region predominantly concentrate on ecosystem service valuation or climate impacts on agricultural potential, with limited exploration of spatio-temporal heterogeneity in vegetation coverage and its multidimensional driving mechanisms [29,30].
The implementation of ecological restoration projects such as the “Grain for Green Program” has markedly improved regional vegetation conditions in recent decades. Nevertheless, frequent droughts, soil erosion, and desertification continue to threaten ecological security. As a pilot zone for ecological protection and compensation, this region urgently requires clarification of multidimensional drivers of vegetation dynamics to inform sustainable development strategies. This study systematically investigates the spatio-temporal evolution patterns and driving mechanisms of vegetation coverage in the agro-pastoral ecotone of Gansu Province using MODIS NDVI data (2000–2020), integrated with climatic, land, and anthropogenic factors. Specific objectives include the following: (1) characterizing spatio-temporal dynamics of growing season (May–September) vegetation coverage; (2) predicting future trends through stability diagnostics and Hurst index analysis; (3) quantifying contributions of climatic, land-use, and anthropogenic factors to NDVI variations using geographical detectors, while revealing key factor interactions; (4) identifying dominant climatic drivers of NDVI spatial differentiation through partial correlation analysis. The findings provide methodological support for optimizing ecological barrier functions in arid–semiarid regions and hold significant scientific value for guiding ecological restoration and coordinated agro-pastoral development under climate change.
2. Materials and Methods
2.1. Study Area
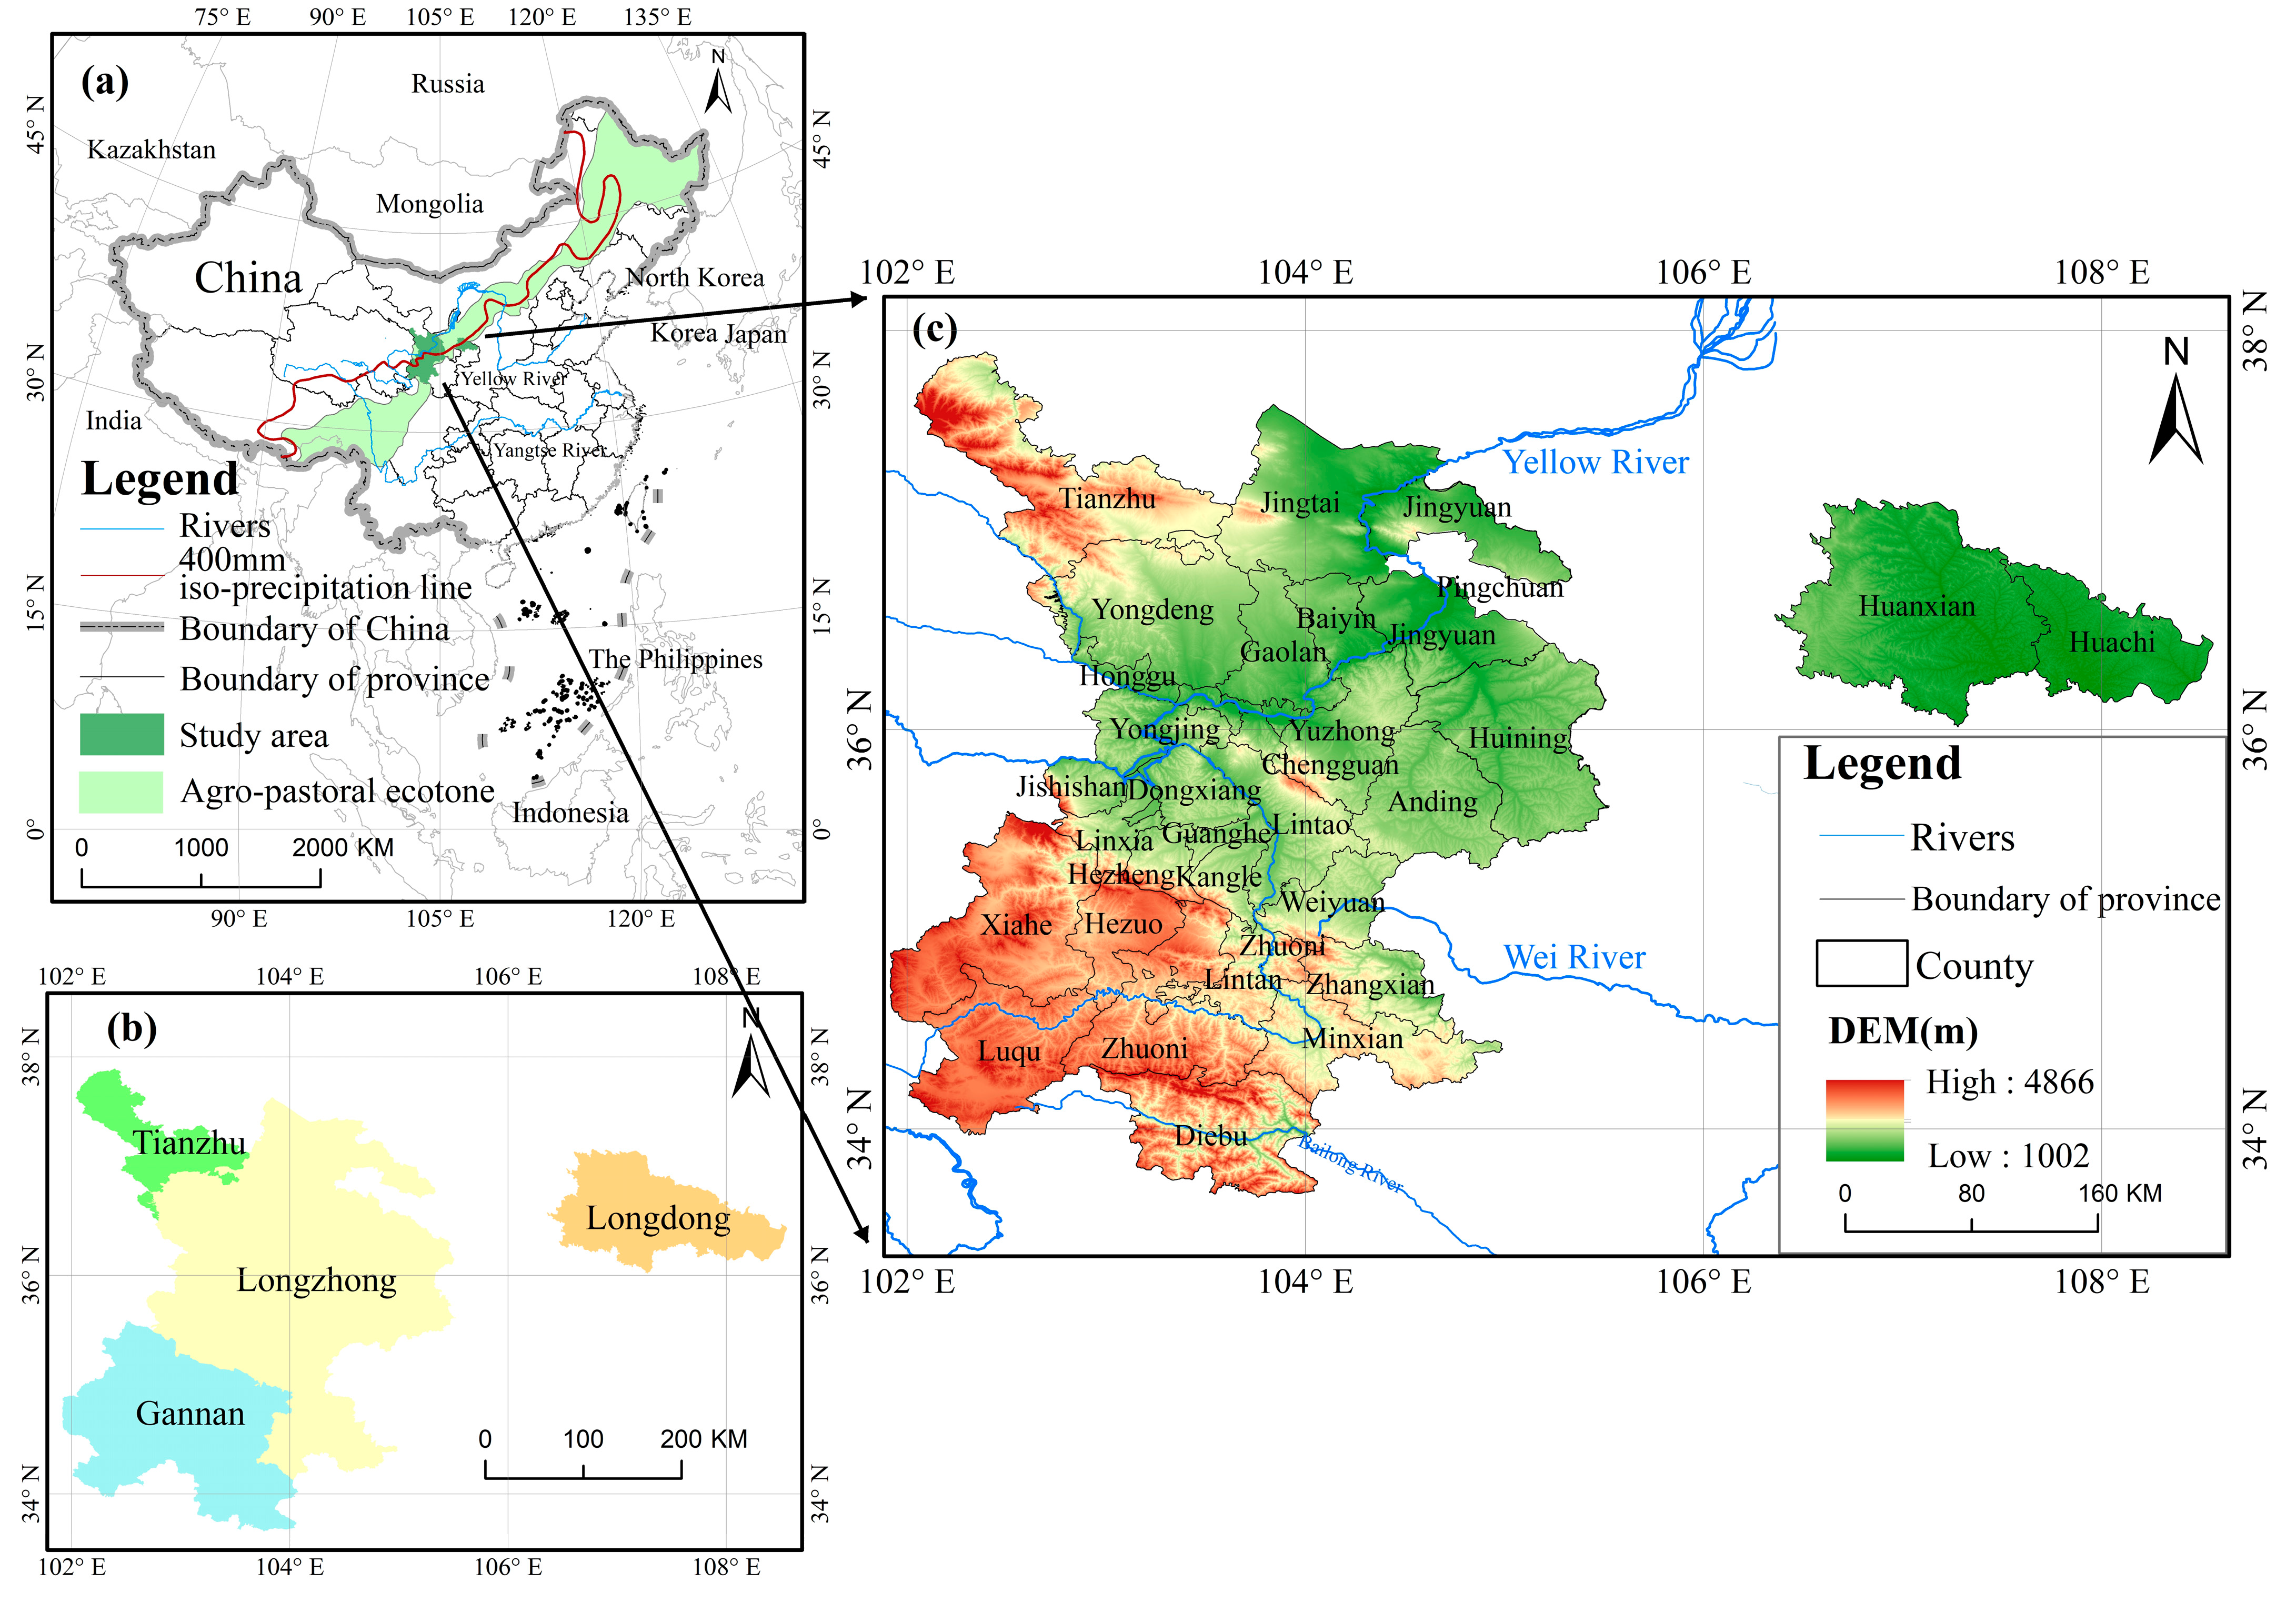
The agro-pastoral ecotone in Gansu Province (33°40′–37°54′ N, 101°55′–108°34′ E) is situated at the transitional convergence zone of the Qinghai-Tibet Plateau, Inner Mongolia Plateau, and Loess Plateau (Figure 1a). The study area spans central-eastern Gansu, encompassing 34 counties within 7 prefectures (Lanzhou, Dingxi, Baiyin, Linxia, Wuwei, Qingyang, and Gannan), with a total area of 9.73 × 10⁴ km2 (21.34% of the province’s land area) [26,31]. Influenced by geographical heterogeneity, the region is further divided into four subzones: Longzhong, Longdong, Gannan, and Tianzhu (Figure 1b). Key climatic, topographical, and socioeconomic characteristics of the study area are summarized in Table 1 [32,33].

Figure 1.
Location of the study area. (a) The geospatial positioning, (b) Spatial distribution of the four main zones, (c) Digital Elevation Model (DEM) illustrating the study area’s terrain.

Table 1.
Key Characteristics of the Study Area.
2.2. Data Sources and Processing
The study is based on time-series data from 2000 to 2020, integrating multi-dimensional datasets including multi-source remote sensing images (MODIS NDVI), climate, land, and anthropogenic factors (Table 2). It systematically analyzes the spatio-temporal evolution characteristics of vegetation coverage and its driving mechanisms in the agro-pastoral ecotone of Gansu Province.
Table 2.
Data sources (All data accessed on 1 February 2024).
2.3. Research Methods
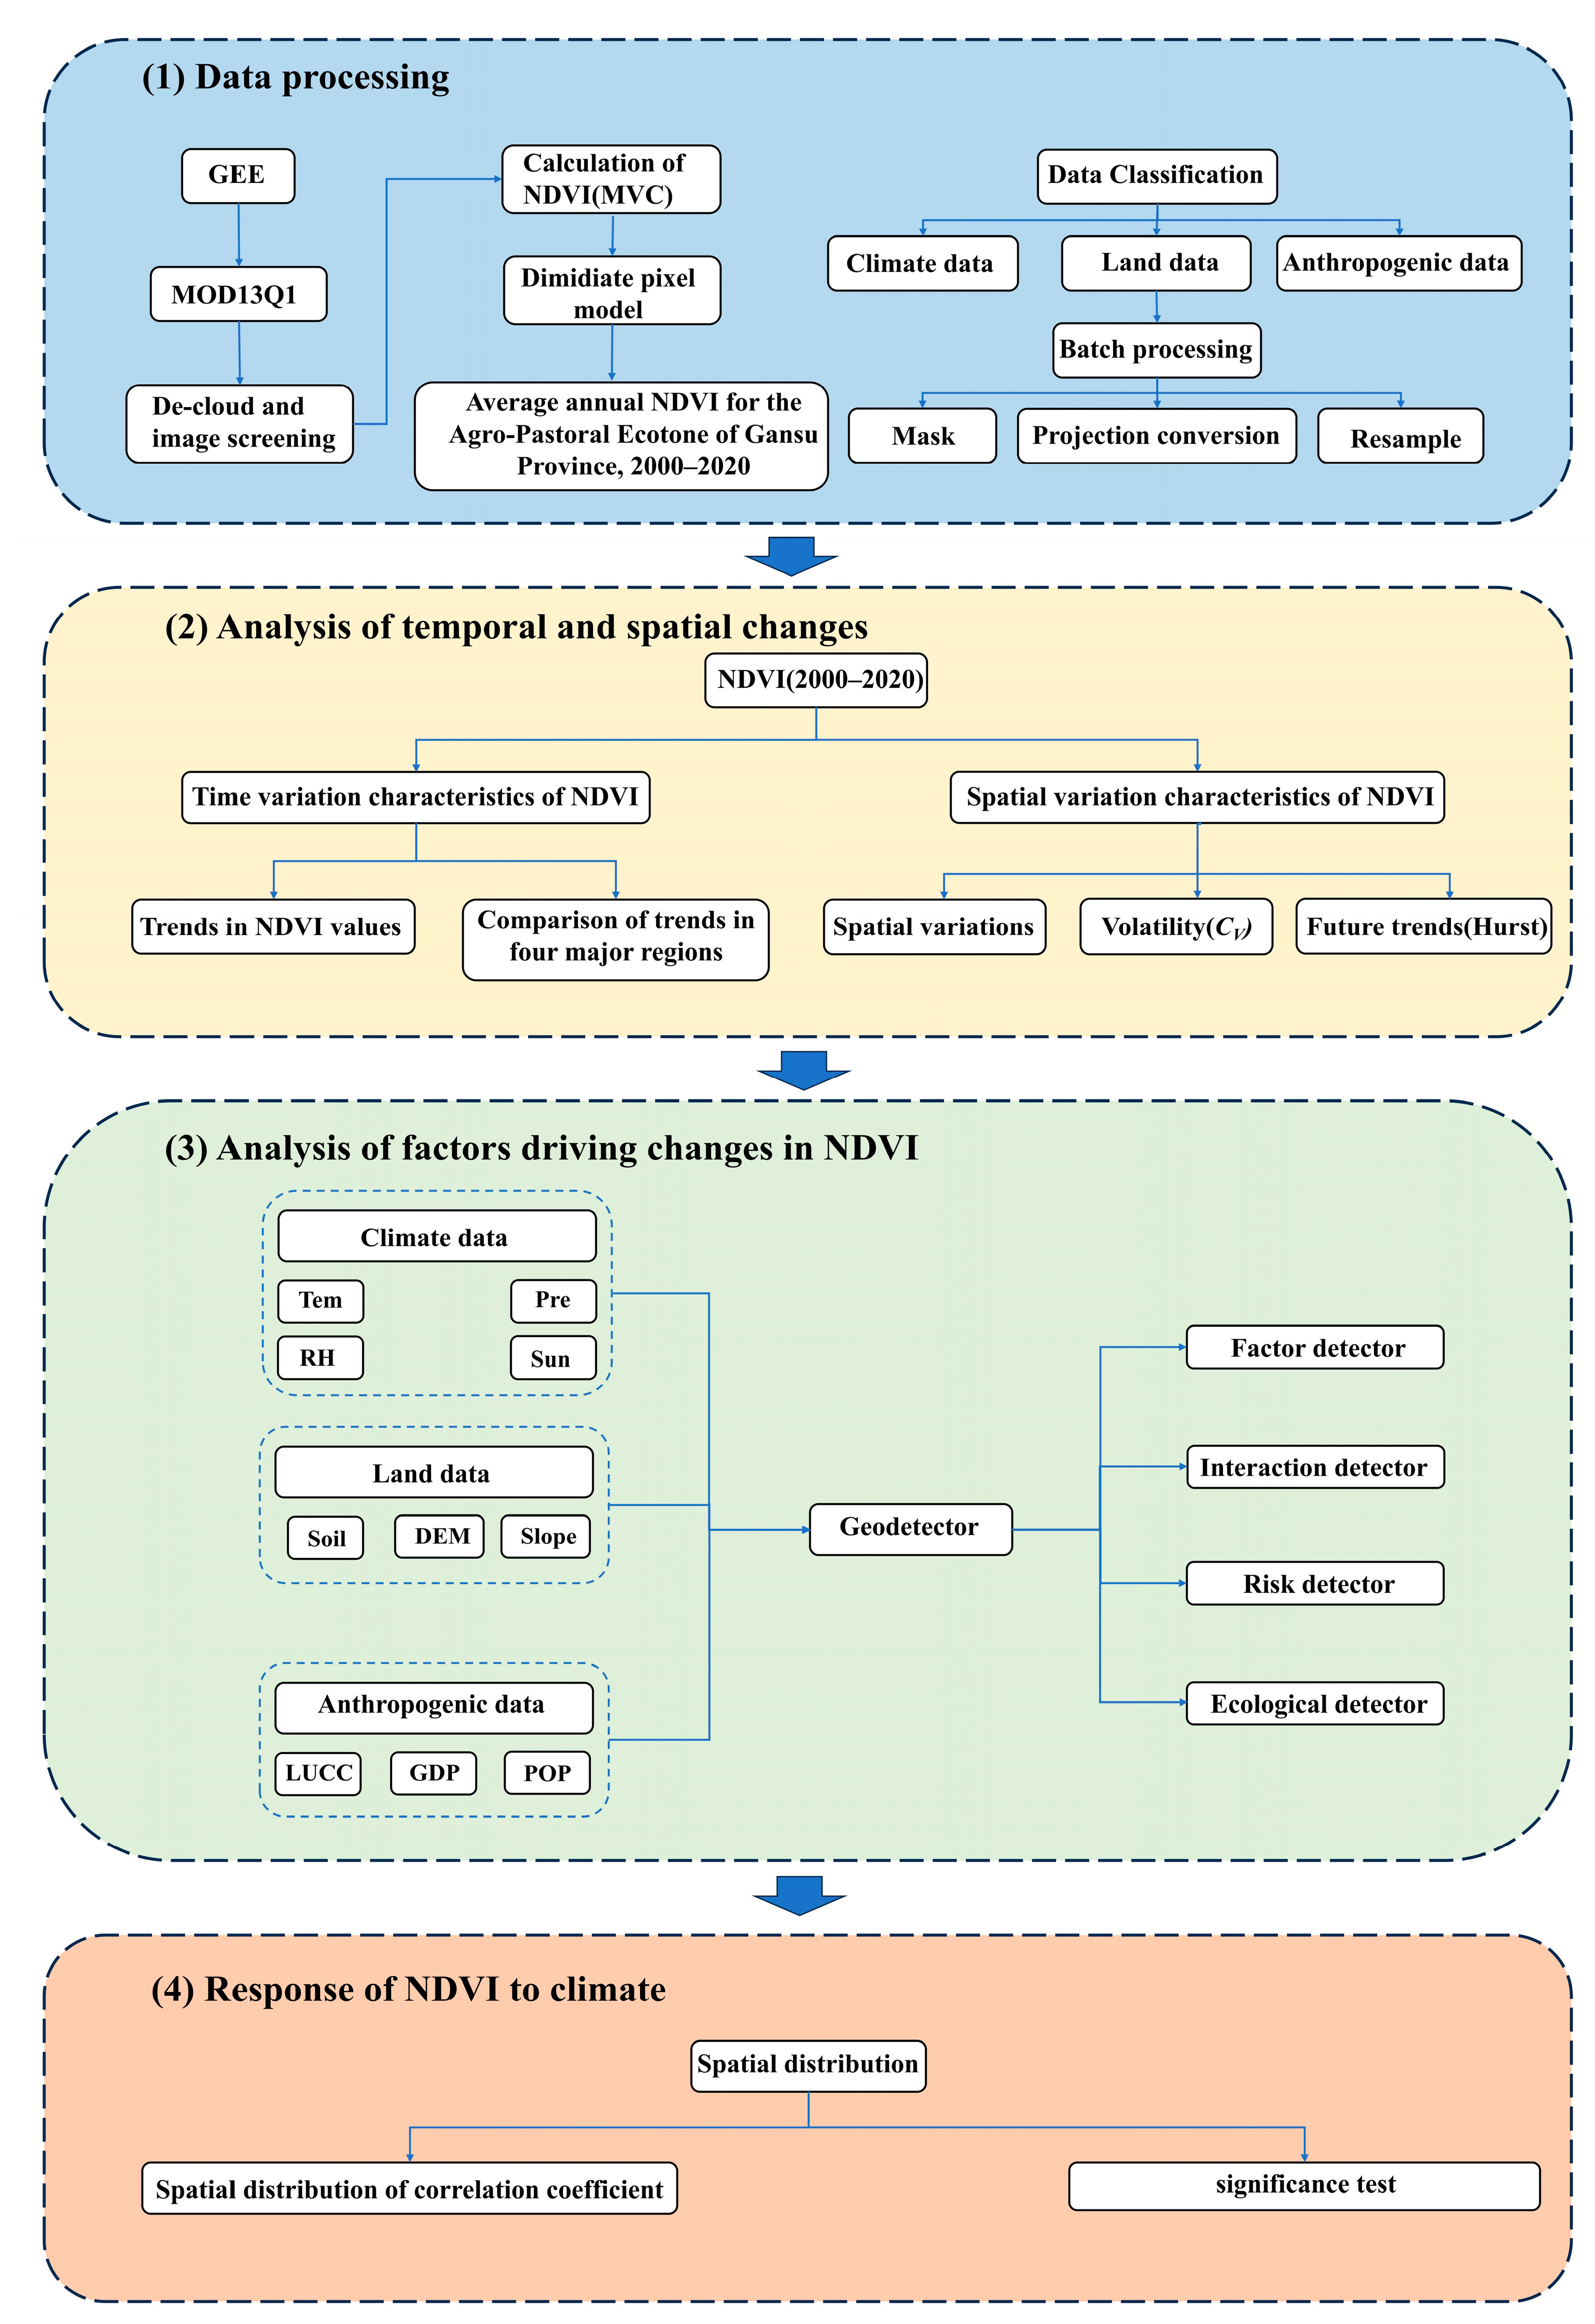
The technical approach and research framework adopted in this study are illustrated in Figure 2. The MODIS data utilized were processed through the Quality Assessment (QA) layers to screen high-confidence data. Additionally, the 6S radiative transfer model was applied for atmospheric correction, effectively eliminating cloud contamination and aerosol interference. First, the original images were preprocessed for mosaicking, projection conversion, and formatting based on MODIS image data and the MRT projection tool [34]. Subsequently, QGIS (version 3.34) software was used to clip the images and obtain NDVI data for the study area. To effectively mitigate thin clouds and transient noise, the Maximum Value Composite (MVC) method was employed to generate monthly NDVI datasets, which were further applied to derive annual maximum NDVI datasets for the growing season (May–September). For temporal analysis, the Sen’s slope estimator was used to quantify interannual trends in vegetation cover, combined with the Mann–Kendall nonparametric test to assess the statistical significance of these trends. The coefficient of variation was adopted to characterize the fluctuation degree of vegetation cover, and the Hurst index was applied to predict future development trends. Regarding meteorological data processing, daily observation data from 63 meteorological stations within and around the study area were interpolated monthly for precipitation, temperature, and sunshine duration using ANUSPLIN (version 4.4) software with BVTPS and TVPTPS models, ultimately synthesizing annual-scale meteorological raster datasets. To analyze in depth the driving mechanisms of NDVI spatio-temporal variations, the study selected 13 driving factors, including climate, land, and human activities. The geographic detector method was employed to quantitatively identify the dominant factors of NDVI spatial differentiation, while factor detection and interaction detection were used to quantify the influence of individual factors and their combinations on NDVI. Specifically for climatic factors, spatial correlation analysis and significance tests were further conducted. During data processing and analysis, R/Python (version performed statistical computations and visualizations (R ggplot2 for factor explanatory power matrices and NDVI temporal trend plots, QGIS for spatial data processing and thematic map generation). All statistical analyses were implemented and validated using Python (version 3.12) to ensure the reproducibility of the research findings.
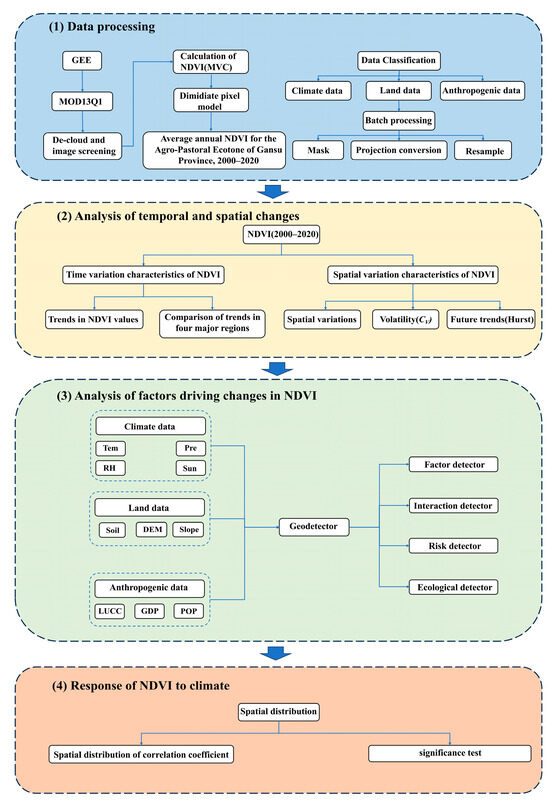
Figure 2.
Flowchart of technical route.
2.3.1. Trend Analysis and Verification
This study employed Sen’s trend analysis and the Mann–Kendall test to conduct pixel-wise trend analysis and significance testing on the time series of NDVI during vegetation growing seasons and meteorological elements. Based on the overall trend analysis, dividing the time period into 2000–2007, 2007–2014, and 2014–2020 presents vegetation with relatively unique changing trends or patterns during these time periods. The combination of the two methods effectively mitigated the impacts of measurement errors and outliers on the results [35].
The formula for calculating Sen’s slope is as follows:
where β characterizes the interannual vegetation dynamics trend during the growing season, and xi and xj denote paired NDVI observations at temporal indices i and j, respectively. β > 0 signifies a statistically significant upward trend in the NDVI, whereas a negative slope denotes a persistent decline in vegetation greenness over the observed temporal span.
The Mann–Kendall test was employed to assess the statistical significance of the detected trend, with the test statistic (Z) calculated as follows:
wherein
Let S denote the test statistic, Z denote normalized test statistic, xj and xi represent time series data, n indicate the length of the temporal sequence. When the series exceeds a critical threshold (n ≥ 8), the distribution of S converges asymptotically toward normality, with the population variance (Var(S)) calculated as follows:
Standardized Z is a standard normal distribution, when |Z| > Z1−α/22, it indicates that the trend change is significant. Z1−α/2 is the value corresponding to the distribution of the standard normal distribution function at the significance level α. The temporal trajectories of NDVI dynamics were stratified into six statistically distinct categories based on the values of β and |Z| (Table 3).
Table 3.
Classification of inspection grades of NDVI change trend.
2.3.2. Coefficient of Variation
The coefficient of variation (Cv) is widely used in spatial heterogeneity analysis to characterize the temporal instability of geographic data [36]. A higher Cv value indicates more significant regional ecological vulnerability, reflecting greater intensity of vegetation disturbance and lower stability. The calculation formula is as follows:
2.3.3. Hurst Index
The Hurst exponent derived from rescaled range (R/S) analysis quantifies long-range dependence in time series data, enabling prediction of the future development trend in both univariate temporal sequences and multivariate spatio-temporal processes [37]. The calculation principle is as follows:
For any positive integer m, formulate the temporal subsequence:
- (1)
- Differential sequence
- (2)
- Mean sequence
- (3)
- Accumulated deviation
- (4)
- Range
- (5)
- Standard deviation
For the ratio R(m)/S(m) ≌ R/S, if there exists R/S∝mH, it indicates the presence of the Hurst phenomenon in the time series, where H denotes the Hurst exponent. The value of H can be obtained via least squares fitting based on log(R/S)n= a + H × log(n).
The Hurst exponent (H) quantitatively characterizes the persistence properties of the NDVI time series through three distinct regimes:
(1) When H = 0.5, the series exhibits characteristics of an uncorrelated random walk without long-range dependence.
(2) Values in the range 0 < H < 0.5 indicate anti-persistent behavior, where future fluctuations tend to reverse past trends (diminishing volatility).
(3) Values exceeding 0.5 (H > 0.5) demonstrate persistent dynamics, reflecting trend reinforcement where future changes maintain the directionality of historical patterns. The strength of persistence shows monotonic dependence on H magnitude: maximum persistence occurs as H approaches 1, whereas strongest anti-persistence emerges when H nears 0.
2.3.4. Geodetector
The geodetector method constitutes a spatially explicit analytical framework grounded in variance decomposition theory, which quantitatively characterizes spatial heterogeneity patterns and disentangles driving mechanisms by assessing factor-induced stratification consistency (Table 4). Its distinctive strength lies in detecting interactions between two factors affecting the dependent variable, while quantifying both the magnitude of these interactions and their linear and nonlinear components [38].
Table 4.
Role of the different modules of the Geodetector.
2.3.5. Partial Correlation Analysis
Pearson’s correlation coefficient method was employed to assess the relationship between vegetation cover and meteorological factors, with statistical significance testing conducted. The formula is expressed as follows:
In the equation, r denotes the correlation coefficient between variables x and y, where xi and yi represent the NDVI value during the growing season at time i and the corresponding meteorological factor value at the same time i, respectively. Additionally, , indicate the average NDVI over the entire growing season and the mean meteorological factor during the concurrent period, respectively. The significance levels of regression coefficients and correlation coefficients (α = 0.01 and α = 0.05) are combined to perform significance tests on the correlation between NDVI during the growing season and the major meteorological factors during the same period [4]. The method for distinguishing trend significance is shown in Table 5.
Table 5.
Classifying the trends of NDVI and meteorological factors and their correlation test.
3. Results
3.1. Time Variation Characteristics of NDVI
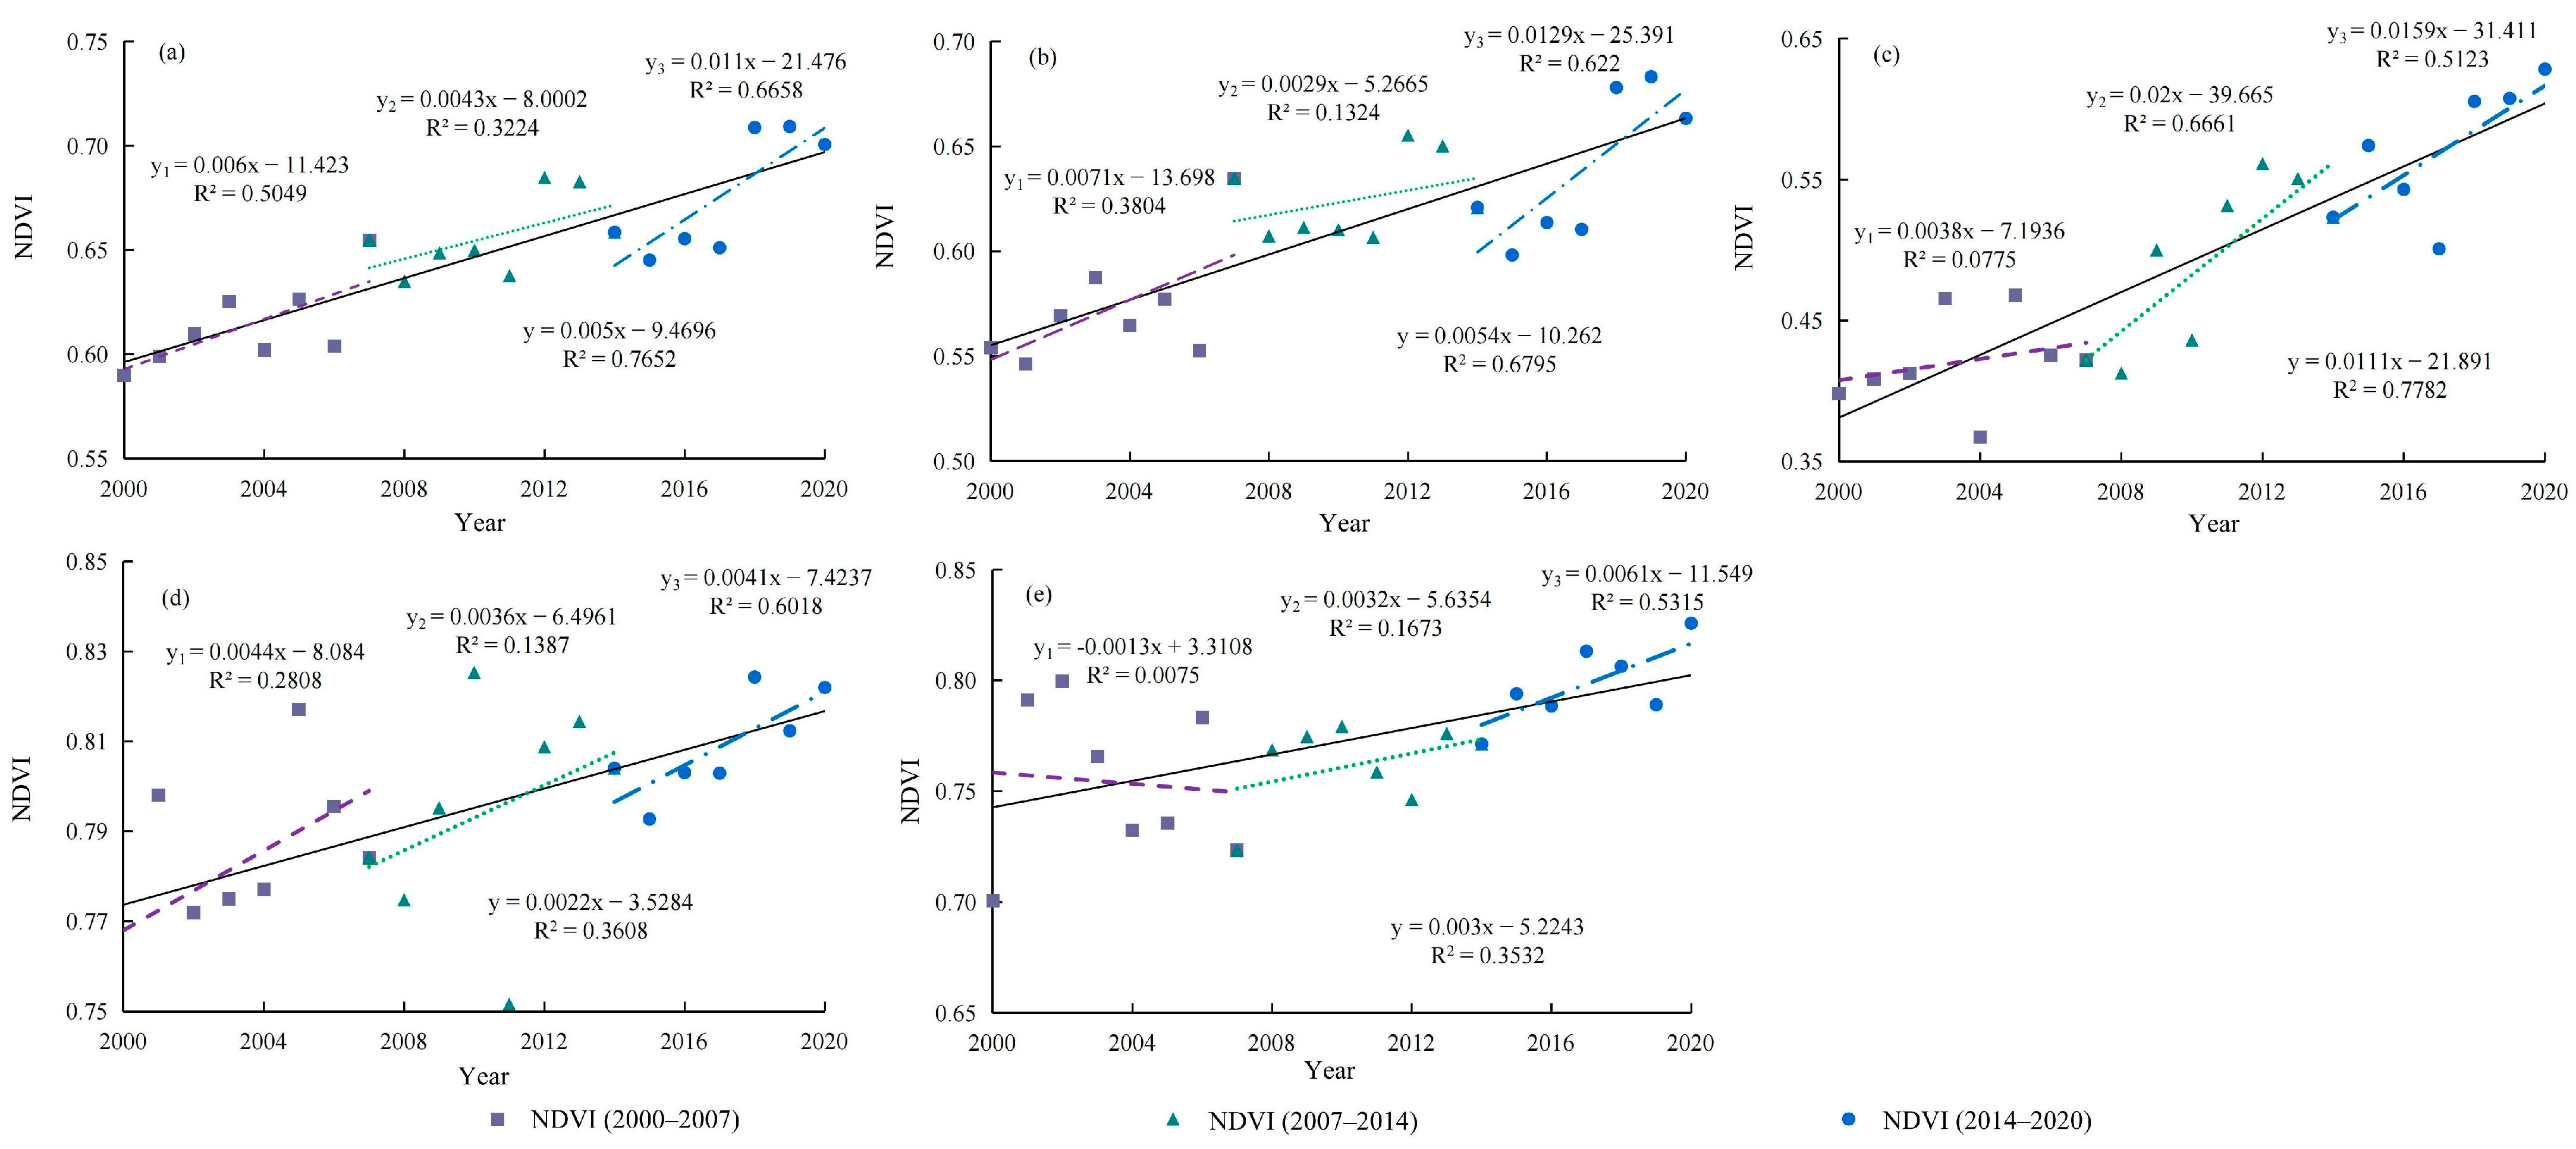
From 2000 to 2020, the NDVI in the agro-pastoral ecotone of Gansu Province generally showed a fluctuating upward trend (Figure 3). The annual mean NDVI was 0.63, peaking in 2018 (0.71) and reaching its minimum in 2000 (0.59), a pattern directly attributable to the climatic conditions prevailing during those periods. There was a degradation phenomenon from 2012 to 2015, and a varying degree of improvement trend was observed after 2015. Vegetation coverage and its spatio-temporal variations exhibit regional heterogeneity across the study area. The annual average NDVI values in Longzhong, Longdong, Gannan, and Tianzhu regions were 0.61, 0.49, 0.80, and 0.77, respectively. Longdong region had the fastest vegetation recovery rate (0.11 decade−1) while Gannan region had the slowest (0.02 decade−1). The NDVI change trends across the study area and its subregions were partitioned into three temporal intervals (2000–2007, 2007–2014, and 2014–2020) for Sen’s slope trend analysis. All regions exhibited varying degrees of vegetation cover increase, with the exception of the Tianzhu area, where a divergent trend was observed during the 2000–2007 period, likely attributable to localized precipitation deficits during that timeframe. Collectively, the agro-pastoral ecotone in Gansu Province exhibited a statistically significant yet gradual greening trend (0.05 decade−1 (p < 0.01)) in vegetation cover during the growing seasons from 2000 to 2020, demonstrating the rigorous enforcement of the environmental conservation measures in the research region.
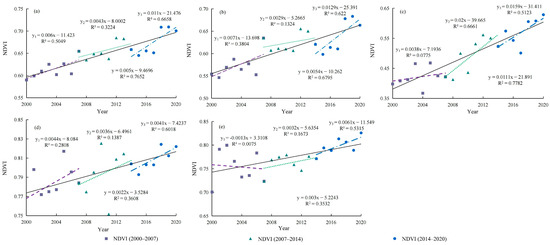
Figure 3.
Annual variation of NDVI in the study area. (a), Longzhong region (b), Longdong region (c), Gannan region (d), Tianzhu region (e), from 2000 to 2020.
3.2. Spatial Variation Characteristics of NDVI
3.2.1. Spatial Distribution Characteristics of NDVI
The spatial arrangement of NDVI during the vegetation growth season in the agro-pastoral ecotone in Gansu Province demonstrated a marked north–south disparity characterized by lower values in boreal areas versus elevated metrics in the southern region (Figure 4). Areas with NDVI values exceeding 0.6 are classified as vegetation-rich zones, primarily distributed in the Gannan Tibetan Autonomous Prefecture, Tianzhu Tibetan Autonomous County, and the eastern part of Huachi County. The regions mentioned made up the most significant part of the overall research area, totaling 42.67%. The NDVI values in the region with moderate vegetation cover ranged from 0.3 to 0.6, predominantly found in the area of Longzhong and Longdong regions within the agro-pastoral ecotone of Gansu Province. The distribution of NDVI values fell within the ranges of 0.3–0.4, 0.4–0.5, and 0.5–0.6, with percentages of 17.31%, 17.12%, and 9.88%, respectively, totaling 44.3% of the total area under investigation. Areas with low vegetation coverage in Longzhong are predominantly located in the central and northern regions, accounting for 12.95% of the total study area, with NDVI values ranging from 0.1 to 0.3. Only 0.07% of the study area, notably the Liujiaxia Reservoir region in Linxia Hui Autonomous Prefecture, lacks vegetation cover, exhibiting NDVI values below 0.1.
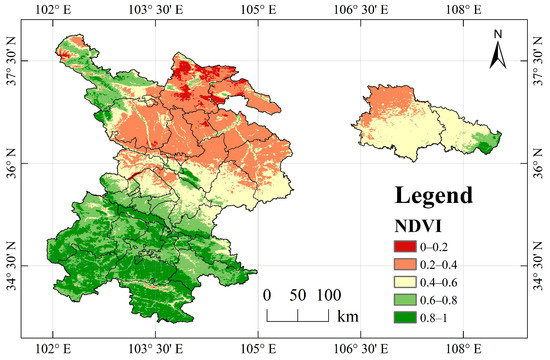
Figure 4.
Spatial distribution of average value of NDVI.
3.2.2. Spatial Trend of NDVI
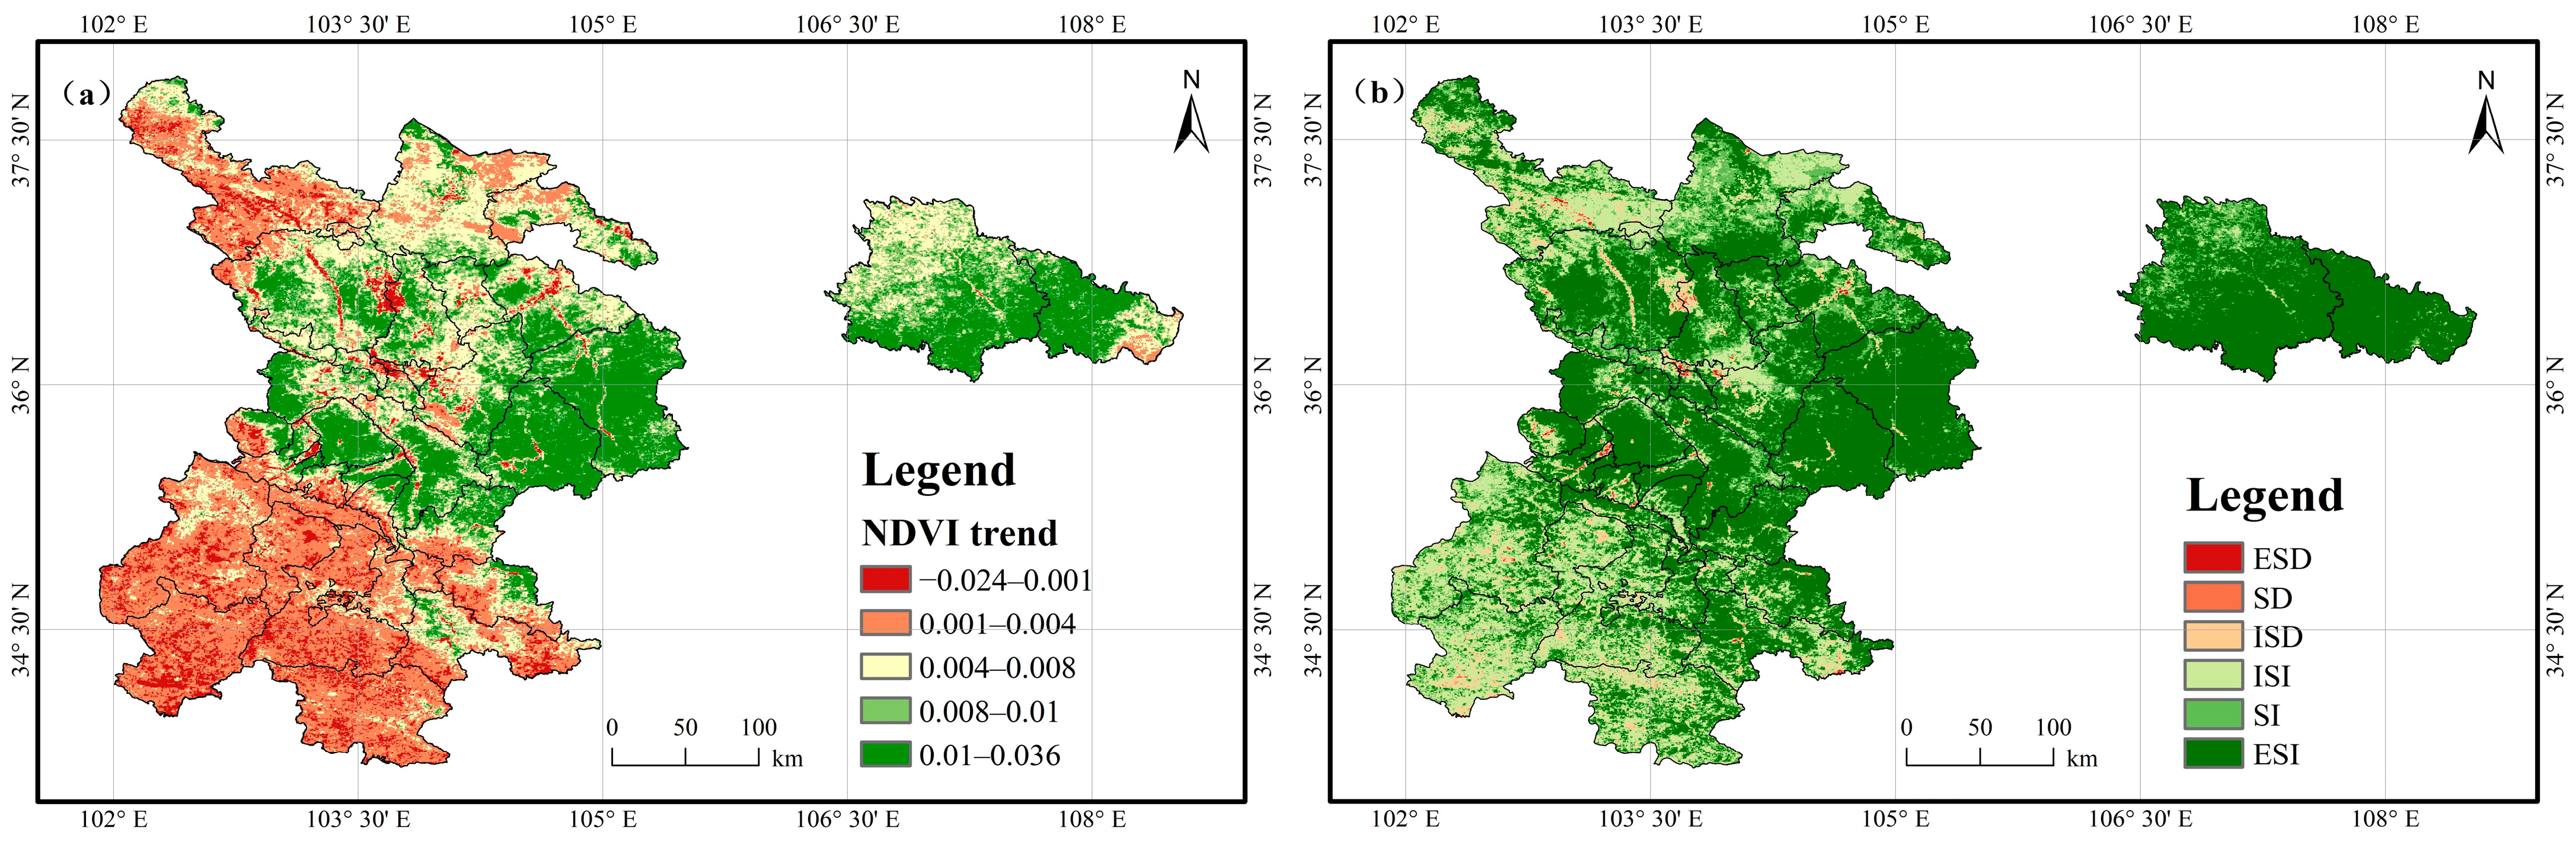
The spatial distribution of annual NDVI trends in the agro-pastoral ecotone of Gansu Province reveals a persistent greening trend in vegetation cover from 2000 to 2020 (Figure 5). Positive vegetation trends (slope > 0) were observed across 96.36% of the study area, with 55.42% exhibiting extremely significant increases, predominantly clustered in the Longzhong and Longdong regions. A relatively small proportion (18.90%) of the study area exhibited statistically significant increasing trends, while declining areas, accounting for less than 4% of the total area, were spatially fragmented into sporadic patches concentrated in the central region.

Figure 5.
(a) Theil–Sen Median trend analysis, (b) Mann–Kendall significance test. Note: The classification of inspection levels is detailed in Table 1.
3.3. Stability Research
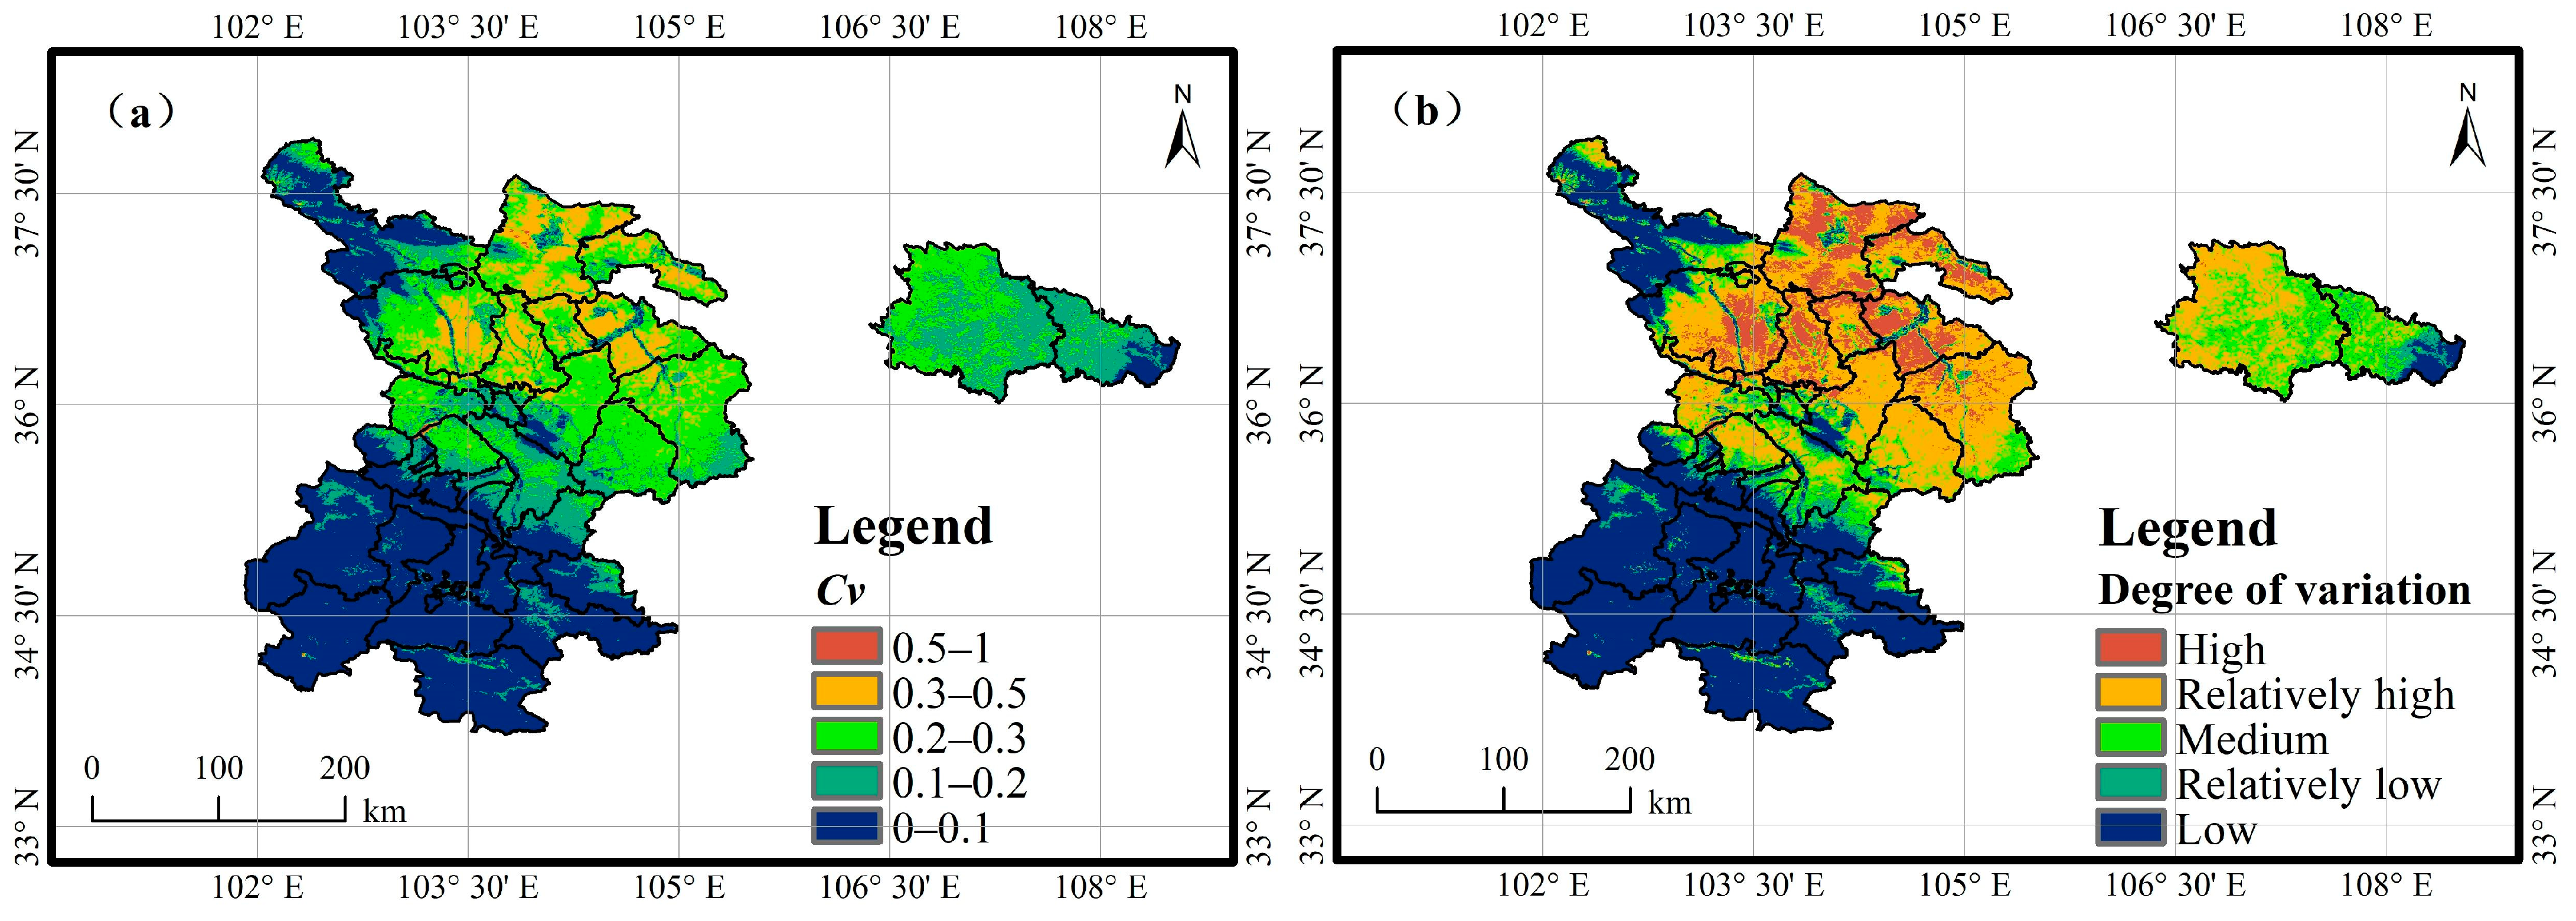
Analytical results revealed an annual average coefficient of variation (Cv) of 0.15 for NDVI in the agro-pastoral ecotone of Gansu Province from 2000 to 2020, indicating relatively minor overall vegetation variability coupled with pronounced spatial heterogeneity across the study area (Figure 6). The southern and northwestern sectors of the study area exhibited lower fluctuations, whereas the central region displayed pronounced fluctuations. The majority of the study area exhibited low coefficients of variation (Cv), while high-altitude regions such as Gannan and Tianzhu regions, as well as the southern Longzhong region in Gansu Province, demonstrated minimal variability (Cv ≈ 0.1). Low-fluctuation zones (Cv ≈ 0.1) accounted for the largest proportion of the total area (39.08%), indicating stable ecosystem conditions in these regions. The proportion of areas with moderate fluctuations was second, accounting for 17.76%. The higher values of Cv occurred in Huanxian County and Huachi in the Longdong region, as well as in the areas of Huining, Anding, Lintao, Yuzhong, Lanzhou, Yongjing, and Yongdeng in the Longzhong region, with the coefficient of variation being mostly 0.2–0.3, accounting for 25.58%. The Cv value of the north of Longzhong region and some other areas exceeded 0.4, with a high degree of fluctuation and variation, accounting for the smallest proportion of 8.45%. This finding demonstrated that vegetation in the study area had undergone the most drastic changes recorded over the 21-year observation period.

Figure 6.
(a) The spatial distribution of Cv. (b) The degree of variation of Cv.
3.4. Future Trends
In Figure 7a, the Hurst index spatial pattern in the study area is displayed. According to statistics, it was found that the proportion of pixels larger than 0.5 is relatively high, reaching 75.45%. The annual average Hurst index of the study area was 0.62 from 2000 to 2020, indicating a continuous improvement of vegetation cover over time. Spatially dominant regions with the Hurst index ranging from 0.7 to 1 accounted for 44.5% of the study area, predominantly distributed in the Gannan and Tianzhu regions of the Qinghai-Tibet Plateau. These areas represent the most temporally stable zones within agro-pastoral ecotone of Gansu Province, demonstrating minimal long-term variability in vegetation dynamics. Regions with values below 0.5 were spatially dispersed across the study area, with clustered distributions concentrated around the Longzhong and Longdong regions of Gansu Province. These areas, accounting for 26.61% of the total area, exhibited pronounced temporal instability in vegetation cover dynamics. Geospatial heterogeneity analysis revealed subdued Hurst indices within discrete pockets of the study area, and it was distributed in various cities. The NDVI change trends were coupled with the Hurst index to conduct an integrated analysis, thereby elucidating the future trajectories of vegetation dynamics in the agro-pastoral ecotone of Gansu Province (Figure 7b). Collectively, the majority of the study area demonstrated continuous improvement in future vegetation cover trajectories. The spatial proportions of continuous improvement, continuous degradation, degradation to improvement, and improvement to degradation transitions accounted for 68.81%, 4.58%, 17.64%, and 8.97% of the total investigated area, respectively.
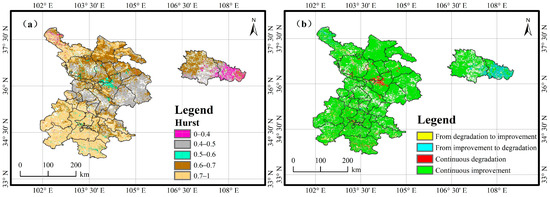
Figure 7.
(a) Spatial distribution of Hurst index. (b) Variation trend prediction of Hurst index.
3.5. Analysis of Factors Driving Changes in NDVI
3.5.1. Factor Detector
This investigation employed geographical detector modeling to identify determinants of NDVI spatial heterogeneity in the agro-pastoral ecotone of Gansu Province from 2000 to 2020, with quantified driver interactions systematically presented in Table 6. The statistical significance of environmental factors is reflected in the q value, with a higher q value indicating a greater impact. The significance tests (p-values) for the explanatory power (q-values) of all factors on NDVI spatial distribution yielded results below 0.001. Among these factors, sunshine hours, precipitation, DEM, average temperature, maximum temperature, ≥10 °C accumulated temperature, soil type, minimum temperature exhibited strong explanatory power over NDVI spatial patterns, whereas relative humidity, population density, GDP, slope, and LULC demonstrated weaker explanatory capacity. The spatial variation of vegetation coverage in the agro-pastoral ecotone of Gansu Province belt results from the synergistic effects of climatic regimes, topographic constraints, and anthropogenic pressures, with sunshine duration and precipitation emerging as predominant regulators of NDVI spatial dynamics.
Table 6.
Explanatory power and significance of driving factors.
3.5.2. Ecological and Interaction Detector
The results derived from the ecological interaction detector revealed that the synergistic interplay among diverse factors enhanced the influence of single factors on the spatial variation of NDVI, with all factor combinations demonstrating a bivariate enhancement effect (i.e., q (x1∩x2) > Max(q (x1), q (x2)). The interaction effect between DEM and precipitation emerged as the predominant explanatory factor for NDVI variations (q = 0.845, Figure 8). The combination of DEM with precipitation, sunshine hours, and relative humidity exhibited optimal synergistic explanatory power (interaction q-values > 0.8) for NDVI patterns. Comprehensive analysis revealed that meteorological drivers exerted dominant control over NDVI spatial distribution in the agro-pastoral ecotone of Gansu Province, with factor interactions demonstrating significant synergistic enhancement effects.
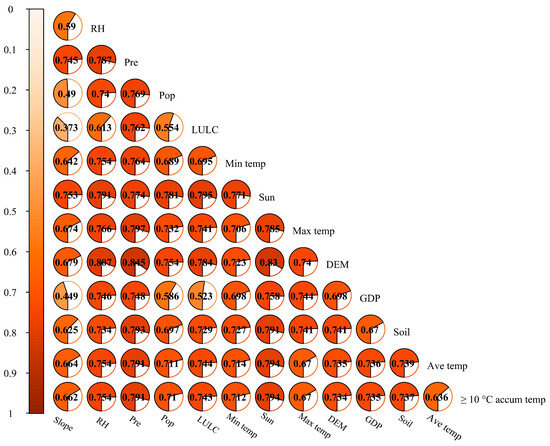
Figure 8.
Interaction intensity matrix diagram: Synergistic driving mechanisms of climate, land, and anthropogenic factors on the spatial differentiation of NDVI under the geodetector model. Note: (1) the color gradient in the figure represents the explanatory power of two-factor interactions (q-values are annotated in the corresponding cells), with higher values indicating stronger synergistic effects; (2) detailed descriptions of the variables on the horizontal and vertical axes can be found in Table 2.
This study implemented pairwise interaction detection within the geographical detector framework to quantify inter-factor divergences in governing NDVI spatial differentiation. The interaction matrix (Table 7) reveals statistically heterogeneous impacts among most driver combinations on vegetation index distribution patterns.
Table 7.
Ecological detector results.
3.5.3. Risk Detector
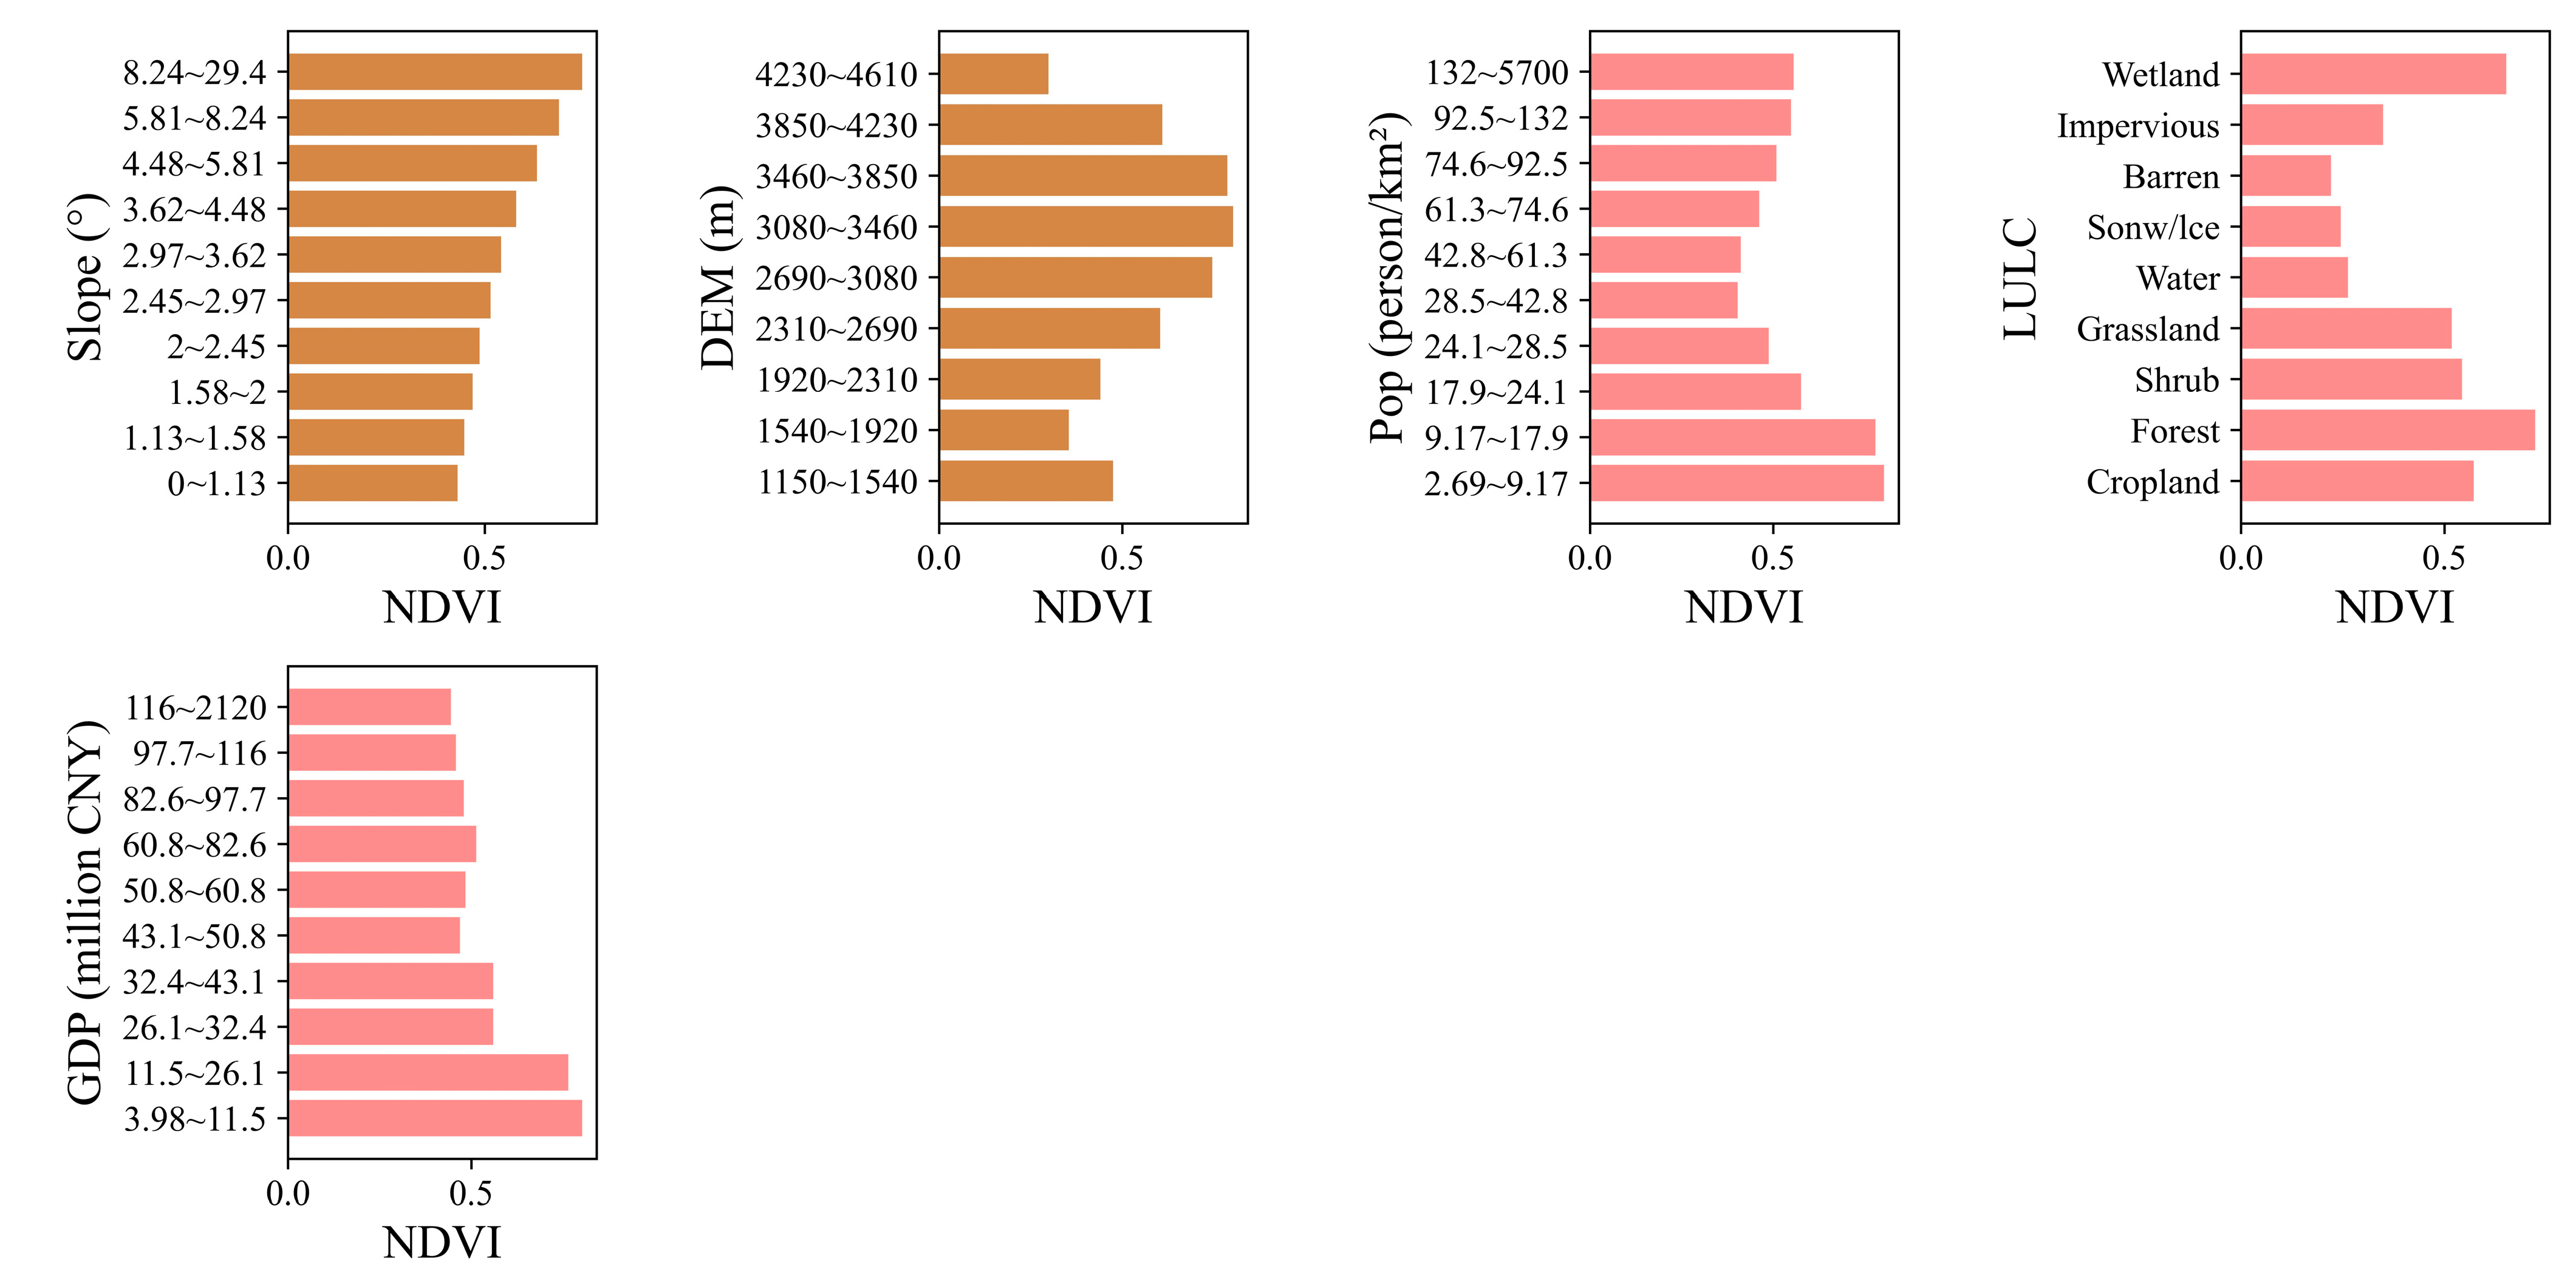
Risk detector-based quantification revealed the mean NDVI values across heterogeneous environmental drivers or vegetation growth regimes (Figure 9). In terms of meteorological factors, NDVI showed a gradually decreasing pattern as the average temperature, maximum temperature, minimum temperature, and ≥10 °C accumulated temperature increased. With the increase of precipitation, NDVI showed an upward trend and peaked at precipitation levels of 463–515 mm. As the sunshine hours increased, the temperature rose and NDVI showed a downward trend. The vegetation prospered in the agro-pastoral ecotone in Gansu Province amidst the meteorological conditions of low temperatures, minimal sunshine hours, and elevated precipitation levels. In terms of terrain factors, vegetation coverage varied due to changes in soil types, and Huanggang soil was the most suitable for vegetation growth in this area. NDVI reached its maximum value at an altitude of 3080–3460 m and a slope of 8.24–29.4°. In terms of human factors, regions with low GDP and sparse population had better vegetation coverage and can achieve higher NDVI under land use types such as wetlands, forests, and farmland.
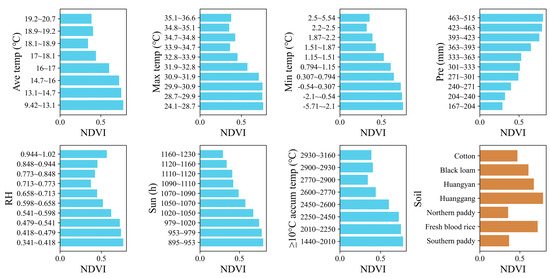

Figure 9.
Risk detector results.
3.6. Response of NDVI to Climate
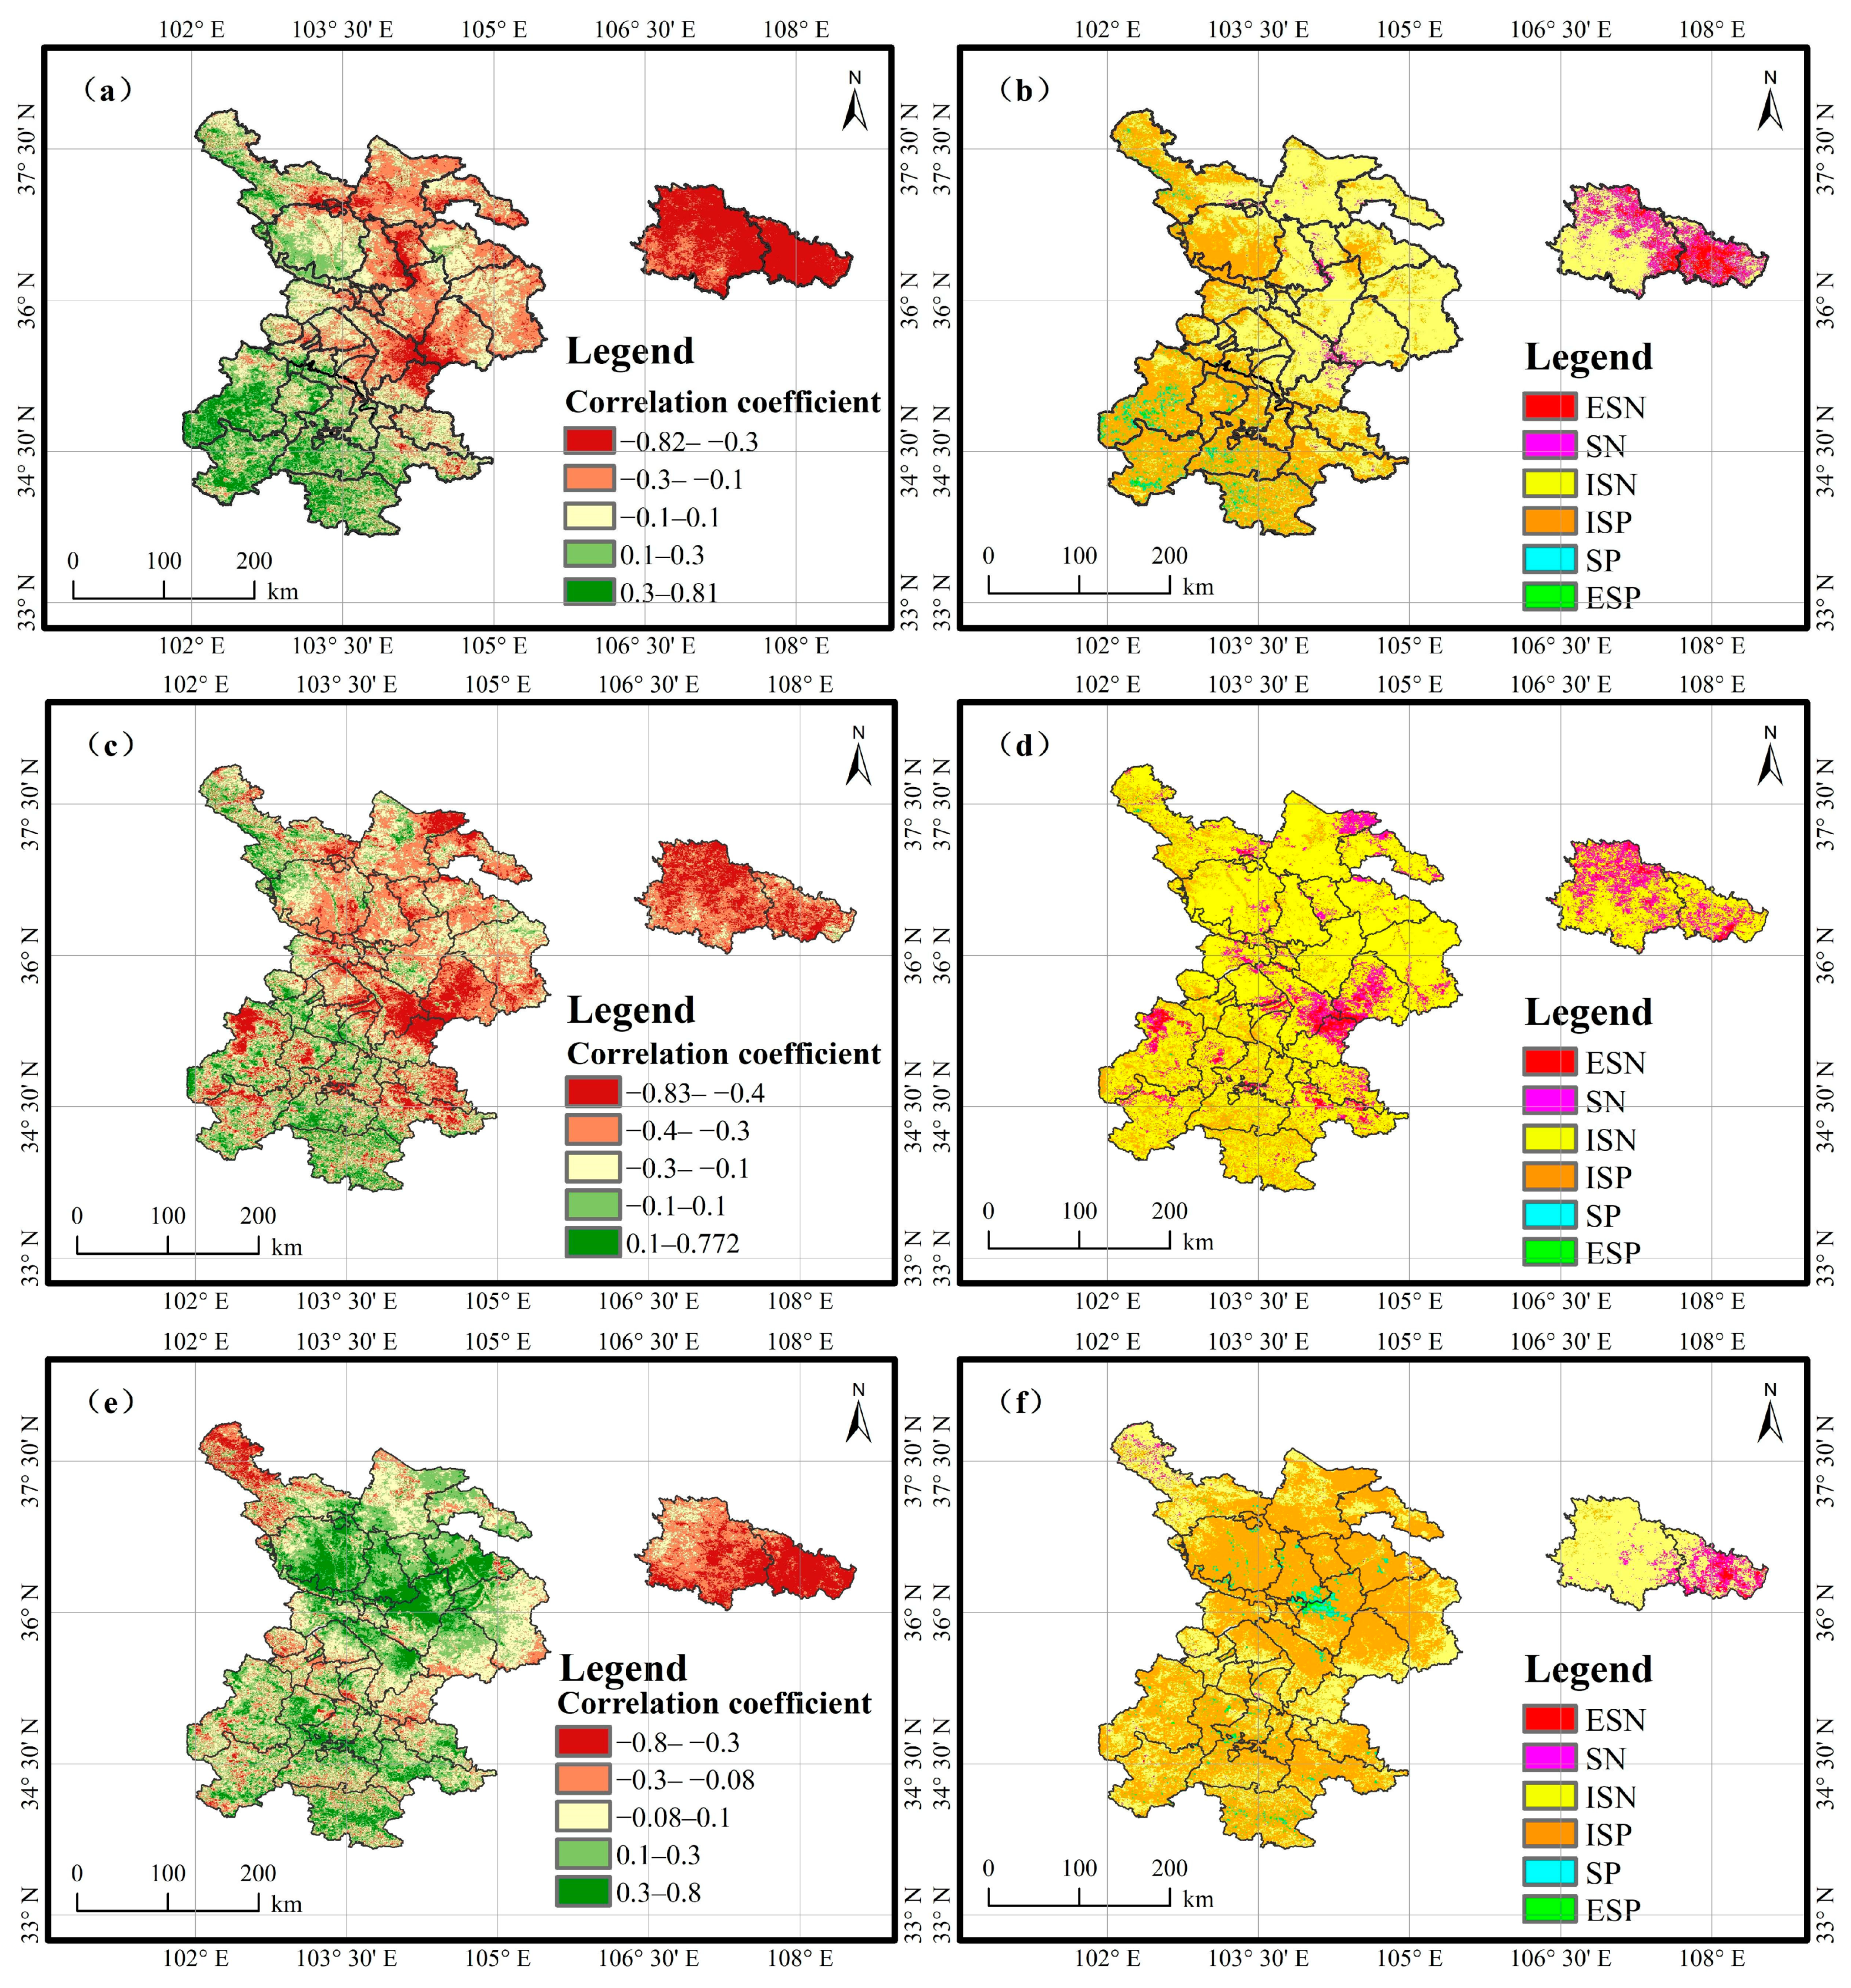
Over the past 21 years, the correlation coefficient between NDVI and the average and maximum temperatures in the research area shows a spatial trend of decreasing from south to north (Figure 10). Positive correlations were observed in only 37.95% of average temperature and 9.29% of maximum temperature cases, primarily concentrated in the Gannan region, Tianzhu region, and the western boundary area of Longzhong. Geospatial analysis revealed spatially heterogeneous NDVI-Tmin correlations, with a positive correlation dominating 60.76% of the study area, clustered predominantly in the Longzhong and Gannan regions. NDVI and average temperature had an average correlation coefficient of −0.06, with the majority of pixel area showing a non-significant negative correlation at 53.72%. The average correlation coefficient between NDVI and maximum temperature is −0.26, with the maximum value appearing in Xiahe County (0.77) in the Gannan Plateau region. NDVI demonstrated inverse thermal coupling with minimum temperature, contrasting previous thermal variables, with a positive regional mean correlation coefficient (r = 0.04).
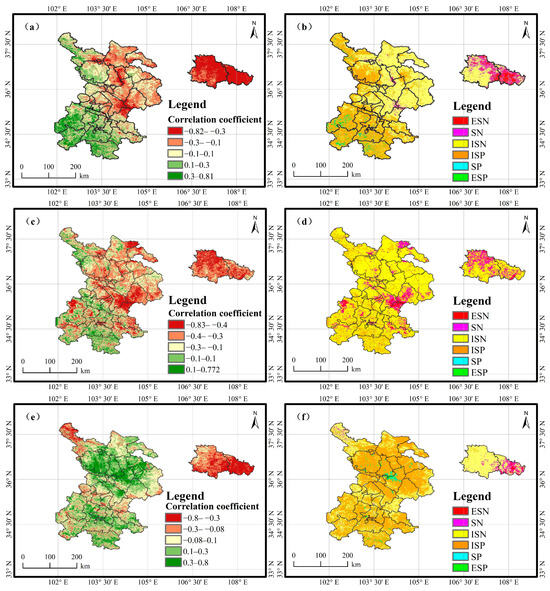
Figure 10.
Spatial distribution of correlation coefficient between NDVI and average temperature (a,b), maximum (c,d), minimum temperature (e,f) and significance test. Note: the classification of correlation tests is detailed in Table 3.
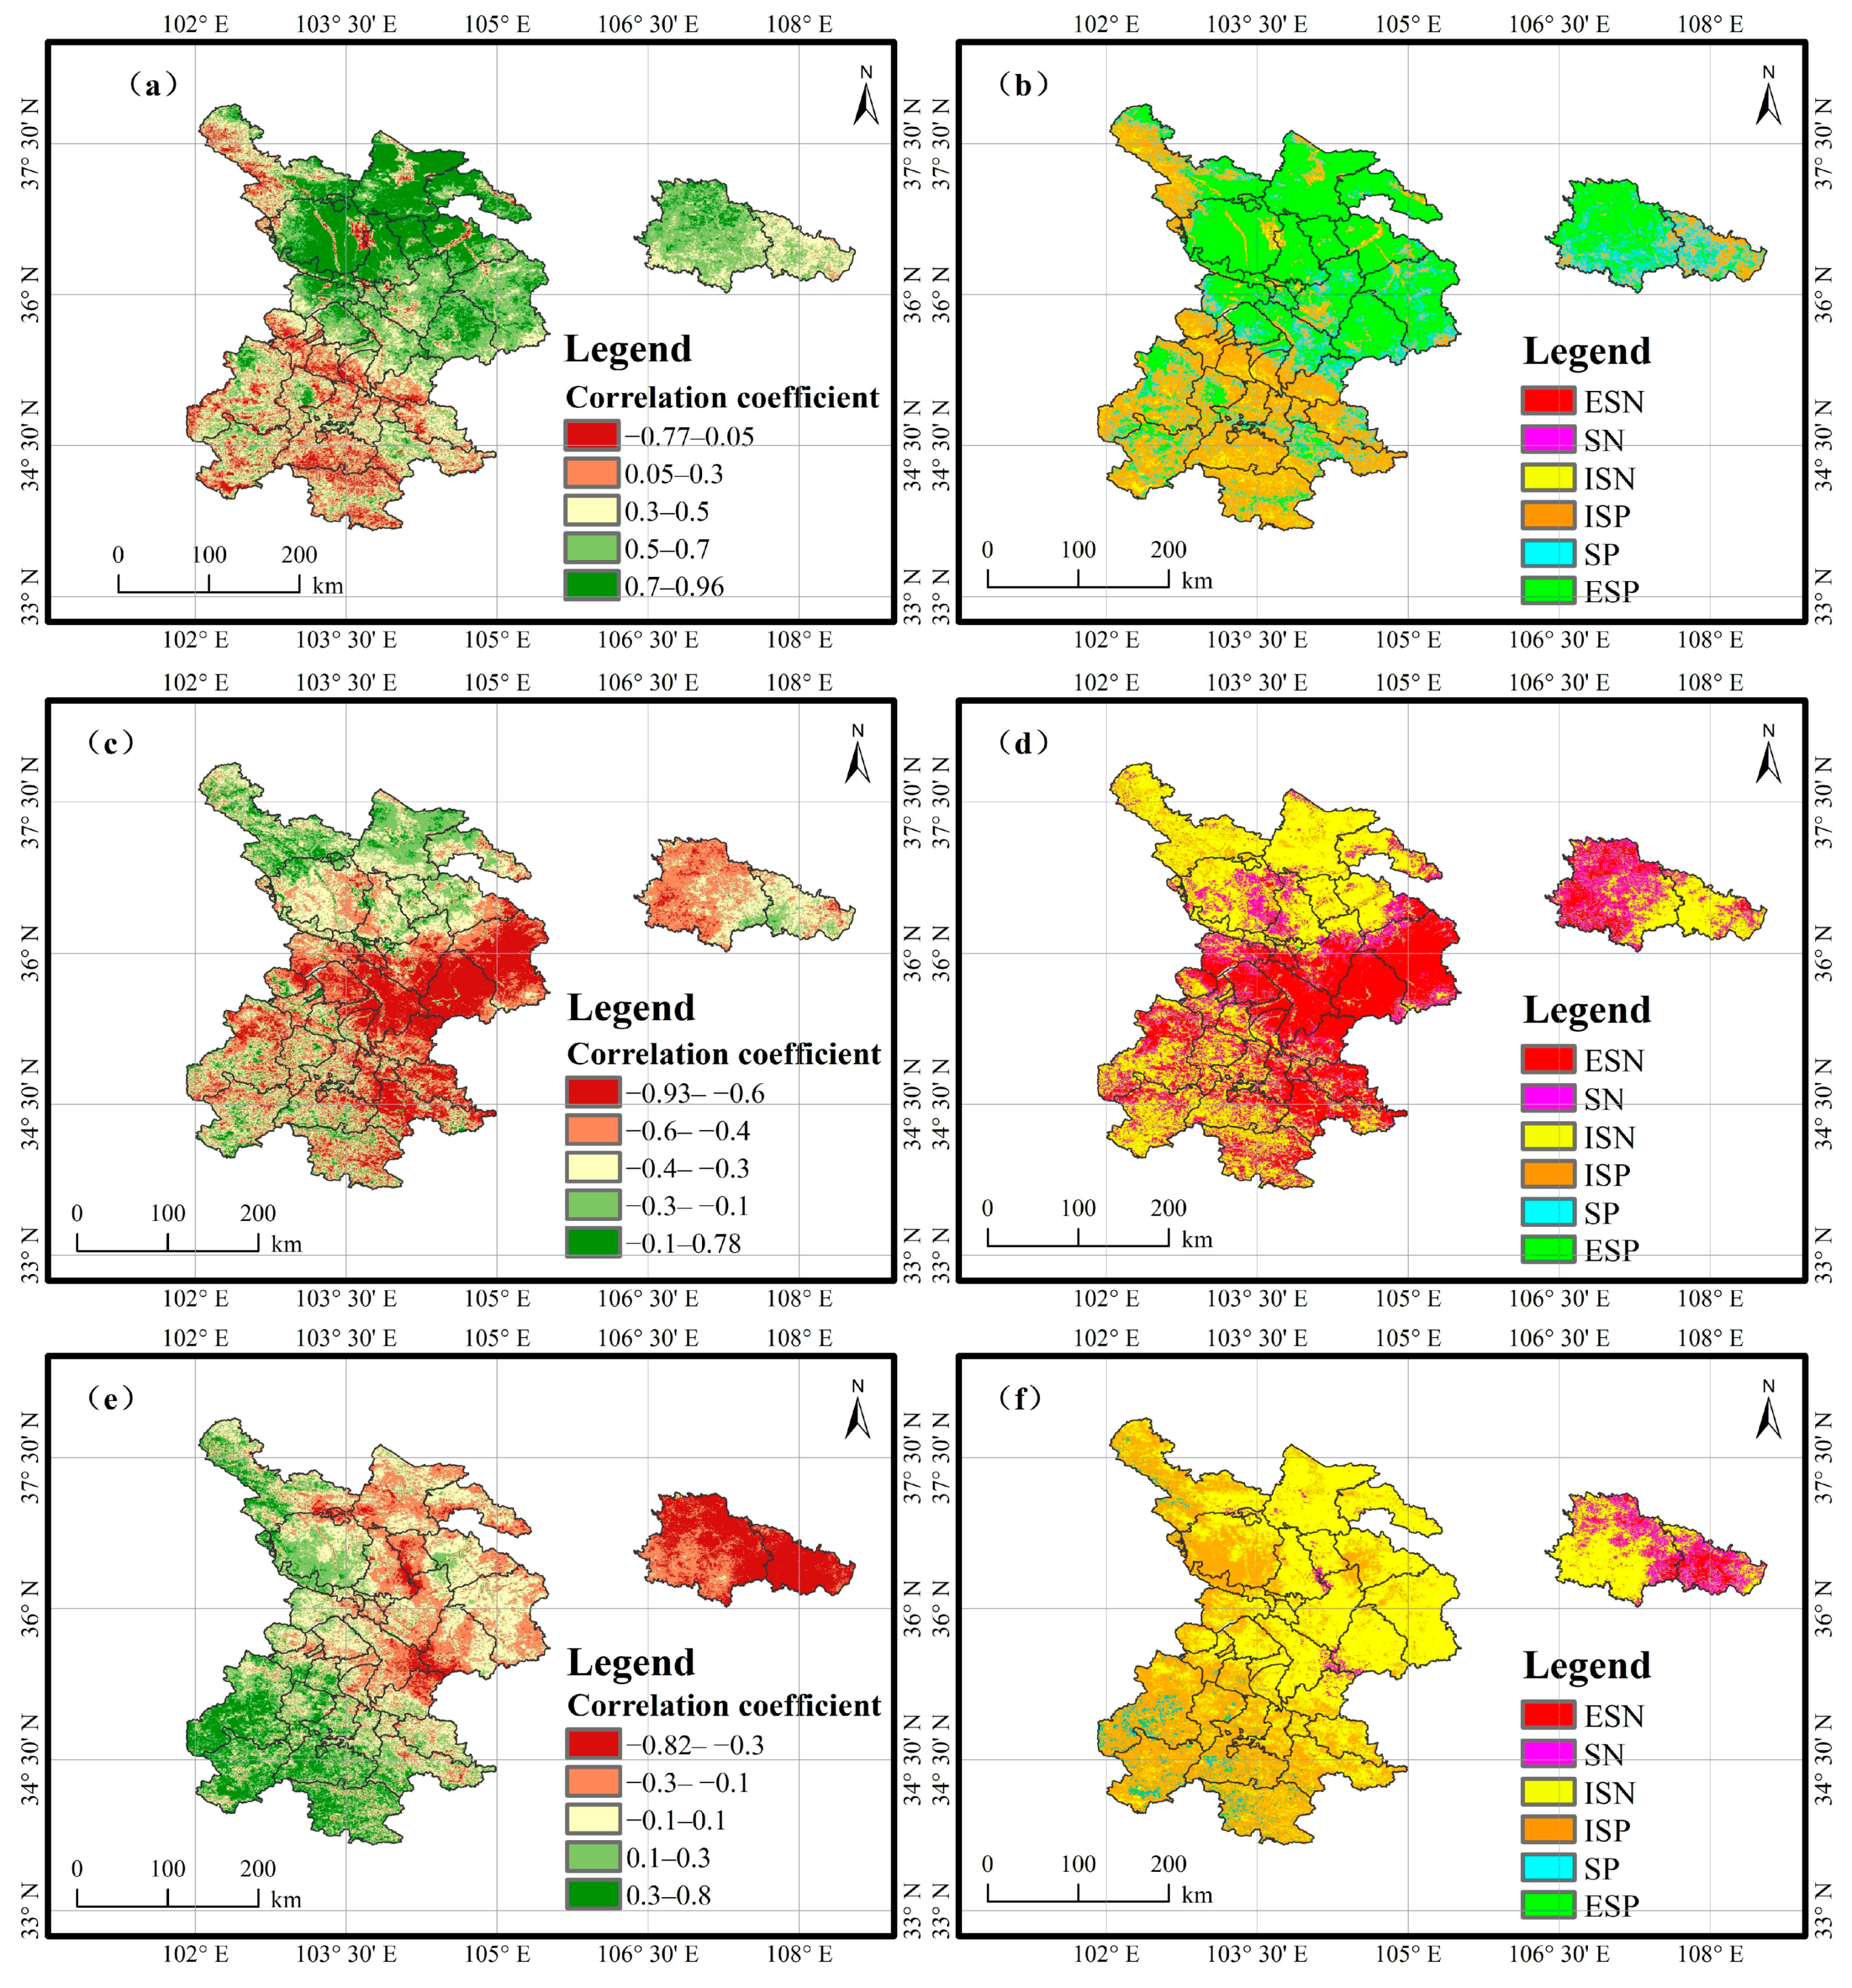
Two-decadal geospatial analysis (2000–2020) revealed predominant positive NDVI-precipitation coupling, demonstrating that the correlation coefficient showed a spatial variation characteristic of decreasing from northern arid to southern semi-humid zones (Figure 11a,b). The regional mean coefficient reached 0.47 with extremes localized in Longzhong, where positive associations predominated (95.14% areal coverage). Spatially, 43.62% exhibited highly significant positive correlations, core clustering in the semi-arid loess tablelands of Huanxian and Huachi counties (central-eastern sector), while moderate significant positive correlations occupied 18.74% of the total area. Areas exhibiting both extremely significant negative correlation and significant negative correlation constituted <1% of the total study area, predominantly localized in spatially discrete microclusters within the central core zone.
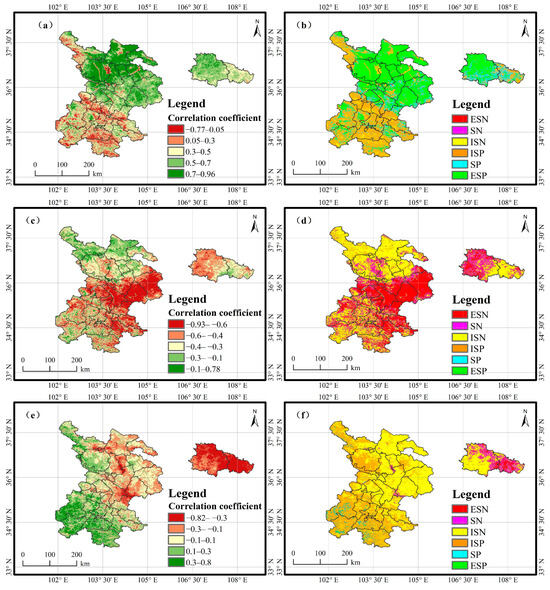
Figure 11.
Spatial distribution of correlation coefficient between NDVI and precipitation (a,b), sunshine hours (c,d), ≥10 °C accumulated temperature (e,f), and significance test. Note: The classification of correlation tests is detailed in Table 3.
Two-decadal geospatial analysis revealed an inverse NDVI–sunshine duration relationship (regional mean r = −0.42) in the agro-pastoral ecotone of Gansu Province, demonstrating a central basin of depressed coefficients surrounded by elevated peripheral correlations. Spatial extremes manifested with correlation maxima clustered in Yongdeng County (northern Longzhong) and minima concentrated in Anding District (southeastern Longzhong). Spatially explicit correlation analysis revealed significant, extremely significant positive correlations (0.11% areal coverage), contrasted by predominant negative correlations (81.95% of total area) across the study domain. High correlation coefficients were concentrated in the southern and eastern regions of Longzhong, as well as in the western region of Longdong (Figure 11c,d).
As delineated in Figure 11e,f, the correlation coefficients between NDVI and ≥10 °C accumulated temperature exhibited pronounced latitudinal (south–north) and longitudinal (west–east) attenuation gradients over the 21-year period. The regional mean coefficient stood at −0.06, with spatial extremes peaking in the southwestern sector (rmax = 0.81) and troughing in the northeastern ecotone (rmin = −0.82). Negative correlation zones demonstrated areal predominance, accounting for 62.17% of the total study area, with spatial coverage exceeding that of positive correlation regions by a factor of 1.64. Non-significant negative correlations were spatially predominant, accounting for 54.02% of the total area, with dense clustering observed across the eastern Longzhong loess tablelands and western Longdong dryland agricultural zones.
4. Discussion
4.1. Changes in Vegetation Cover
This study reveals the spatio-temporal evolution patterns of vegetation cover in the Gansu farming-pastoral ecotone over the past 21 years (2000–2020). The results demonstrate that the NDVI in the study area showed a significant fluctuating upward trend with a growth rate of 0.05 decade−1 (p < 0.05), while degraded areas accounted for only 3.8% and were distributed as scattered patches in central urbanization hotspots. This phenomenon is closely related to agricultural and pastoral land loss caused by construction land expansion during rapid urbanization [39]. The vegetation dynamic pattern of the study area exhibits spatio-temporal consistency with the macro-ecological restoration trend in the Gansu Province and agro-pastoral ecotone of Northern China, with discrepancies in research conclusions primarily arising from temporal sequence extension and the enhancement effect of spatial resolution on vegetation change signals [40,41]. Compared with similar global ecoregions, the vegetation recovery rate in the study area is significantly higher than that in the European agro-pastoral ecotone (0.03 decade−1), but lower than that in the Loess Plateau core region of China (0.08 decade−1) [42,43]. These regional differences mainly stem from the interaction between ecological engineering implementation intensity and climatic background: European regions are constrained by land privatization leading to fragmented ecological projects, while the Loess Plateau benefits from dual driving mechanisms of climatic warming-humidification and engineering management.
Spatial pattern analysis indicates that growing season NDVI follows a typical “low-north, high-south” distribution pattern, confirming previous ecoregionalization research [41]. Specifically: (1) In northern Longzhong, the western extension of the Loess Plateau arid ecosystem, vegetation productivity is strictly constrained by the precipitation-driven soil–water–vegetation hydrological forcing mechanism, making it difficult to overcome the moisture threshold imposed by the 400 mm isohyet under current climate conditions [43]. (2) The alpine meadows in the Gannan-Tianzhu transitional zone along the northeastern edge of the Qinghai-Tibet Plateau exhibit unique green-brown phase shift characteristics in phenological dynamics, governed by both cloud-cover regulated autumn precipitation phases and biophysical constraints of photosynthetic carbon assimilation processes [44].
However, this study innovatively constructs a multidimensional analytical framework using NDVI time-series data to assess system stability and evolutionary persistence while revealing spatio-temporal heterogeneity of vegetation cover. The spatial coupling between ecological engineering implementation intensity and climate change responses emerges as a key explanatory variable—the Grain-for-Green Program has generated significant restoration effects in the central-northern Loess Plateau, while high-altitude pastoral areas (Gannan-Tianzhu) exhibit recovery lag characteristics due to dual constraints of grazing pressure and climate sensitivity. The implemented gradient grazing management systems (rotational grazing/complete grazing prohibition/seasonal grazing suspension), combined with continuous warming trends, have effectively enhanced ecological resilience in degraded grasslands [45,46,47]. Climate change response simulations reveal that the strong persistence characteristics of NDVI (mean Hurst index 0.62) show spatial synergy with the Loess Plateau ecological restoration zone, indicating continued vegetation cover improvement. However, under RCP 4.5 scenarios, regional climate may exhibit increased precipitation variability and frequent extreme hydrological events [48]. Mechanistic analysis demonstrates that while warming-induced growing season extension promotes photosynthetic product accumulation, concomitant evapotranspiration intensification may lead to imbalances in the soil moisture–vegetation transpiration hydraulic coupling system, forming negative feedback loops of photosynthetic downregulation and autotrophic metabolic constraints [49,50]. Therefore, we recommend establishing precision ecological management strategies based on NDVI evolution trend zoning to enhance the climate fluctuation adaptability of farming-pastoral ecotones.
4.2. Analysis of the Driving Forces of NDVI
The study concludes that the spatio-temporal differentiation of vegetation coverage in the Gansu agro-pastoral ecotone is governed by a tripartite synergistic mechanism of climate–topography–anthropogenic factors, forming theoretical resonance with global semi-arid vegetation dynamics research while exhibiting distinct regional specificity. Geodetector analysis reveals significant spatial heterogeneity in the dominant drivers of NDVI: Climatic parameters demonstrate a dominant global effect on vegetation enhancement (explaining 62.3% variance), whereas topographic and anthropogenic factors show limited explanatory power (<18%), closely related to the natural succession-dominated forest-grassland composite ecosystem attributes. The harsh hydrothermal combination and simplified community structure in the study area amplify vegetation sensitivity to climate fluctuations [51]. Climate forcing regulates vegetation through photosynthetic hydrothermal balance mechanisms, not only determining spatial patterns of terrestrial ecosystems but also establishing them as bioindicators of global change through carbon cycling processes. Climate change reshapes plant community composition, biogeographic distribution, and phenotypic characteristics via thermal–hydrological synergy, potentially triggering ecosystem stability threshold breaches, and species adaptive restructuring [52].
Compared with the North American Great Plains ecotone, the study area shows higher climatic explanatory power (62.3% vs. 45–58%), attributable to intensified climate sensitivity from extreme hydrothermal conditions along the eastern Qinghai-Tibet Plateau margin (mean annual precipitation < 400 mm vs. Great Plains 500–800 mm) [53]. Vegetation–climate response mechanisms identify precipitation as the primary regulator of the growing-season NDVI (strong–very strong correlation), alleviating water constraints through enhanced soil reservoir effects. Sunshine duration shows secondary influence (moderate–strong correlation), while temperature exhibits minimal impact (weak–insignificant). Comparatively, although Sahelian vegetation recovery similarly prioritizes precipitation, its superior soil water retention (clay content > 25% vs. the study area’s high-permeability meadow soil < 15%) explains the localized vegetation–precipitation negative correlation here [8,12]. The unique solar radiation regulation in central regions parallels Australian inland ecosystems’ photoperiod responses, though differing in photosynthetic pathways (C4 dominance > 60% in Australia vs. C3 predominance > 85% here), suggesting latitudinal gradients in light-use strategies [54]. Diurnal temperature divergence (minimum temperature positive/mean temperature negative correlations) contrasts with Mediterranean ecosystems where diurnal thermal amplitude synergistically promotes growth. Here, high-temperature evapotranspiration-induced water deficits amplify negative feedbacks, revealing nonlinear temperature response shifts across aridity gradients [55].
Spatial heterogeneity analysis delineates as follows: Northern/eastern regions with NDVI < 0.3 under bioclimatic constraints of high temperature and low precipitation; southern Gannan Plateau maintaining high coverage through superior hydrothermal conditions; and localized areas like Dongxiang Autonomous County showing vegetation-precipitation negative correlations linked to permeable soils and low-temperature thresholds [56,57]. The dual-path anthropogenic impacts align with global ecological engineering assessments: Urbanization reduces coverage, while conservation programs (Grain for Green, Three-North Shelterbelt) and water infrastructure (irrigation, South–North Diversion) enhance vegetation [58]. Furthermore, anthropogenic greenhouse emissions indirectly regulate macroscale vegetation patterns through climate warming, forming a multilevel climate–vegetation-human feedback system [59].
4.3. Limitations and Prospects
This study has the following limitations at the data and methodology levels: The spatiotemporal heterogeneity of multi-source remote sensing data poses challenges in cross-sensor fusion and effective detection of rapid anthropogenic disturbance signals. Although MVC composition and 6S radiometric correction were employed to reduce noise, inherent uncertainties persist in remote sensing data: (1) Sensor discrepancies—spatial resolution differences between MODIS NDVI data (250 m) and ground measurements may introduce scale effects, particularly in fragmented landscapes like farmland–grassland ecotones, leading to vegetation cover estimation biases; (2) Algorithm limitations—Sen’s slope analysis shows sensitivity to extreme climate events (e.g., drought years), potentially overestimating/underestimating long-term trends. Time series decomposition (STL) and BFAST algorithms were integrated to isolate seasonal fluctuations and detect abrupt change points for trend robustness enhancement. While the geographical detector model identifies factor interactions, its capacity to resolve nonlinear relationships remains limited, necessitating supplementary machine learning approaches like random forests [60]; (3) NDVI application constraints—medium–low resolution data struggle to capture sparse vegetation heterogeneity in arid/semi-arid regions, where mixed pixel effects from high-reflectance backgrounds (bare soil/sand) may underestimate vegetation coverage. NDVI’s reliance solely on red and near-infrared bands limits responsiveness to leaf water content and non-photosynthetic vegetation, requiring synergistic monitoring with EVI and LAI indices [12].
To address these challenges, future research should focus on three directions: (1) Data fusion and validation—develop a multi-source heterogeneous data assimilation framework integrating ground observations, high-resolution satellites (e.g., Sentinel-2), and deep spatiotemporal networks, with cross-validation through field quadrat surveys (vegetation coverage/LAI measurements) to quantify remote sensing inversion errors; (2) Model optimization and mechanism elucidation—create hybrid models combining ecological process models with interpretable AI to decode climate–vegetation nonlinear feedbacks (e.g., time-lag effects, cascade responses). Integrate key regulatory factors like drought indices and near-surface wind speed to improve stress mechanism analysis [61,62,63]; (3) Interdisciplinary integration and policy quantification—establish a cross-disciplinary paradigm combining causal inference and system dynamics to reveal synergistic/antagonistic mechanisms between natural and anthropogenic factors. Enhance separability of human activity contributions through counterfactual scenario simulations, and precisely quantify ecological project (e.g., Grain-for-Green) contributions to vegetation restoration, providing decision support for optimizing ecological barrier functions in arid regions [64,65].
5. Conclusions
This study systematically analyzed the spatio-temporal evolution and driving mechanisms of vegetation coverage in the agro-pastoral ecotone of Gansu Province from 2000 to 2020. The results reveal the following. (1) Regional vegetation NDVI showed a significant upward trend at a rate of 0.05 decade−1, with spatial distribution exhibiting a “low north–high south” pattern. High-coverage areas (NDVI > 0.6) concentrated in the Gannan Plateau and Tianzhu Tibetan Autonomous County (42.67% coverage). Notably, 55.42% of regions demonstrated extremely significant growth trends, while degraded areas accounted for only 3.8% and scattered in central urbanization zones. Future projections based on the Hurst index (mean 0.62) suggest 68.81% of vegetation will maintain continuous improvement. (2) Although land and anthropogenic factors exhibited limited direct explanatory power, their interactions with climate factors significantly amplified impacts, particularly the DEM–precipitation interaction (q = 0.845), indicating topography indirectly shapes vegetation patterns through regulating precipitation redistribution. (3) Climate factors dominated NDVI differentiation, with precipitation showing significant positive correlation (regional average r = 0.47, p < 0.05). Extreme precipitation responses occurred in 43.62% of areas, while average temperature, maximum temperature, and ≥10 °C accumulated temperature inhibited vegetation growth through intensified water stress. (4) Distinct regional driving mechanisms emerged: precipitation limitation in central Longzhong semi-arid areas, thermal stress dominance in eastern Longdong regions, and sensitivity to ≥10 °C accumulated temperature in Gannan alpine meadows. This study was constrained by the spatio-temporal heterogeneity of multi-source remote sensing data, sensor discrepancies, and algorithm sensitivity to extreme events. Future efforts should further integrate high-resolution remote sensing data with deep learning models to enhance inversion accuracy. Simultaneously, ecological process models and explainable AI techniques should be employed to analyze the non-linear climate–vegetation feedback mechanisms. Combined with interdisciplinary approaches, the contributions of ecological projects need to be quantitatively assessed. Precise management strategies based on NDVI trend zoning should be formulated to coordinate ecological engineering implementation with climate adaptation measures. Through multi-source remote sensing data fusion and systematic modeling, the resilience of ecological barriers in arid and semi-arid regions can be effectively strengthened to address the uncertainties in future climate change.
Author Contributions
Conceptualization, M.Z.; methodology, M.Z. and J.Y.; formal analysis, M.Z. and J.L.; investigation, M.Z.; data curation, M.Z.; writing—original draft preparation, M.Z.; writing—review and editing, G.L.; supervision, L.Y.; project administration, G.L. and L.Y.; funding acquisition, G.L. All authors have read and agreed to the published version of the manuscript.
Funding
This research was funded by the Financial Special Project in Gansu Province, China (GSCZZ 20160909); Top Leading Talents Program in Gansu Province, China (GSBJLJ-2023-09); National Natural Science Foundation of China (32360438); Major Scientific and Technological Project of Lanzhou Resources and Environment Vocational and Technical University, China (X2022ZD-02) and Research on Ecological Modification of Shallow Loess Bank Slopes Using Nanomaterial Piles, China (2025A-298).
Institutional Review Board Statement
Not Applicable.
Informed Consent Statement
Not Applicable.
Data Availability Statement
All data, models, or code generated or used during the study are available from the author by request (zhuomacao@lzre.edu.cn).
Acknowledgments
The authors would like to thank the reviewers for their constructive comments and suggestions.
Conflicts of Interest
The authors declare no conflict of interest.
References
- Richardson, A.D.; Keenan, T.F.; Migliavacca, M.; Ryu, Y.; Sonnentag, O.; Toomey, M. Climate change, phenology and phenological control of vegetation feedbacks to the climate system. Agric. For. Meteorol. 2013, 169, 156–173. [Google Scholar] [CrossRef]
- Bhuyan, M.; Singh, B.; Vid, S.; Jeganathan, C. Analysing the spatio-temporal patterns of vegetation dynamics and their responses to climatic parameters in Meghalaya from 2001 to 2020. Environ. Monit. Assess. 2023, 195, 94. [Google Scholar] [CrossRef] [PubMed]
- Vieira, F.R.; Christofaro, C. Contributions of the vegetation index (NDVI) in water quality prediction models in a semi-arid tropical watershed. J. Arid Environ. 2024, 220, 105122. [Google Scholar] [CrossRef]
- Han, W.; Chen, D.; Li, H.; Chang, Z.; Chen, J.; Ye, L.; Liu, S.; Wang, Z. Spatiotemporal variation of NDVI in Anhui Province from 2001 to 2019 and its response to climatic factors. Forests 2022, 13, 1643. [Google Scholar] [CrossRef]
- Yang, J.; Wan, Z.; Borjigin, S.; Zhang, D.; Yan, Y.; Chen, Y.; Gu, R.; Gao, Q. Changing trends of NDVI and their responses to Climatic Variation in Different Types of Grassland in Inner Mongolia from 1982 to 2011. Sustainability 2019, 11, 3256. [Google Scholar] [CrossRef]
- Kusch, E.; Davy, R.; Seddon, A.W. Vegetation-memory effects and their association with vegetation resilience in global drylands. J. Ecol. 2022, 110, 1561–1574. [Google Scholar] [CrossRef]
- Roy, S.K.; Mojumder, P.; Chowdhury, M.A.; Hasan, M.M. Evaluating mangrove forest dynamics and fragmentation in Sundarbans, Bangladesh using high-resolution Sentinel-2 satellite images. Glob. Ecol. Conserv. 2025, 58, e03493. [Google Scholar] [CrossRef]
- Sanogo, K.; Birhanu, B.Z.; Sanogo, S.; Aishetu, A.; Ba, A. Spatiotemporal response of vegetation to rainfall and air temperature fluctuations in the Sahel: Case study in the Forest Reserve of Fina, Mali. Sustainability 2021, 13, 6250. [Google Scholar] [CrossRef]
- Jiao, T.; Williams, C.A.; Rogan, J.; De Kauwe, M.G.; Medlyn, B.E. Drought impacts on Australian vegetation during the millennium drought measured with multisource spaceborne remote sensing. J. Geophys. Res. Biogeosciences 2020, 125, e2019JG005145. [Google Scholar] [CrossRef]
- Liu, X.; Zhang, Q. Combining seasonal and trend decomposition using LOESS with a gated recurrent unit for climate time series forecasting. IEEE Access 2024, 12, 85275–85290. [Google Scholar] [CrossRef]
- Bellier, E.; Monestiez, P.; Durbec, J.P.; Candau, J.N. Identifying spatial relationships at multiple scales: Principal coordinates of neighbour matrices (PCNM) and geostatistical approaches. Ecography 2007, 30, 385–399. [Google Scholar] [CrossRef]
- Yang, Z.; Gao, X.; Lei, J.; Meng, X.; Zhou, N. Analysis of spatiotemporal changes and driving factors of desertification in the Africa Sahel. Catena 2022, 213, 106213. [Google Scholar] [CrossRef]
- Sacks, W.J.; Kucharik, C.J. Crop management and phenology trends in the US Corn Belt: Impacts on yields, evapotranspiration and energy balance. Agric. For. Meteorol. 2011, 151, 882–894. [Google Scholar] [CrossRef]
- Zhang, X.; Wang, J.; Gao, Y.; Wang, L. Variations and controlling factors of vegetation dynamics on the Qingzang Plateau of China over the recent 20 years. Geogr. Sustain. 2021, 2, 74–85. [Google Scholar] [CrossRef]
- Xin, Z.; Xu, J.; Zheng, W. Spatiotemporal variations of vegetation cover on the Chinese Loess Plateau (1981–2006): Impacts of climate changes and human activities. Sci. China Ser. D-Earth Sci. 2008, 51, 67–78. [Google Scholar] [CrossRef]
- Liu, G.; Liu, H.; Yin, Y. Global patterns of NDVI-indicated vegetation extremes and their sensitivity to climate extremes. Environ. Res. Lett. 2013, 8, 025009. [Google Scholar] [CrossRef]
- Dameneh, H.E.; Gholami, H.; Telfer, M.W.; Comino, J.R.; Collins, A.L.; Jansen, J.D. Desertification of Iran in the early twenty-first century: Assessment using climate and vegetation indices. Sci. Rep. 2021, 11, 20548. [Google Scholar] [CrossRef]
- Miles, M.W.; Miles, V.V.; Esau, I. Varying climate response across the tundra, forest-tundra and boreal forest biomes in northern West Siberia. Environ. Res. Lett. 2019, 14, 075008. [Google Scholar] [CrossRef]
- Zhang, W.; Randall, M.; Jensen, M.B.; Brandt, M.; Wang, Q.; Fensholt, R. Socio-economic and climatic changes lead to contrasting global urban vegetation trends. Glob. Environ. Change 2021, 71, 102385. [Google Scholar] [CrossRef]
- Zhou, H.; Wu, X.; Nie, H.; Wang, X.; Zang, S. Coupling coordination analysis and obstacle factors identification of rural living-production-ecological functions in a farming-pastoral ecotone. Ecol. Indic. 2024, 158, 111398. [Google Scholar] [CrossRef]
- Lyu, F.; Pan, Y.; Yu, L.; Wang, X.; Yu, Z. The impact of anthropogenic activities and natural factors on the grassland over the agro-pastoral ecotone of Inner Mongolia. Land 2023, 12, 2009. [Google Scholar] [CrossRef]
- Xu, W.; Rao, L. Impacts of land use and climate change on ecosystem services in agro-pastoral ecotone. Environ. Sci. 2023, 44, 5114–5124. [Google Scholar] [CrossRef]
- Pei, H.; Liu, M.; Jia, Y.; Zhang, H.; Li, Y.; Xiao, Y. The trend of vegetation greening and its drivers in the Agro-pastoral ecotone of northern China, 2000–2020. Ecol. Indic. 2021, 129, 108004. [Google Scholar] [CrossRef]
- Chen, H.; Zhao, Y.; Fu, X.; Tang, M.; Guo, M.; Zhang, S.; Zhu, Y.; Qu, L.; Wu, G. Impacts of regional land-use patterns on ecosystem services in the typical agro-pastoral ecotone of northern China. Ecosyst. Health Sustain. 2022, 8, 2110521. [Google Scholar] [CrossRef]
- Miao, X.; Wang, G.; Li, R.; Xu, B.; Zheng, H.; Tian, D.; Wang, J.; Ren, J.; Li, Z.; Zhou, J. Study on modeling and evaluating alfalfa yield and optimal water use efficiency in the agro-pastoral ecotone of northern China. Plants 2024, 13, 229. [Google Scholar] [CrossRef] [PubMed]
- Zhao, P.; He, Z. Temperature change characteristics in Gansu province of China. Atmosphere 2022, 13, 728. [Google Scholar] [CrossRef]
- Liu, C.; Dong, X.; Liu, Y. Changes of NPP and their relationship to climate factors based on the transformation of different scales in Gansu, China. Catena 2015, 125, 190–199. [Google Scholar] [CrossRef]
- Baranova, A.; Schickhoff, U.; Wang, S.; Jin, M. Mountain pastures of Qilian Shan: Plant communities, grazing impact and degradation status (Gansu province, NW China). Hacquetia 2016, 15, 21–35. [Google Scholar] [CrossRef]
- Ren, L.; Ma, W.; Li, G.; Li, J. Temporal and spatial distribution pattern of land desertification sensitivity in agro-pastoral ecotone of Gansu province. J. Arid Land Resour. Environ. 2022, 36, 149–156. [Google Scholar] [CrossRef]
- Li, W.; Yan, Z. Analysis of spatiotemporal evolution of land use and its driving mechanism in the agro-pastoral ecotone of Gansu Province using Geodetector. Arid Zone Res. 2024, 41, 590–602. [Google Scholar] [CrossRef]
- Yan, M.; Kou, J.; Ma, W.; Jian, Y.; Yang, H.; Xue, B.; Gou, X. Scale effect of population and area exposed to water scarcity based on different recurrence periods: A case study of Gansu Province, China. Ecol. Indic. 2023, 157, 111254. [Google Scholar] [CrossRef]
- Fang, F.; Wang, J.; Lin, J.; Xu, Y.; Lu, G.; Wang, X.; Huang, P.; Huang, Y.; Yin, F. Risk assessment of maize yield losses in Gansu Province based on spatial econometric analysis. Agriculture 2023, 13, 1280. [Google Scholar] [CrossRef]
- Zhang, C.; McBean, E.A. Adaptation investigations to respond to climate change projections in Gansu Province, Northern China. Water Resour. Manag. 2014, 28, 1531–1544. [Google Scholar] [CrossRef]
- Singh, D.K.; Singh, K.K.; Petropoulos, G.P.; Boaz, P.S.; Jain, P.; Singh, S.; Gupta, D.K.; Sood, V. Spatiotemporal Vegetation Variability and Linkage with Snow-Hydroclimatic Factors in Western Himalaya Using Remote Sensing and Google Earth Engine (GEE). Remote Sens. 2023, 15, 5239. [Google Scholar] [CrossRef]
- Garba, H.; Udokpoh, U.U. Analysis of trend in meteorological and hydrological time-series using Mann-Kendall and Sen’s slope estimator statistical test in Akwa Ibom State, Nigeria. Int. J. Environ. Clim. Chang. 2023, 13, 1017–1035. [Google Scholar] [CrossRef]
- Milich, L.; Weiss, E. GAC NDVI interannual coefficient of variation (CoV) images: Ground truth sampling of the Sahel along north-south transects. Int. J. Remote Sens. 2000, 21, 235–260. [Google Scholar] [CrossRef]
- Sanz, E.; Sotoca, J.J.M.; Saa-Requejo, A.; Díaz-Ambrona, C.H.; Ruiz-Ramos, M.; Rodríguez, A.; Tarquis, A.M. Clustering arid rangelands based on NDVI annual patterns and their persistence. Remote Sens. 2022, 14, 4949. [Google Scholar] [CrossRef]
- Huo, H.; Sun, C. Spatiotemporal variation and influencing factors of vegetation dynamics based on Geodetector: A case study of the northwestern Yunnan Plateau, China. Ecol. Indic. 2021, 130, 108005. [Google Scholar] [CrossRef]
- Shahfahad; Talukdar, S.; Naikoo, M.W.; Rahman, A. Urban expansion and vegetation dynamics: The role of protected areas in preventing vegetation loss in a growing mega city. Habitat Int. 2024, 150, 103129. [Google Scholar] [CrossRef]
- Jiang, H.; Xu, X.; Guan, M.; Wang, L.; Huang, Y.; Jiang, Y. Determining the contributions of climate change and human activities to vegetation dynamics in agro-pastural transitional zone of northern China from 2000 to 2015. Sci. Total Environ. 2020, 718, 134871. [Google Scholar] [CrossRef]
- He, Q.; Chun, K.P.; Dieppois, B.; Chen, L.; Fan, P.Y.; Toker, E.; Yetemen, O.; Pan, X. Investigating and predicting spatiotemporal variations in vegetation cover in transitional climate zone: A case study of Gansu (China). Theor. Appl. Climatol. 2022, 150, 283–307. [Google Scholar] [CrossRef]
- Shumilovskikh, L.S.; Novenko, E.; Giesecke, T. Long-term dynamics of the East European forest-steppe ecotone. J. Veg. Sci. 2018, 29, 416–426. [Google Scholar] [CrossRef]
- Sun, W.; Song, X.; Mu, X.; Gao, P.; Wang, F.; Zhao, G. Spatiotemporal vegetation cover variations associated with climate change and ecological restoration in the Loess Plateau. Agric. For. Meteorol. 2015, 209–210, 87–99. [Google Scholar] [CrossRef]
- Zuo, C.; Wang, J.; Zhang, X.; Ye, H.; Wang, S.; Watson, A.E.; Li, Y.; Zhao, X. Drought will constrain ongoing increase in net ecosystem productivity under future climate warming over alpine grasslands on the Qinghai-Tibetan Plateau, China. Ecol. Indic. 2023, 154, 110823. [Google Scholar] [CrossRef]
- Sasaki, T.; Okayasu, T.; Jamsran, U.; Takeuchi, K. Threshold changes in vegetation along a grazing gradient in Mongolian rangelands. J. Ecol. 2008, 96, 145–154. [Google Scholar] [CrossRef]
- Schönbach, P.; Wan, H.; Gierus, M.; Bai, Y.; Müller, K.; Lin, L.; Susenbeth, A.; Taube, F. Grassland responses to grazing: Effects of grazing intensity and management system in an Inner Mongolian steppe ecosystem. Plant Soil 2011, 340, 103–115. [Google Scholar] [CrossRef]
- Wang, L.; Jia, Z.; Li, Q.; He, L.; Tian, J.; Ding, W.; Liu, T.; Gao, Y.; Zhang, J.; Han, D.; et al. Grazing impacts on soil enzyme activities vary with vegetation types in the forest-steppe ecotone of northeastern China. Forests 2023, 14, 2292. [Google Scholar] [CrossRef]
- Oh, S.G.; Park, J.H.; Lee, S.H.; Suh, M.S. Assessment of the RegCM4 over East Asia and future precipitation change adapted to the RCP scenarios. J. Geophys. Res. Atmos. 2014, 119, 2913–2927. [Google Scholar] [CrossRef]
- Yan, T.; Fu, Y.; Campioli, M.; Peñuelas, J.; Wang, X. Divergent responses of phenology and growth to summer and autumnal warming. Glob. Change Biol. 2021, 27, 2905–2913. [Google Scholar] [CrossRef]
- Rosenberg, N.J.; McKenney, M.S.; Martin, P. Evapotranspiration in a greenhouse-warmed world: A review and a simulation. Agric. For. Meteorol. 1989, 47, 303–320. [Google Scholar] [CrossRef]
- Li, Z.; Tian, Q.; Chong, P.; Du, W.; Wei, J.; Huang, R. Phylogenetic partitioning of Gansu flora: Unveiling the core transitional zone of Chinese flora. Plants 2023, 12, 3060. [Google Scholar] [CrossRef] [PubMed]
- Allen, B.J.; Hill, D.J.; Burke, A.M.; Clark, M.; Marchant, R.; Stringer, L.C.; Williams, D.R.; Lyon, C. Projected future climatic forcing on the global distribution of vegetation types. Phil. Trans. R. Soc. 2024, B37920230011. [Google Scholar] [CrossRef]
- Williams, J.W.; Shuman, B.; Bartlein, P.J. Rapid responses of the prairie-forest ecotone to early Holocene aridity in mid-continental North America. Glob. Planet. Chang. 2009, 66, 195–207. [Google Scholar] [CrossRef]
- Donohue, R.J.; Mcvicar, T.R.; Roderick, M.L. Climate-related trends in Australian vegetation cover as inferred from satellite observations, 1981–2006. Glob. Change Biol. 2009, 15, 1025–1039. [Google Scholar] [CrossRef]
- Henne, P.D.; Elkin, C.; Colombaroli, D.; Samartin, S.; Bugmann, H.; Heiri, O.; Tinner, W. Impacts of changing climate and land use on vegetation dynamics in a Mediterranean ecosystem: Insights from paleoecology and dynamic modeling. Landsc. Ecol. 2013, 28, 819–833. [Google Scholar] [CrossRef]
- Yang, Q.; Fan, J.; Luo, Z. Response of soil moisture and vegetation growth to precipitation under different land uses in the Northern Loess Plateau, China. Catena 2024, 236, 107728. [Google Scholar] [CrossRef]
- Shao, W.; Wang, Q.; Guan, Q.; Luo, H.; Ma, Y.; Zhang, J. Distribution of soil available nutrients and their response to environmental factors based on path analysis model in arid and semi-arid area of northwest China. Sci. Total Environ. 2022, 827, 154254. [Google Scholar] [CrossRef]
- Li, M.; Qin, Y.; Zhang, T.; Zhou, X.; Yi, G.; Bie, X.; Gao, Y. Climate change and anthropogenic activity co-driven vegetation coverage increase in the Three-North Shelter Forest region of China. Remote Sens. 2023, 15, 1509. [Google Scholar] [CrossRef]
- Zeebe, R.E. Time-dependent climate sensitivity and the legacy of anthropogenic greenhouse gas emissions. Proc. Natl. Acad. Sci. USA 2013, 110, 13739–13744. [Google Scholar] [CrossRef]
- Theodosiou, M. Forecasting monthly and quarterly time series using STL decomposition. Int. J. Forecast. 2011, 27, 1178–1195. [Google Scholar] [CrossRef]
- Piao, S.; Wang, X.; Park, T.; Chen, C.; Lian, X.; He, Y.; Bjerke, J.; Chen, A.; Ciais, P.; Tømmervik, H.; et al. Characteristics, drivers and feedbacks of global greening. Nat. Rev. Earth Environ. 2020, 1, 14–27. [Google Scholar] [CrossRef]
- Lamchin, M.; Lee, W.K.; Jeon, S.W.; Wang, S.W.; Lim, C.H.; Song, C.; Sung, M. Long-term trend and correlation between vegetation greenness and climate variables in Asia based on satellite data. Sci. Total Environ. 2018, 618, 1089–1095. [Google Scholar] [CrossRef] [PubMed]
- Sekac, T.; Jana, S.K.; Pal, I. Spatio-temporal vegetation cover analysis to determine climate change in Papua New Guinea. Int. J. Disaster Resil. Built Environ. 2024, 15, 116–140. [Google Scholar] [CrossRef]
- He, L.; Guo, J.; Yang, W.; Jiang, Q.; Li, X.; Chen, S.; Zhang, M.; Li, D. Changes in vegetation in China’s drylands are closely related to afforestation compared with climate change. Sci. Total Environ. 2024, 912, 169121. [Google Scholar] [CrossRef] [PubMed]
- Prescott, C.E. Perspectives: Regenerative forestry-managing forests for soil life. For. Ecol. Manag. 2024, 554, 121674. [Google Scholar] [CrossRef]


Disclaimer/Publisher’s Note: The statements, opinions and data contained in all publications are solely those of the individual author(s) and contributor(s) and not of MDPI and/or the editor(s). MDPI and/or the editor(s) disclaim responsibility for any injury to people or property resulting from any ideas, methods, instructions or products referred to in the content. |
© 2025 by the authors. Licensee MDPI, Basel, Switzerland. This article is an open access article distributed under the terms and conditions of the Creative Commons Attribution (CC BY) license (https://creativecommons.org/licenses/by/4.0/).