1. Introduction
Radon is a radioactive, carcinogenic gas that is continuously produced in the ground as a result of natural uranium decay. It can seep into indoor environments through cracks, gaps, and other openings in the base floor structure. In addition, building materials and water used in the building may contribute to elevated indoor radon levels. Finland is among the European countries most significantly affected by elevated radon concentrations, with indoor radon levels frequently exceeding the European Union reference level of 300 Bq/m
3 [
1]. Kurkela et al. [
2] estimate that 100–170 lung cancers in Finland could be prevented annually if indoor radon concentrations were reduced to a low level of 25 Bq/m
3. Darby et al. estimated that 9% of lung cancers in Europe are attributable to radon, while the World Health Organization estimates that radon accounts for 3% to 14% of lung cancer cases globally, depending on the national average radon level and smoking prevalence [
3,
4].
The reference level for radon concentration in homes is defined as an annual average, which is appropriate given that the health risk associated with radon depends on exposure, i.e., the time-integrated radon concentration [
5]. The annual average radon concentration (AARC), however, is rarely determined through a one-year-long measurement. In Europe, AARC is typically estimated using integrated measurements conducted over a minimum period of two months [
6]. These measurements are preferably carried out during the autumn-to-spring period, and the results may be adjusted to reflect the annual average using seasonal correction factors (e.g., [
7]). In contrast, shorter measurements lasting only a few days are more commonly used in the United States [
8].
Short-term measurements, lasting only a few days, are particularly desired during real estate transactions. In response to this demand, some companies in Finland offer rapid radon tests with durations of 2–5 days. Additionally, certain libraries and local homeowner associations have acquired electronic radon detectors that can be borrowed for short-term measurements. In contrast, Finnish authorities require a minimum measurement duration of two months during the designated measurement season (1 September to 31 May) for radon monitoring in workplaces and public buildings [
9]. Furthermore, these measurements must be conducted using a method approved by the Radiation and Nuclear Safety Authority of Finland (STUK) and must comply with the quality criteria specified in national regulatory guidelines [
10]. From a consumer perspective, the coexistence of short-term commercial testing and stricter regulatory requirements may create confusion.
Factors affecting temporal variations in radon concentration in dwellings are well documented (e.g., [
11]). These include the automation of building systems, the activities of residents, and prevailing weather conditions. Radon concentration within a home can fluctuate significantly even within a single day due to factors such as ventilation or changes in wind direction and speed. Periodic diurnal and seasonal fluctuations in indoor radon concentrations have also been well documented (e.g., [
12]). Consequently, short-term measurements may provide only a coarse approximation of the AARC. To address this limitation, a novel approach has recently been proposed that estimates the AARC by adjusting the result of a three-week radon measurement using a correction factor derived from key influencing parameters, such as outdoor temperature and wind speed [
13].
Certain characteristics unique to Finland suggest that temporal variations in radon concentration, as quantified in other parts of the world, may not necessarily apply to Finnish conditions. In Finland, more than 60% of buildings are constructed with a concrete or block foundation wall and a separately cast ground-supported slab [
14]. The joint between the slab and the foundation wall is recommended to be sealed with bitumen membranes. However, in older buildings, such sealing is often absent, leaving a significant amount of potential leakage area in the base floor. Additionally, radon prevention using geomembranes is not practiced in Finland.
Another contributing factor is Finland’s cold climate, which creates a substantial temperature difference between indoor and outdoor air during winter. This temperature difference generates a pressure gradient at the base floor level, driving air from the ground into the building [
15]. Due to the cold climate, ventilation is typically minimized, and building walls and roofs are made as airtight as possible to conserve energy. These practices further increase indoor radon concentrations in Finnish homes.
Electric-powered, continuous radon monitors are now very affordable and available in numerous different models [
16]. The authorities often receive inquiries from concerned citizens regarding what actions to take when a radon monitor displays a momentary radon concentration that exceeds the reference level. To provide direct answers to such questions—e.g., assessing the risk of exceeding the reference level for a given radon concentration and measurement duration—it has become necessary to investigate short-term variations in radon concentration in greater detail.
This study also aimed to investigate short-term variations in radon levels in Finnish homes and to contribute to knowledge about short-term variability in radon concentrations in the Nordic countries and Europe. The findings can be utilized in studies relying on short-term radon measurements and in standardization efforts for developing a unified European radon measurement protocol.
Perhaps the most interesting analysis of the data is the investigation of the probability that a measurement result below the reference value is a false negative. In such cases, a resident might live for years in an apartment where a short-term measurement mistakenly suggested that the radon concentration was below the reference level. Conversely, it is also interesting to examine the probability of obtaining a false positive from measurement results exceeding the reference value. Companies offering free short-term measurements typically aim to sell radon mitigation services once a measurement result above the reference value is observed. Hence, an additional aim was to determine action levels for short-term measurements, if feasible.
Another objective was to examine the uncertainties associated with using generic temporal correction factors for estimating the AARC. Since our analysis focused on short-term measurements (i.e., durations shorter than a season), we do not classify these factors as “seasonal”, as these primarily account for short-term fluctuations (e.g., wind direction and speed, as well as resident activities) that are independent of seasonal variations. In Finland, a single seasonal correction factor is applied to all radon measurement results obtained during the measurement season (1 September–31 May). It has been considered too complex to implement correction factors accounting for the starting month and measurement duration. The dataset of this study enabled a probabilistic analysis to evaluate the magnitude of errors in different scenarios when short-term measurement results are corrected using generic temporal correction factors.
2. Materials and Methods
2.1. Selection of Test Homes
This study was part of an ongoing four-year research project aimed at investigating the year-to-year variability in AARC in Finnish homes, the results of which will be reported later. The project entails conducting four consecutive year-long radon measurements using track-etch detectors in approximately 300 homes. In April 2021, 1000 homes were selected from the national radon registry, which is maintained by STUK in accordance with the Finnish Radiation Act. The registry contains radon measurement results for approximately 179,000 dwellings and 30,000 workplaces. The selection criteria were as follows:
All seven regions of Finland were covered in proportion to their population.
The construction year of the buildings was proportioned to the national data (separately for detached, semi-detached, and terraced houses, and blocks of flats).
The building type (detached, semi-detached, and terraced houses, and apartment buildings) was proportioned to national statistics.
The most recent radon measurement had been conducted after 1 January 2013.
The radon concentration ranged from 50 to 300 Bq/m3.
The second-to-last criterion was selected with the objective of enhancing participation, based on the assumption that the resident who conducted the measurement continues to live at the same address and is thus more inclined to participate. The final criterion was chosen to ensure that no radon remediation measures would be required during the study period.
The aim was to select approximately 300 test homes. Initially, 600 invitations were sent (randomly selected from the list of 1000 homes) to the homeowners. This ensured a reserve in case the desired number of homes was not reached during the first round of invitations. The first invitation round was successful, and 277 homes agreed to participate.
Before the third year of measurement with track-etch detectors, participants were invited to take part in a year-long continuous radon monitoring study to examine short-term variations in radon concentrations. The response was highly positive, and all 60 continuous radon monitors allocated for the study were reserved. In addition, a colleague from Sweden joined the study because he was measuring radon levels in his own home using a calibrated radon monitor of the same model as the one used in this study. The climatic conditions in Finland and Sweden and the radon levels in homes are very similar.
2.2. Characterization of Data and Test Homes
Out of the sixty radon monitors sent out, one was not returned despite repeated efforts. Two meters were acknowledged as received but had not been removed from their packaging for the entire year, and no measurements had been taken with them. In two cases, the residents decided to carry out radon mitigation during the measurement period, so these datasets also had to be excluded from the analysis. In one case, the meter malfunctioned to the extent that data could not be retrieved. As a result, 54 datasets from Finland and one from Sweden were included in the analysis.
Forty-two datasets covered the entire year (leap year, 366 days). In some cases, residents had, contrary to instructions, turned off the monitors during, for example, their vacations, resulting in 9 cases where the measured days ranged from 338 to 364. In four cases, results were obtained for only part of the year (186–292 days). In the datasets with <360 days of measurement data, however, the annual average could be determined using a track-etch detector, which was located in the same room and measured the average concentration over the entire year.
Table 1 shows the description of the participating dwellings and a comparison with official statistics or the national survey on radon in homes conducted in 2006 [
14,
17]. Although 60 homes were selected for continuous measurements in the order of registration, the measured homes represent Finnish dwellings quite well. Southern Finland is slightly underrepresented in this study, while Western and Inland Finland are overrepresented. On the other hand, the years of construction, foundation types, ventilation methods, and radon levels represent the national housing stock excellently. No blocks of flats were included in this study; therefore, the results apply only to detached, semi-detached, and terraced houses.
2.3. The Measuring Instruments and Calibration
The measuring instruments used in this study were RadonEye Plus2 radon monitors (RadonFTLab, Ansan-si, Republic of Korea). All monitors were calibrated at STUK’s Radon Standard Laboratory prior to the measurements, except for the Swedish unit, which was calibrated at the Radon Laboratory of the Swedish Radiation Safety Authority. RadonEye monitors are characterized by high detection efficiency and a very short response time, making them particularly suitable for studying temporal variations in radon concentration [
18,
19].
The calibration exposures were conducted in two batches of 30 detectors in a 1.6 m3 radon chamber. In both batches, the detectors were exposed to three radon concentrations: approximately 300, 700, and 1500 Bq/m3. The exposure duration was at least 17 h for the higher concentrations and a minimum of 60 h for the 300 Bq/m3 concentration. Additionally, the background signal of the detectors was determined by exposing them to an airspace where radon had been removed using activated carbon filtration for at least 46 h.
The temperature inside the radon chambers was controlled using a thermostat and a cooler, both permanently installed in the exposure chamber (Hermetel, Orimattila, Finland). The air introduced into the chamber was humidified with a Cellkraft P-100 air humidifier (Cellkraft, Slockholm, Sweden). Radon was generated using RF flow-through radon sources (Eurostandard CZ s.r.o, Prague, Czechia) located outside of the radon chamber.
A reference instrument for radon concentration, the AlphaGuard (Bertin Instruments, Montigny-le-Bretonneux, France), whose calibration is traceable to the primary standard maintained by PTB (Braunschweig, Germany), was included in each calibration batch. Temperature and humidity during the exposures were monitored using a HygroLog HL-NT3-D logger equipped with a HygroClip HC2A-S temperature and humidity probe (Rotronic AG, Bassersdorf, Switzerland). The probe was calibrated at the national metrology institute of Finland (VTT MIKES). Additionally, air pressure was monitored with a barometer (Swema md 3000, Farsta, Swema AB, Sweden).
The calibrated monitors were sent to the test homes by mail. A detailed, illustrated user manual was included to guide the setup of the device. Additionally, users were asked to read the monitor’s data with a mobile phone and send the dataset to STUK to ensure that the device had started measuring radon levels as intended.
The track-etch detectors, whose results were utilized for nine dwellings, were produced in-house by STUK. They are based on the Makrofol detector, and no fading of the latent tracks has been observed, making them ideally suited for measurements lasting one year [
20].
2.4. Data Curation
Data stored in the instrument’s memory were read with the RadonEye+2 phone application and transferred to the Microsoft Excel program. The data were processed using a spreadsheet into which the calibration factor and the background signal value were entered. The spreadsheet automatically corrected the time based on the winter–summertime transition and calculated daily average radon concentrations according to the calibration. The spreadsheet organized the results so that January 1 was assigned the number 1 and 31 December the number 366. The spreadsheet also calculated the annual average for these days if the number of measured days was greater than 360 (N = 46). For nine locations, integrated radon measurements conducted in the same room were used to calculate the AARC.
2.5. Temporal Correction Factors
The temporal correction factor (
kC) is a dimensionless multiplier applied to the observed radon concentration from the short-term measurement (
Ct) to yield an estimate of the AARC:
Correction factors were calculated for measurement durations of 1 day, 2 days, 3 days, 5 days, 7 days, and 14 days and were arranged according to the measurement start date.
The temporal correction factor was also calculated using regression analysis, in which the slope between
Ct and AARC values was determined by setting the intercept to zero. A corresponding analysis was performed on the logarithmic transformations of the
Ct and AARC values. In the latter case, the AARC estimate was obtained as follows, where
klnC refers to the slope value fitted to the logarithmic transformations:
The data comprised approximately 470,000 hourly measurements from 55 dwellings, yielding a total of 116,846 temporal correction factor values. These factors correspond to measurement periods of 1–14 days, all initiated at midnight on a given calendar day. While the dataset would have permitted the calculation of 24 correction factors per day—one for each hourly starting time—this approach was deemed impractical due to data management constraints.
The probability distribution of the kC values was analysed, and Spearman’s correlation tests were performed to examine the correlation between the AARC and both the value and variability of kC.
Once it was demonstrated that neither the value of nor the relative variation in kC correlated with the AARC, the datasets could be merged and classified for further analysis. The initial classification was based on the month in which the measurement began. For each month, the probability distributions and statistical parameters associated with the correction factors for measurements of different durations were determined.
Next, the measurement season was examined based on this dataset. In Finland, the measurement season has been defined as running from the beginning of September to the end of May, based on data measured in 1997 [
21]. During the optimal measurement season, the variability of the measurement results is minimized, reducing the uncertainty associated with the use of the correction factor. The present study specifically investigated the range of temporal correction factor values for May and September, thereby determining the time frame for the further analysis of the dataset.
A Monte Carlo simulation was subsequently conducted to evaluate the probability that a measurement result corrected using the various generic temporal correction factors (based on the median, geometric mean (GM), or arithmetic mean (AM) of observed values as well as the regression analyses) provides a sufficiently accurate estimate of AARC. For this purpose, correction factor values derived from three-day measurements initiated between 1 October and 12 May (N = 12,073) were aggregated, and an empirical probability distribution was constructed in increments of 0.1 per mille. A measurement result was then used as the input, and five AARC estimates were calculated. The estimates were compared to the AARC, whose value was obtained from the empirical probability distribution, and each was assigned a value of one if they fell within a predefined range (±x%). This process was repeated 10 million times to determine the probability that an AARC estimate fell within the specified range.
Finally, the magnitudes of error that may be introduced by the use of generic correction factors in large radon measurement datasets, such as those used to estimate, for example, the national average radon exposure, were examined. This analysis was conducted using data from a Finnish national radon survey, based on the distribution of AARCs in detached, semi-detached, and terraced houses, which were reported to follow a log-normal distribution (GM = 80 Bq/m
3, GSD = 2.4,
N = 2866). Since the AARC values had been determined using two consecutive half-year-long measurements, they can be assumed to accurately represent the distribution [
14]. Ten million AARC values were simulated in accordance with the log-normal distribution. Based on the simulated AARCs and the empirical distribution of correction factors determined in the previous exercise, an equivalent number of measurement results were simulated for three-day measurements. The simulated measurement results were corrected using generic correction factors (median, GM, AM, slope, and slope of logarithmic transformations) and compared to the AARCs.
2.6. Probabilities of False Negatives and False Positives Occurring
Correction factor values were categorized by measurement duration (1–14 days) for the period spanning 1 October to 15 May. For each duration, the probability distribution of correction factors was determined in increments of 0.5‰. Hypothetical radon concentrations, ranging from 10 to 1000 Bq/m3 in 10 Bq/m3 increments, were simulated, with each value replicated one million times. Each replicate was corrected using a randomly selected correction factor from the corresponding distribution, thereby generating the associated AARC distribution. From these simulated distributions, probabilities were calculated for obtaining true or false negatives (for measurement results below 300 Bq/m3) and true or false positives (for measurement results above 300 Bq/m3). Based on these probabilities, various action levels were estimated such that measurements exceeding a given threshold indicate a defined risk that the AARC is above the reference level of 300 Bq/m3.
3. Results
3.1. Calibration of the Instruments
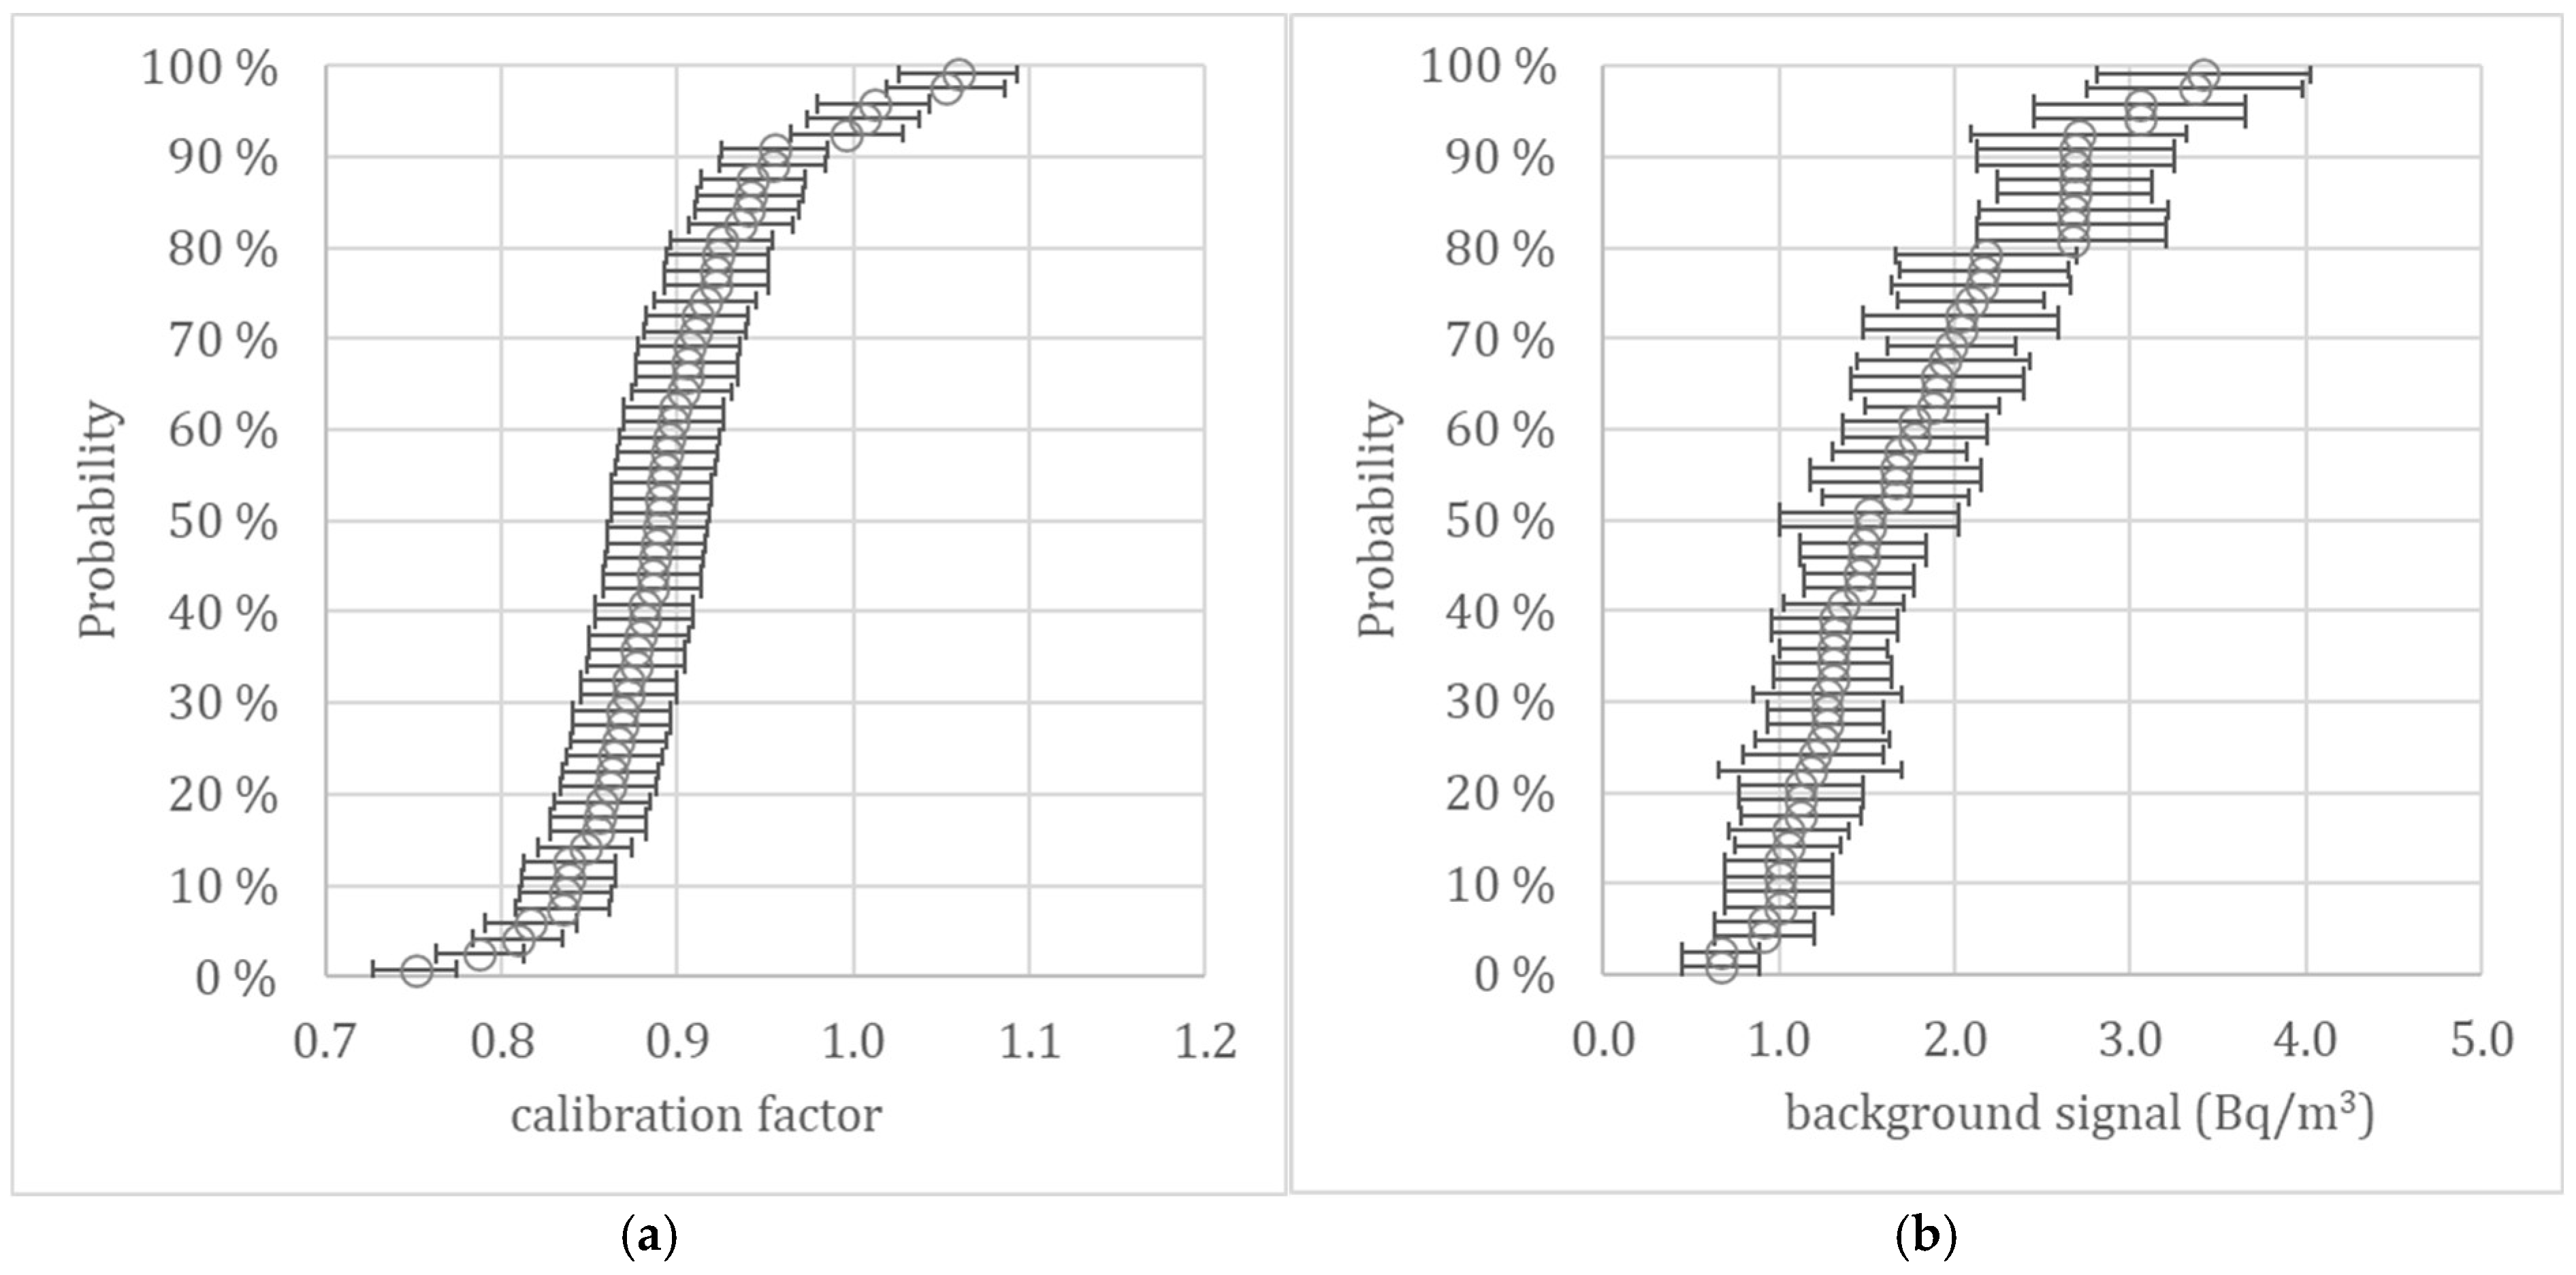
The values of the calibration factors ranged from 0.75 to 1.06, with the arithmetic mean being 0.895 (
Figure 1). The background signals of the measuring instruments ranged from 0.7 to 3.4 Bq/m
3, with the arithmetic mean being 1.7 Bq/m
3. The mean values of the calibration parameters were the same as in a previous study employing the same set of instruments [
17].
During calibration, the random uncertainty associated with different measurement durations was also theoretically assessed. According to the manufacturer, the monitor’s counting efficiency is 0.5 cpm per pCi/L, or 0.81 cph per Bq/m
3. The relative uncertainty arising from the number of observed pulses, due to the random nature of radiation, is highest at short measurement times and low concentrations. However, as shown in
Table 2, the random uncertainty is typically small.
When calculating the correction factor (AARC/short-term measurement), the calibration factor can be omitted from the calculation, as all monitors had very small background signal levels. Additionally, since the random uncertainty associated with the annual average is negligible, the uncertainty of each ratio can be approximated based solely on the random uncertainty of the short-term measurement.
3.2. Temporal Correction Factors
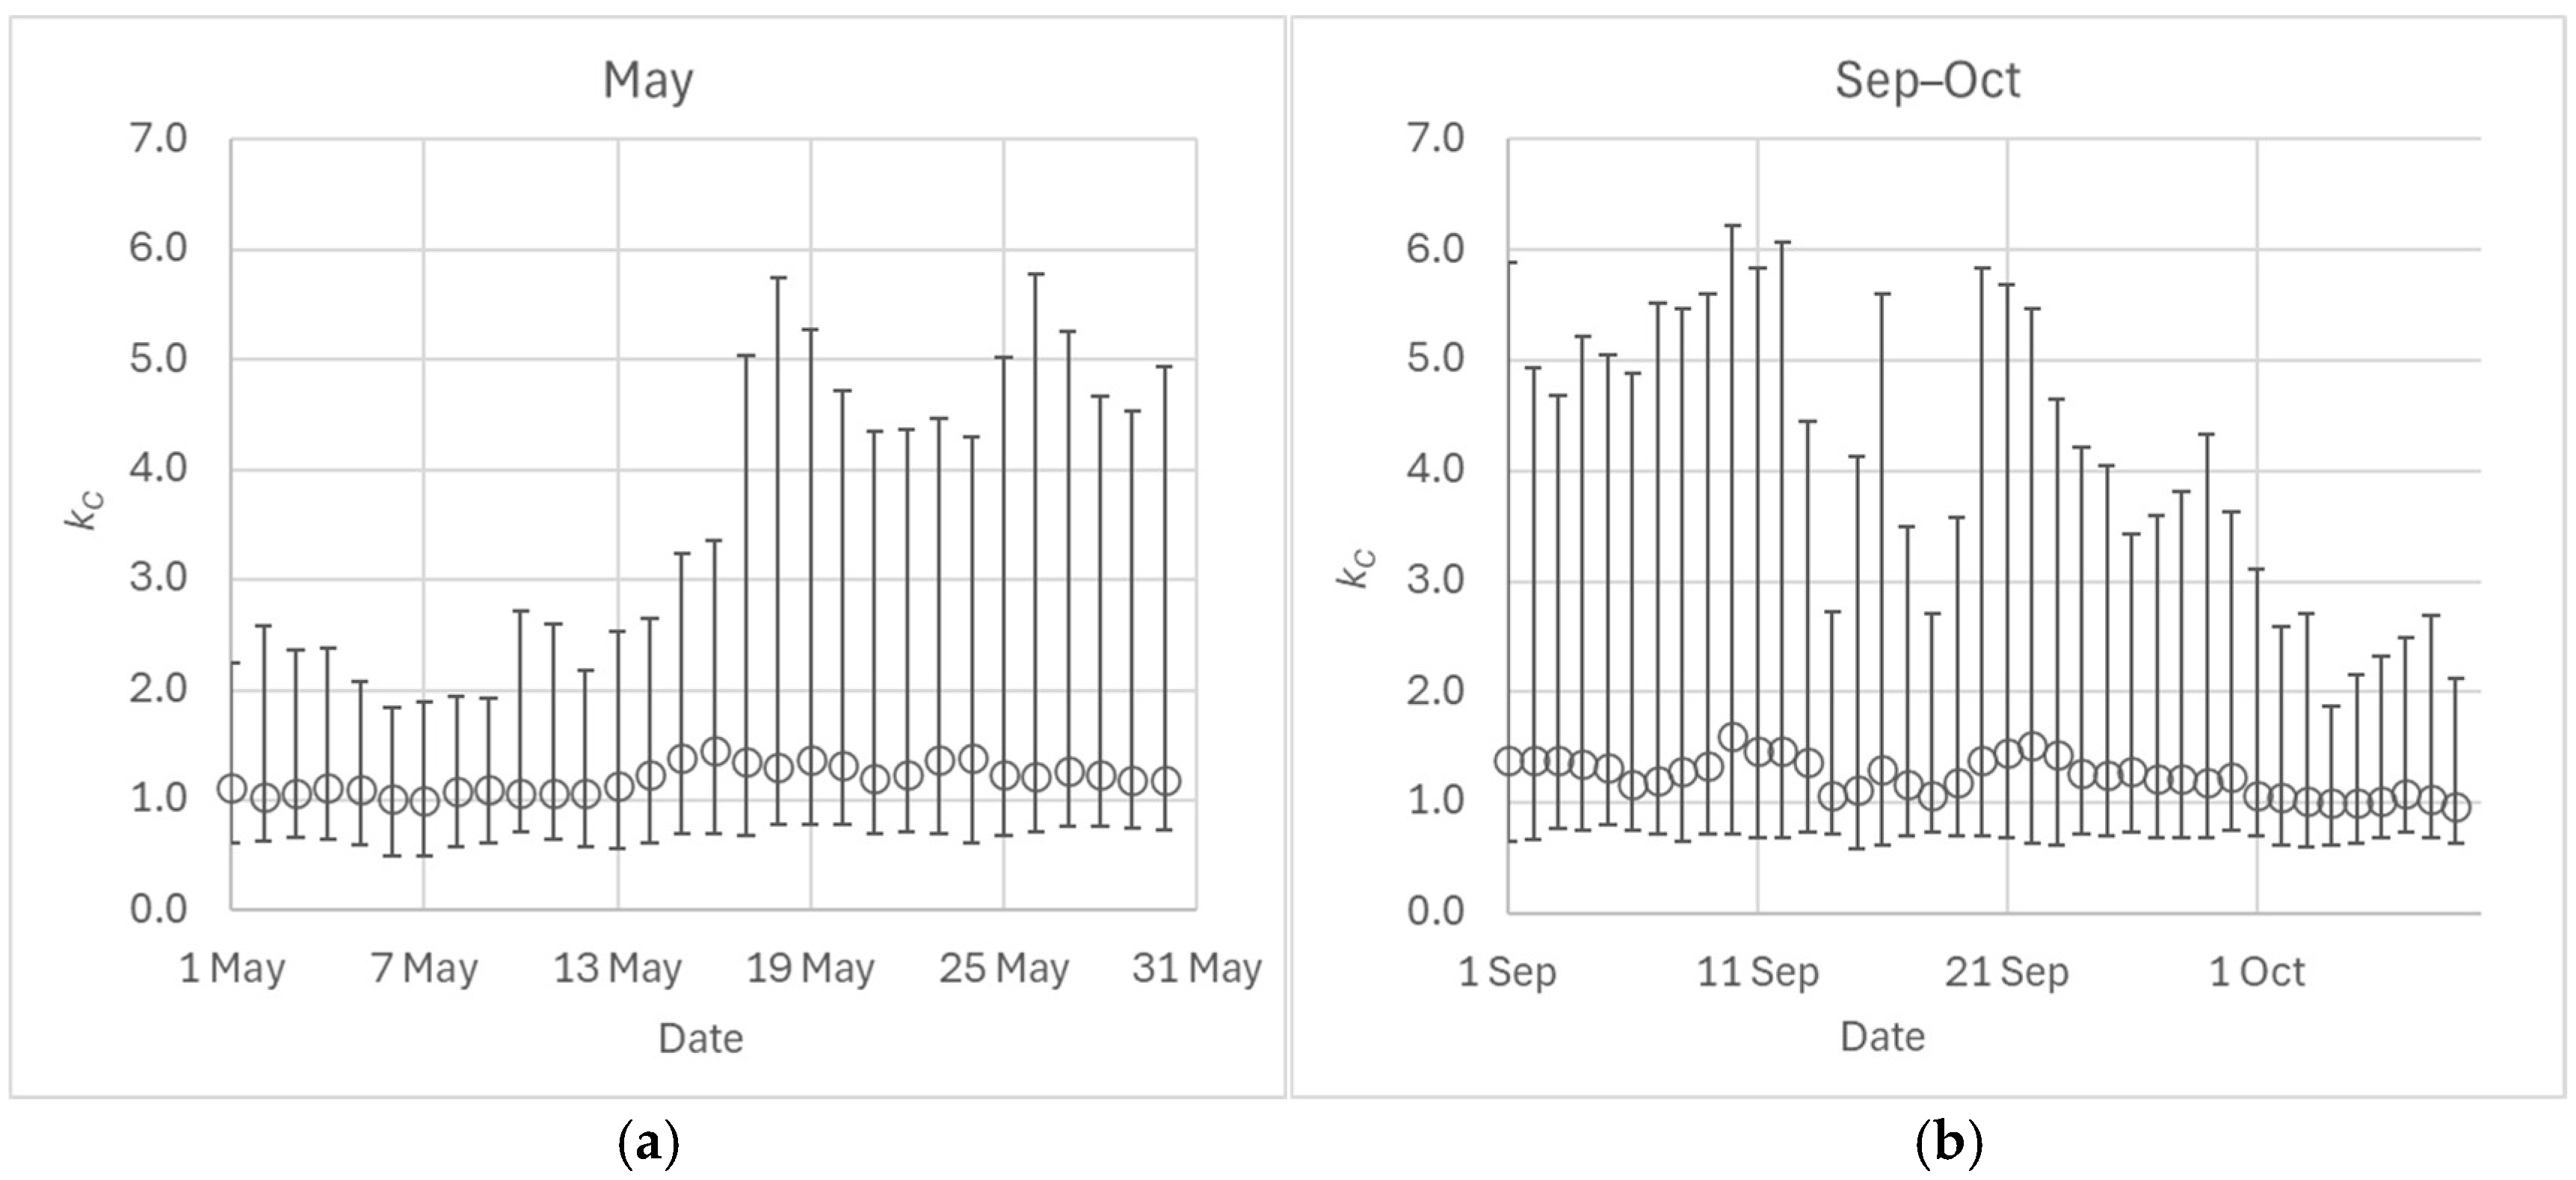
Figure 2 presents the median correction factors along with their corresponding 90% ranges for two-day measurement periods initiated on different days within May and September.
In May, the variability of correction factors increases significantly around the middle of the month. However, since the recommended measurement period is at least three months, with a minimum duration of two months, this increased variability at the end of May has a negligible impact on the overall uncertainty of the correction factor for two- or three-month measurement periods.
In contrast, September 2023 appeared to be a relatively poor month for measurements, as the high variability of the correction factors only decreases at the very end of the month. Including September in three-month measurements affects the results only moderately, but for two-month measurements, it is advisable to avoid starting from the beginning of September. Nonetheless, further analyses in this study investigating short-term measurements will be restricted to the period from 1 October to 15 May.
The probability distributions of kC values evaluated for different measurement durations and starting days or months were strongly right-skewed. Therefore, the GM was chosen to describe the average value, and the GSD, which is definitionally multiplicative and thus relative, was chosen to describe the magnitude of dwelling-specific relative variation.
Next, the dependence of the correction factor GM or GSD on the AARC was examined. The analysis was conducted for measurements starting between October 1 and May 15, with durations ranging from 1 to 14 days (
Table 3). Based on the Spearman’s correlation tests, neither the value of the GM of correction factors nor its GSD was found to be statistically significantly dependent on the AARC. For two-day measurements, the AARC and the GSD of the correction factor values exhibited a small but statistically significant negative correlation. For the same dataset, the results of the Pearson correlation indicated that there is a no linear association between AARC and GSD (
r = 0.011,
p = 0.938).
The correlation tests largely indicated that neither the correction factor’s value nor its variation depends on the AARC, suggesting that the result of the Spearman’s test for the two-day measurements is likely due to chance. Consequently, correction factors calculated based on measurements in different apartments can be combined into a single dataset and in subsequent analyses, the correction factor values can be employed without the need to account for AARC. Even if the observed correlation is genuine, it pertains specifically to the relationship between the annual mean and the variability of the correction factors, not between the annual mean and the magnitude of the correction factors. A slightly higher degree of variability in correction factors at lower annual mean concentrations does not preclude the aggregation of correction factor values obtained from different households for further analysis.
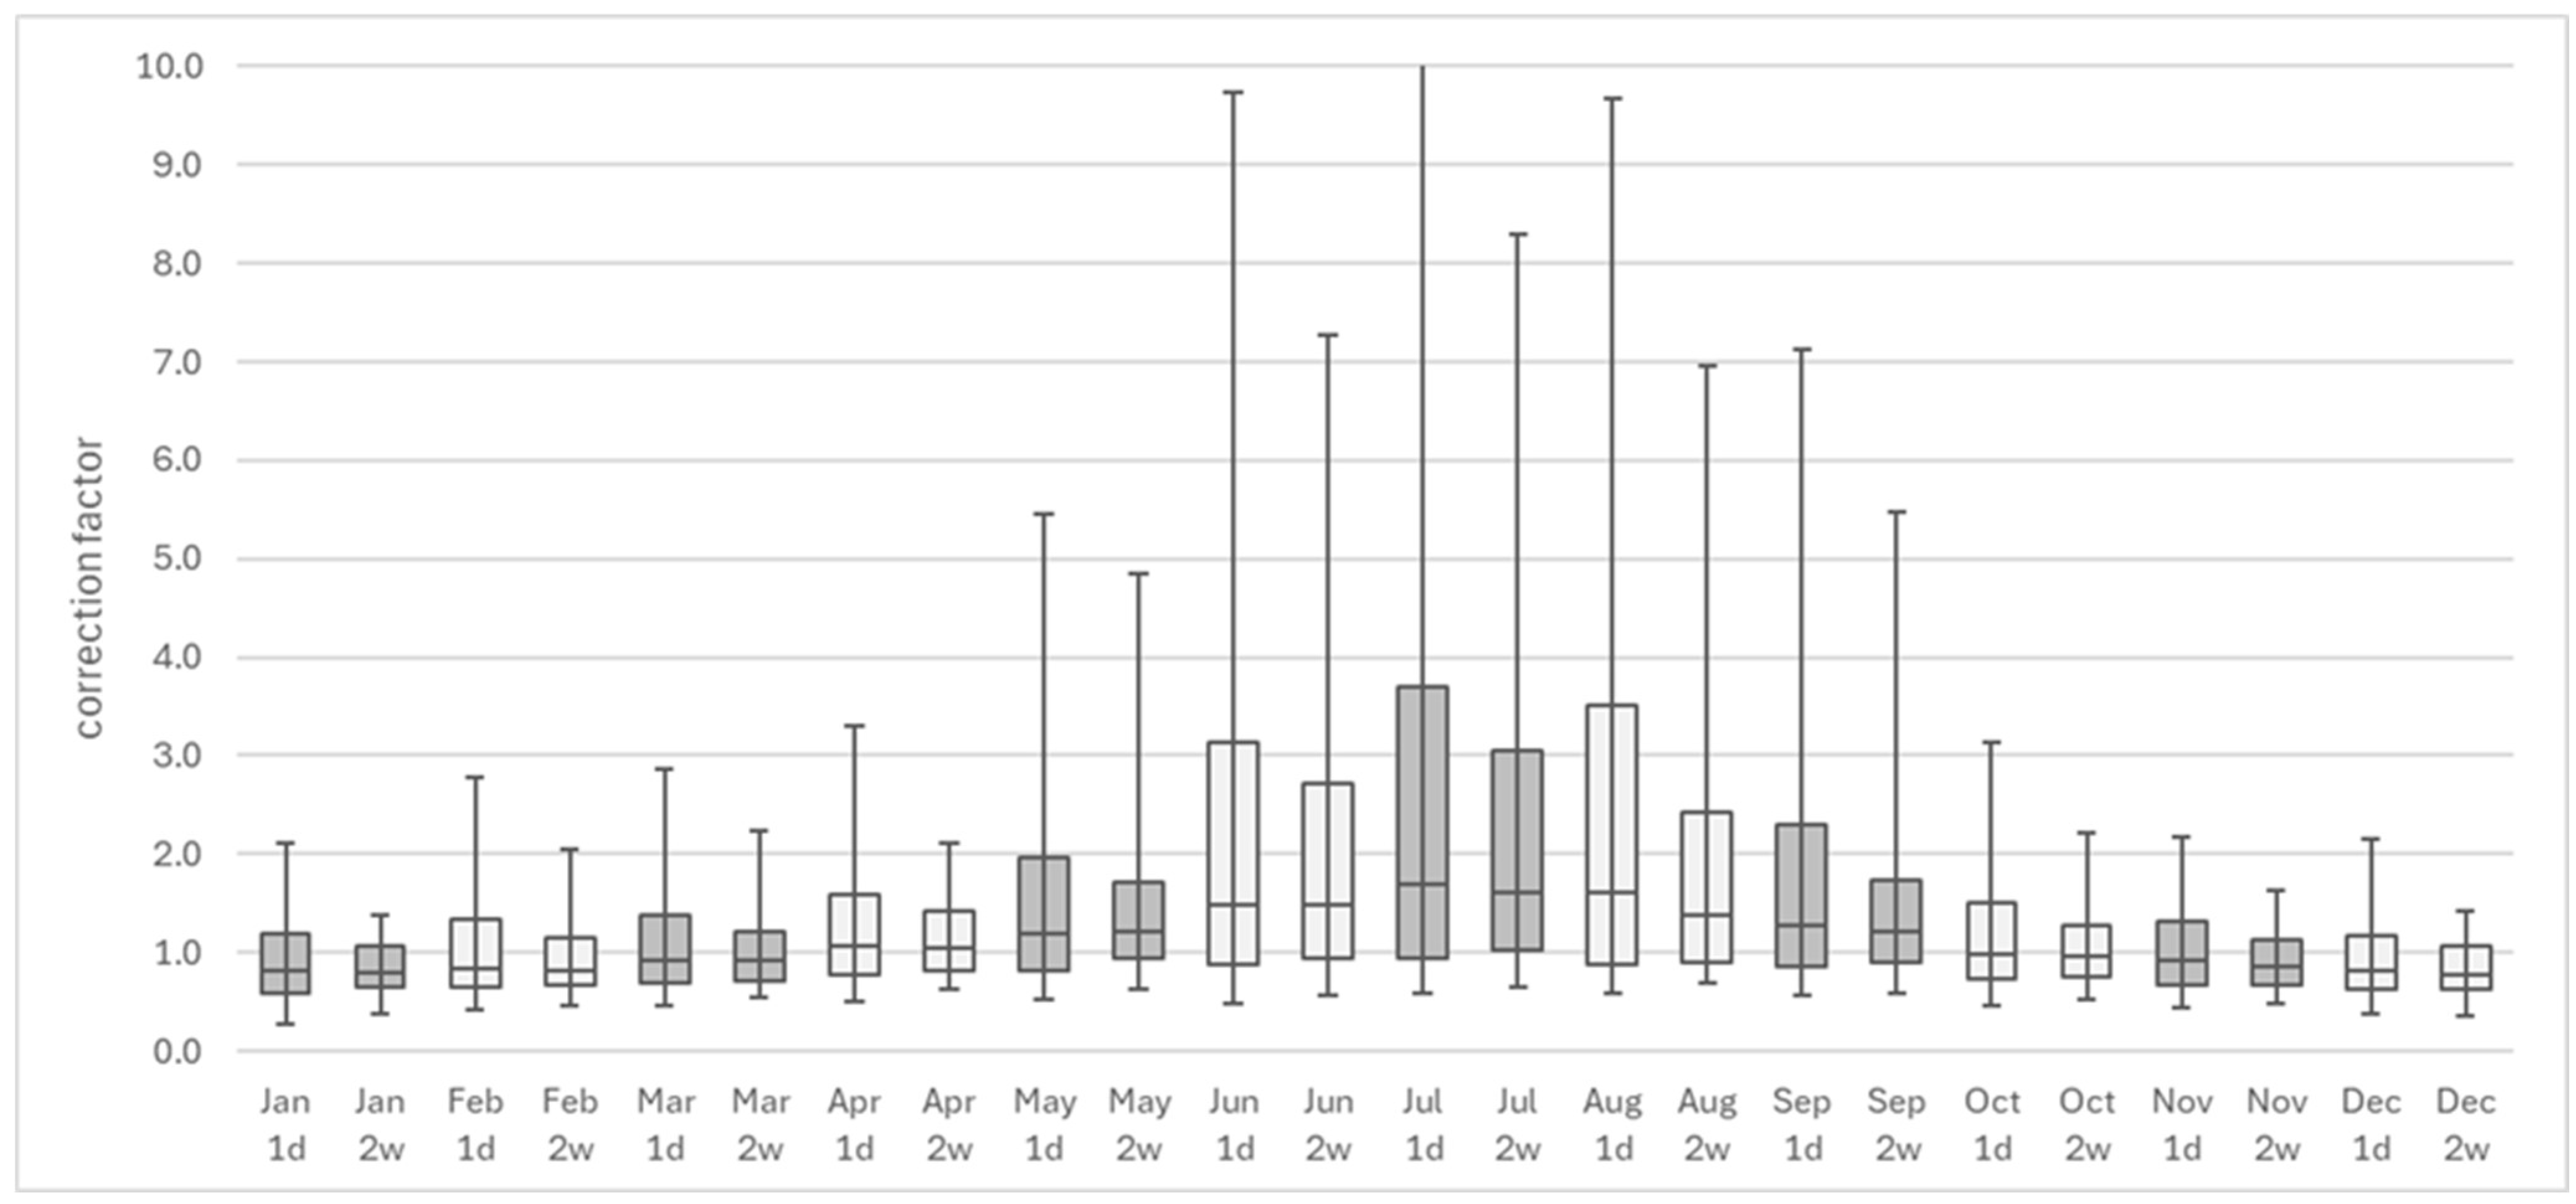
The initial analysis of the correction factors is presented in
Figure 3, which highlights the typical summer maximum and variability of radon concentrations. For measurements started in December and January, the GM of correction factors was the smallest, with the GM ranging from 0.79 to 0.85 (
Table 4).
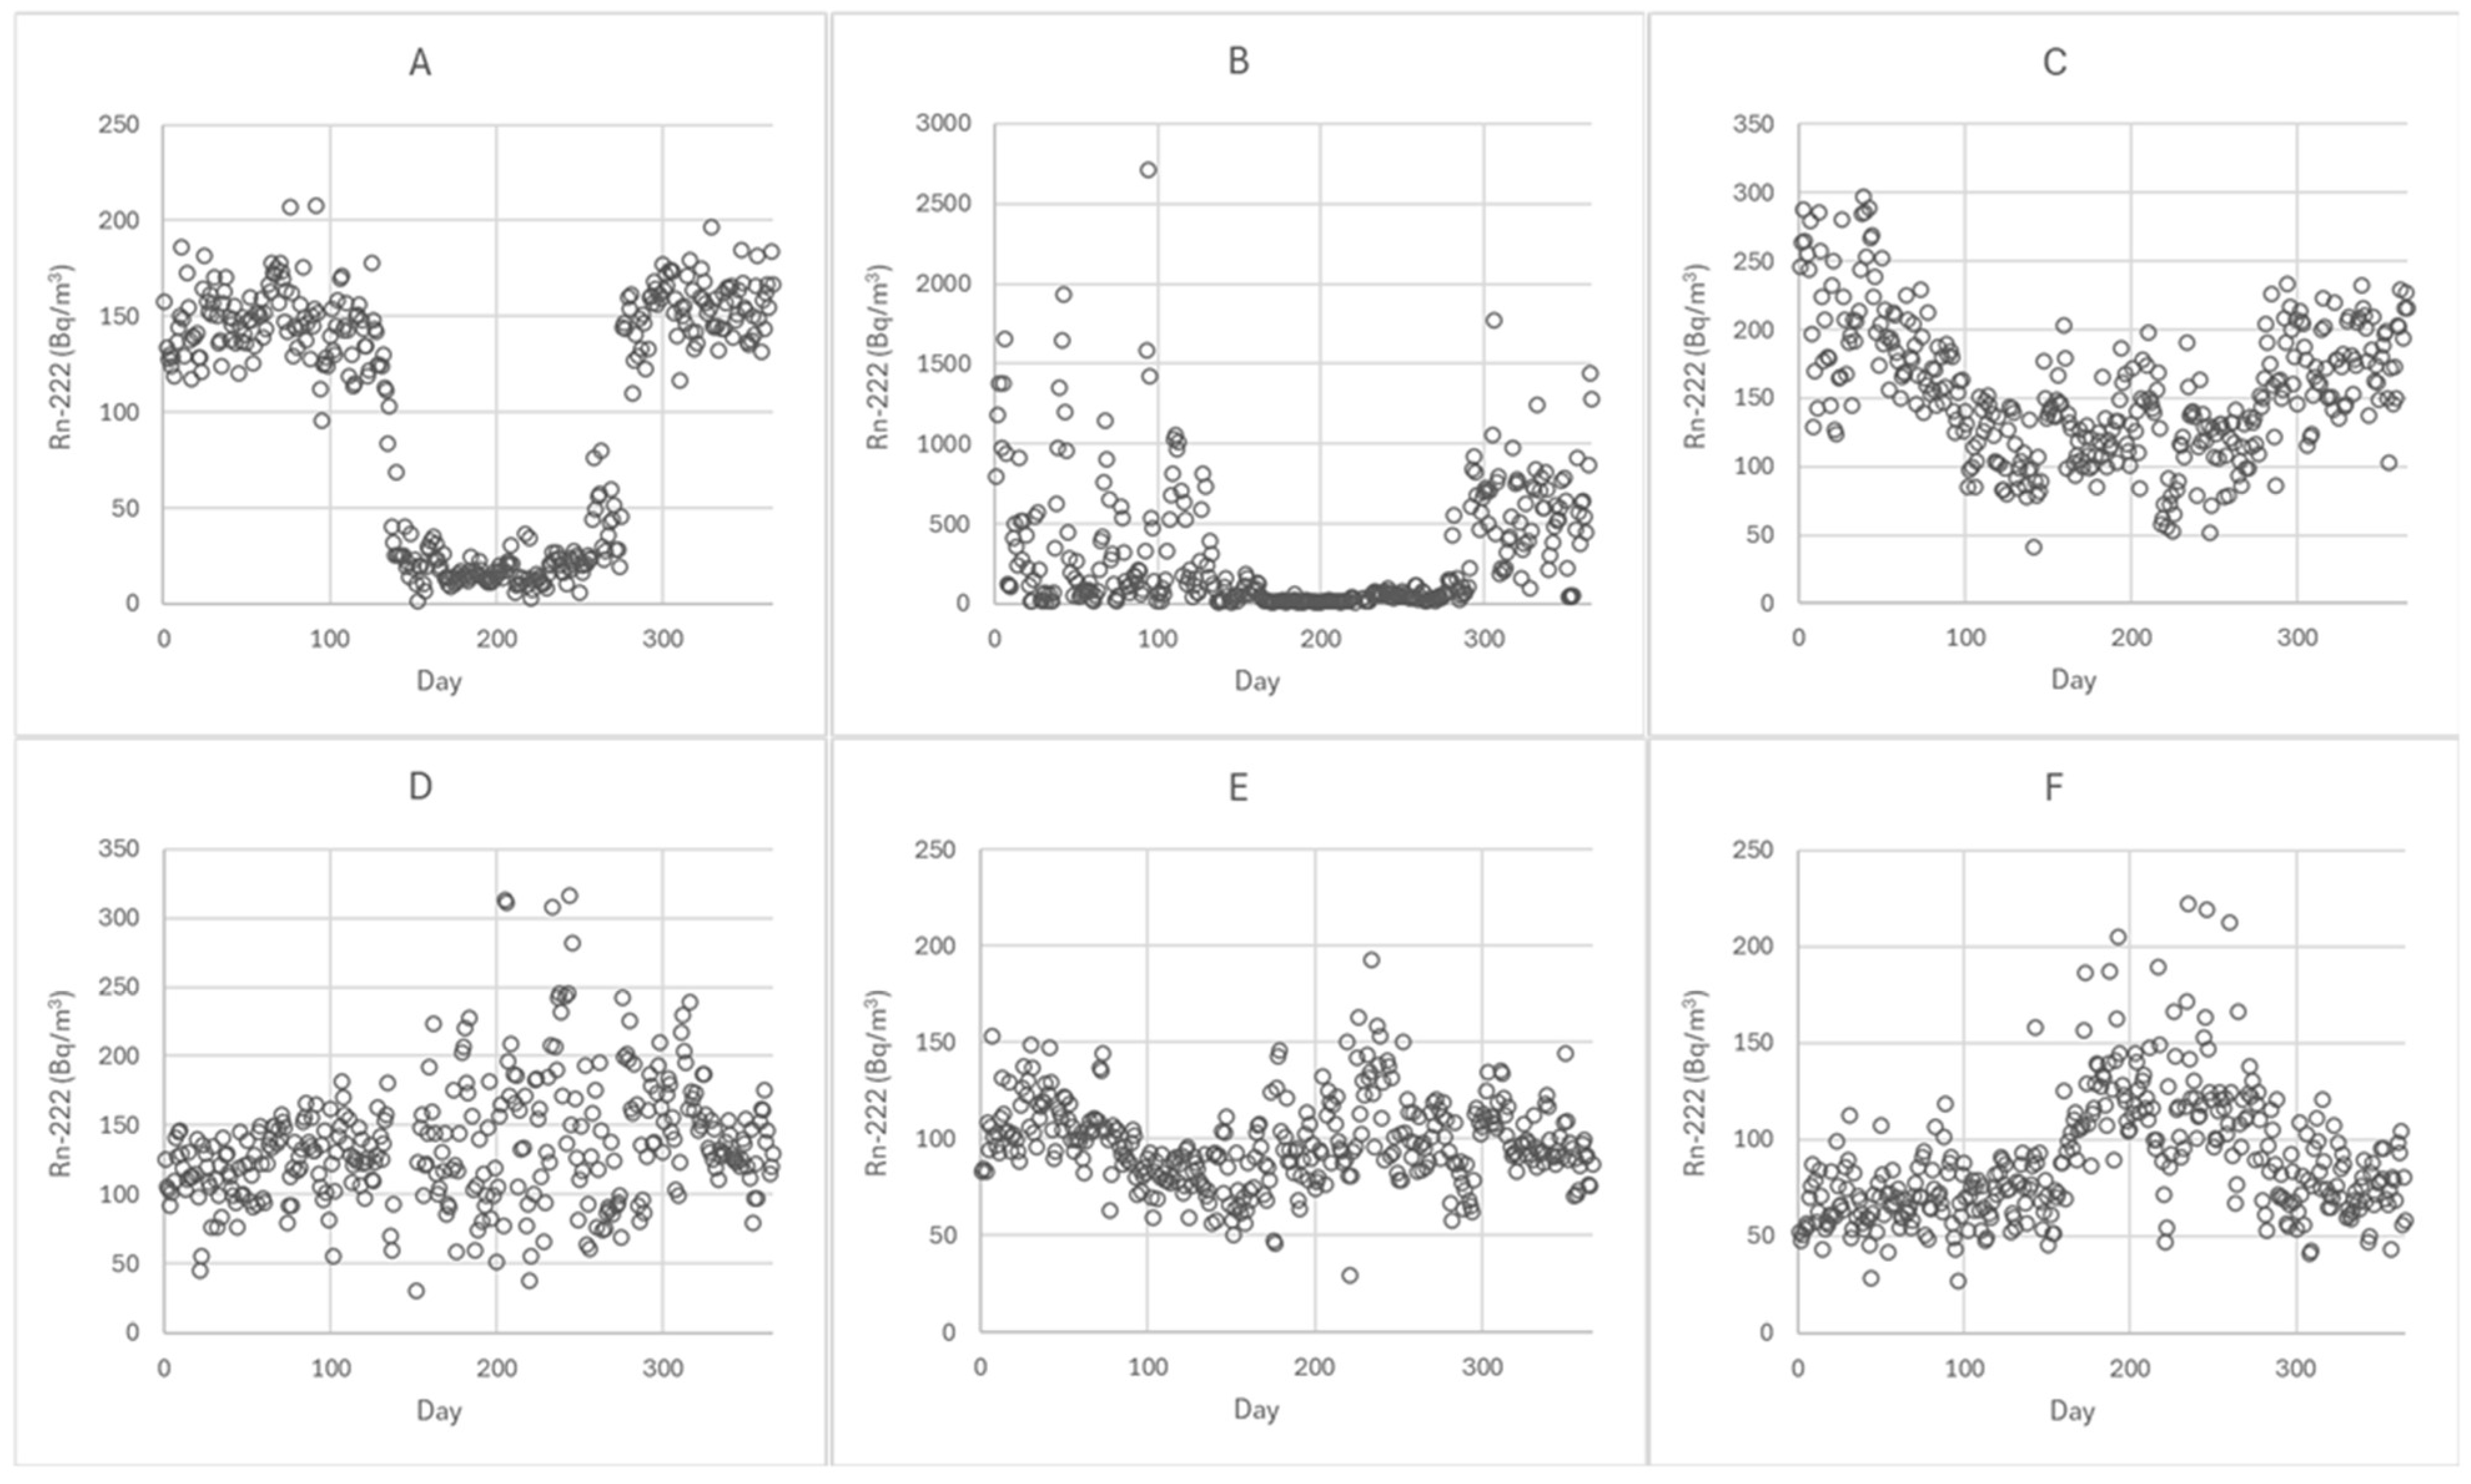
Approximately 80% of the investigated dwellings had summer radon concentrations below the AARC, with a summer-to-AARC ratio of <0.9. In four dwellings, a pronounced summer minimum was observed: the radon concentrations measured between 15 May and 31 September were only about one fifth or less of the AARC. In seven dwellings, no clear seasonal variation was detected, with a summer-to-AARC ratio of 0.9–1.1. In five dwellings, summer radon concentrations exceeded the annual average by at least 18%. Examples of daily average radon concentration measurements in various dwellings are presented in
Figure 4.
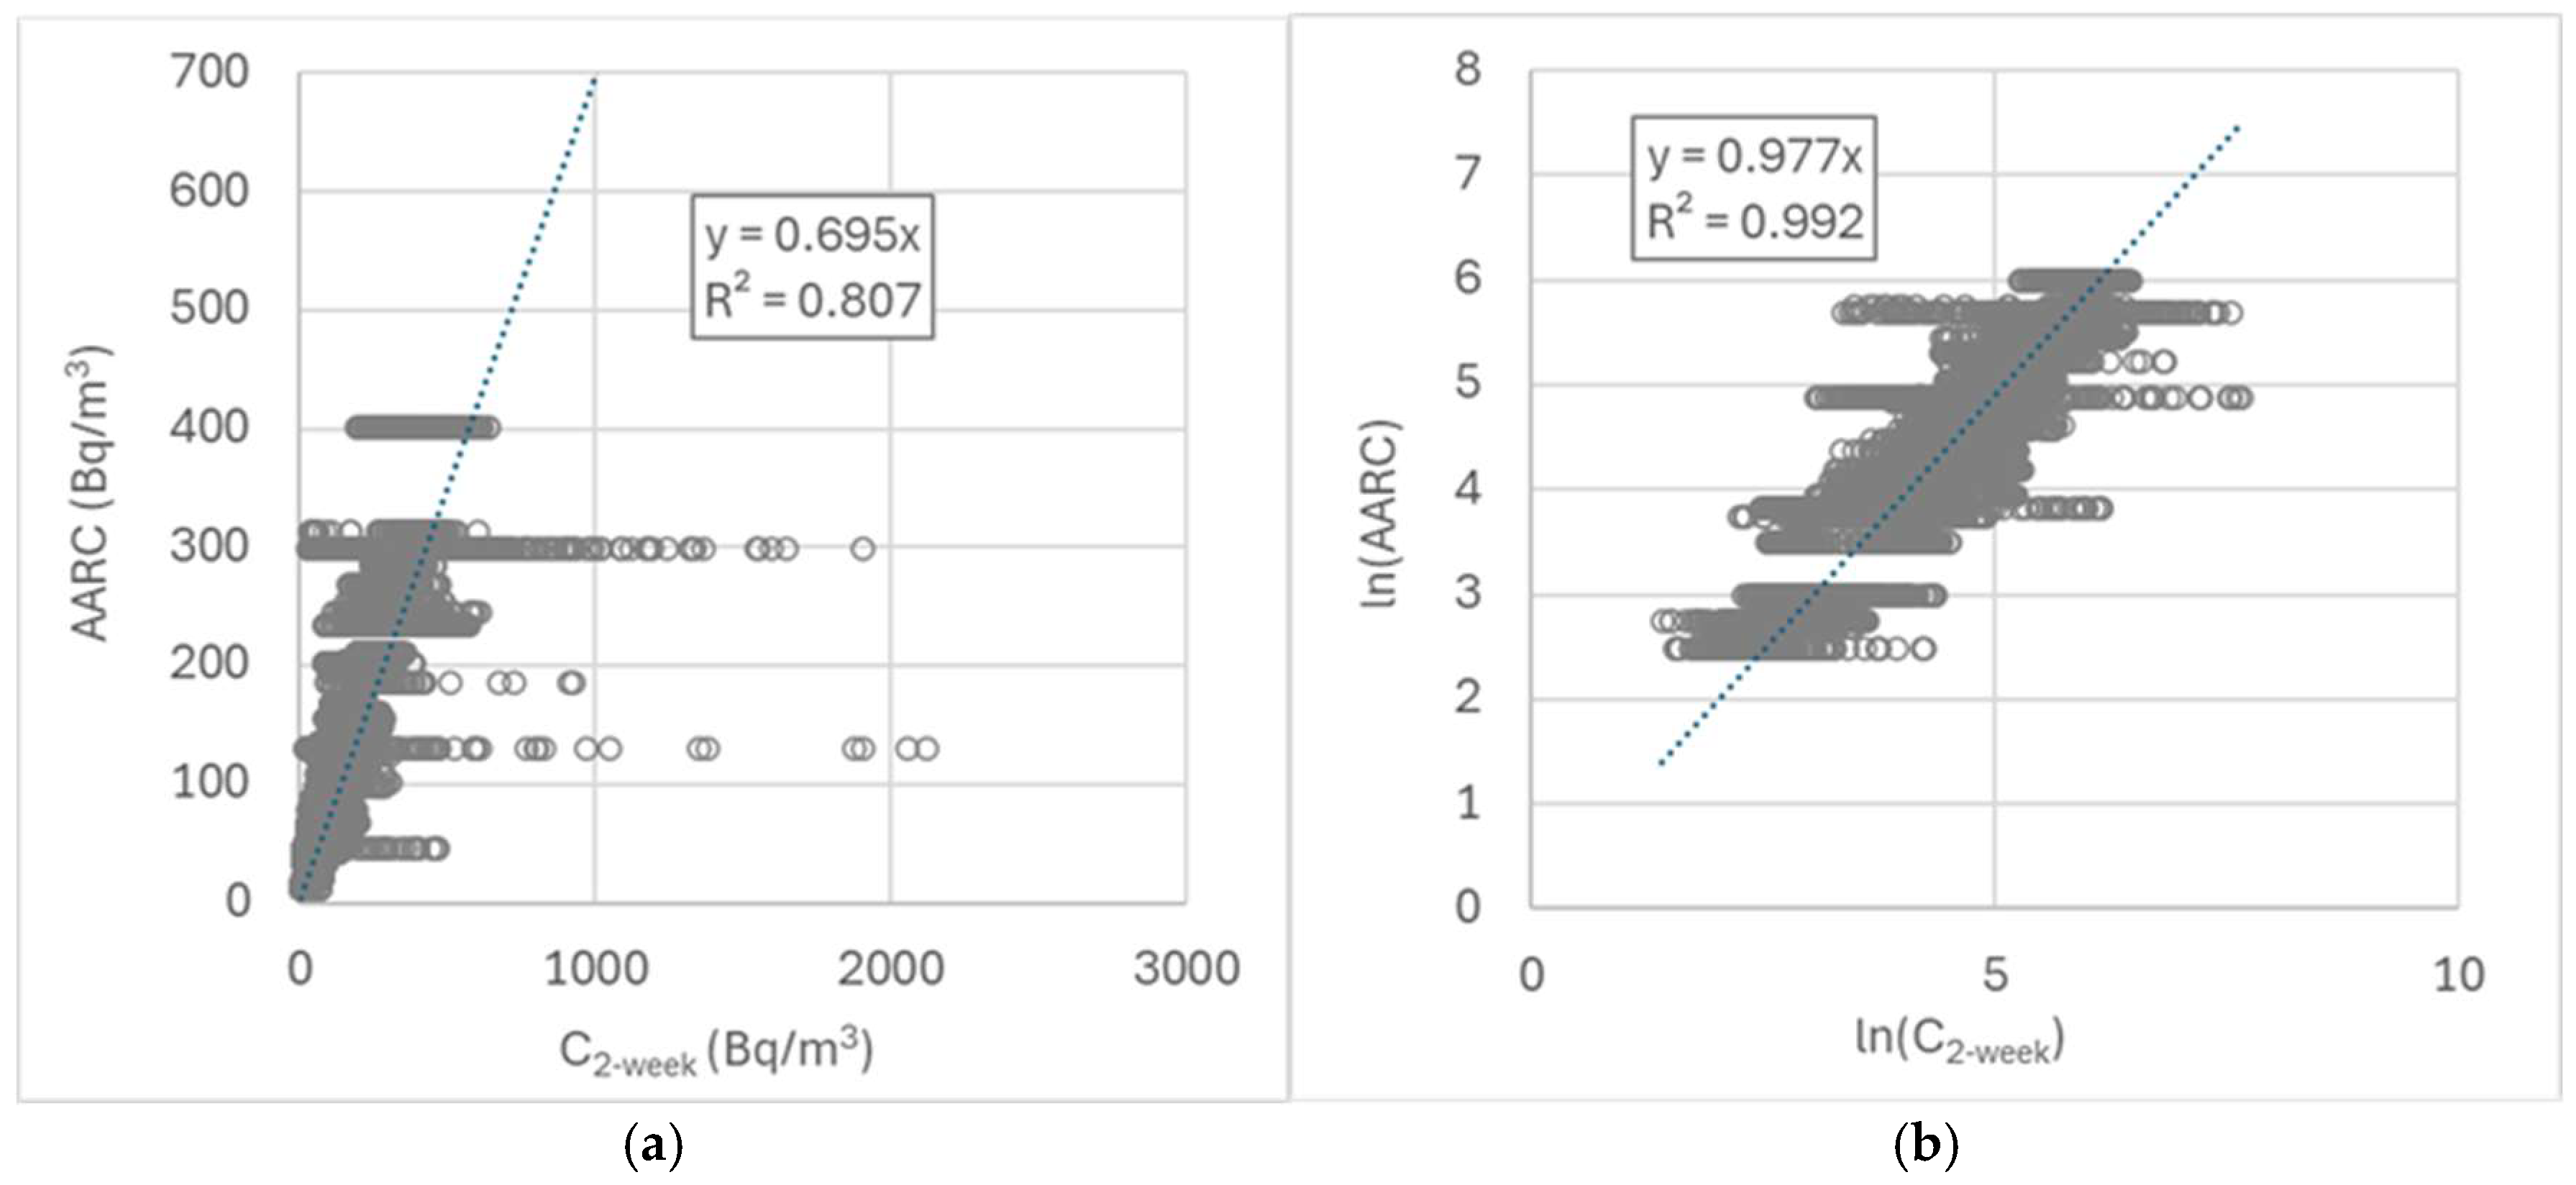
Figure 5 illustrates the log-normal distribution of the data, based on linear regression analysis of the three-day measurements and AARC, as well as their logarithmic transformations. The coefficient of determination (r
2) is notably higher for the logarithmic transformations.
Table 5 shows that different calculation methods yield varying generic values for the temporal correction factor. For all measurement durations, linear regression analysis yielded the lowest generic correction factor, while the arithmetic mean resulted in the highest. The distribution of individual correction factors is strongly right-skewed, resulting in both the median and geometric mean being significantly lower than the arithmetic mean. For measurement periods of five days or less, the arithmetic mean exceeds one, which is counterintuitive given that radon concentrations between 1 October and 15 May are typically higher than those in summer.
3.3. Use of Temporal Correction Factors
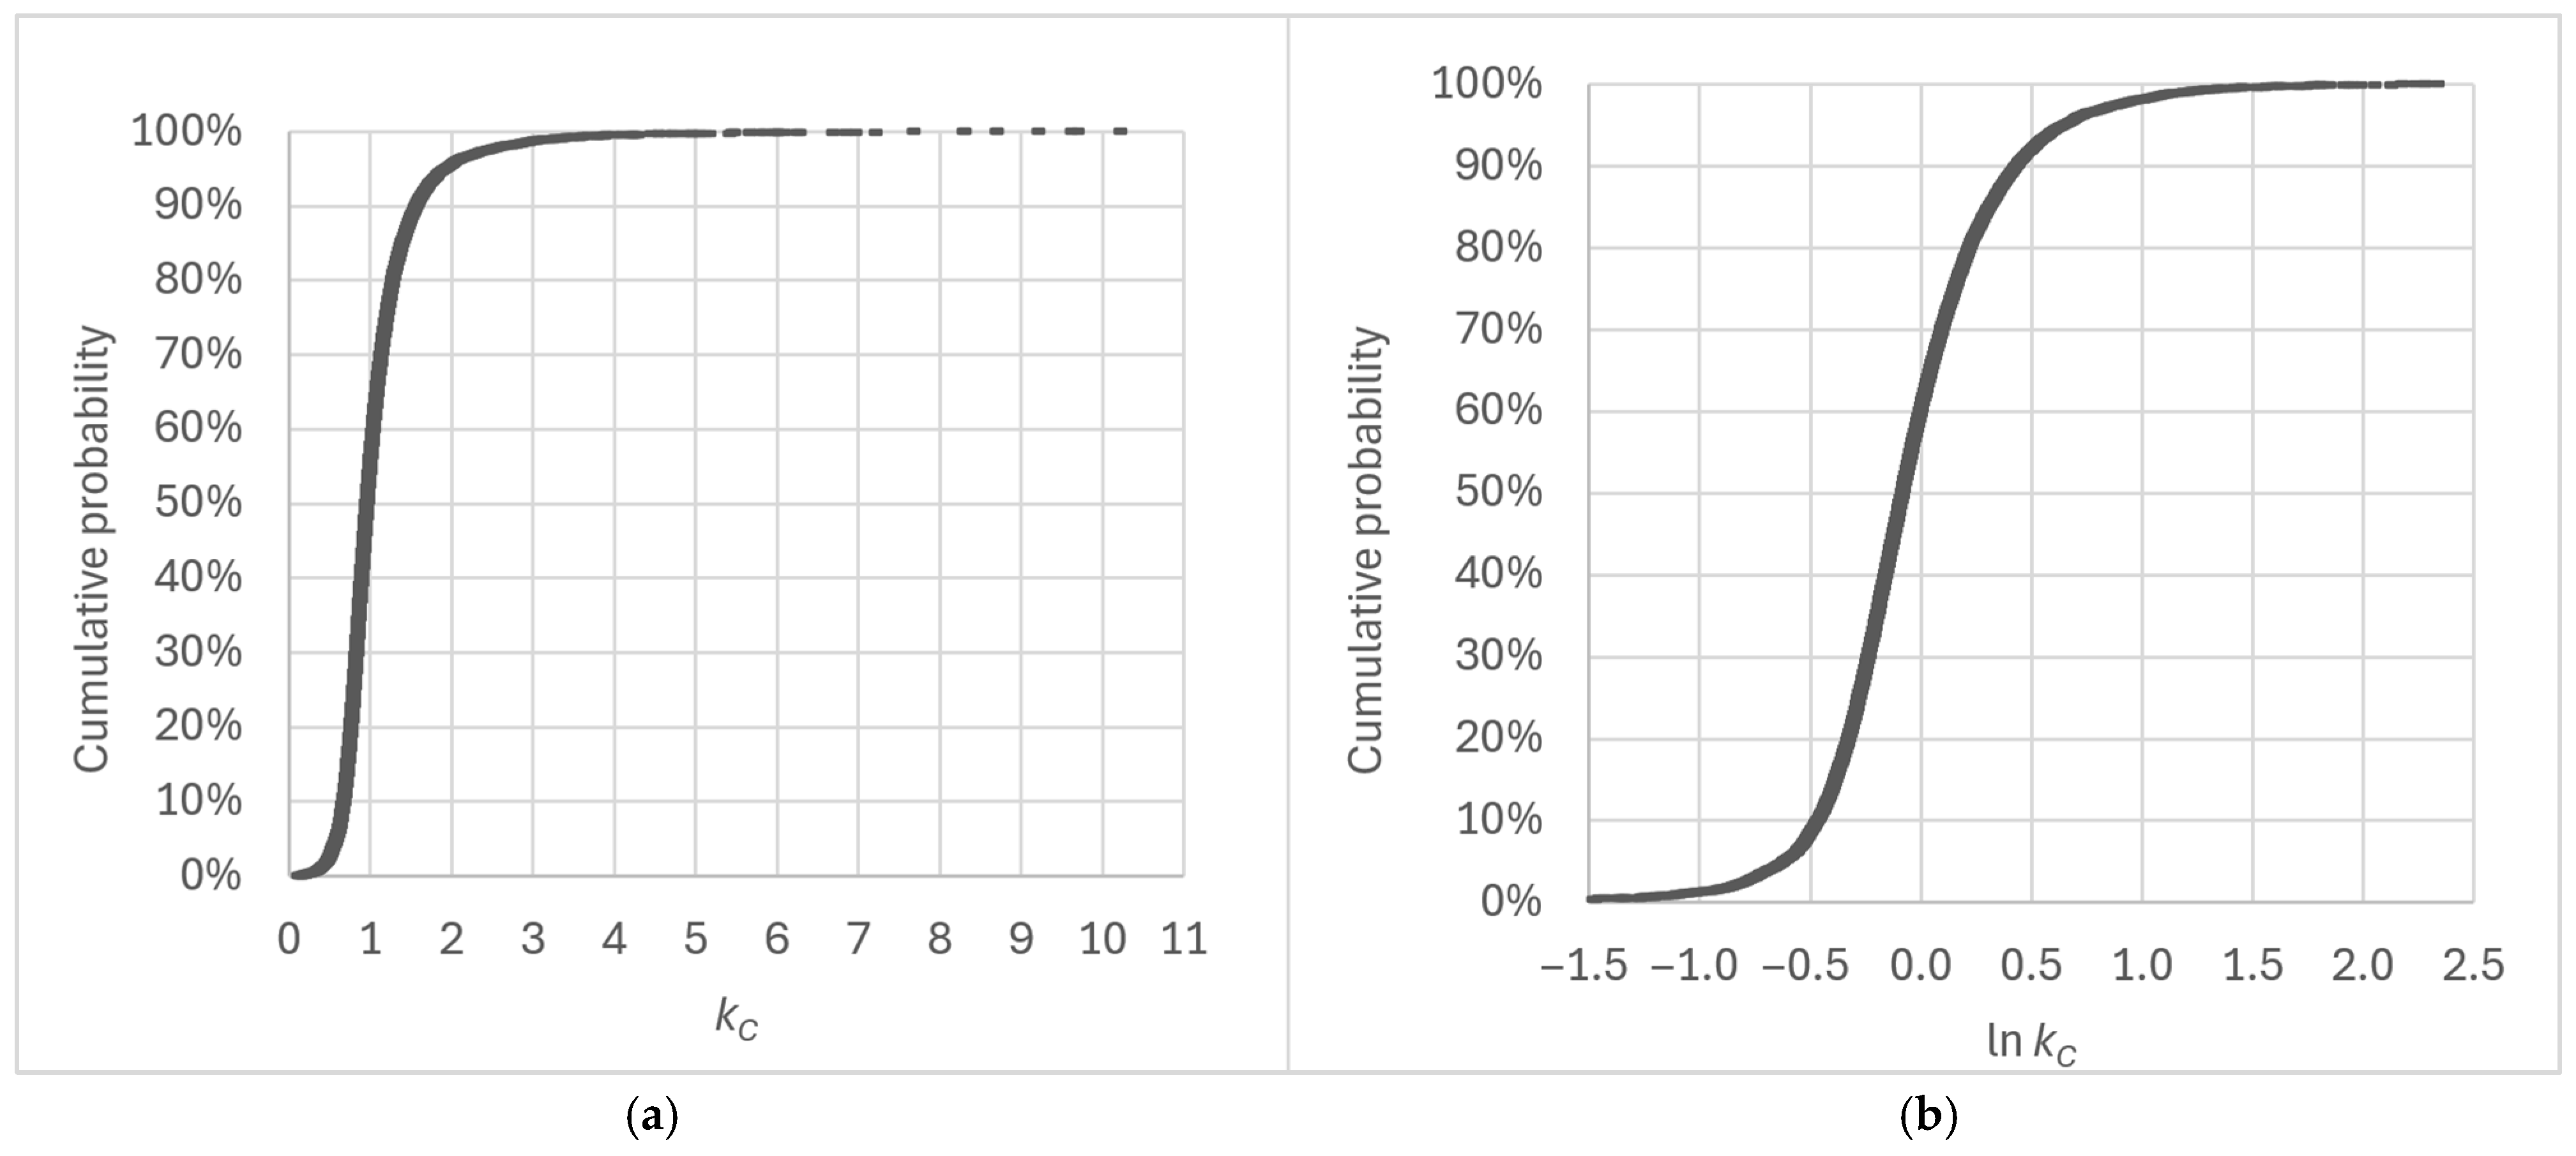
Table 6 presents the results of Monte Carlo simulations based on a probability distribution derived from correction factor values for three-day measurements initiated between 1 October and 12 May and illustrates the proportion of measurement results corrected using generic temporal correction factors that fall within a predefined variability range and match the simulated result. During this measurement season, the distribution of three-day correction factors (
N = 12,073) is strongly right-skewed, yielding median, GM, and AM correction factors of 0.901, 0.933, and 1.024, respectively (
Figure 6). Approximately 37% of the correction factor values exceeded 1, even though only about 10% of the dwellings exhibited a summer maximum in radon concentrations. The highest individual correction factor was 10.2, indicating that the radon concentration measured over the three-day period was only about 10% of the AARC. This observation was made for a measurement starting 14 March.
Correction factors based on the regression slope from the logarithmic transformations and those based on the median yielded identical outcomes and performed best. Furthermore, a generic kC based on the geometric mean performed nearly as well, whereas the remaining generic factors were noticeably less accurate.
Based on the national radon survey (input parameters: GM = 80 Bq/m
3, GSD = 2.4), the arithmetic mean of the calculated log-normal AARC distribution was determined to be 117 Bq/m
3 (
Table 7). Simulated uncorrected short-term results from 3-day radon measurements produced an arithmetic mean of 137 Bq/m
3. The most accurate estimate of the arithmetic mean of the estimated AARCs was achieved using the generic correction factor
kln C, which deviated from the reference AARC by + 3.9%. A comparably accurate estimate was obtained using the generic correction factor
kC based on the median (+5.3%). Since the arithmetic mean of the AARC is directly proportional to the annual collective exposure or dose, these findings indicate that an inappropriate choice of generic correction factor in AARC estimation may result in either under- or overestimation of collective radon exposure.
The geometric mean of AARCs is frequently reported in regional and national surveys. However, when analyses are based on measurements of less than one year, careful consideration must be given to the choice of a generic correction factor for estimating the regional or national geometric mean of AARCs. In the present analysis, employing the geometric mean of the generic correction factors yielded an accurate estimate. Both kC (median) and kln C slightly underestimated the GM.
3.4. Probabilities of False Negatives and False Positives Occurring
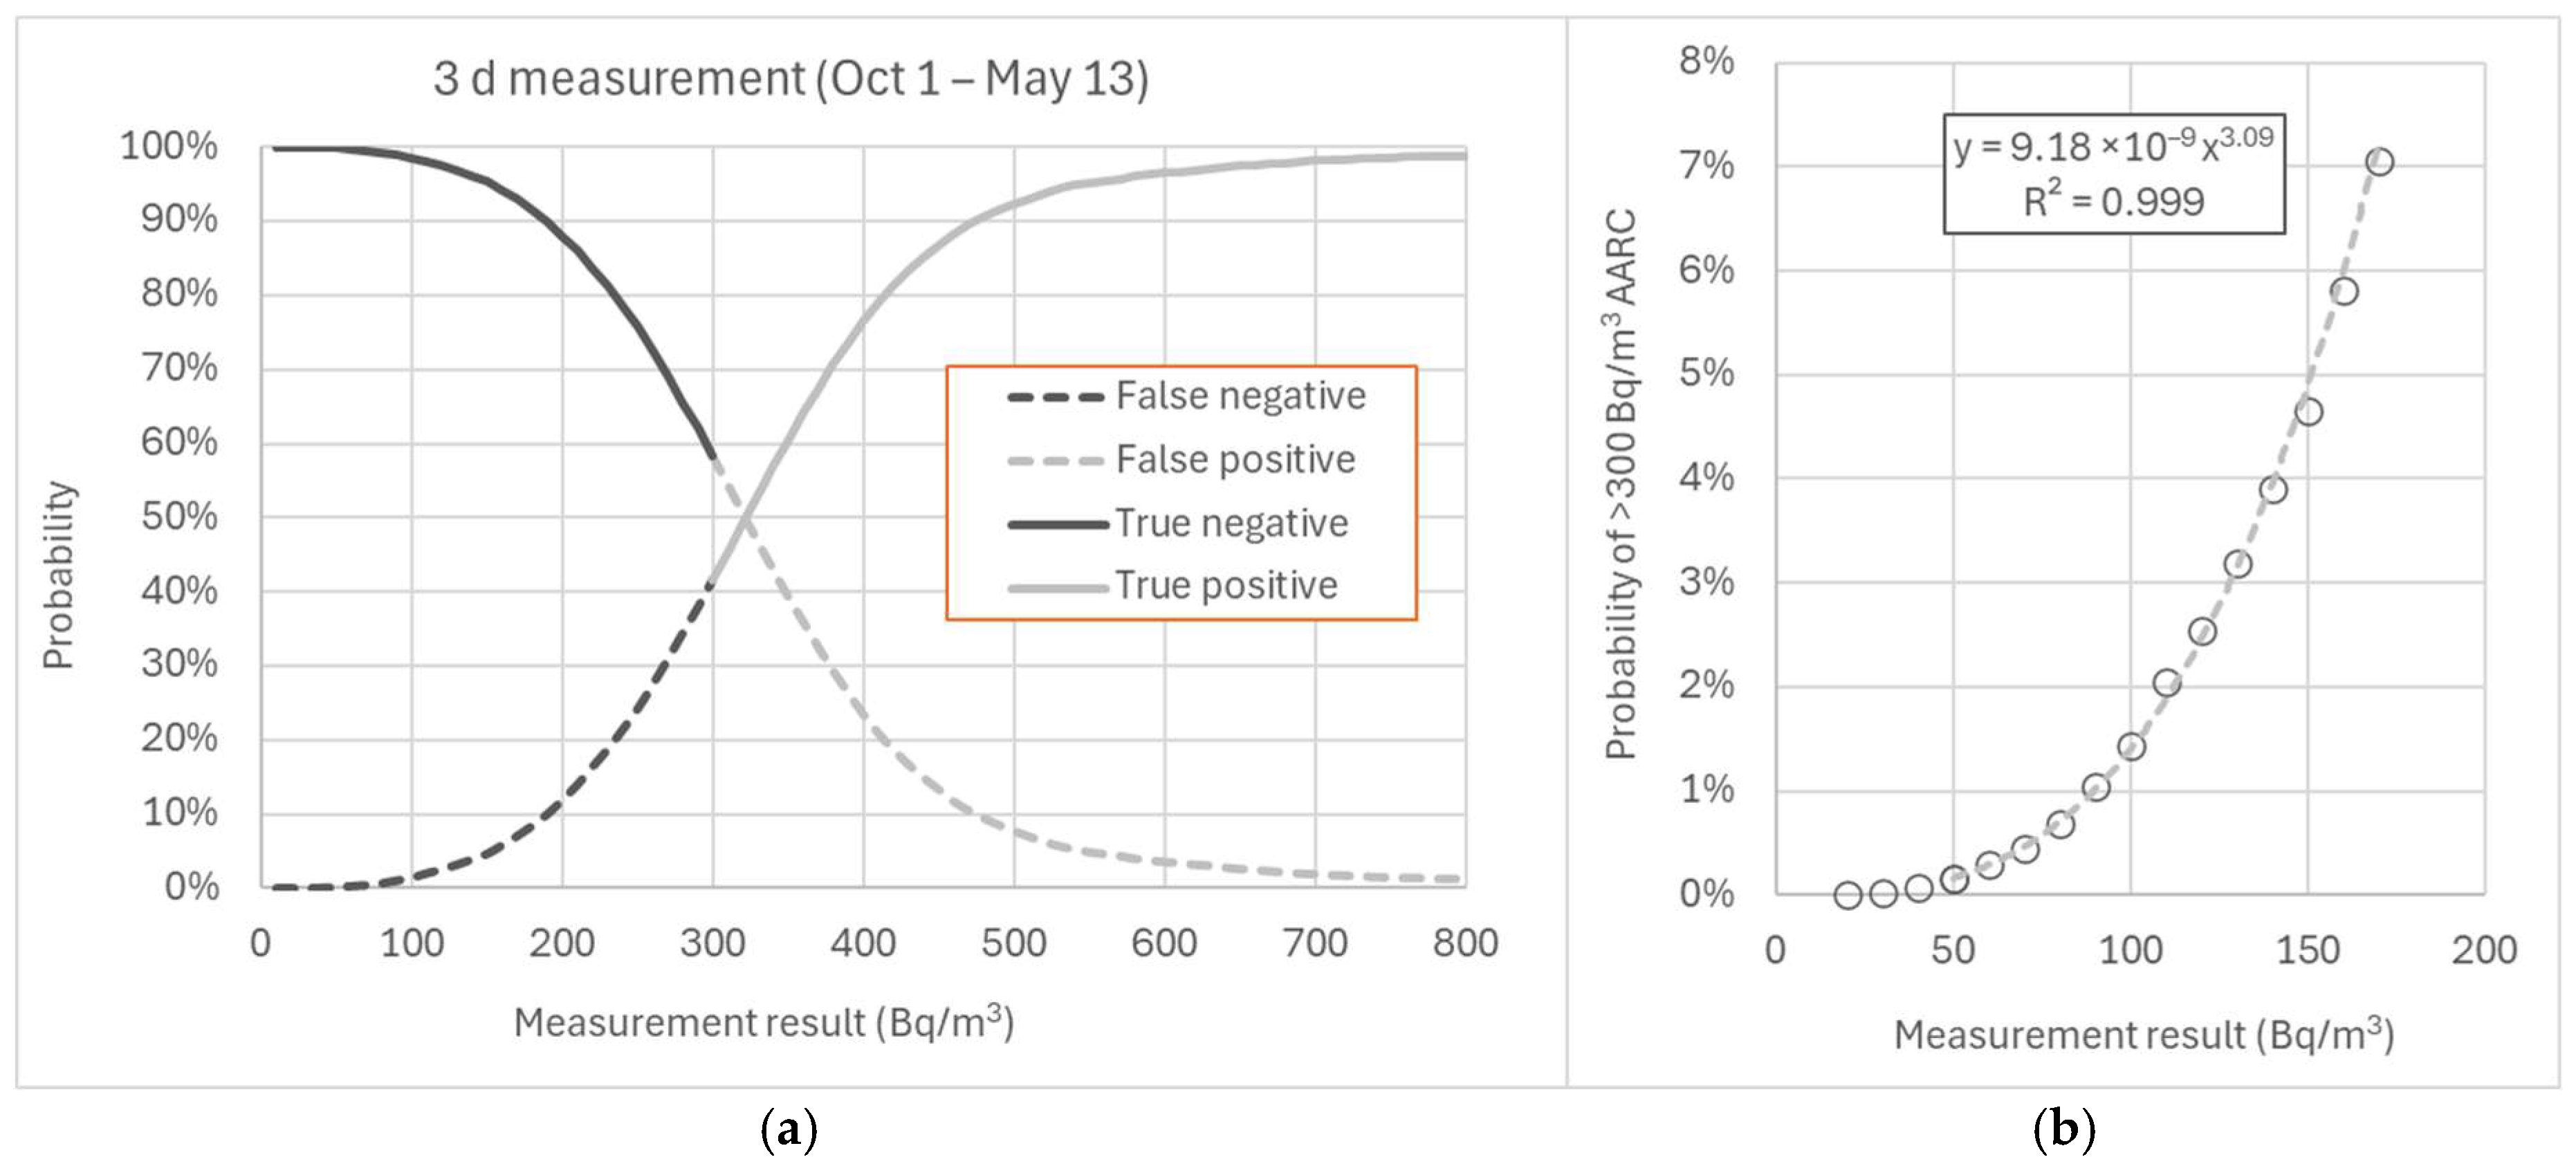
Figure 7 shows that a three-day measurement conducted between 1 October and 15 May yields a false-negative rate of 37% at the reference level of 300 Bq/m
3. When the measurement result is corrected using a generic correction factor of 0.9—effectively assessing the result against a concentration of 333 Bq/m
3—the proportion of false negatives increases to 54%. The frequency of false positives decreases gradually with an increase in measured concentrations above the reference level, with a probability of 8% at 500 Bq/m
3 and approximately 1% at 800 Bq/m
3. In contrast, an examination of low measured concentrations indicates that the probability of a false negative is 0.5% at 72 Bq/m
3 and 1.0% at 90 Bq/m
3. Similarly, false and true negatives, as well as false and true positives, were evaluated for measurement durations of 1–14 days (
Table 8).
4. Discussion
The homes selected for this study were chosen from a representative dataset, but on a first-come, first-served basis and voluntarily. Therefore, representativeness could not be fully controlled. The overrepresented areas of Western and Inland Finland are areas of old seabed, where the predominant soil types are poorly permeable to air, and as a result, radon levels are generally lower in these areas. In contrast, underrepresented Southern Finland has predominantly air-permeable gravel areas and granite rocks, which is why radon concentrations are generally higher than average. However, the geological composition of the soil at each housing construction site was not examined in detail using geological maps.
Identifying the foundation type of a home is often very difficult for a homeowner. In this study, 17 households reported that they did not know the type of foundation their house had. The reported monolithic slab is likely incorrect, both in this study and the 2006 national sampling study. In most cases, when an expert inspects a site listed as having a monolithic slab, they find a foundation wall and a ground-supported slab instead [
14].
The calibration of the RadonEye Plus2 monitor appears to remain stable. The calibration factor values determined in this study were almost identical to those from the previous study using the same monitors [
18]. However, this study did not determine the non-linearity of the response at high radon concentrations (>2000 Bq/m
3), because the test sites were chosen in such a way that their annual average radon concentration was below 300 Bq/m
3, so very high radon concentrations were rare.
Years differ in terms of their temperatures and rainfall. The measurement month of September, which was deemed favourable in the earlier study based on measurements in 1997, turned out to be a poor month for radon measurements in 2023. Between 1991 and 2020, the mean average of September temperatures measured across 20 Finnish weather stations was 9.7 °C, whereas in 2023, the corresponding average was 13.0 °C. There were also differences in rainfall amounts. In 2023, September was rainier than the average for 1991–2020. The average rainfall measured across 10 weather stations in 2023 was 75 mm, compared to the average of 54 mm for 1991–2020 [
22]. It is possible that the rise in mean temperatures during autumn and spring, driven by climate change, has led to the recommendation that the start of the measurement season be postponed.
The dataset indicates that radon concentration does not follow a textbook sinusoidal curve in all dwellings. It is therefore evident that while the measurement season set by authorities is appropriate for most dwellings, it may not be suitable for all, as 10% of dwellings exhibit pronounced summer maxima. It would be sensible to investigate more thoroughly whether the minimal seasonal variation is attributable to modern balanced ventilation systems, where the pressure difference between indoor and outdoor air is largely independent of outdoor temperature. Furthermore, current building regulations in Finland require that ventilation systems be designed in such a way that there is no pressure difference between indoor and outdoor air.
Various methods for calculating the value of the temporal correction factor have been reported in the literature. The simplest approach is likely to compute the arithmetic mean of the ratios between normalized annual mean and short-term radon concentrations (e.g., [
23]). Another method involves calculating the ratio of the geometric mean of the AARC values to the geometric mean of the measurement period [
14]. The method presented by Pinel et al. [
24] yields monthly correction factor values that follow a sinusoidal curve. Similar to this model, the multiplicative model proposed by Krewski et al. [
25] also accounts for the log-normal distribution of observations, allowing the calculation of a correction factor value for each starting month.
This study did not focus on the monthly correction factor values but rather aimed to determine whether a single correction factor covering the entire measurement season would provide a sufficiently accurate estimate. As evaluation models become more complex, their sensitivity to the quality of the input data increases. In this context, it is essential to acknowledge that monthly weather conditions vary from year to year. Additionally, measurements in this study were conducted in 55 dwellings, which likely limits the dataset’s adequacy for developing a monthly model.
Based on this dataset, the median of the correction factors represents the optimal generic value for residents when comparing their short-term measurement results to the reference level. Assessing the AARC using Equation (2), which relies on the regression slope of logarithmic transformations of short-term measurements and AARCs, is most likely too complex for a layperson.
When evaluating collective exposure or dose for population groups, the regression slope derived from the logarithmic transformations of short-term measurements and AARCs was identified as the most effective generic correction factor for this dataset. It is important to note that the most precise evaluation is always attained through year-long measurements, for which no generic correction factor is required.
Radon concentrations frequently follow a lognormal distribution [
26]. For example, regional or national surveys often report the geometric mean and geometric standard deviation. Therefore, if short-term measurement results must be adjusted to an annual GM, it is advisable to employ the geometric mean of the correction factors.
In Finland, a correction factor of 0.9 is currently used, based on the geometric mean of correction factors calculated from monthly radon measurements in 329 dwellings. This dataset has now been supplemented with 55 additional dwellings, making it justified to conduct a new analysis and re-evaluate the selection of the generic correction factor using probabilistic assessment and Monte Carlo simulation.
One of the primary objectives of this study was to determine how the results of short-term radon measurements lasting 2–5 days should be interpreted. Based on the data, a suitable action level could be set at 90–100 Bq/m
3, ensuring that only approximately 1% of measurements at this concentration exceed the reference level of 300 Bq/m
3 (
Table 8). At higher concentrations, longer-term measurements (min. 2 months) are recommended to obtain a more accurate result. Currently, no established standard defines the acceptable proportion of false negatives when determining an action level. For some individuals, a 5% probability of a false negative may be entirely acceptable, whereas for others—particularly those who work from home or have small children—only the most reliable result is acceptable.
The novelty of this study lies in the probabilistic method applied, which allowed for the estimation of the proportion of false negatives in the results, as well as the determination of action levels for different measurement durations using the actual temporal distribution of the results, rather than, for example, an assumed log-normal distribution. In the method presented by Tsapalov and Kovler [
8], the action level is set based on log-normally distributed temporal variation in such a way that the reference level is not exceeded in 95% of the measurement locations. Comparing their results with the action levels estimated in this study—where a 5% false-negative rate is accepted (
Table 8)—reveals that the action levels from this study and those reported by Tsapalov and Kovler for unoccupied dwellings are very similar. For occupied dwellings, their action levels are lower, suggesting greater temporal variation in their dataset.
A limitation of this study lies in the limited scope of the dataset. Based on measurements conducted in 55 apartments, it is not yet possible to establish action levels for short-term measurements or provide recommendations for short-term measurements. Nevertheless, the findings necessitate a reconsideration of including September in the measurement season. In recent years, September temperatures have been significantly warmer compared to those nearly 30 years ago, which form the basis of the current recommended measurement season.
5. Conclusions
In approximately one fifth of the dwellings studied, radon concentrations in summer were not lower than the AARC, and in one tenth of the dwellings, concentrations in summer even exceeded the AARC value.
Among the various methods used to estimate the generic correction factor, the regression slope from logarithmic transformations between the AARC and short-term measurement results proved to be the most accurate. However, its application is not practical for the average person taking measurements, such as homeowners. For these users, the generic correction factor based on the median offers an equally precise estimate. The use of the regression slope of logarithmic transformations is recommended when compiling exposure statistics, whereas the correction factor based on the geometric mean should be used when calculating geometric means for datasets based on short-term measurements.
If a maximum false-negative rate of 1% is accepted, the action level for a 2–5-day measurement is 90–100 Bq/m3. For measurements above this threshold, a longer measurement is required. On the other hand, false positives occur in about one fifth of measurements in the 400–500 Bq/m3 range and may require further investigation with a longer measurement. Based on this study, short-term radon measurements cannot yet be recommended as a replacement for current methods.
The study revealed significant radon level fluctuations in September, indicating that this period warrants further investigation in future years and, if necessary, reconsideration for inclusion in the official measurement season.


