Article

Reconstruction of a Two-Dimensional Blocking Index During the Last Four Hundred Years Using Gridded Temperature and Precipitation Data

1
Alfred Wegener Institute Helmholtz Center for Polar and Marine Research, Section Paleoclimate Dynamics, 27570 Bremerhaven, Germany
2
Faculty of Forestry, Ștefan cel Mare University of Suceava, 720229 Suceava, Romania
3
Department of Environmental Physics & MARUM, University of Bremen, 28359 Bremen, Germany
*
Author to whom correspondence should be addressed.
Atmosphere 2025, 16(4), 477; https://doi.org/10.3390/atmos16040477
Submission received: 13 March 2025 / Revised: 10 April 2025 / Accepted: 15 April 2025 / Published: 19 April 2025
(This article belongs to the Section Climatology)

Abstract

:
We present a two-dimensional reconstruction of blocking frequency indices in the Atlantic-European region spanning the last 400 years. Our approach is based on a simple field reconstruction scheme similar to the principal component regression method. The particularity of our reconstruction scheme is that we select the blocking predictors using observed and reconstructed surface temperature and precipitation gridded data based on the correlation stability criteria. This approach avoids the problem of non-stationarity between predictand and predictors that commonly affects the quality of climate field reconstructions. First, we reconstruct the blocking field back to 1891 using observed gridded surface temperature and precipitation data. Then, the reconstruction is extended back in time to 1602 using seasonal-resolution paleo-reanalysis temperature and precipitation fields. The reconstruction is validated against various observed blocking frequency fields and climate reconstruction indices. The methodology presented in this study offers an opportunity for extracting paleo-weather signals from seasonal-resolution gridded datasets, which enables an improved understanding of the forcing of low-frequency variability for atmospheric blockings and related extremes.

1. Introduction

Atmospheric blocking systems can be described as long-lasting, quasi-stationary and self-sustaining tropospheric flow patterns that are associated with significant perturbations of climatologically west to east movements of weather patterns. Hence, blocking systems are associated with extreme weather anomalies at mid-latitudes [1].
Numerous studies [2,3,4,5] report significant changes in blocking characteristics from interannual to multidecadal timescales. Such changes were related to internal climate modes of variability, such as El Niño–Southern Oscillation (ENSO) [2], Atlantic Multidecadal Oscillation (AMO) [3], solar forcing [4] or teleconnection patterns [5]. However, these conclusions are based on observational records, which typically are too short. Paleoclimate proxy records of temperature and precipitation from mid-latitudes (e.g., ice cores, tree rings and speleothem records) offer extensions to the observational records, suggesting long-term changes in blocking characteristics [6,7,8]. Model simulations also predict significant variability in blocking activity. However, the causes of blocking variability still remain an open question due to climate model shortcomings in representing this phenomenon [9]. Therefore, we need to extend the blocking record to robustly identify the low-frequency patterns and the associated forcing of blocking variability.
In a recent study [10], a two-dimensional summer blocking frequency index for the last millennia over the Northern Hemisphere has been reconstructed using an artificial intelligence (AI) approach. A deep learning model is developed to infer the summertime blocking frequency from tree-ring-based gridded reconstructions of the Northern Hemisphere surface temperature [10]. To our knowledge, this is the only published reconstruction of a two-dimensional blocking frequency indicator for such a long period. However, atmospheric blockings are strongly related to weather extremes during the boreal winter season [4]. Therefore, a two-dimensional blocking field reconstruction for this season would be very useful to put the observed decadal to multidecadal variations of blockings and extremes, as presented in recent studies [3,4,5], in a long-term perspective.
The main purpose of our study is to reconstruct the field of a two-dimensional blocking frequency indicator over the Atlantic-European region during winter back in time to the 1600s AD. We use a simple climate field reconstruction method based on a stability correlation approach [11,12] to select blocking predictors from seasonal-resolution observed and paleo-reconstruction gridded surface temperature and precipitation datasets (see Data and Methods section). Long-term reconstructions of atmospheric blockings are essential for understanding decadal or longer timescale variability of temperature and precipitation extremes. As blocking is strongly related to large-scale natural variability patterns, like the AMO [3] and manifestations of external forcing, such as solar irradiance variations [4], long-term blocking reconstructions will help to understand the physical mechanisms behind these connections.

2. Data and Methods

2.1. Blocking Index Calculation

The two-dimensional (2D) blocking index defined in [13], which is a 2D advancement of the classical one-dimensional (1D) Tibaldi–Molteni (TM) blocking index [14], has been applied in our analysis. Details on this 2D blocking index calculation can be found in [15]. A short description of this index is given in the following. First, we select the winter (December, January, February (DJF)) daily 500 hPa geopotential height (Z500) from Modern-Era Retrospective analysis for Research and Applications, version 2 (MERRA-2) [16] reanalysis data for the period 1980–2022. Then, we calculate the southern (GHGS) and northern (GHGN) gradients:
GHGS = (Z500(φ0) − Z500(φs))/(φ0 − φS)
GHGN = (Z500(φN) − Z500(φ0))/(φN − φ0)
where φ0, φS, φN represent the reference, southern and northern latitudes, respectively. The reference latitude varies between 35° N and 75° N, while the latitudinal interval between reference and northern as well as southern latitude is 15°. A grid-point for which GHGS > 0 and GHGN < (−10m/°lat) is considered to be blocked. No temporal constraint was imposed, so this index captures the so-called instantaneous blocking. The blocking frequency was calculated for the period 1980–2022, and the blocking frequency anomalies relative to this climatology were used to calibrate the blocking prediction models.

2.2. Gridded Datasets for Predictor Selection

The 2.5° × 2.5° gridded precipitation dataset from the Global Precipitation Climatology Centre (GPCC), covering the period 1891 to present in monthly resolution [17], was used. This dataset is the centennial GPCC full monthly product of global land surface precipitation based on worldwide gauge stations that feature record durations of 10 years or longer. The National Oceanic and Atmospheric Administration (NOAA) Merged Land Ocean Global Surface Temperature Analysis (NOAAGlobalTemp) version 5 [18] was used to find stable predictors for blocking patterns. The long-term sea surface temperature and land surface air temperature datasets were combined to create a global land surface temperature dataset. Winter temperature (T) and precipitation (PP) for the common period, that is, 1891–2022, was used here to search for predictors for blocking anomaly patterns.
Paleo-proxy data assimilation systems use climate models and multi-proxy networks to produce gridded datasets of climate variables (hereafter paleo-reanalysis) [19,20]. Here, we used the 2 m temperature and precipitation fields from the recently released EKF400v2 paleo-reanalysis dataset [19] to search for predictors of atmospheric circulation patterns. The EKF4000v2 covers the period 1602 to 2003 with monthly resolution. We calculated the winter means as average T or PP over the winter months, removed the linear trend and subtracted the overall mean to obtain anomalies.

2.3. Climate Index Reconstructions

Three North Atlantic Oscillation (NAO) index reconstructions are used to test the robustness of our blocking reconstruction back to 1602.The first NAO reconstruction is based on the principal component regression (PCR) method using “model-constrained” predictors selected from a candidate network of 48 proxy records [21]. The second NAO reconstruction is based on nested correlation-weighted PCR and the maximum entropy bootstrap method in connection with 97 Euro-Mediterranean tree-ring records [22]. The third one is based on various predictors, including documentary and early monthly instrumental climate data [23]. These reconstructions are not completely independent from the paleo-reanalysis data used here to select predictors for blocking variability, as they share common tree-ring or documentary input data.

2.4. Methods

The principal component regression (PCR) method is widely applied for climate field reconstructions [24]. The PCR methods, described in detail in [25], assume a linear and temporally stable relationship between the underlying proxy network and the target field, a hypothesis that is not valid for many proxy records. We try to avoid this by selecting predictors which are stable correlated with predictands.
The stable teleconnection approach [11,12] was used to identify the predictors in the gridded T and PP datasets to reconstruct blocking frequency. The main idea of the stable correlation approach is to identify stable predictors on gridded datasets, i.e., those grid-points where the Pearson correlation coefficients, hereafter correlations, between predictand and predictors are stable. This approach leads to a successful reconstruction of the Arctic Oscillation (AO) index [11] and a skillful prediction of the streamflow [12].
Here, we applied this methodology to reconstruct the principal component (PC) time series of the dominant patterns of blocking frequency variability in the Atlantic-European region. We decompose the blocking frequency anomaly field during the calibration period, i.e., 1980–2022, using empirical orthogonal function (EOF) analysis [26], whereby this period is entirely covered by the MERRA-2 data [16]. The PCs associated with the blocking patterns were correlated with T and PP from each grid-point in a moving window. The T and PP data from those grid-points where the correlation is stable, i.e., the percentage of windows with correlation higher than a certain threshold is significantly high, are selected as predictors for the corresponding PCs (see Section 3 for details). To avoid defining a large number of indices as predictors, as in previous studies [11,12], the temperature and precipitation time series from the stable correlated grid-points were combined into a single dataset and decomposed in patterns using EOF analysis. The corresponding PCs are used as predictors for blocking PCs through multiple linear regression models. The multiple linear regression models are calibrated using blocking PCs as predictands and T and PP PCs as predictors. These models are used to predict the blocking PCs over the calibration period, i.e., 1980–2022. These models are used further to predict the blocking PCs back in time using observed and paleo-reanalysis gridded T and PP time series from the same grid-points, i.e., where the blocking PCs and the T and PP are stable correlated during the calibration period. Finally, the blocking field anomalies are reconstructed using the reconstructed PCs and the corresponding blocking patterns for the calibration period.
The blocking reconstructions back to 1948 and 1891 are validated against blocking frequency based on National Centers for Environmental Prediction (NCEP) reanalysis [27] and version 3 of the ‘Twentieth Century Reanalysis’ system (20CRv3) [28], respectively. The blocking reconstruction back to 1602 is validated against three NAO index reconstructions [21,22,23].

3. Results

3.1. Blocking Reconstruction Based on Observational Data

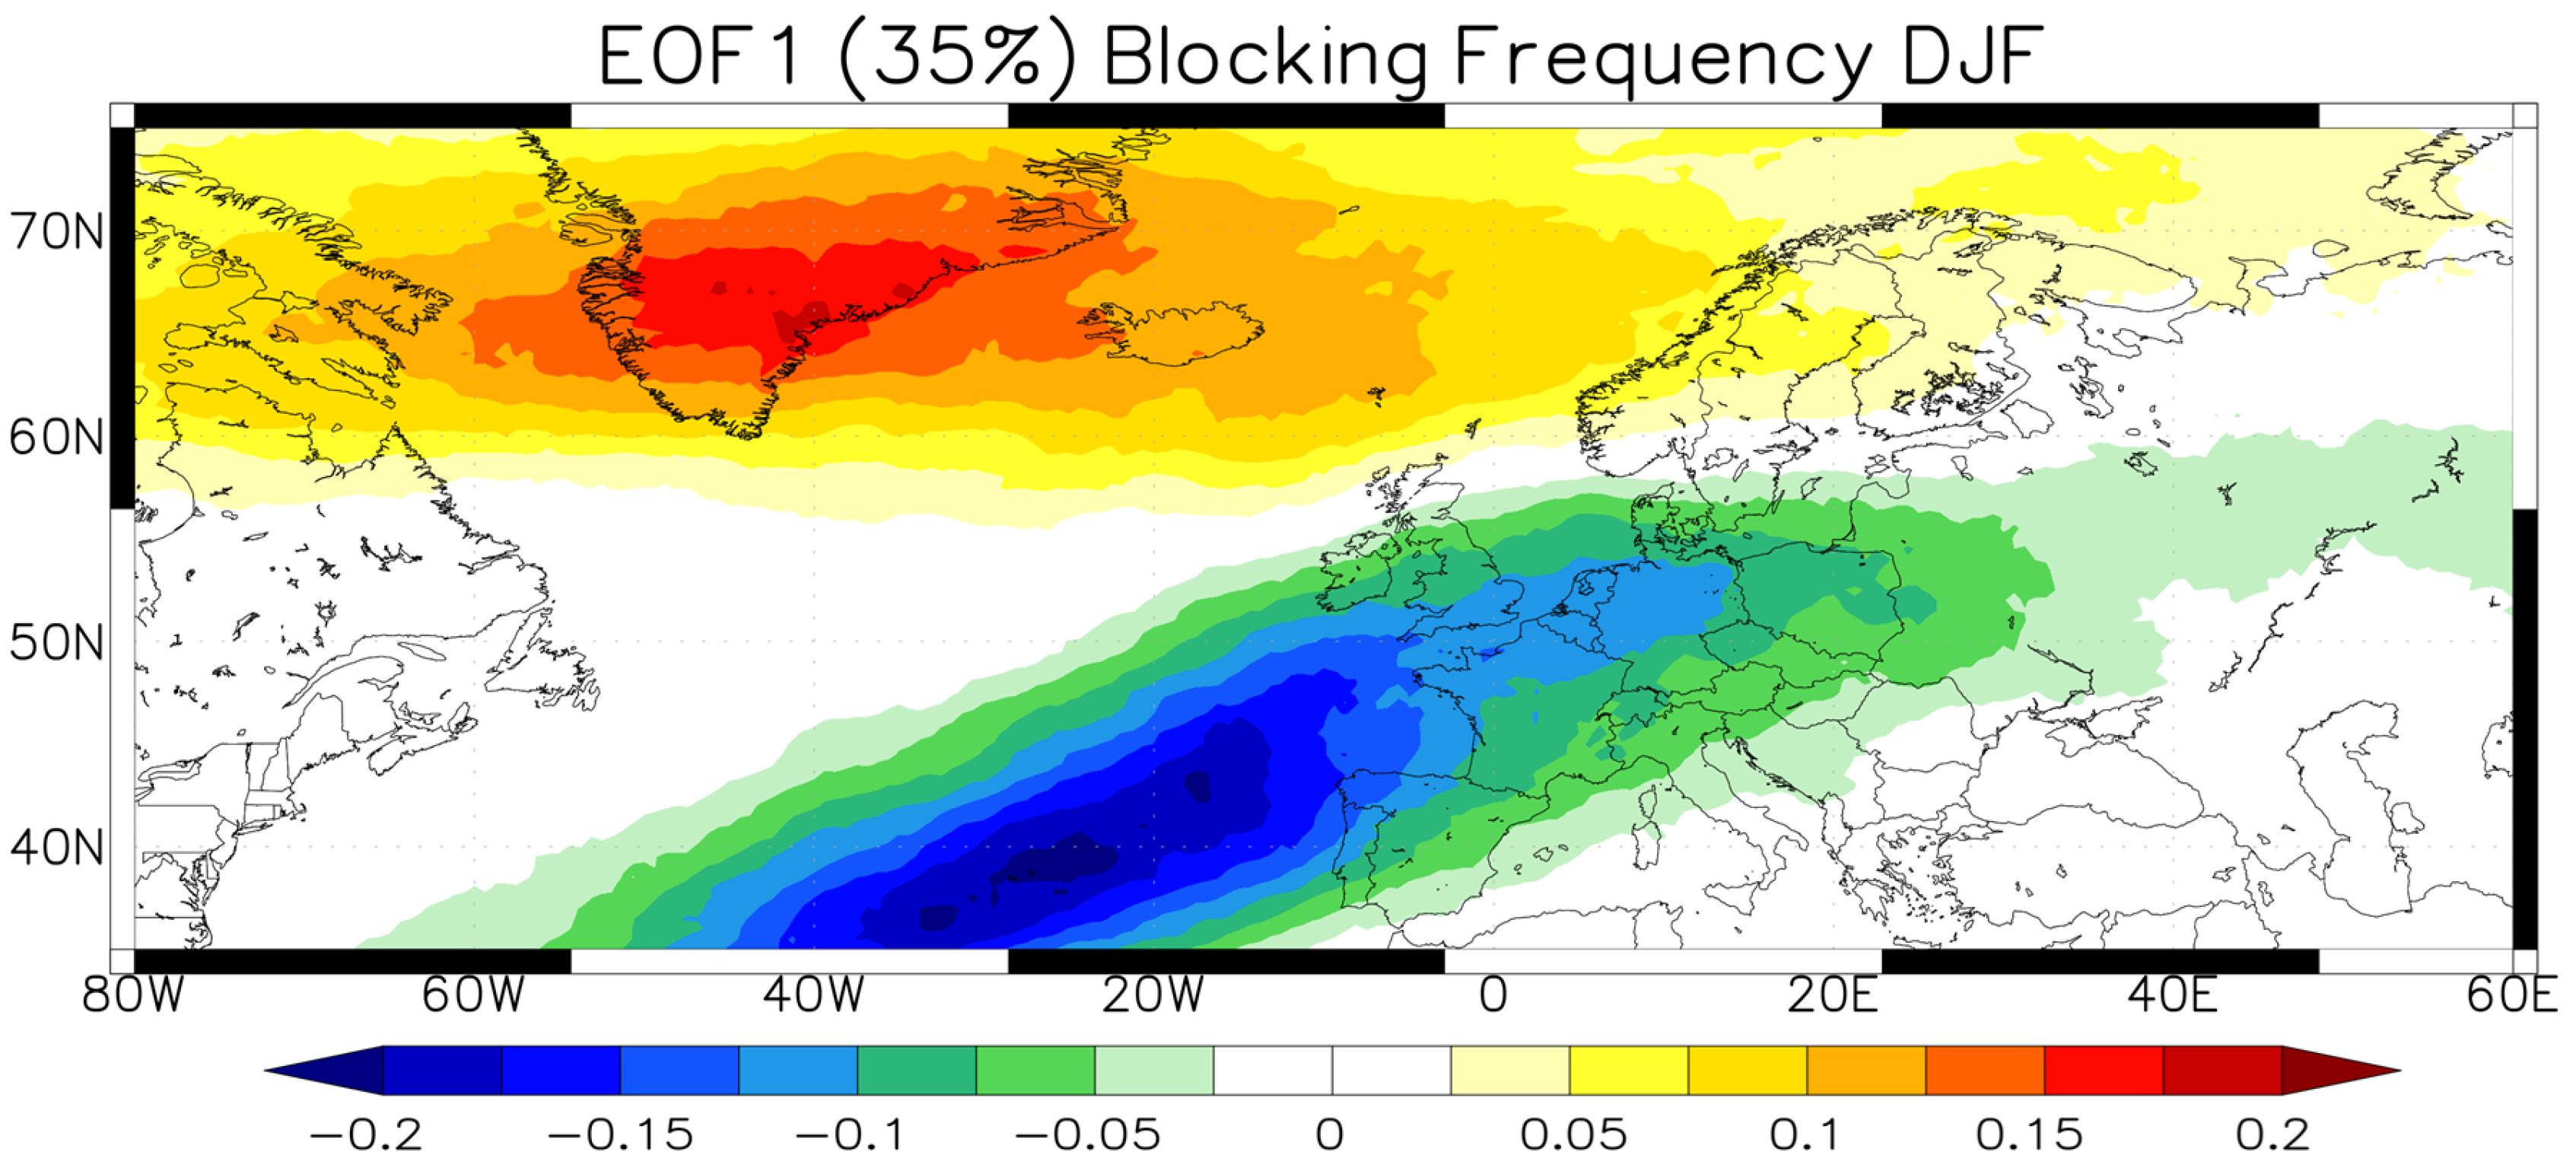
The blocking climatology (Figure 1), which is based on MERRA-2 Z500 data for the period 1980–2022, is similar to the climatology of this index presented in previous studies [4,13,15]. Europe appears as a dominant region of blocking due to the configuration of a strong, meridionally tilted storm track upstream of a large landmass. Frequent blocking is also recorded over Greenland, with strong downstream impacts on Europe [1]. The deviations from the blocking climatology during the calibration period, i.e., 1980–2022, are analyzed further using EOFs [26]. The first EOF of blocking frequency anomalies (Figure 2), explaining 35% variance, resembles the blocking frequency anomaly pattern associated with the negative phase of the NAO [4,13]. Indeed, the NAO index is correlated with blocking PC1 at the level of −0.90 during this period.
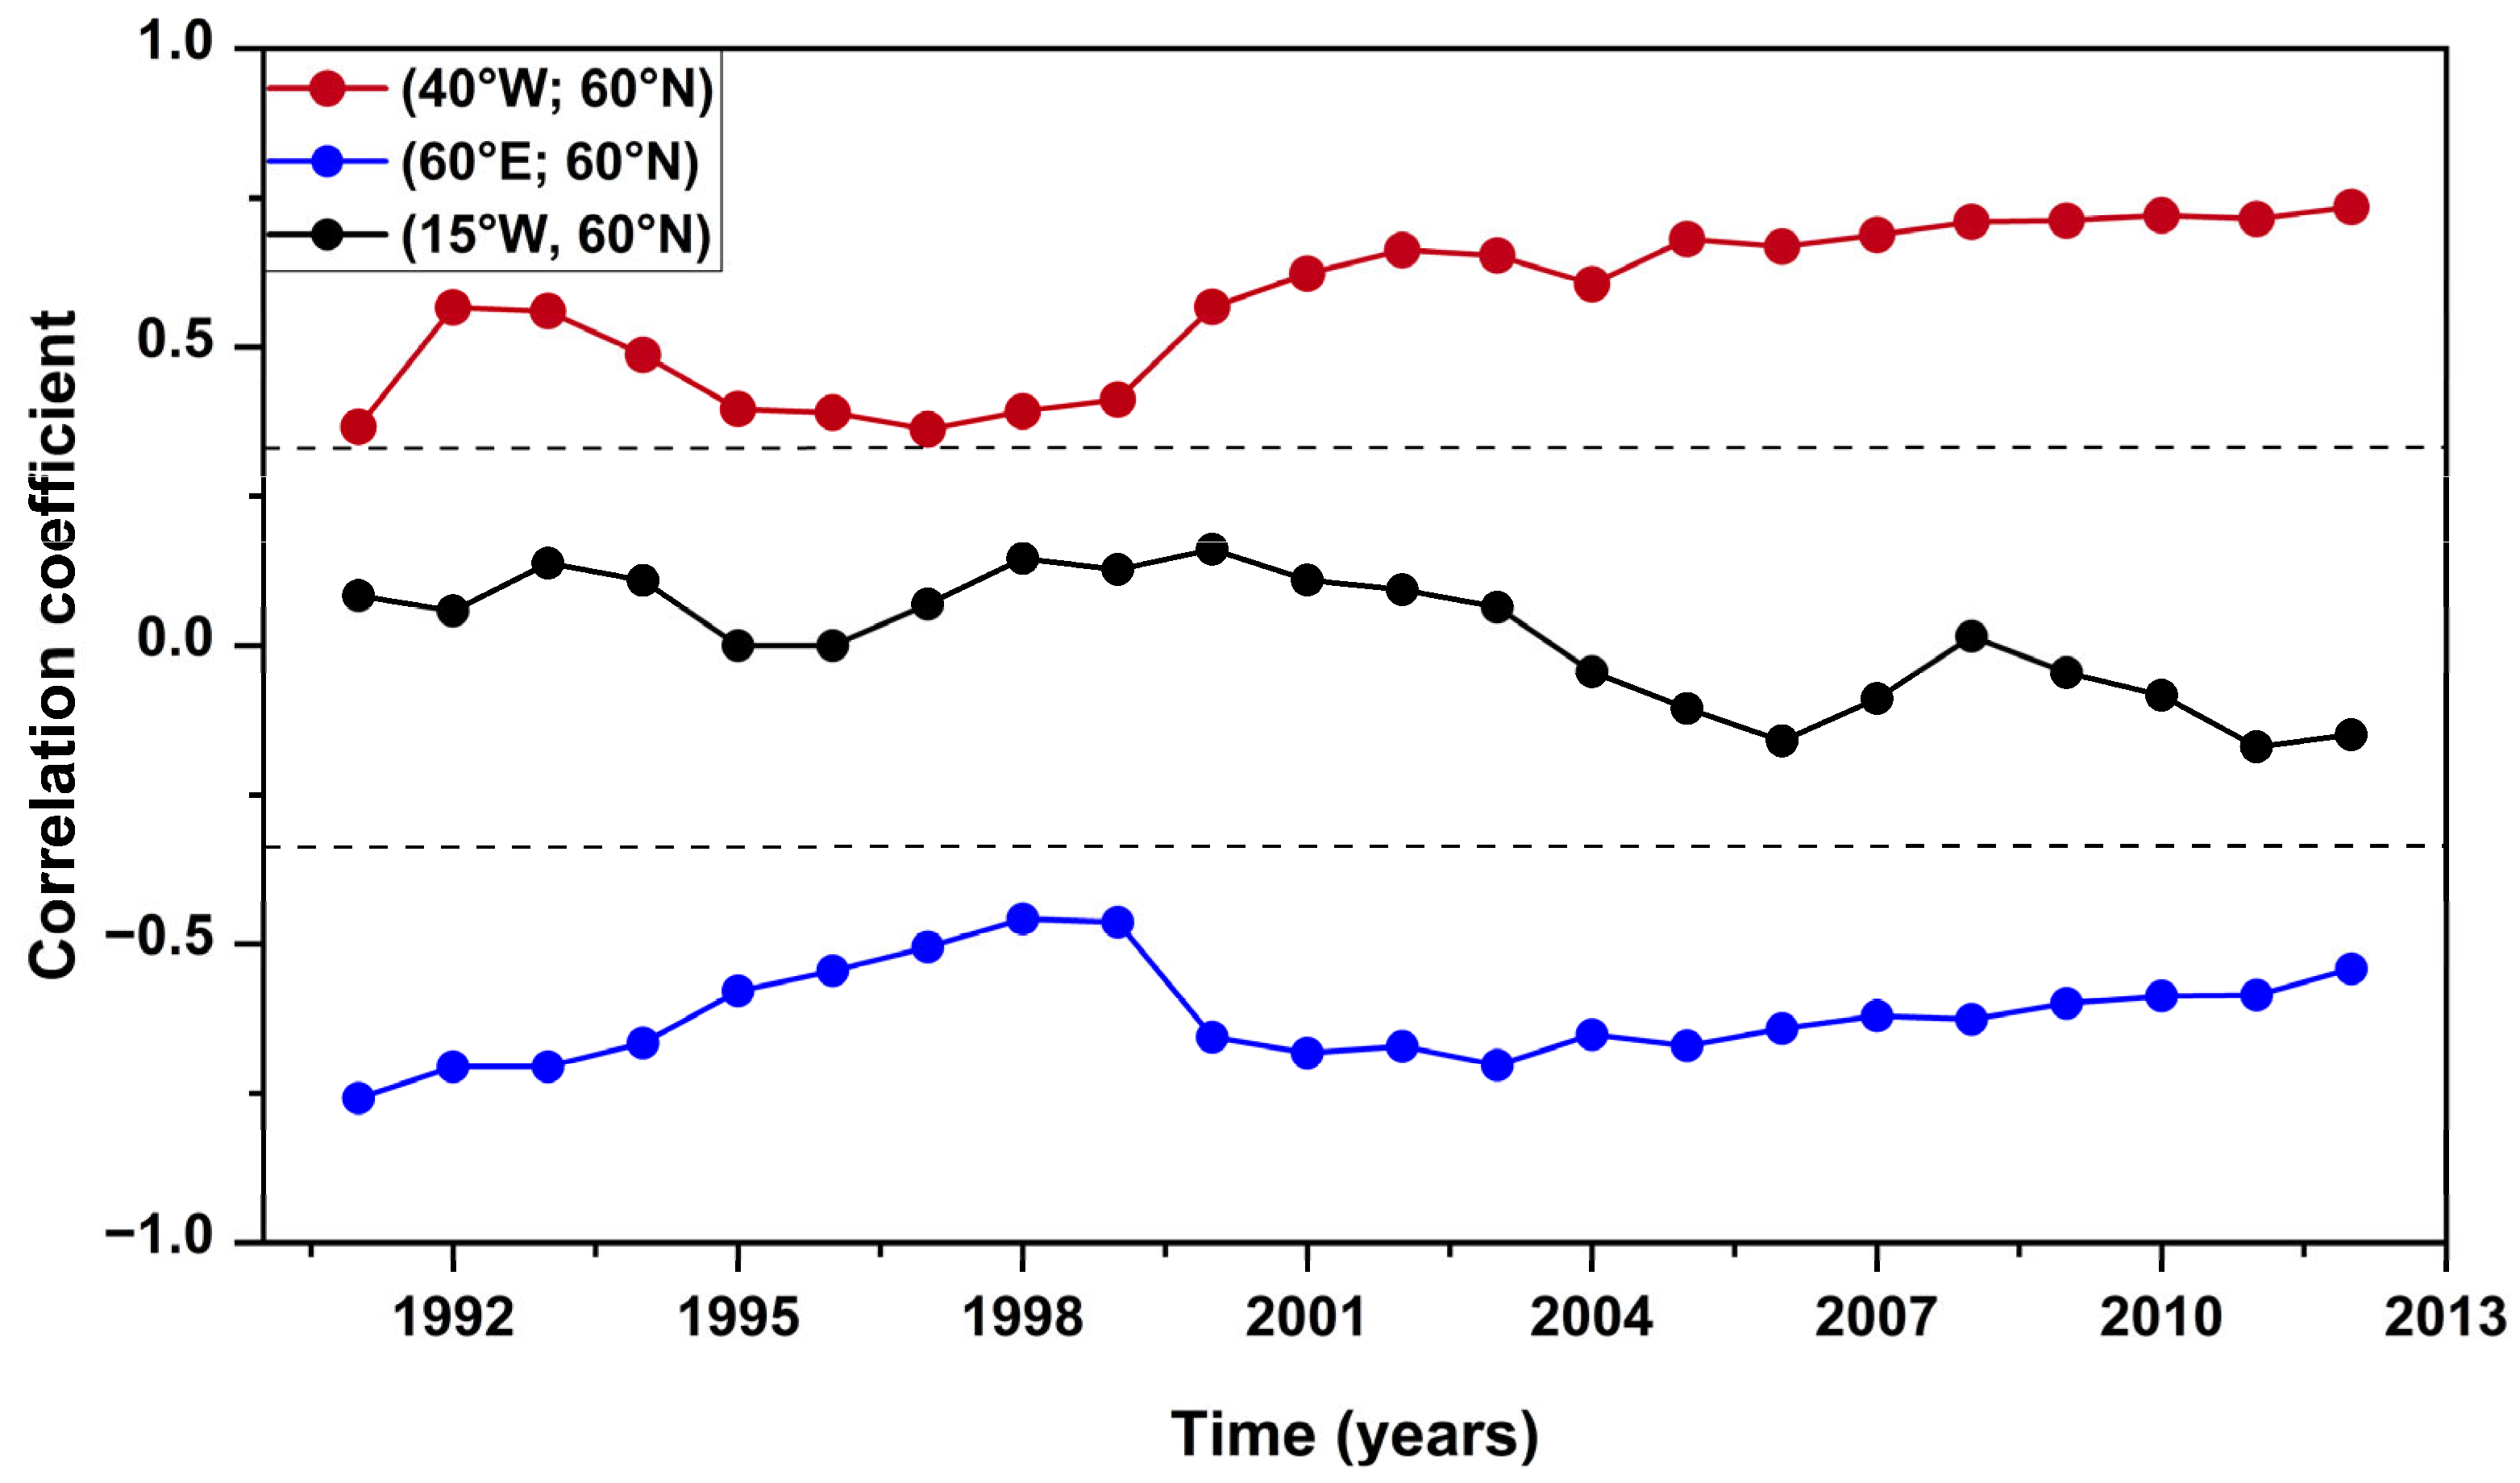
To emphasize how we select the predictors, we show the correlation between blocking PC1 and temperature from three grid-points along the 60° N latitude, i.e., 40° W, 15° W and 60° E, in a 21-year moving window (Figure 3). The absolute value of the correlation is above the threshold, i.e., 0.3, for all windows in the (60° N; 40° W) and (60° N; 60° E) grid-points and below this threshold for the (60° E; 15° W) grid-point. The T and PP time series where the correlations are stable, i.e., 70% of the windows show correlations above (below) + (−) 0.3 threshold (Figure 3, dashed lines), are selected as predictors for blocking PC1. Similar criteria to define stable correlations are used in previous studies [11,12].
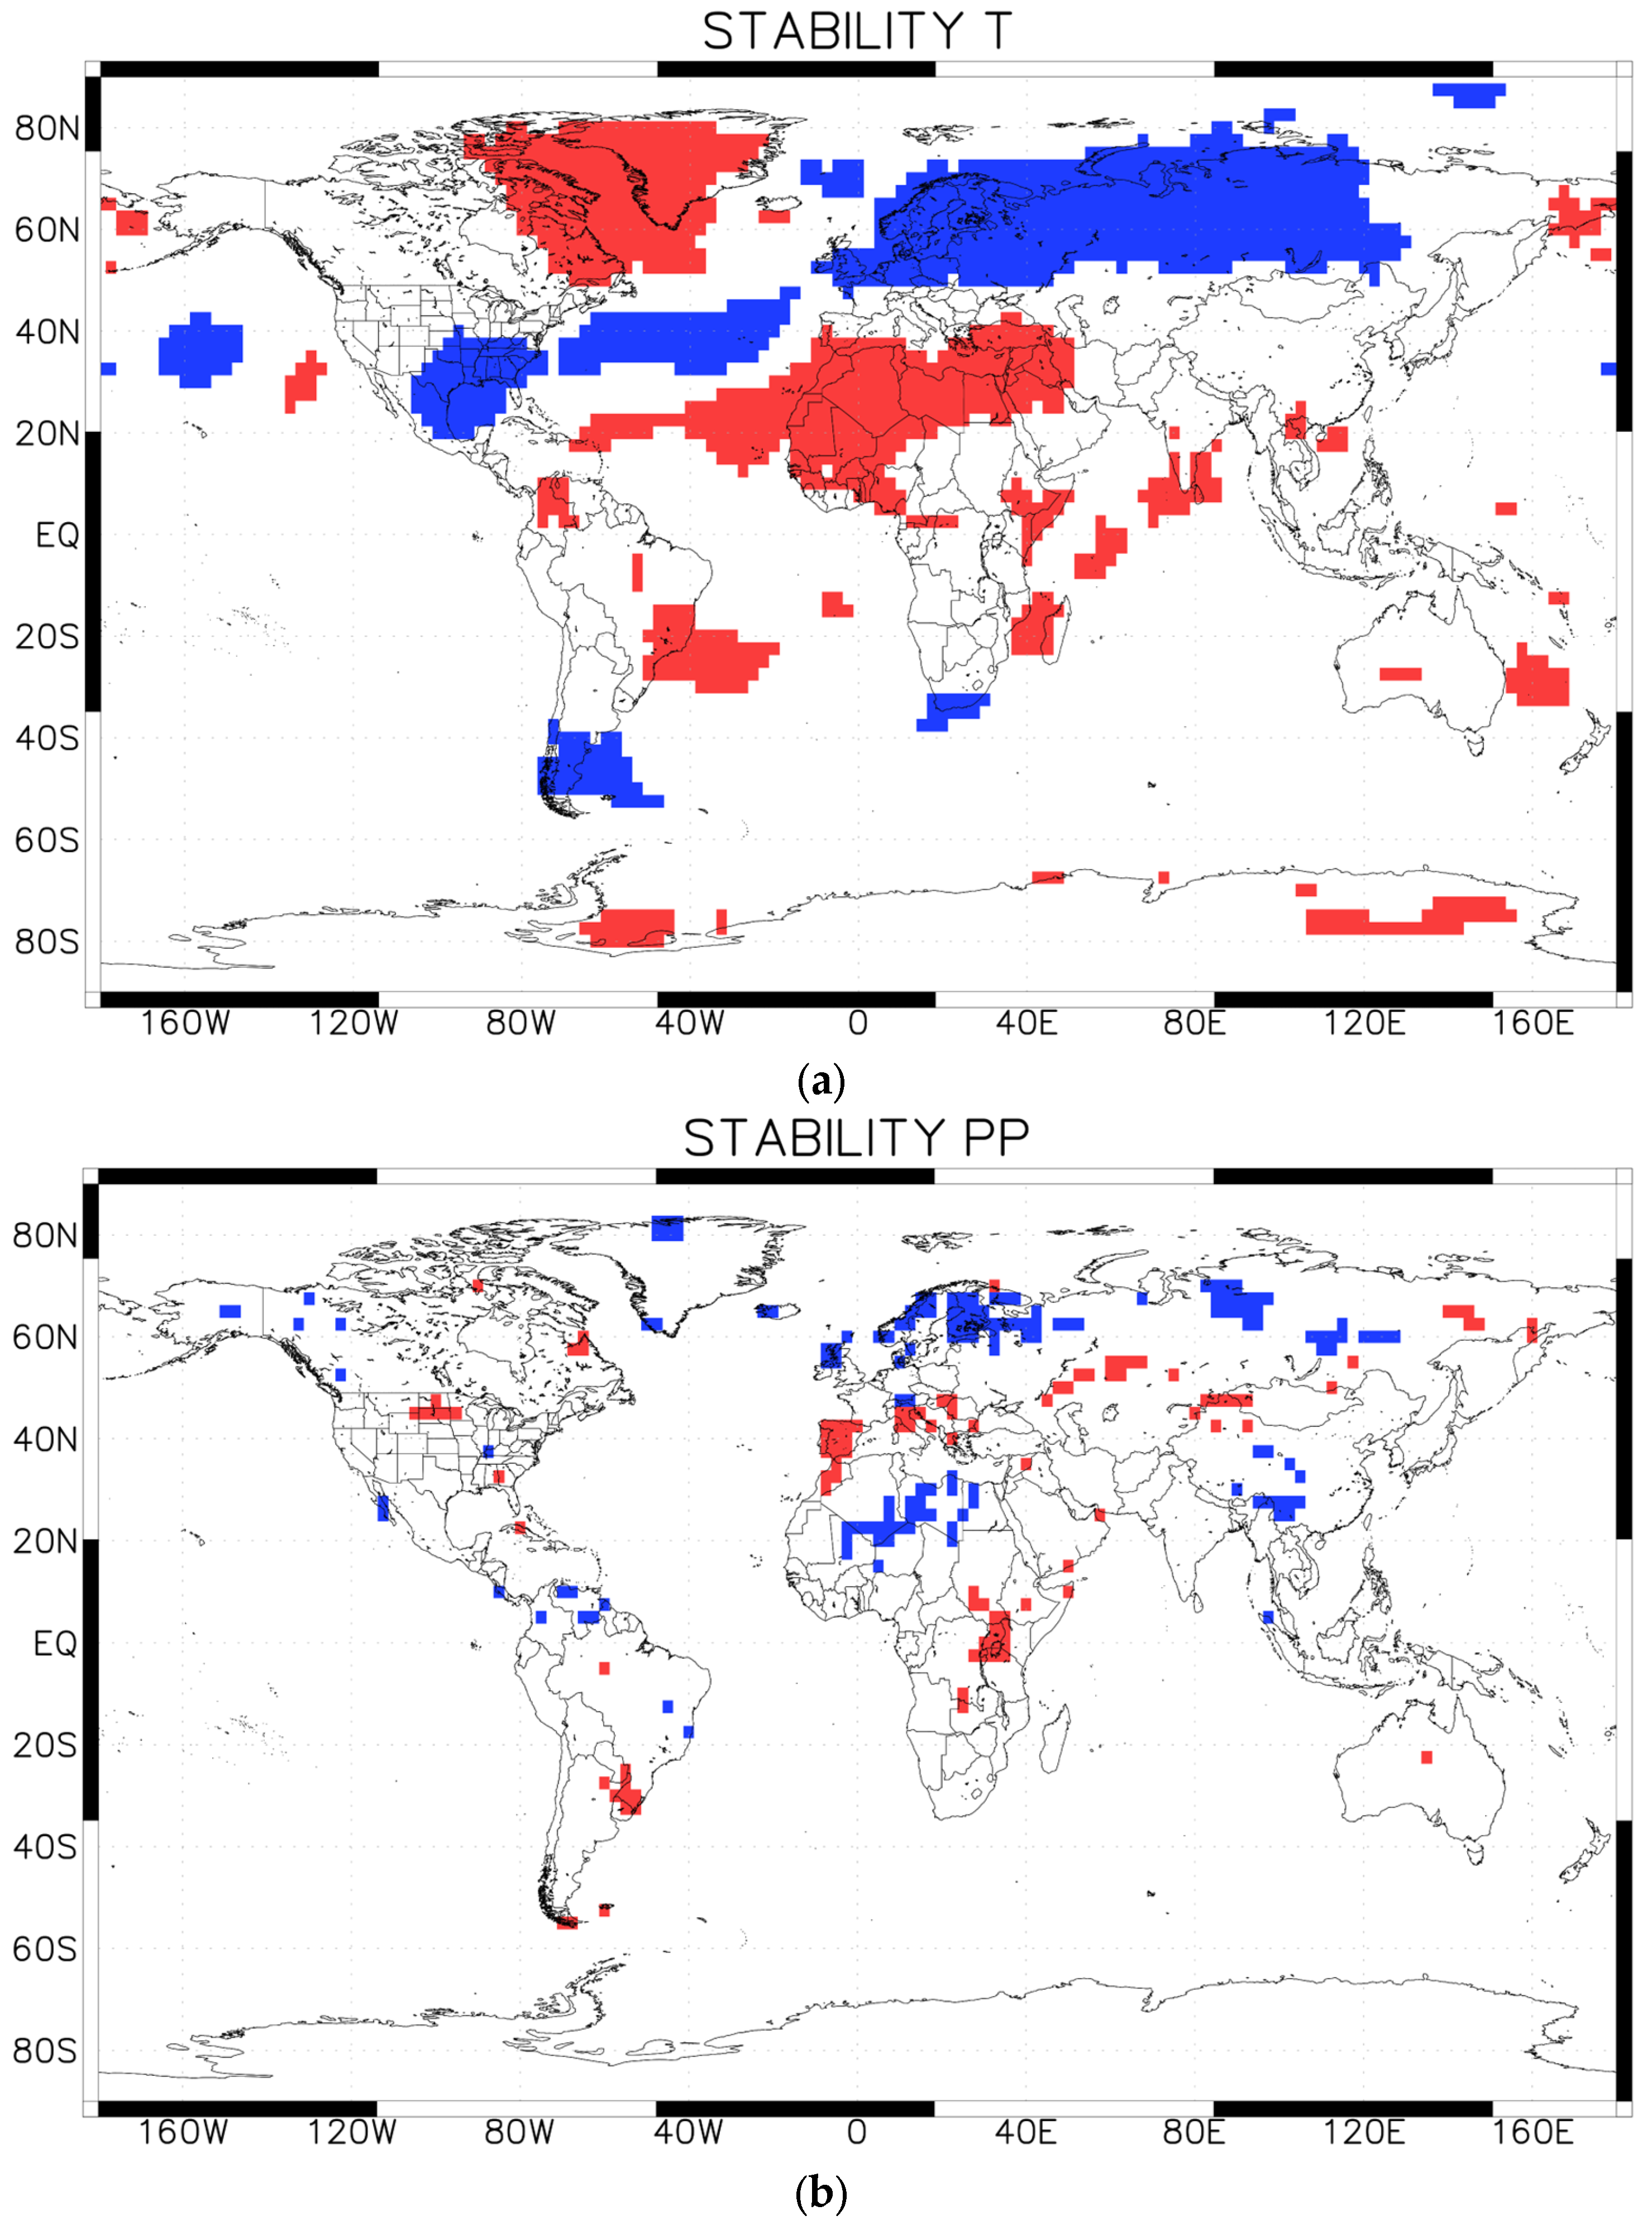
The regions where the correlations between blocking PC1 and T and PP are stable and the mean correlations are positive (negative) are represented in red (blue) (Figure 4). The results are not sensitive to reasonable changes of these subjectively chosen parameters, i.e., the correlation threshold and the percentage of windows with correlations above this threshold. The time series from these grid-points, emphasized in red and blue on the stability correlation maps (Figure 4), are used to construct the multiple regression model for blocking PC1 prediction during the calibration period, i.e., 1980–2022.
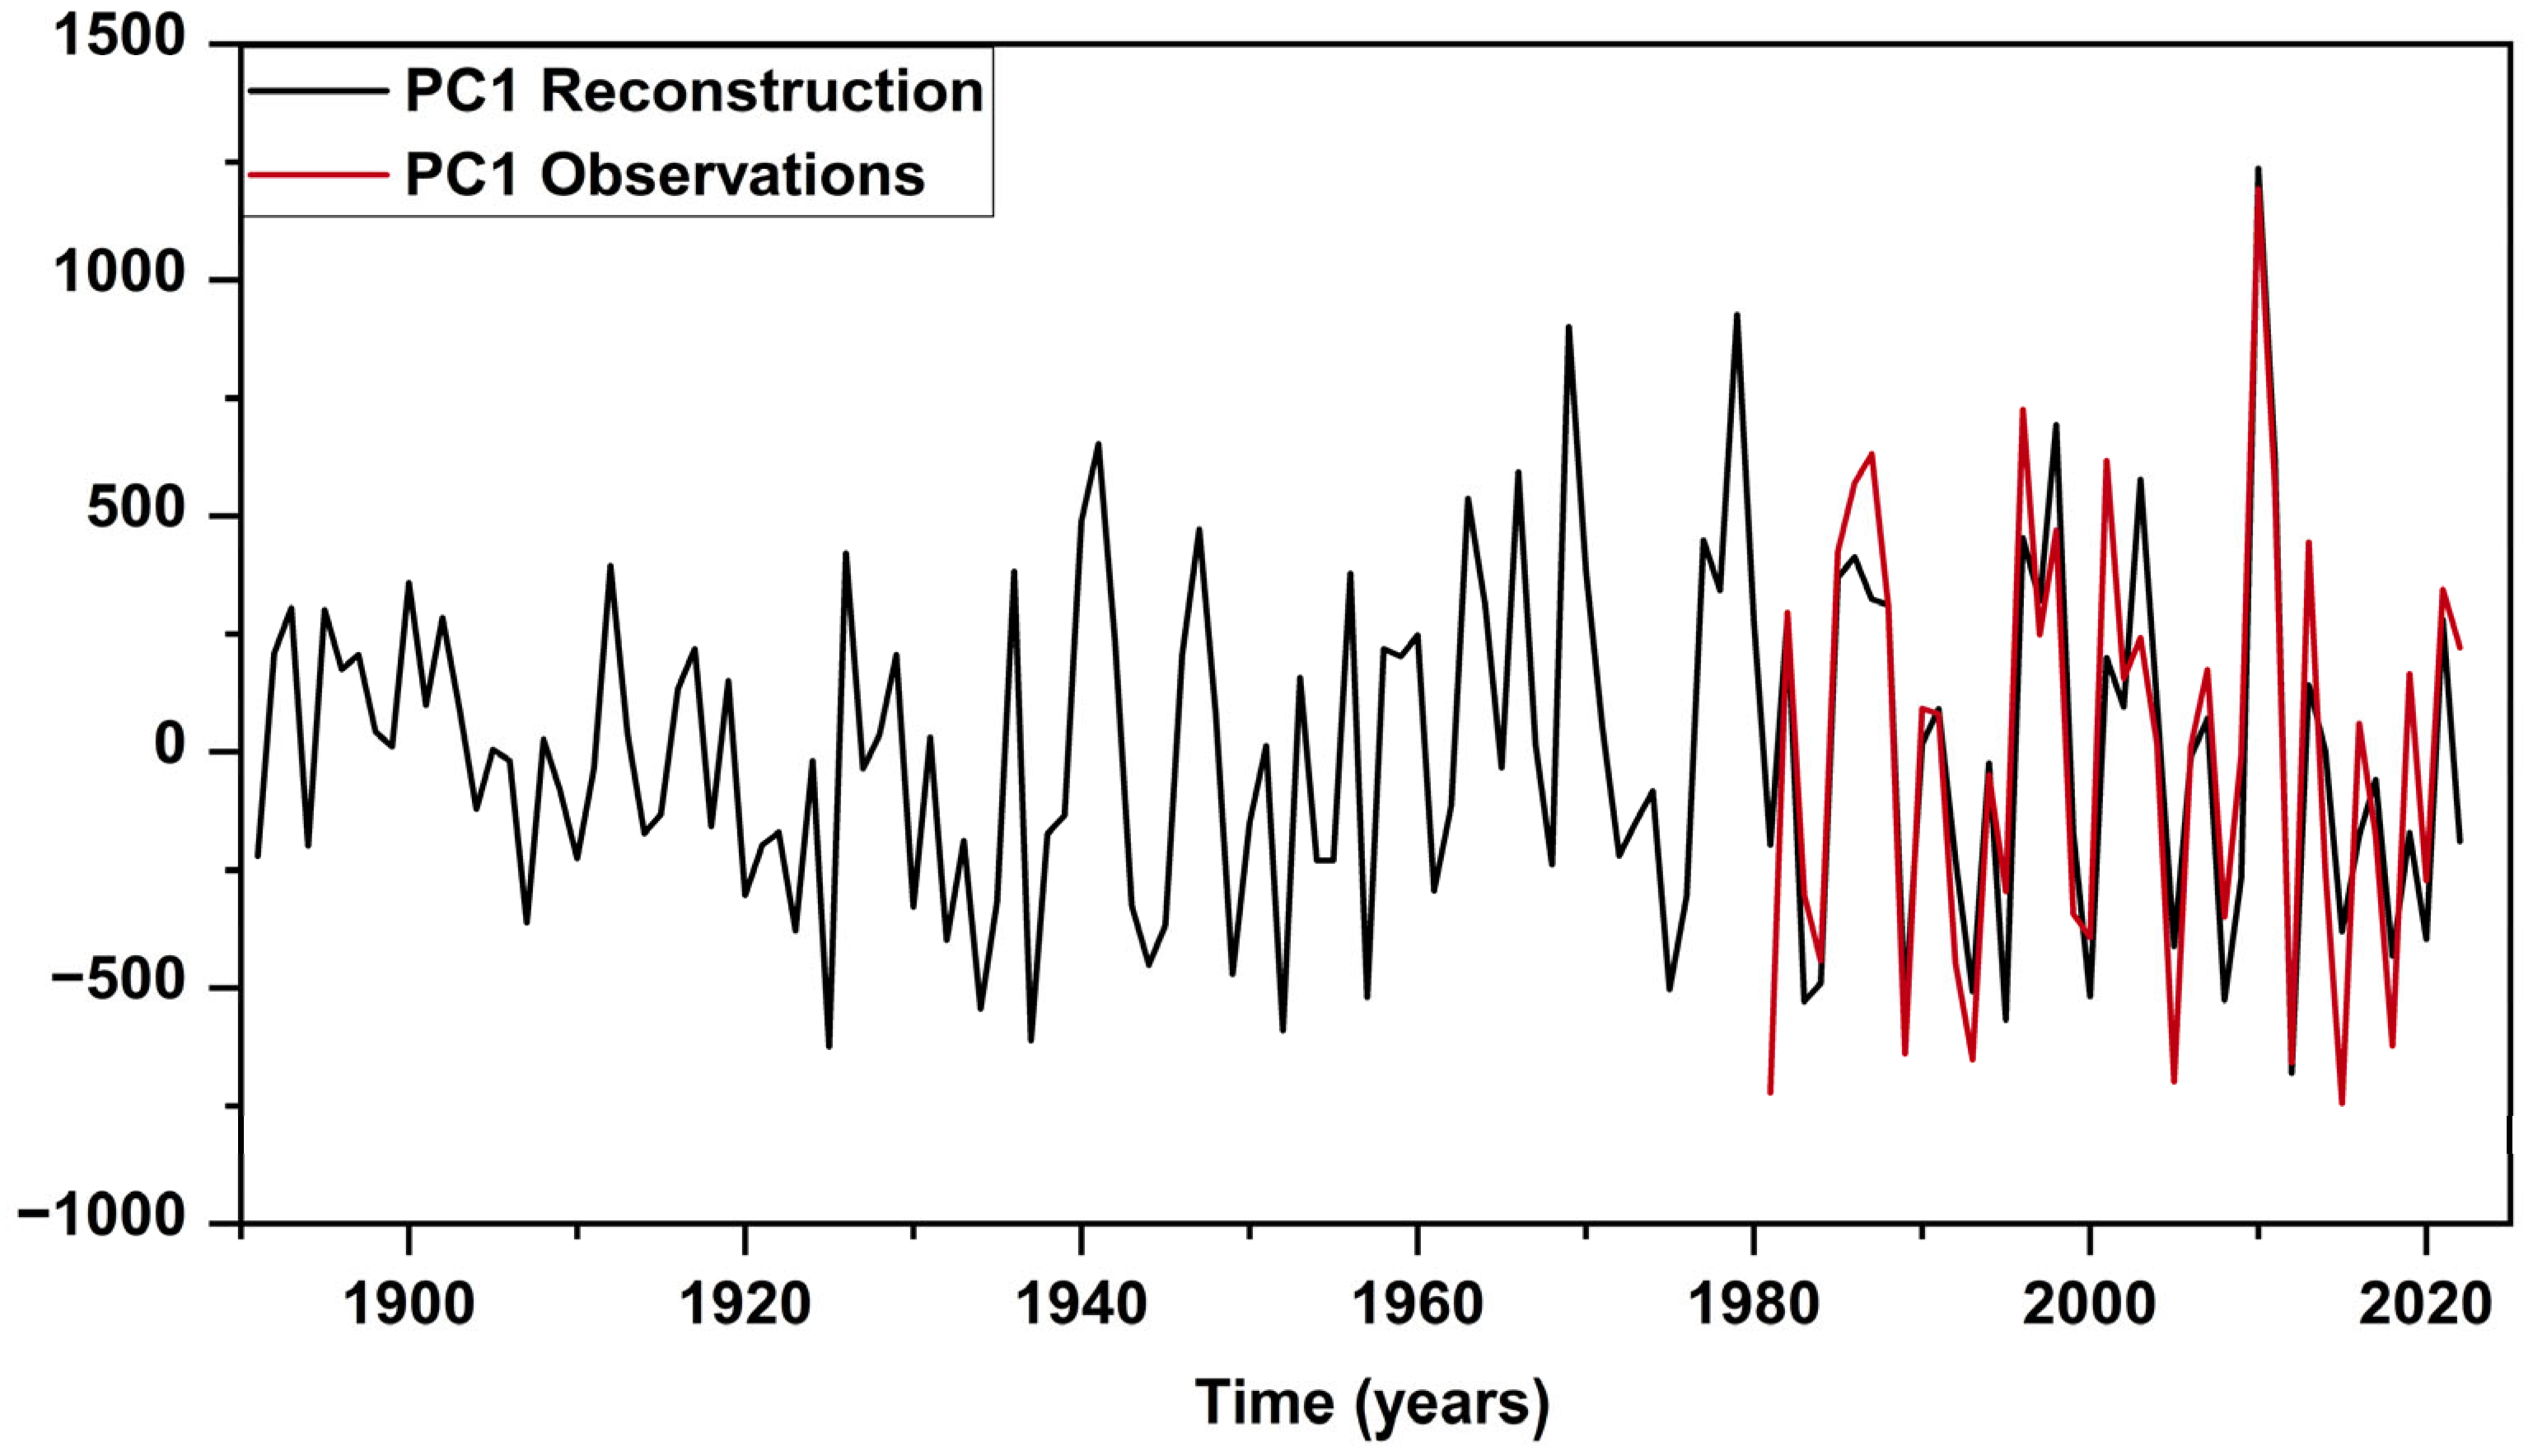
Using the multiple regression model, calibrated based on T and PP data during 1980–2022, we predicted the blocking PC1 back to 1891 using observed T and PP data from the same grid-points, represented in red and blue on the stability maps (Figure 4). Over the calibration period, the correlation is very high, r = 0.90 (Figure 5). The predicted blocking PC1 for the period 1891–1980 (Figure 5) is highly correlated with the observed NAO index (r = −0.75). We applied the same procedure for higher-order blocking PCs and reconstructed the blocking frequency field using the corresponding EOF patterns back to 1891. For the blocking reconstruction, we used the first ten EOFs describing about 75% of the blocking frequency index variability during the calibration period, i.e., 1980–2022. Furthermore, the first five PCs of the selected T and PP time series were used as predictors for the corresponding blocking PCs. However, the results remain qualitatively the same for reasonable changes of these parameters.
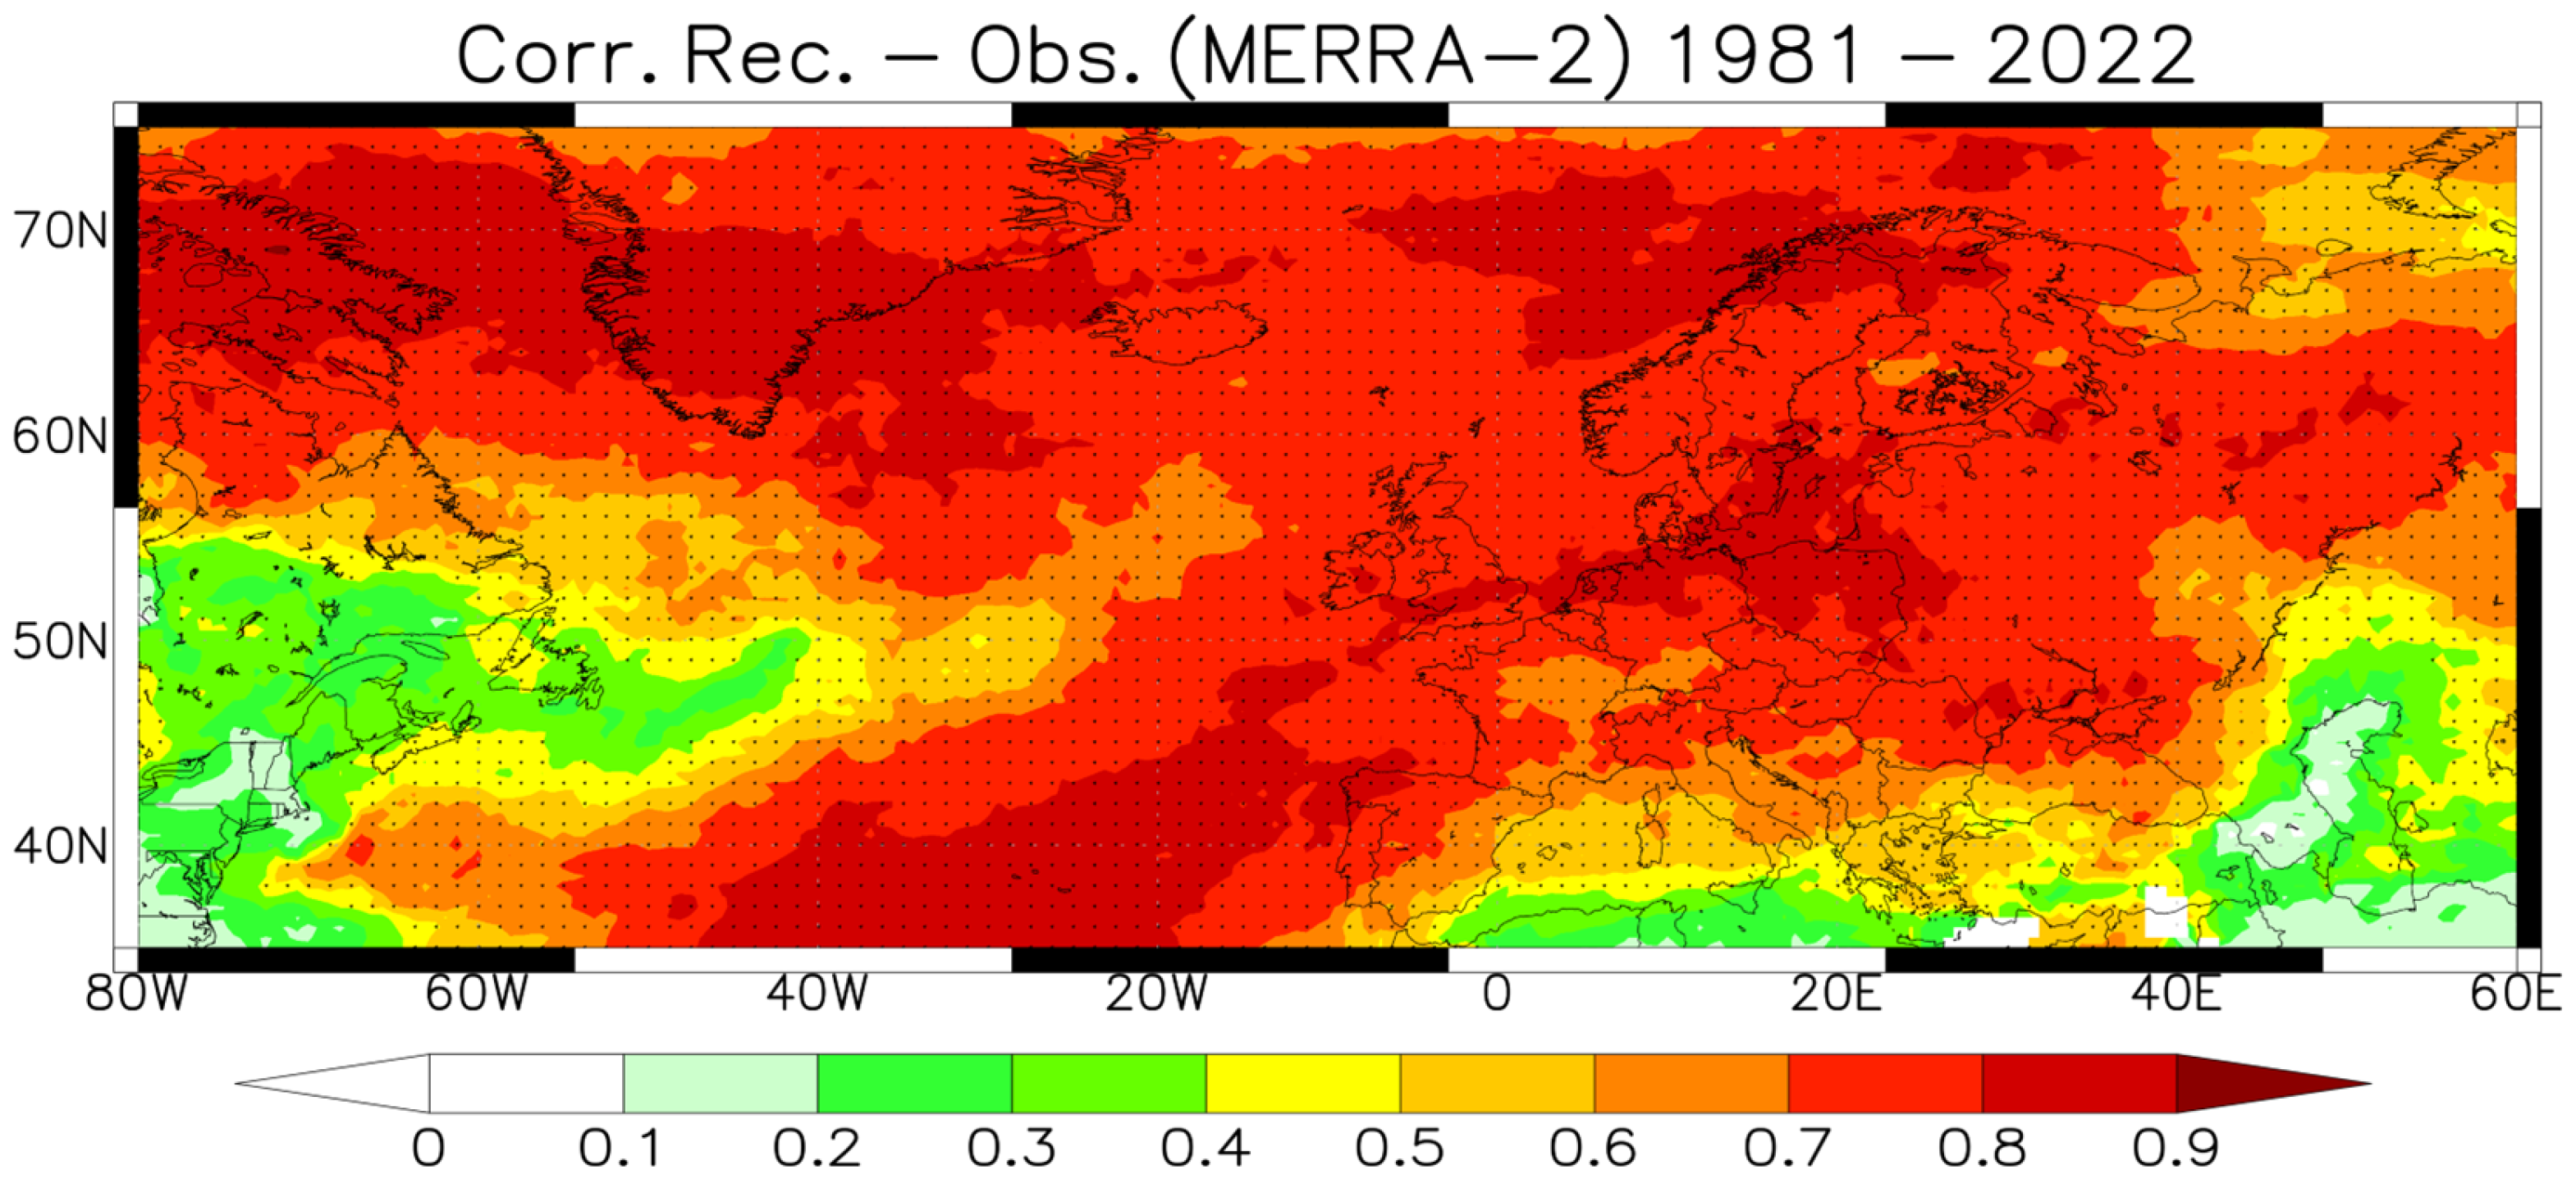
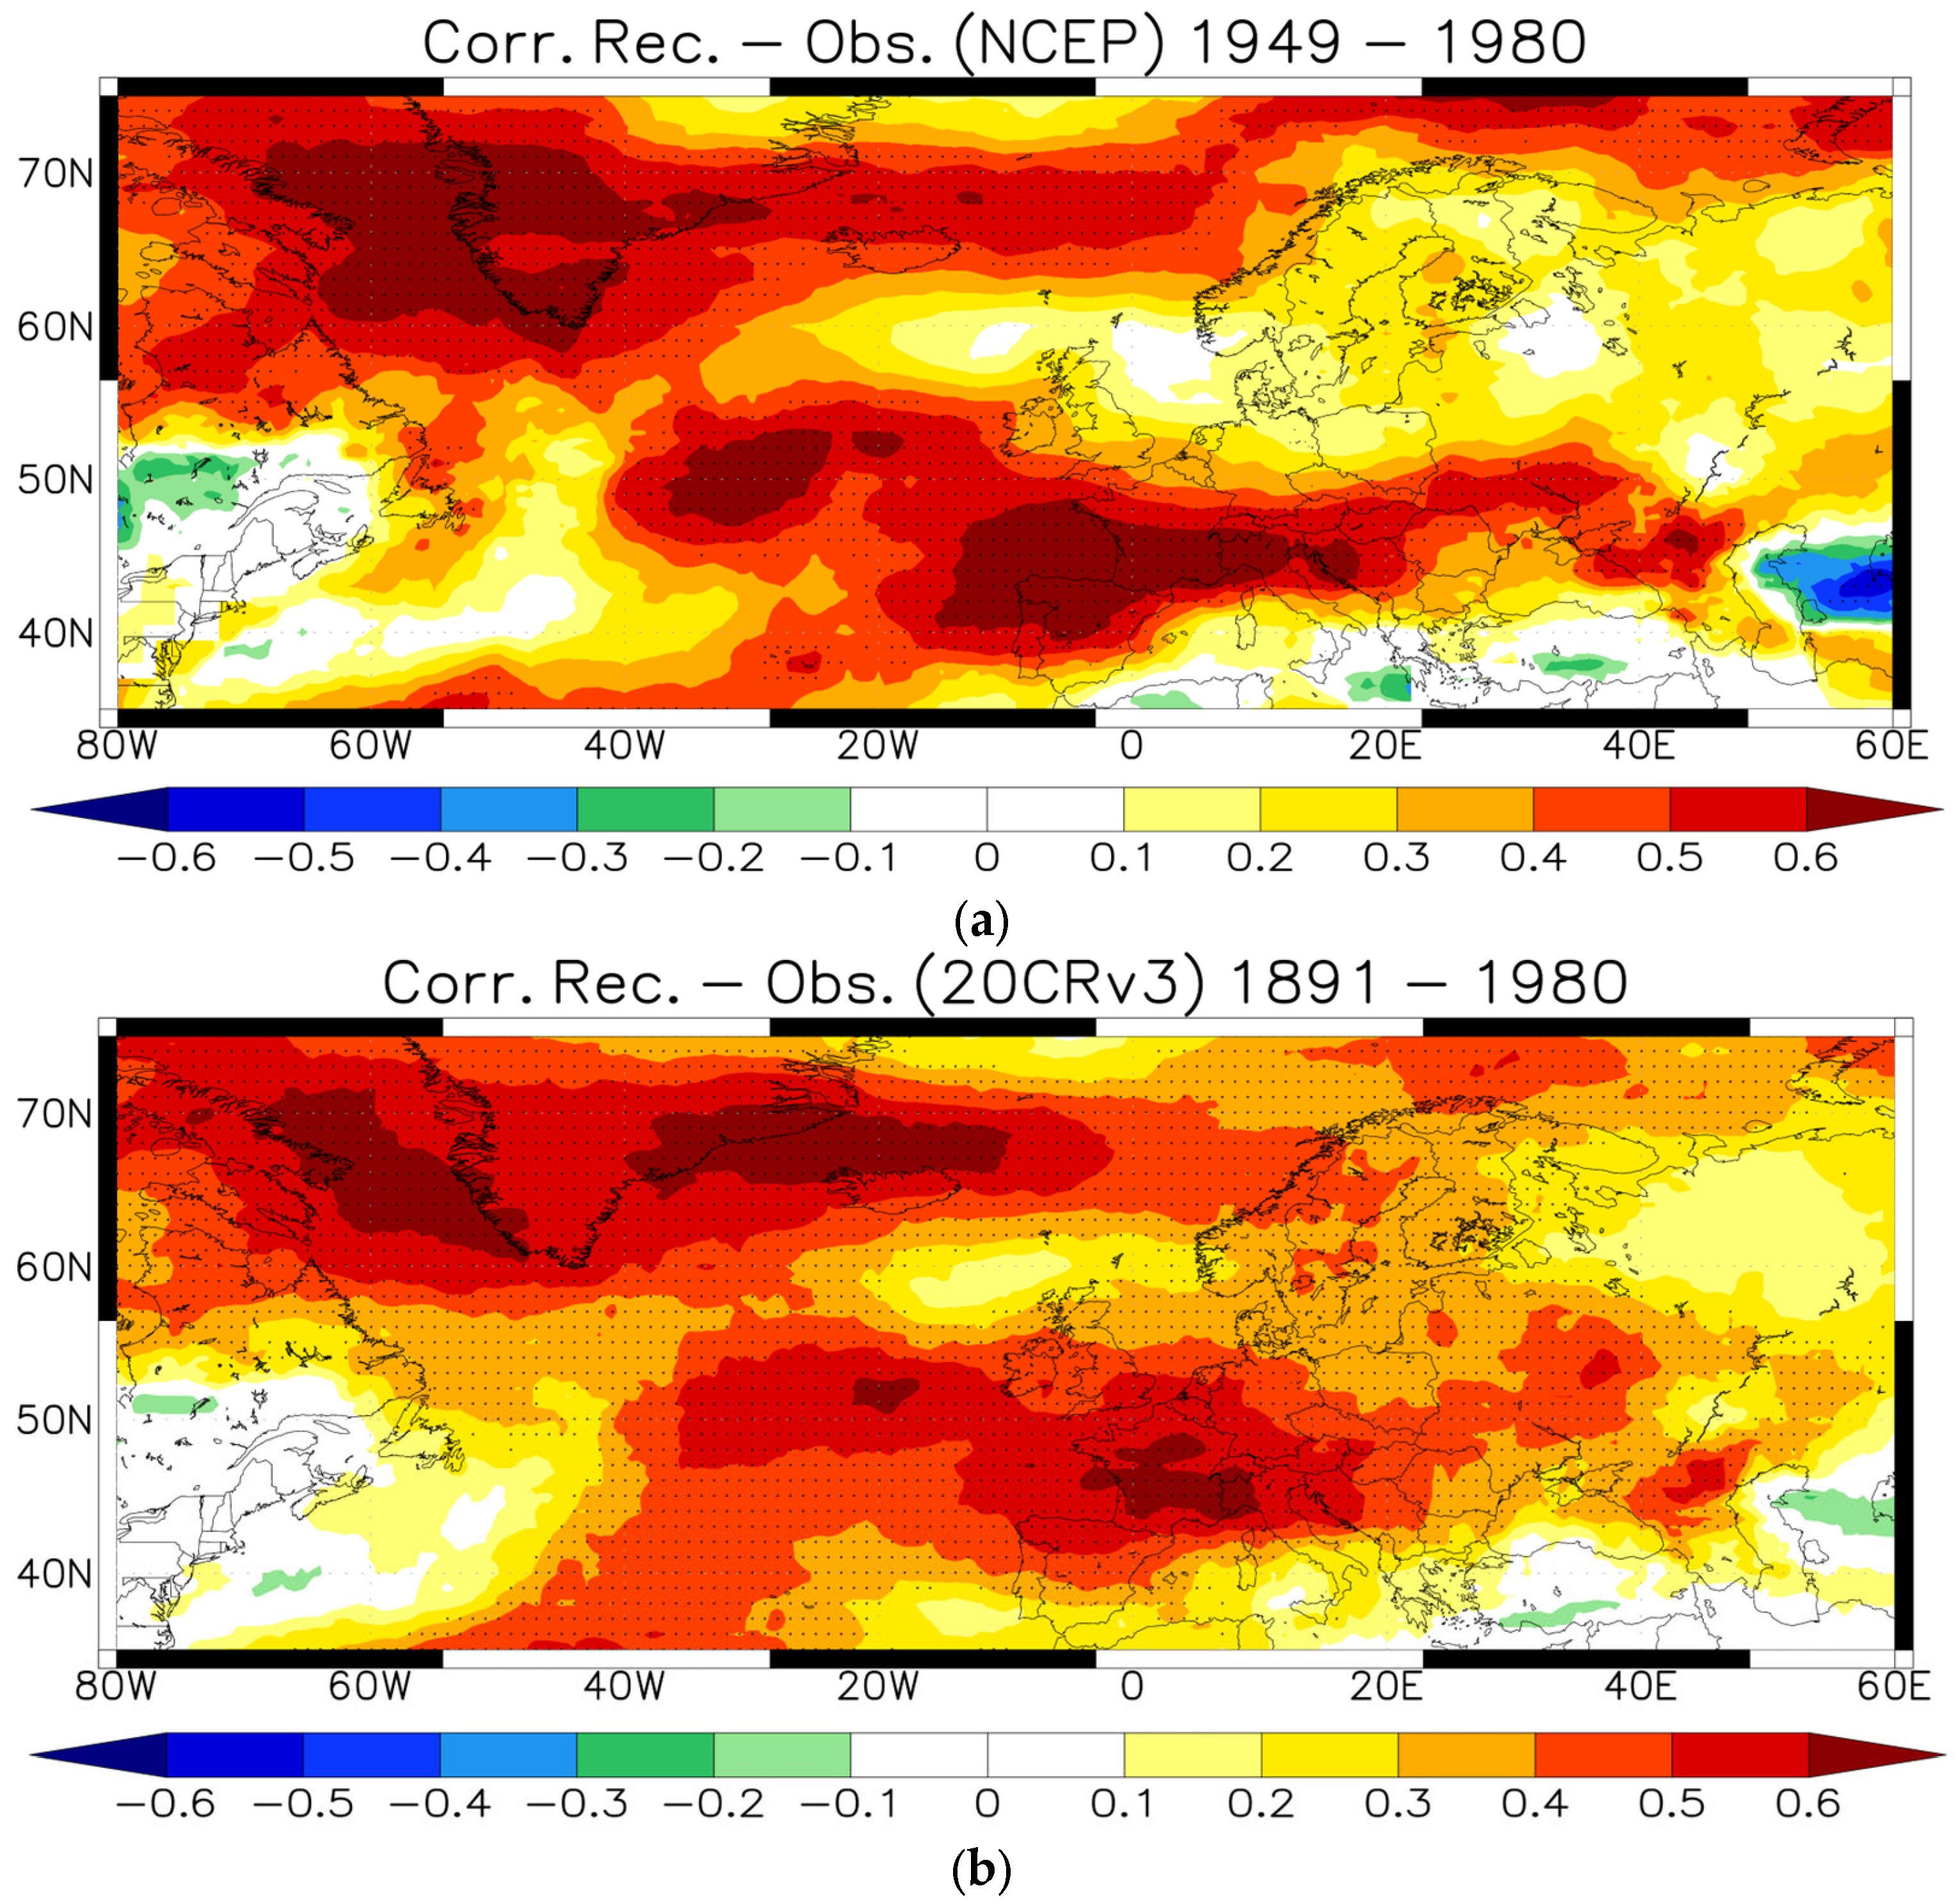
The correlations between the reconstructed and observed blocking field during the calibration period, i.e., 1980–2022, are significant in most of the grid-points (Figure 6). High correlations above 0.8 can be found in areas close to high winter blocking frequency, like Greenland, whereas low correlations are in the regions of low winter blocking activity. The correlations between reconstructed and NCEP (Figure 7a) as well as 20CRv3 (Figure 7b) blocking frequency fields are significant over large areas of Greenland and Europe, whereby the correlations are positive over almost all grid-points (Figure 7). This suggests that a large part of blocking frequency variability during winter in the Atlantic-European region can be predicted from winter mean surface temperature and precipitation anomalies.

3.2. Blocking Reconstruction Based on Paleo-Reanalysis Data

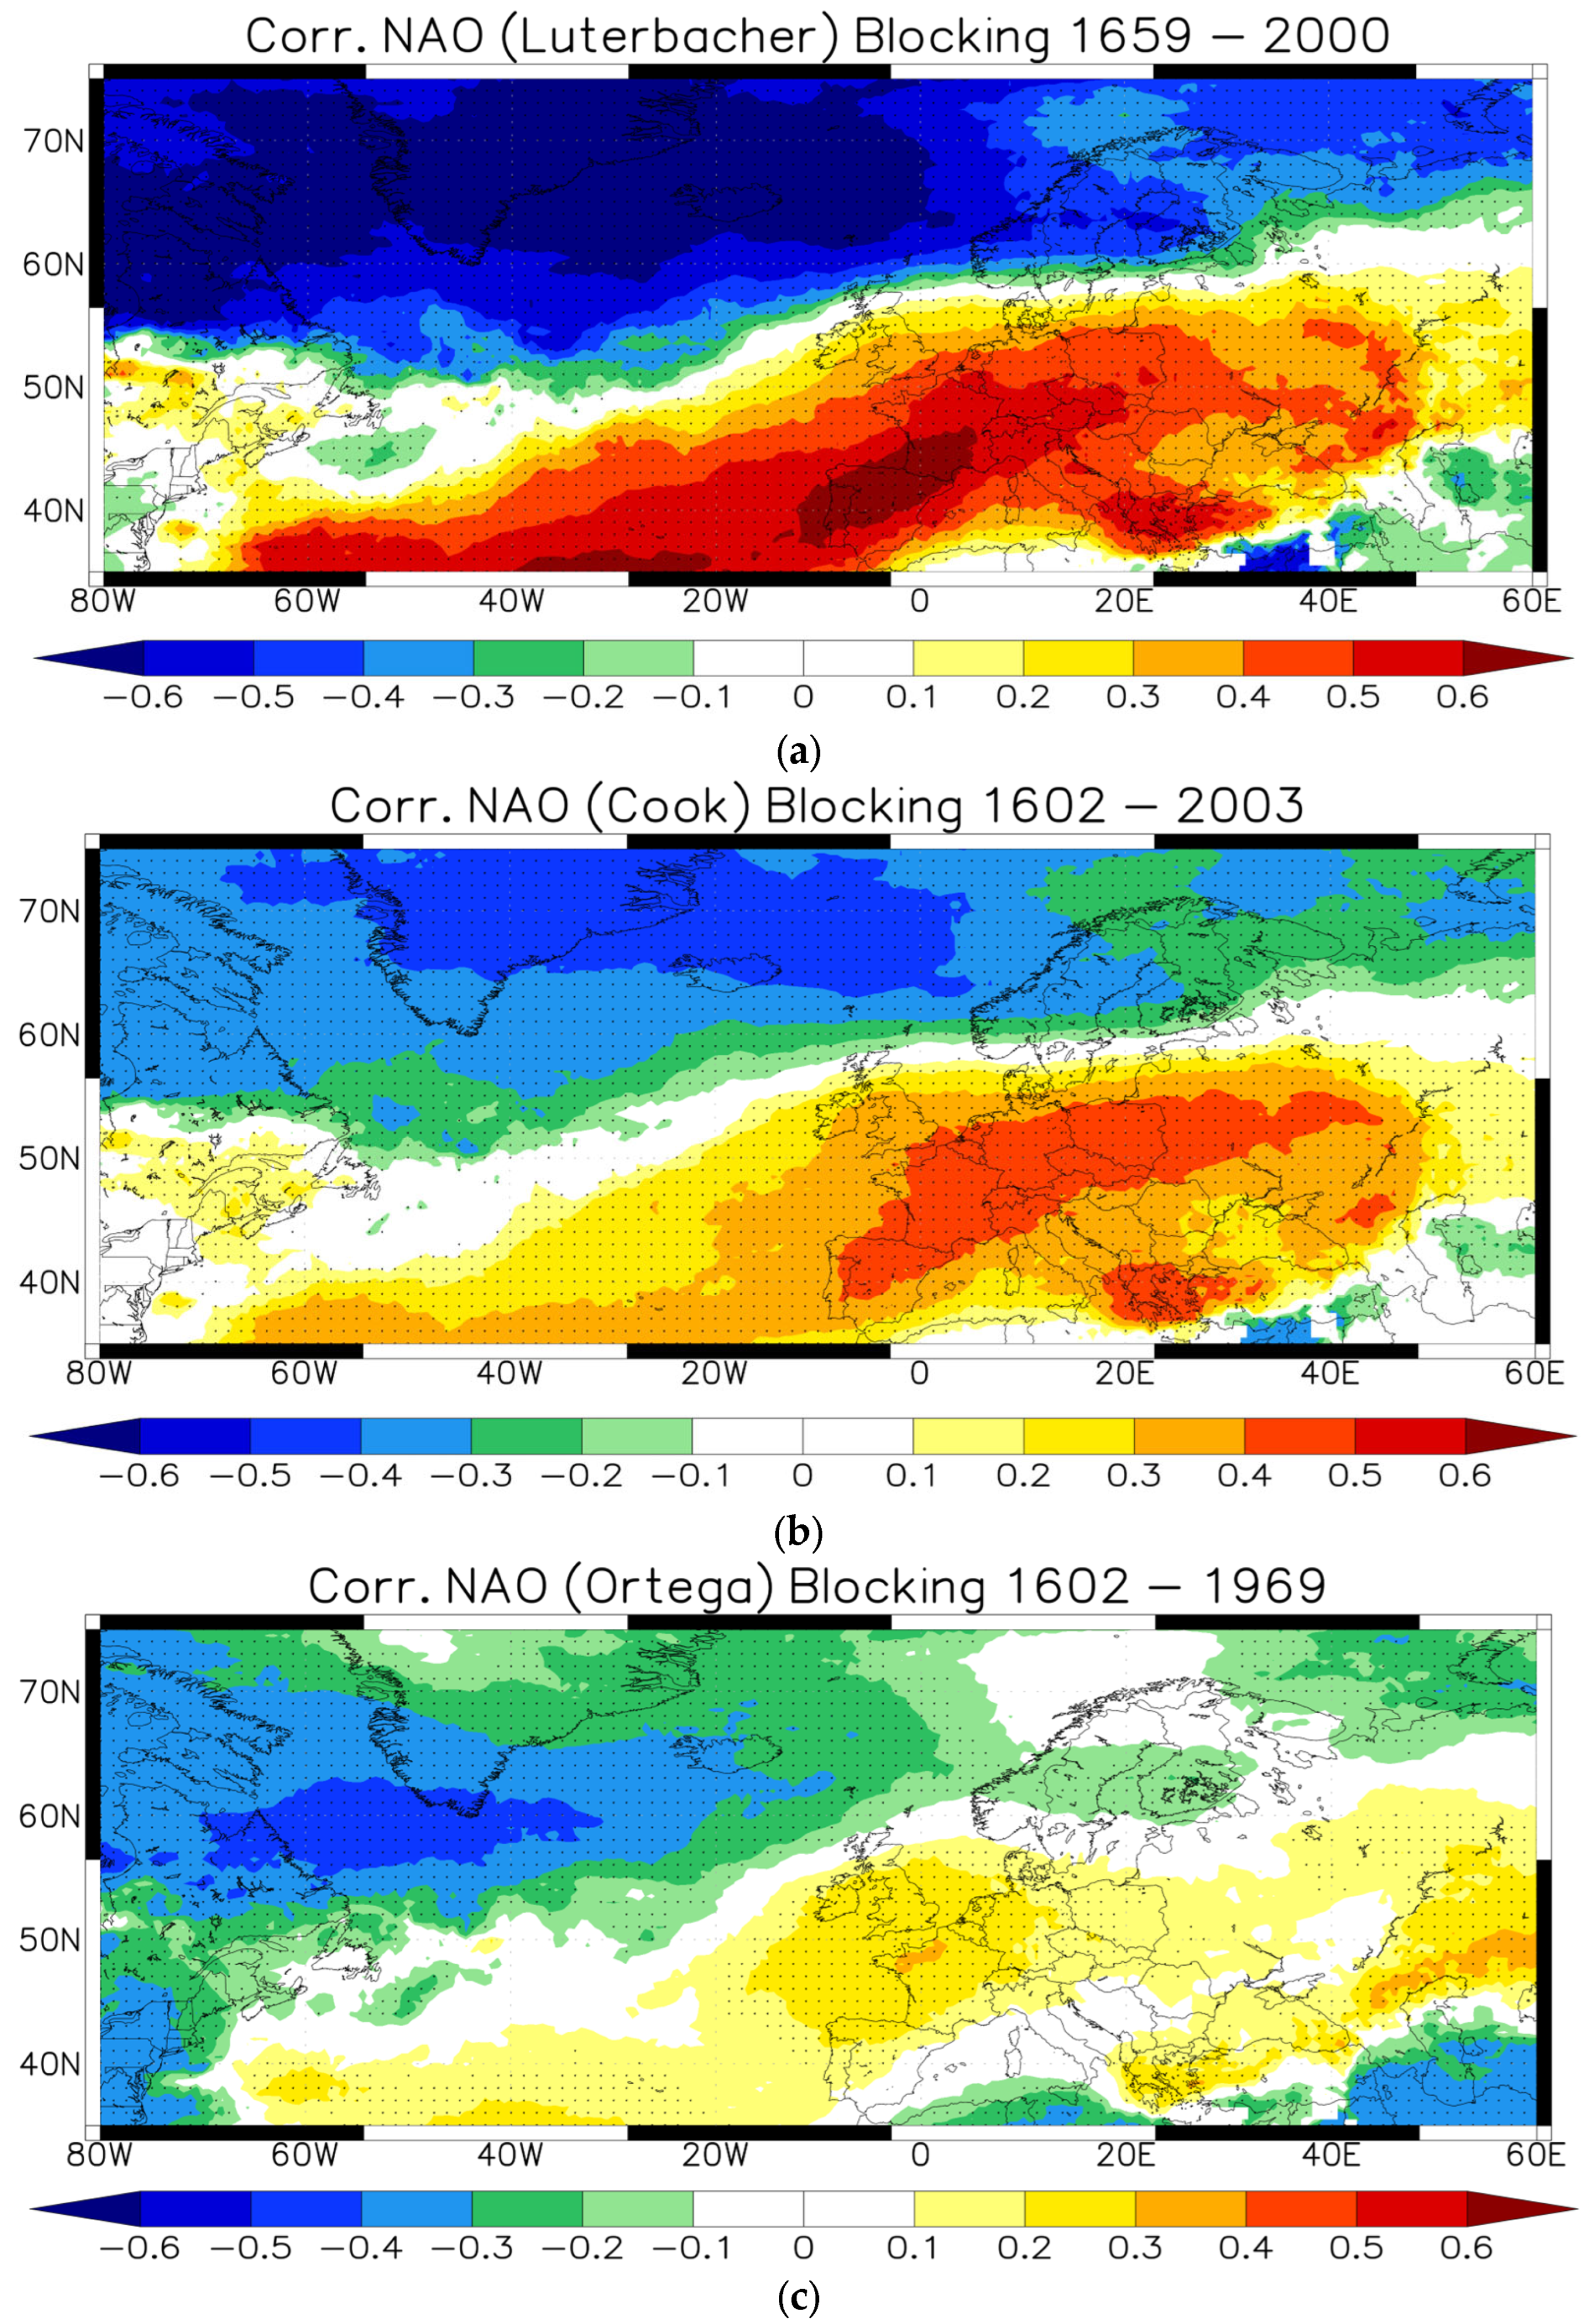
The multiple regression models for blocking prediction during the calibration period, i.e., 1980–2022, are used further to extend the blocking frequency reconstruction back to 1602 AD. As predictors, we used winter mean temperature and precipitation anomalies from the EKF400v2 paleo-reanalysis dataset [19]. The T and PP fields were first interpolated to a 2.5° × 2.5° regular latitude–longitude grid. Then, the predictors were selected based on the corresponding stability correlation maps derived using T and PP data during the calibration period. To our knowledge, there are no other reconstructions of this 2D blocking index for this period. Therefore, we used reconstruction of climate indices to validate it. The reconstructed NAO index of [23] is significantly correlated with our blocking reconstruction during the common period, i.e., 1659–2000 (Figure 8a). Consistent patterns have been detected for the [22] and [21] NAO reconstructions (Figure 8b,c). The differences between the correlation patterns in these three reconstructions (Figure 8) could reflect the characteristics of the NAO predictors, like the number, type or spatial distribution.
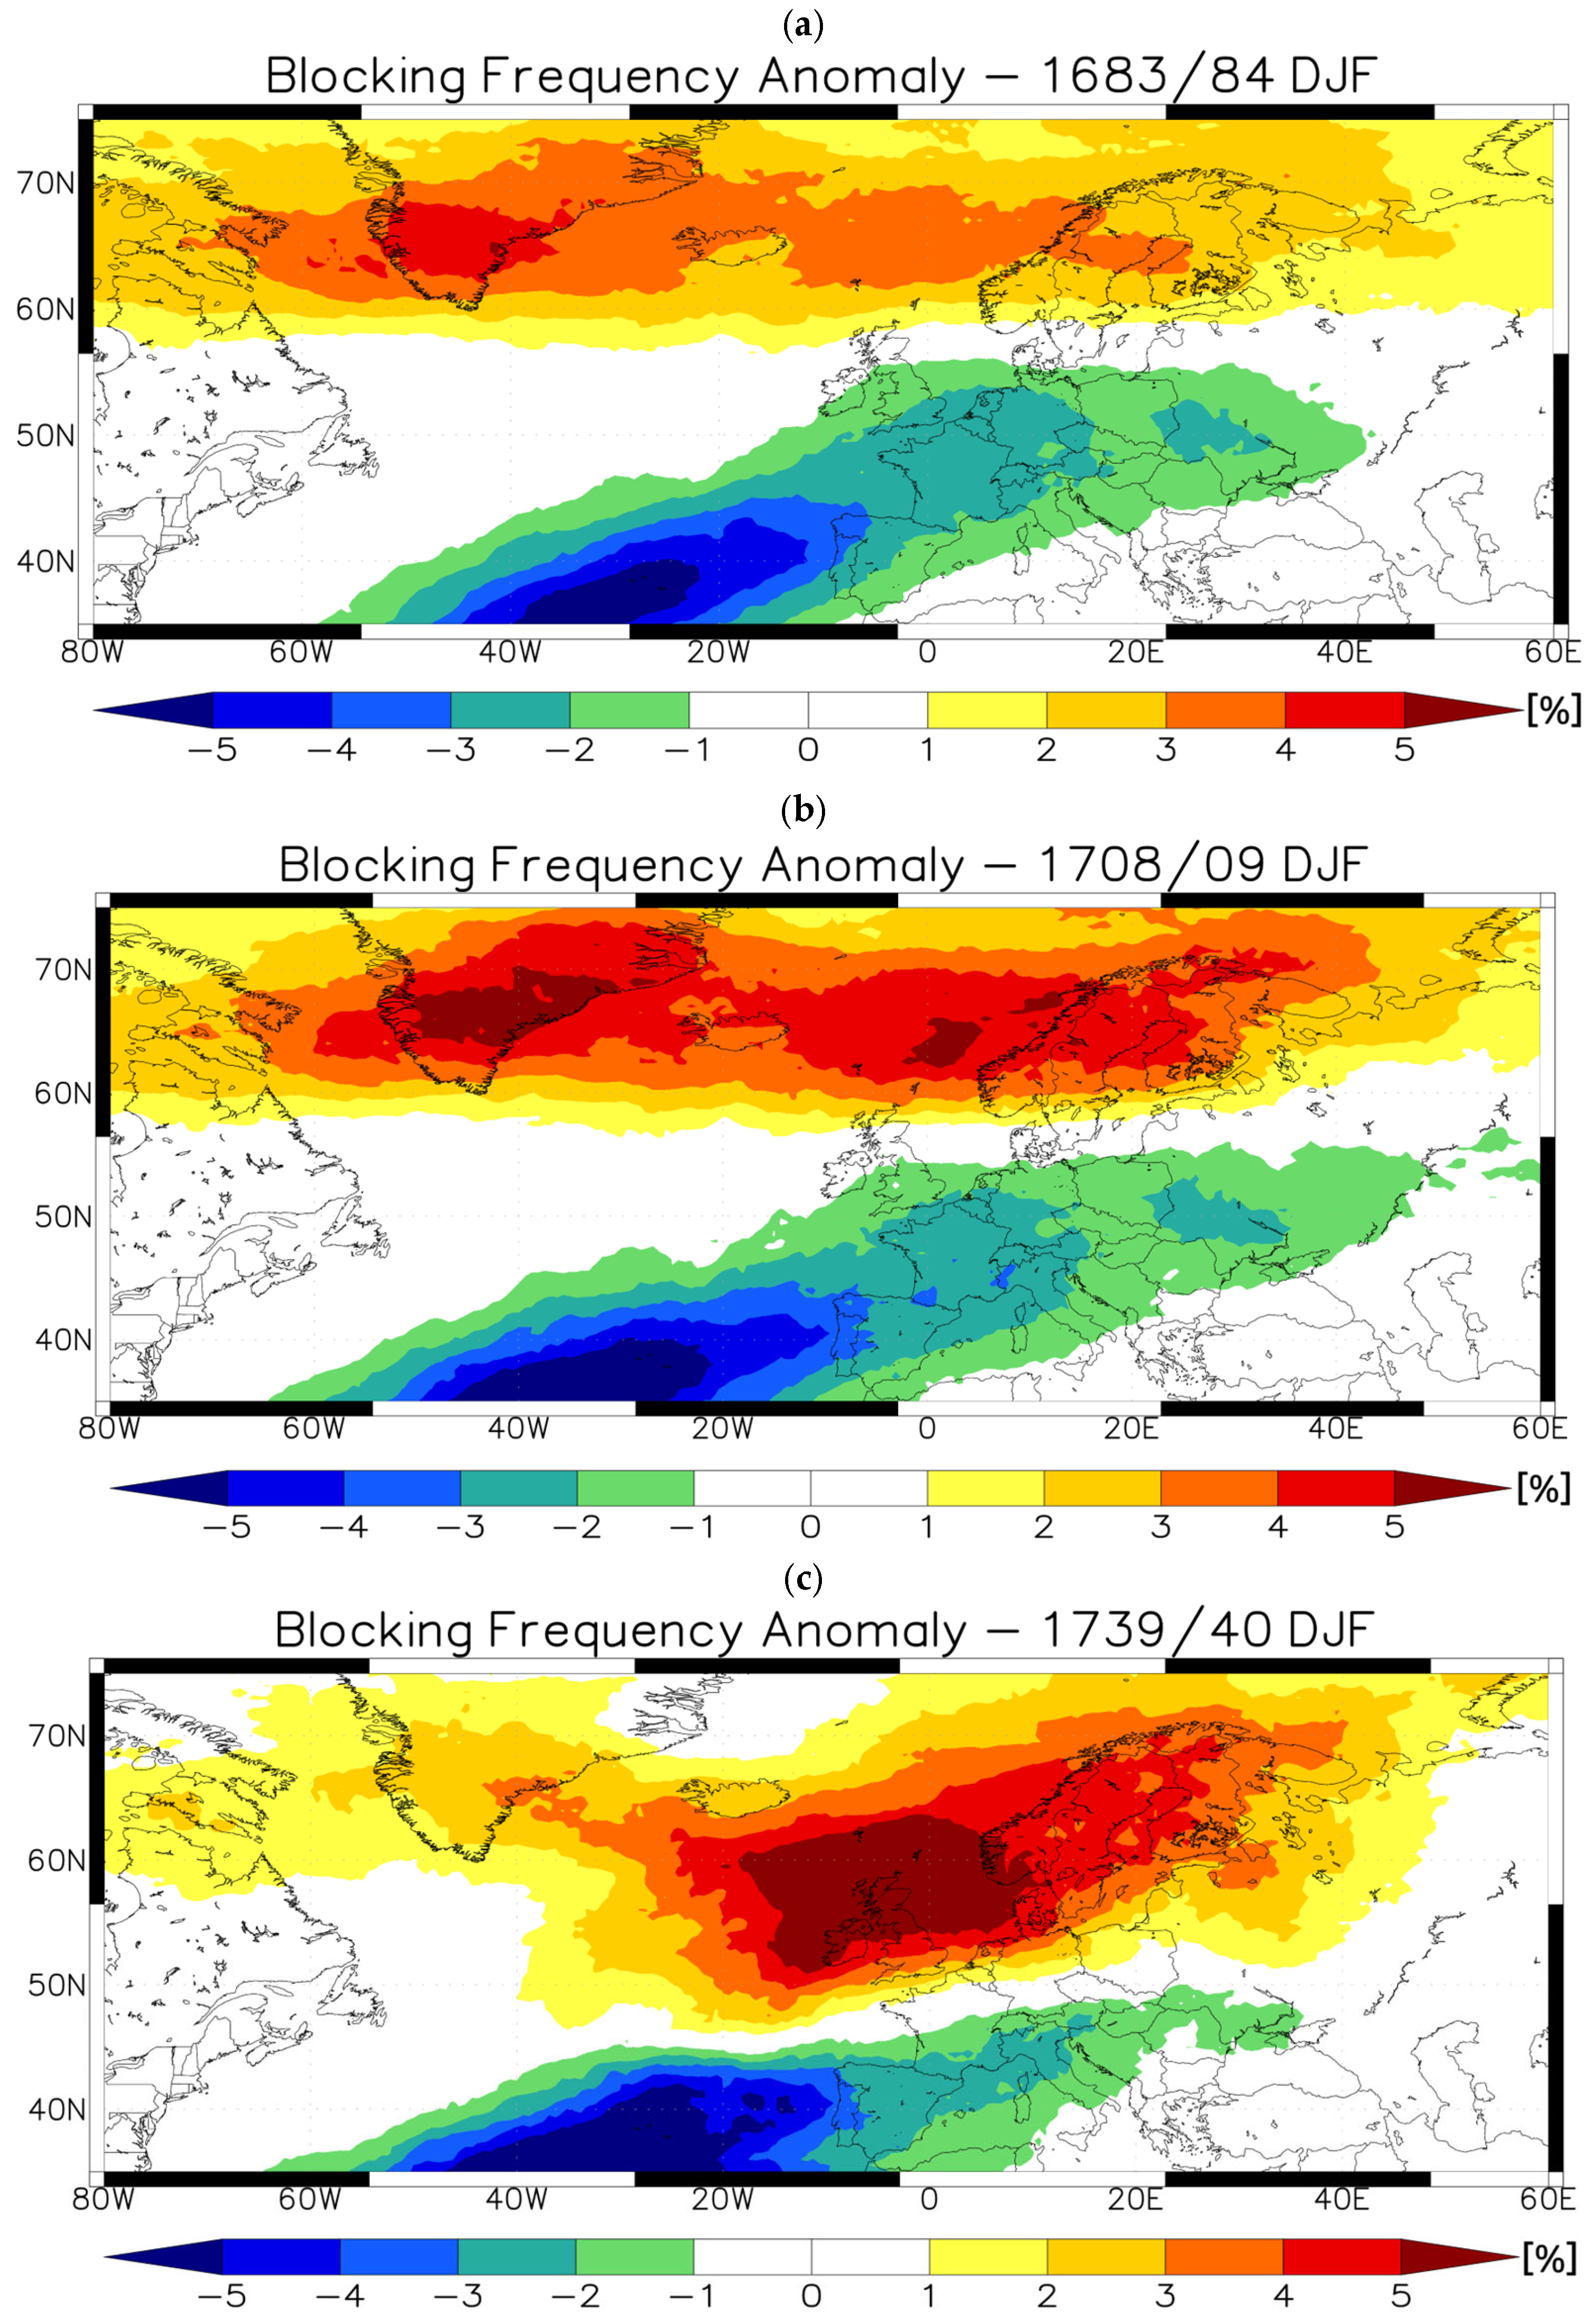
We also validate our reconstruction against particular extremely cold winters over Europe. The extremely cold European winter of 1683/84, referred to as the “Great Frost” [29], is characterized by enhanced blocking activity over Northern Europe and Greenland in our reconstruction (Figure 9a). Furthermore, the “Great Winter” of 1708/09, one of the coldest in recent European history [30], is characterized by enhanced blocking activity over Northern Europe and Greenland in our reconstruction (Figure 9b). Furthermore, our reconstruction shows that the blocking circulation was related to the coldest European winter in the last 600 years, i.e., the winter of 1739/40 [30] (Figure 9c). Our blocking reconstruction can be used to look for further association between extreme winter conditions over Europe, as inferred from different sources, and atmospheric blocking.

4. Discussion and Conclusions

In this study, we present a reconstruction of a 2D atmospheric blocking indicator in the Atlantic-European region for the last 400 years. The reconstruction method used here attempted to avoid the unstable relationship between predictands and predictors, which affects the quality of classical climate reconstructions based on linear regression models. Therefore, we selected the predictors for blocking PCs from seasonally averaged surface temperature and precipitation gridded datasets using stability correlation criteria during a calibration period, in our case, 1980–2022. Our assumption is that stable correlation patterns between the predictand, i.e., the blocking PCs, and the corresponding predictors, detected during the calibration period, do not change over time. Therefore, T and PP anomalies from these regions can be used as stable predictors for blocking patterns. The results presented here show that such an assumption leads to a skillful reconstruction of the 2D blocking frequency indicator. This suggests that a large part of the blocking frequency variability in the Atlantic-European region during winter can be predicted using winter mean surface temperature and precipitation anomalies. However, more complex stability correlation criteria [31,32] could be used to select the blocking predictors from T and PP gridded datasets to further improve the skill of blocking frequency reconstructions.
Using temperature and precipitation data from the recently published EKF400v2 paleo-reanalysis dataset [19], we reconstructed the blocking frequency anomalies back to 1602. Other paleo-reanalysis data [20] could be used to extend our blocking reconstruction over the last millennia using the method proposed in this paper. We validated our reconstruction using observed blocking data, i.e., NCEP and 20CRv3 reanalysis, three independent NAO index reconstructions [21,22,23] as well as weather reconstructions for extremely cold years in Europe [29,30]. We showed that our reconstruction captures blocking frequency variability prior to the calibration period, i.e., 1891–1980, well. Furthermore, the NAO indices [21,22,23] are significantly positively (negatively) correlated with blocking frequency over Greenland (Europe) during the last 400 years. This pattern is consistent with the blocking pattern associated with the NAO during the observational period. However, the magnitude of the correlations depends on the characteristics of the NAO index, i.e., the reconstruction method, type of predictors and temporal resolution. Additionally, our reconstruction shows enhanced blocking over Northern Europe during extremely cold winters, as described in previous studies [29,30]. However, we used a simple correlation technique to assess the skill of our reconstruction. More complex metrics, like the reduction of errors or contingency tables [24], could be used to further evaluate the quality of the reconstructions based on the methodology presented here. Furthermore, the blocking characteristics presented here should also be discussed in connection with other blocking-related atmospheric circulation pattern variability during the last 400 years, like the Atlantic jet stream, as presented in a recent study [33].
Blocking has been recognized as a significant atmospheric phenomenon for over a century. In spite of this, many aspects of variability and predictability of blockings are still open research questions [34]. The blocking reconstruction presented in this study could be helpful to advance our understanding of blocking variability and predictability. Our method provides a simple but robust framework for investigating the potential relationships between blocking events and various sources of climate variability over the last 400 years. This capability makes our reconstruction highly suitable for analyzing the connections between low-frequency variability of weather and climate extremes and internal or external forcing factors, like the AMO or solar irradiance changes. By enabling the exploration of these interactions, our approach could offer valuable insights into the physical mechanisms behind extreme weather and climate variability at decadal to centennial timescales.

Author Contributions

N.R. conceptualized the study and wrote the article draft; all authors (N.R., M.I., T.S. and G.L.) helped with the writing of the original draft and the interpretation of the results. All authors have read and agreed to the published version of the manuscript.

Funding

This research received no external funding.

Data Availability Statement

All data used in this study are publicly available and have been referenced in the Data and Methods Section. The blocking reconstruction generated with the methodology presented in the current study is available from the corresponding author upon reasonable request.

Acknowledgments

N.R., M.I., T.S. and G.L. are supported by Helmholtz Association through the joint program “Changing Earth—Sustaining our Future” (PoF IV) of the AWI. This work was supported by funding from the Helmholtz Climate Initiative REKLIM. We would like to acknowledge the anonymous reviewers for their time and effort in examining this manuscript. Their comments made this manuscript a stronger contribution. I acknowledge support by the Open Access publication fund of Alfred-Wegener-Institut Helmholtz-Zentrum für Polar- und Meeresforschung.

Conflicts of Interest

The authors declare no conflicts of interest.

References

  1. Kautz, L.A.; Martius, O.; Pfahl, S.; Pinto, J.G.; Ramos, A.M.; Sousa, P.; Woollings, T. Atmospheric blocking and weather extremes over the Euro-Atlantic sector—A review. Weather Clim. Dyn. Discuss. 2022, 3, 305–336. [Google Scholar] [CrossRef]
  2. Voskresenskaya, E.N.; Kovalenko, O.Y. Blocking Anticyclones in the European Region and Their Variability Associated with El Nino Events. Izv. Ross. Akad. Nauk. Seriya Geogr. 2016, 1, 49–57. [Google Scholar] [CrossRef]
  3. Hakkinen, S.; Rhines, P.B.; Worthen, D.L. Atmospheric blocking and Atlantic multidecadal ocean variability. Science 2011, 334, 655–659. [Google Scholar] [CrossRef]
  4. Rimbu, N.; Lohmann, G.; Ionita, M. Interannual to multidecadal Euro-Atlantic blocking variability during winter and its relationship with extreme low temperatures in Europe. J. Geopys. Res. Atmos. 2014, 119, 13,621–13,636. [Google Scholar] [CrossRef]
  5. Wazneh, H.; Gachon, P.; Laprise, R.; de Vernal, A.; Tremblay, B. Atmospheric blocking events in the North Atlantic: Trends and links to climate anomalies and teleconnections. Clim. Dyn. 2021, 56, 2199–2221. [Google Scholar] [CrossRef]
  6. Saarni, F.; Muschitiella, F.; Weege, S.; Brauer, A.; Saarinen, T. A late Holocene record of solar-forced atmospheric blocking variability over Northern Europe inferred from varved lake sediments of Lake Kuninkaisenlampi. Quat. Sci. Rev. 2016, 154, 100–110. [Google Scholar] [CrossRef]
  7. Hu, H.M.; Shen, C.C.; Chiang, J.; Trouet, V.; Michel, V.; Tsai, H.C.; Valensi, P.; Spötl, C.; Starnini, E.; Zunino, M.; et al. Split westerlies over Europe in the early Little Ice Age. Nat. Commun. 2022, 13, 4898. [Google Scholar] [CrossRef] [PubMed]
  8. Lapointe, F.; Karmalkar, A.V.; Bradley, R.S.; Retelle, M.J.; Wang, F. Climate extremes in Svalbard over the last two millennia are linked to atmospheric blocking. Nat. Commun. 2024, 15, 4432. [Google Scholar] [CrossRef]
  9. Lohmann, R.; Purr, C.; Ahrens, B. Northern Hemisphere atmospheric blocking in CMIP6 climate projections using a hybrid index. J. Clim. 2024, 37, 6605–6617. [Google Scholar] [CrossRef]
  10. Karamperiodu, C. Extracting paleoweather from paleoclimate through a deep learning reconstruction of last millennium atmospheric blocking. Commun. Earth Environ. 2024, 5, 5535. [Google Scholar] [CrossRef]
  11. Lohmann, G.; Rimbu, N.; Dima, M. Where can the Arctic oscillation be reconstructed? Towards a reconstruction of climate modes based on stable teleconnections. Clim. Past. Discuss. 2005, 1, 17–56. [Google Scholar] [CrossRef]
  12. Ionita, M.; Lohmann, G.; Rimbu, N. Prediction of Spring Elbe Discharge Based on Stable Teleconnections with Winter Global Temperature and Precipitation. J. Clim. 2008, 21, 6215–6226. [Google Scholar] [CrossRef]
  13. Scherrer, S.; Croci-Maspoli, M.; Schwierz, C.; Appenzeller, A. Two-dimensional indices of atmospheric blocking and their statistical relationship with winter climate patterns in the Euro-Atlantic region. Int. J. Climatol. 2006, 26, 233–249. [Google Scholar] [CrossRef]
  14. Tibaldi, S.; Molteni, F. On the operational predictability of blocking. Tellus A 1990, 42, 343–365. [Google Scholar] [CrossRef]
  15. Davini, P.; Cagnazzo, C.; Gualdi, S.; Navarra, A. Bidimensional diagnostics, variability and trends of Northern Hemisphere blocking. J. Clim. 2012, 25, 6496–6509. [Google Scholar] [CrossRef]
  16. Gelaro, R.; McCarty, W.; Suárez, M.J.; Todling, R.; Molod, A.; Takacs, L.; Randles, C.A.; Darmenov, A.; Bosilovich, M.C.; Reichle, R.; et al. The Modern Eran Retrospective Analysis for Research and Applications, version 2 (MERRA-2). J. Clim. 2017, 30, 5419–5454. [Google Scholar] [CrossRef]
  17. Rustemeier, E.; Hänsel, S.; Finger, P.; Schneider, U.; Ziese, M. GPCC Climatology Version 2022 at 2.5°: Monthly Land-Surface Precipitation Climatology for Every Month and the Total Year from Rain-Gauges Built on GTS-Based and Historical Data. 2022. Available online: https://opendata.dwd.de/climate_environment/GPCC/html/gpcc_normals_v2022_doi_download.html (accessed on 15 October 2024).
  18. Vose, R.S.; Huang, B.; Yin, X.; Arndt, D.; Easterling, D.R.; Lawrimore, J.H.; Menne, M.J.; Sanchez-Lugo, A.; Zhang, H.M. Implementing Full Spatial Coverage in NOAA’s Global Temperature Analysis. Geophys. Res. Lett. 2021, 48, e2020GL090873. [Google Scholar] [CrossRef]
  19. Valler, V.; Franke, J.; Brugnara, Y.; Broenimann, S. An updated global atmospheric paleo-reanalysis covering the last 400 years. Geosci. Data J. 2022, 9, 89–107. [Google Scholar] [CrossRef]
  20. Tardiff, R.; Hakim, W.; Perkins, G.J.; Horlick, K.A.; Erb, M.P.; Emile-Geay, J.; Anderson, D.M.; Steig, E.J.; Noone, D. Last Millennium Reanalysis with an expanded proxy database and seasonal proxy modeling. Clim. Past. 2019, 15, 1251–1273. [Google Scholar] [CrossRef]
  21. Ortega, O.; Lehner, F.; Swingedouw, D.; Masson-Delmotte, V.; Raible, C.C.; Casado, M.; Yiou, P. A model-tested North Atlantic Oscillation reconstruction for the past millennium. Nature 2015, 523, 71–74. [Google Scholar] [CrossRef]
  22. Cook, E.R.; Kushnir, Y.; Smerdon, J.E.; Williams, A.P.; Anchukaitis, K.J.; Wahl, E.R. A Euro-Mediterranean tree-ring reconstruction of the winter NAO index since 910 CE. Clim. Dyn. 2019, 53, 1567–1580. [Google Scholar] [CrossRef]
  23. Luterbacher, J.; Xoplaki, E.; Dietrich, D.; Jones, P.D.; Portis, D.; Gonzales-Rouco, J.F.; von Storch, H.; Gyalistras, D.; Casty, C.; Wanner, H.; et al. Extending North Atlantic oscillation reconstructions back to 1500. Atmos. Sci. Lett. 2000, 2, 114–124. [Google Scholar] [CrossRef]
  24. Gomez-Navarro, J.J.; Werner, J.; Wagner, S.; Luterbacher, J.; Zorita, E. Establishing the skill of climate field reconstruction techniques for precipitation with pseudoproxy experiments. Clim. Dyn. 2015, 45, 1395–1413. [Google Scholar] [CrossRef]
  25. Zhang, Z.; Wagner, S.; Klockmann, M.; Zorita, E. Evaluation of statistical climate reconstruction methods based on pseudoproxy experiments using linear and machine-learning methods. Clim. Past. 2022, 18, 2643–2668. [Google Scholar] [CrossRef]
  26. von Storch, H.; Zwiers, F. Statistical Analysis in Climate Research; Cambridge University Press: Cambridge, UK, 1999. [Google Scholar]
  27. Kalnay, E.; Kanamitsu, M.; Kistler, R.; Collins, W.; Deaven, D.; Gandin, L.; Iredell, M.; Saha, S.; White, G.; Woolen, J. The NCEP/NCAR 40-Year Reanalysis Project. Bull. Am. Meteorol. Soc. 1996, 77, 437–471. Available online: https://journals.ametsoc.org/view/journals/bams/77/3/1520-0477_1996_077_0437_tnyrp_2_0_co_2.xml (accessed on 15 May 2024). [CrossRef]
  28. Slivinski, L.C.; Compo, G.P.; Whitaker, J.S.; Sardeshmukh, P.D.; Giese, B.S.; McColl, C.; Allan, R.; Yin, X.; Vose, R.; Titchner, H.; et al. Towards a more reliable historical reanalysis: Improvements for version 3 of the Twentieth Century Reanalysis system. Q. J. R. Meteorol. Soc. 2019, 145, 2876–2908. [Google Scholar] [CrossRef]
  29. Brönnimann, S. From climate to weather reconstructions. PLoS Clim. 2022, 1, e0000034. [Google Scholar] [CrossRef]
  30. Brönnimann, S.; Filipiak, J.; Chen, S.; Pfister, L. The weather of 1740, the coldest year in central Europe in 600 years. Clim. Past. 2024, 20, 2219–2235. [Google Scholar] [CrossRef]
  31. Ghershunov, A.; Schneider, N.; Barnett, T. Low-Frequency Modulation of the ENSO–Indian Monsoon Rainfall Relationship: Signal or Noise? J. Clim. 2001, 14, 2486–2492. [Google Scholar] [CrossRef]
  32. Sterl, A.; van Oldenborgh, G.J.; Hazeleger, W.; Burgers, G. On the robustness of ENSO teleconnections. Clim. Dyn. 2007, 29, 469–485. [Google Scholar] [CrossRef]
  33. Brönnimann, S.; Franke, J.; Valler, V.; Hand, R.; Samakinwa, E.; Lundstad, E.; Burgdorf, A.M.; Lipfert1, L.; Pfister, L.; Imfeld, N.; et al. Past hydroclimate extremes in Europe driven by Atlantic jet stream and recurrent weather patterns. Nat. Geosci. 2025, 18, 246–253. [Google Scholar] [CrossRef] [PubMed]
  34. Lupo, R.L. Atmospheric blocking events: A review. Ann. N. Y. Acad. Sci. 2021, 1504, 5–24. [Google Scholar] [CrossRef]
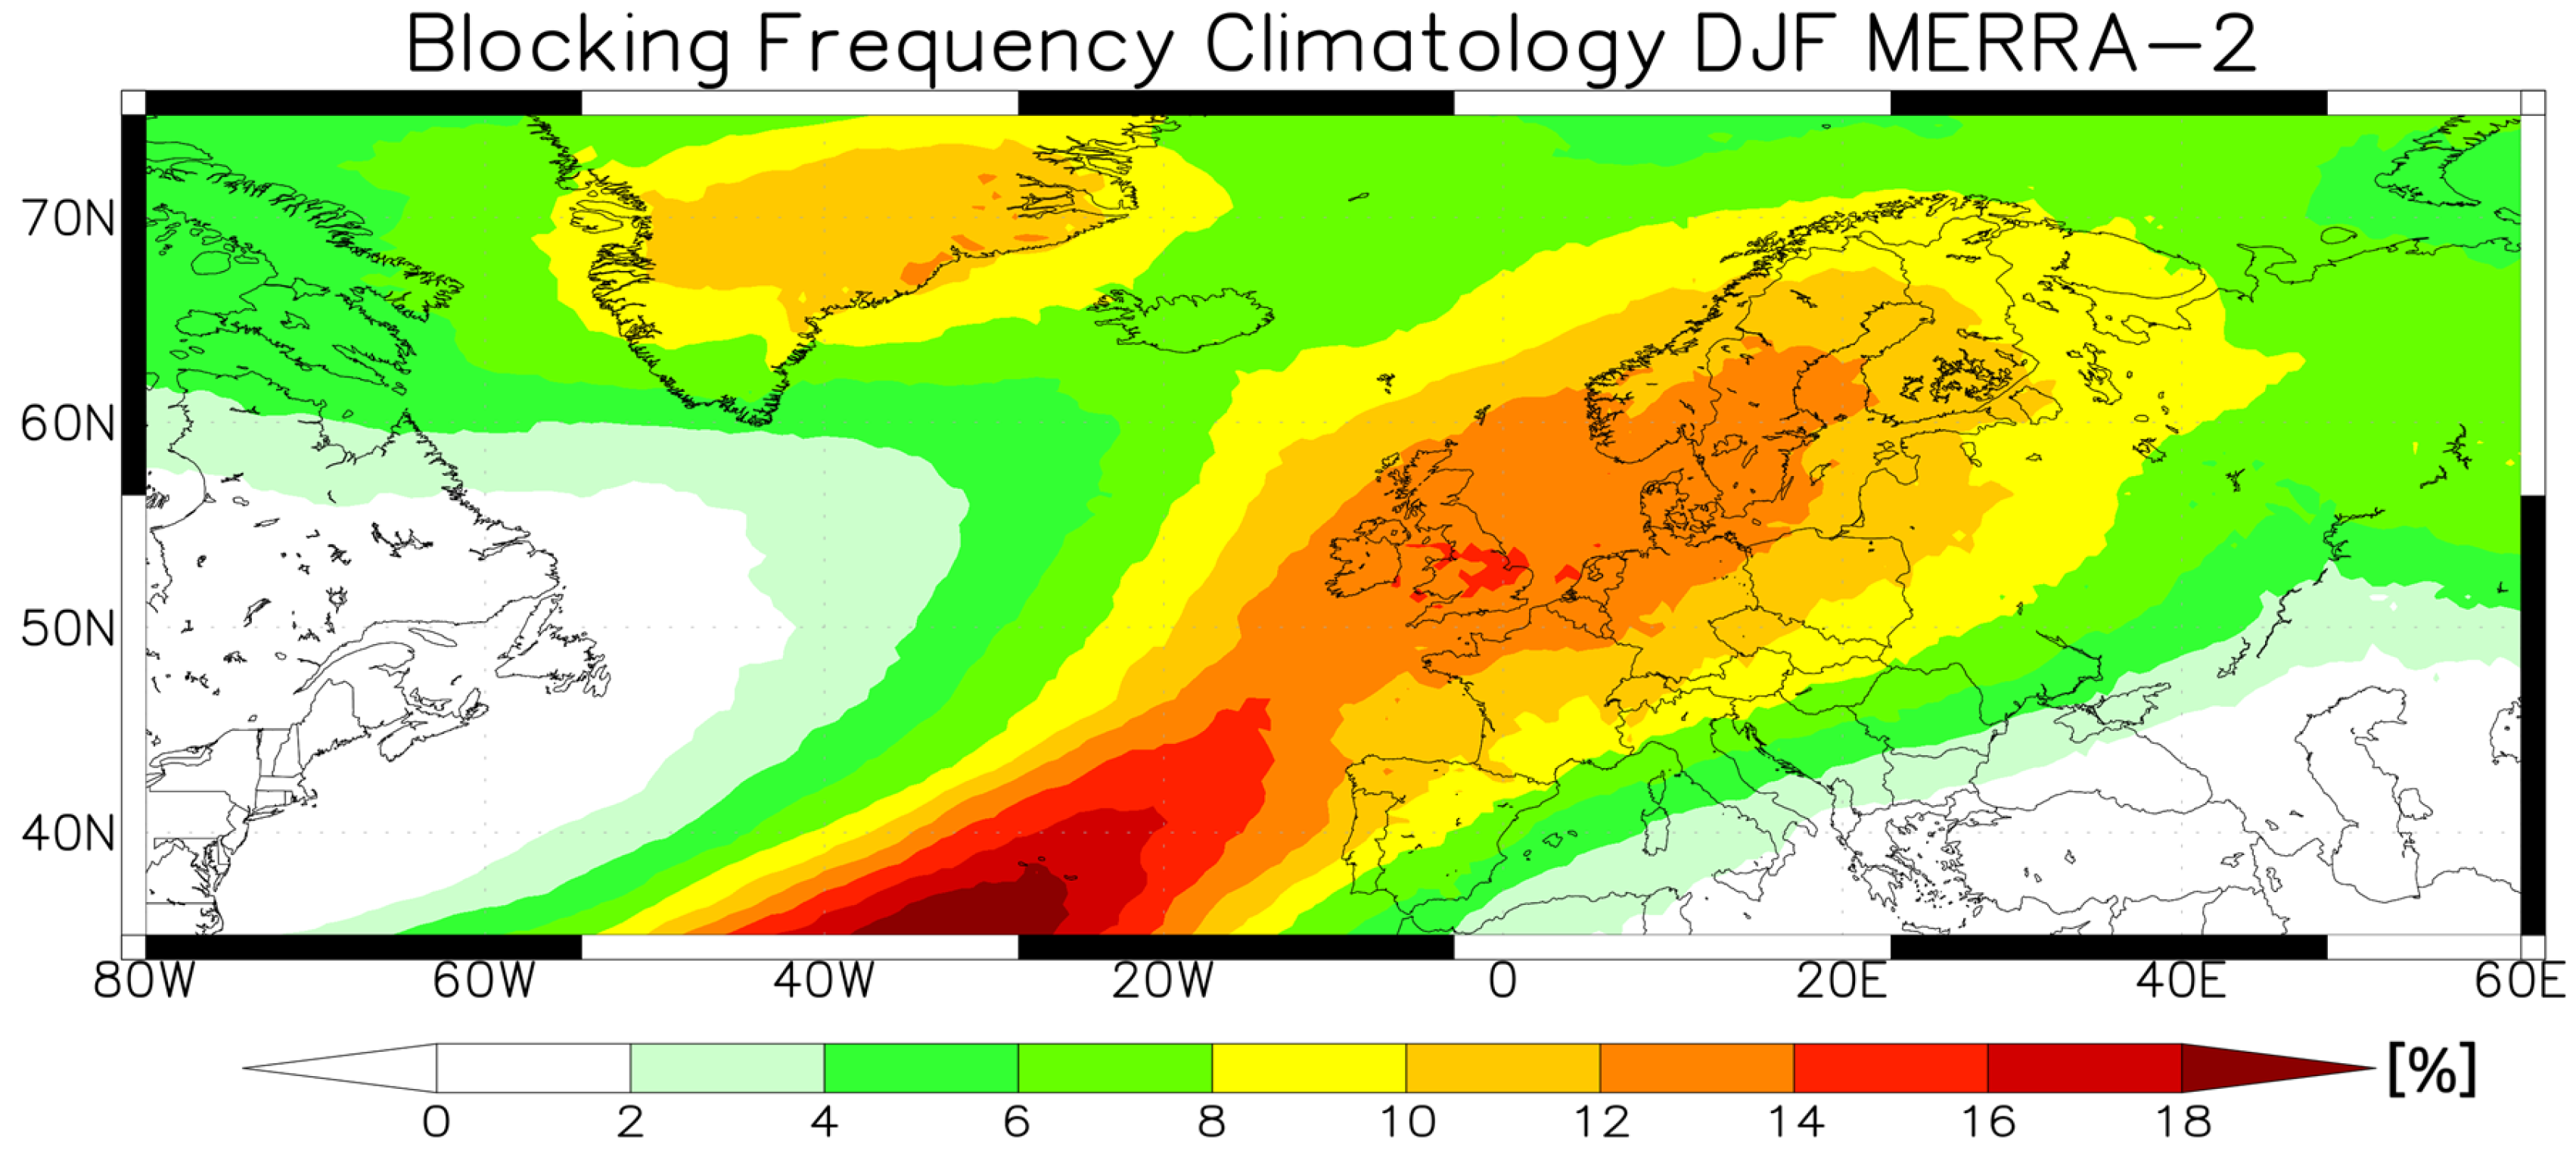
Figure 1. Blocking climatology of a 2D blocking index (see text for definition). Blocking index is calculated using MERRA-2 Z500 winter (DJF) daily data for 1980/81–2021/22 period. Units: percentage of blocked days to total number of winter days.
Atmosphere 16 00477 g001
Figure 2. First EOF of blocking index variability for the period 1980/81–2021/22.
Atmosphere 16 00477 g002
Figure 3. Running correlation (21-year moving window) of blocking PC1 with temperature from (60° N; 40° W), (60° N; 15° W) and (60° N, 60° E) grid-points. The correlation is stable for (60° N; 40° W) and (60° N, 60° E) grid-points and unstable for (60° N; 15° W).
Atmosphere 16 00477 g003
Figure 4. Stability correlation map of blocking PC1 with (a) temperature and (b) precipitation. Red (blue) represents cells (grid-points) where mean correlation is positive (negative) and stable.
Atmosphere 16 00477 g004
Figure 5. Blocking PC1 for the period 1980/81–2021/22 (red) and predicted PC1 for the period 1891/92–2021/22 (black).
Atmosphere 16 00477 g005
Figure 6. Correlation between observed (MERRA-2) and predicted blocking for the validation period, i.e., 1980/81–2021/22. The dots mark cells with significant correlations (90% confidence level).
Atmosphere 16 00477 g006
Figure 7. Correlation between blocking reconstruction and (a) observed (NCEP) during 1948/49–1979/80 and (b) observed (20CRv3) blocking frequency during 1891/92–1979/80 winters. The dots mark cells with significant correlations (90% confidence level).
Atmosphere 16 00477 g007
Figure 8. Correlation of blocking reconstruction with NAO for (a) 1659–2000, (b) 1602–2003 and (c) 1602–1969. The dots mark cells with significant correlations (90% confidence level).
Atmosphere 16 00477 g008
Figure 9. Blocking frequency reconstruction anomalies for several cold winters in Europe: (a) 1683/84, (b) 1708/09 and (c) 1739/40. Units: percentage of blocked days to total number of winter days.
Atmosphere 16 00477 g009
Disclaimer/Publisher’s Note: The statements, opinions and data contained in all publications are solely those of the individual author(s) and contributor(s) and not of MDPI and/or the editor(s). MDPI and/or the editor(s) disclaim responsibility for any injury to people or property resulting from any ideas, methods, instructions or products referred to in the content.