1. Introduction
The devastating loss of lives and property in western North Carolina caused by Tropical Cyclone Helene (2024) has brought renewed attention to the hazards associated with extreme weather events. Understanding historical hurricane damage is essential for effective risk assessment, hazard mitigation, and policymaking. While national studies, such as those by Pielke and Landsea [
1,
2], have found that more than 80% of U.S. hurricane-related damage is caused by major hurricanes (categories 3–5), these broad assessments may overlook significant regional variations. A detailed state-level analysis is necessary to better quantify risks, identify local trends, and improve preparedness efforts.
In recent decades, inland flooding caused by tropical cyclones affecting North Carolina has received growing attention [
3,
4]. For example, Hurricane Floyd (1999), one of the deadliest storms in North Carolina in the 20th century, resulted in 52 fatalities, with 50 deaths attributed to inland flooding. Similarly, while Hurricane Fran (1996) is often remembered for its destructive winds, it also claimed 19 lives, 11 of which were due to flooding [
5]. Since the 1970s, inland flooding has accounted for more fatalities in North Carolina than wind and storm surge combined [
6]. With the growing impact of flooding, this study examines tropical cyclone rainfall patterns and associated flooding in North Carolina, comparing the damage caused by inland flooding to that resulting from strong winds.
Accurately forecasting tropical cyclone rainfall remains a significant challenge due to the complexity of its driving mechanisms [
7,
8]. These mechanisms can be classified into four main categories [
9,
10]: (1) spiral rainbands surrounding the cyclone, (2) the central convective region, including the eyewall where the heaviest rainfall occurs, (3) interactions between the cyclone and mid-latitude weather systems, and (4) interactions with other tropical systems. Most rainfall is concentrated in the storm’s front quadrants. As a cyclone approaches land, frictional effects shift this distribution toward the left front quadrant, disrupting the storm’s warm-core structure and initiating its extratropical transition [
11]. Increased surface friction enhances low-level convergence and updrafts, leading to intensified rainfall [
12]. Palmen [
13] examined how pre-existing cyclonic vorticity and latent heat release contributed to the extratropical transition of Hurricane Hazel (1954). Klein et al. [
14] described this transition as a two-stage process: first, the transformation from a warm-core to a cold-core structure, followed by reintensification as an extratropical cyclone.
Several factors determine rainfall totals from landfalling tropical cyclones [
7,
15,
16], including (1) storm intensity and stage of development (surface wind speeds and warm- or cold-core structure), (2) forward movement (translation speed), (3) rate of ascent (low-level convergence), (4) topography, (5) moisture availability, (6) environmental temperature and lapse rates, and (7) interactions with mid-latitude systems (e.g., surface fronts and jet streaks). Predicting flooding is even more complex, as it depends on additional factors such as (1) total rainfall accumulation and duration, (2) the spatial extent of precipitation, (3) antecedent conditions, including river and reservoir levels and soil moisture, (4) topography, (5) land surface characteristics such as soil type and slope, and (6) human influences, including dams, levees, and urban infrastructure [
17,
18].
Rainfall and flooding forecasts are further complicated by uncertainties in hurricane track and intensity predictions, as well as challenges in precipitation measurement. Ayoade [
19] found that even moderate winds (23 knots) can reduce the accuracy of rain gauge measurements by up to 50% due to wind-driven turbulence. Radar-based precipitation estimates using the WSR-88D radar system also face limitations, particularly in tropical cyclone environments. Common issues include radar underestimation of rainfall, signal interference from widespread precipitation, and calibration errors [
20,
21,
22]. Cerveny and Newman [
23] analyzed satellite-derived precipitation records from oceanic tropical cyclones to understand rainfall distribution patterns. Wood and Frank [
24] attempted to model the rainfall distribution of Hurricane Floyd using the Penn State/NCAR Mesoscale Model (MM5), though their model’s accuracy was constrained by track forecast errors. Tang et al. [
4] attempted to hindcast the precipitation and inland flooding from Hurricane Floyd using a combination of a numerical weather prediction (NWP) model and hydrological model and achieved limited success.
The objectives of this study are to (1) refine normalization procedures for historical damage data, (2) classify storm damage in North Carolina into wind, flooding, and storm surge categories, (3) correlate meteorological variables with observed rainfall totals, and (4) quantify property risk associated with wind, rain, and storm surge based on historical records from 1925 to 2000. North Carolina presents a compelling case study due to its vulnerability to tropical cyclones, ranking third in the U.S. in direct hurricane landfalls after Florida and Texas. Its geographic position near the Gulf Stream and its rapidly expanding coastal developments, particularly in the Outer Banks, further heighten its exposure to storm impacts. Late 20th century hurricanes, such as Fran (1996) and Floyd (1999), caused over USD 12 billion in damage. Floyd’s catastrophic flooding was deemed the worst in state history, while Fran’s hurricane-force winds extended far inland. These events underscore the necessity of regionalized risk assessments to enhance preparedness and resilience.
2. Data and Methods
2.1. Definition of Terms
A tropical cyclone is defined as a cyclone originating over tropical oceans with water temperatures above 79 °F, including hurricanes, tropical storms, and tropical depressions [
25]. This study includes tropical cyclones that directly struck North Carolina, made landfall elsewhere but later impacted the state, or passed close enough to cause coastal damage between 1925 and 2000. Impacts considered are rainfall-induced flooding, high winds, embedded tornadoes, coastal storm surge, and beach erosion [
18]. While fatalities were noted, they were excluded from the damage assessment.
2.2. Tropical Cyclone Data
A comprehensive dataset comprising 82 tropical cyclones that have impacted North Carolina is presented in
Appendix A (
Table A1). The landfall date for each storm was determined using best-track data from the National Hurricane Center (NHC) [
26], identifying the moment when the storm’s center of circulation crossed into North Carolina. Storm intensity, including maximum sustained wind speeds and gusts, was also derived from the NHC best-track dataset. The geographic paths of these storms were mapped to distinguish direct landfalls in North Carolina from indirect impacts originating in other states or remaining offshore.
To assess the movement and impact of each storm, the average translation speed over North Carolina was calculated, as detailed in
Section 2.3. Rainfall data were based on the NOAA NCEP tropical cyclone rainfall database [
27]. Antecedent rainfall conditions were examined to evaluate pre-existing hydrological vulnerability. When precipitation levels preceding a tropical cyclone were minimal, corresponding climatological classifications—such as drought, dry, or normal—were recorded. Other key meteorological parameters, including maximum observed rainfall, wind speed, and storm surge height, are also included. The extent of coastal erosion [
28] was qualitatively classified from negligible to severe, and interactions between tropical cyclones and mid-latitude synoptic systems (e.g., upper-level troughs and surface fronts) were briefly noted. Furthermore, confirmed tornado occurrences and fatality statistics from FEMA reports [
29] and NWS Storm Data reports [
30] were systematically incorporated into the dataset.
This study analyzed data from tropical cyclones affecting North Carolina between 1925 and 2000, with storm tracks from the NOAA’s best-track hurricane database. Damage estimates prior to 1925 were excluded due to data unreliability. Final damage assessments were synthesized from multiple sources, including the FEMA [
29], NWS [
30], local newspaper archives [
31,
32,
33], and historical records [
34]. As pointed out by Gall et al. [
35], loss estimates from various sources are crude estimates. In instances where data discrepancies arose, priority was given to governmental sources and the higher damage estimates to ensure a more comprehensive assessment.
2.3. Damage Assessment
Between 1925 and 2000, a total of 82 tropical cyclones affected North Carolina, averaging approximately 1.1 storms per year. Among these, 36 storms made direct landfall in the state, while 12 remained offshore. Additionally, 16 storms initially made landfall along the Gulf Coast before tracking into North Carolina, and 18 made landfall along the East Coast—primarily in South Carolina—before moving inland.
Of the 36 cyclones that made direct landfall in North Carolina, 25 were classified as hurricanes, including 11 major hurricanes, while the remaining storms consisted of 9 tropical storms and 2 tropical depressions. Within the broader dataset, the total breakdown included 37 hurricanes, 29 tropical storms, and 16 tropical depressions.
Tropical cyclone activity demonstrated variability over the studied period. Years with heightened activity, defined as those experiencing more than two storms, occurred in 1944, 1954, 1955, 1964, 1985, 1995, 1996, and 1999. Conversely, quieter periods, characterized by fewer than two storms annually, were observed from 1929 to 1932, 1934 to 1943, 1977 to 1983, and 1986 to 1993 (
Figure 1).
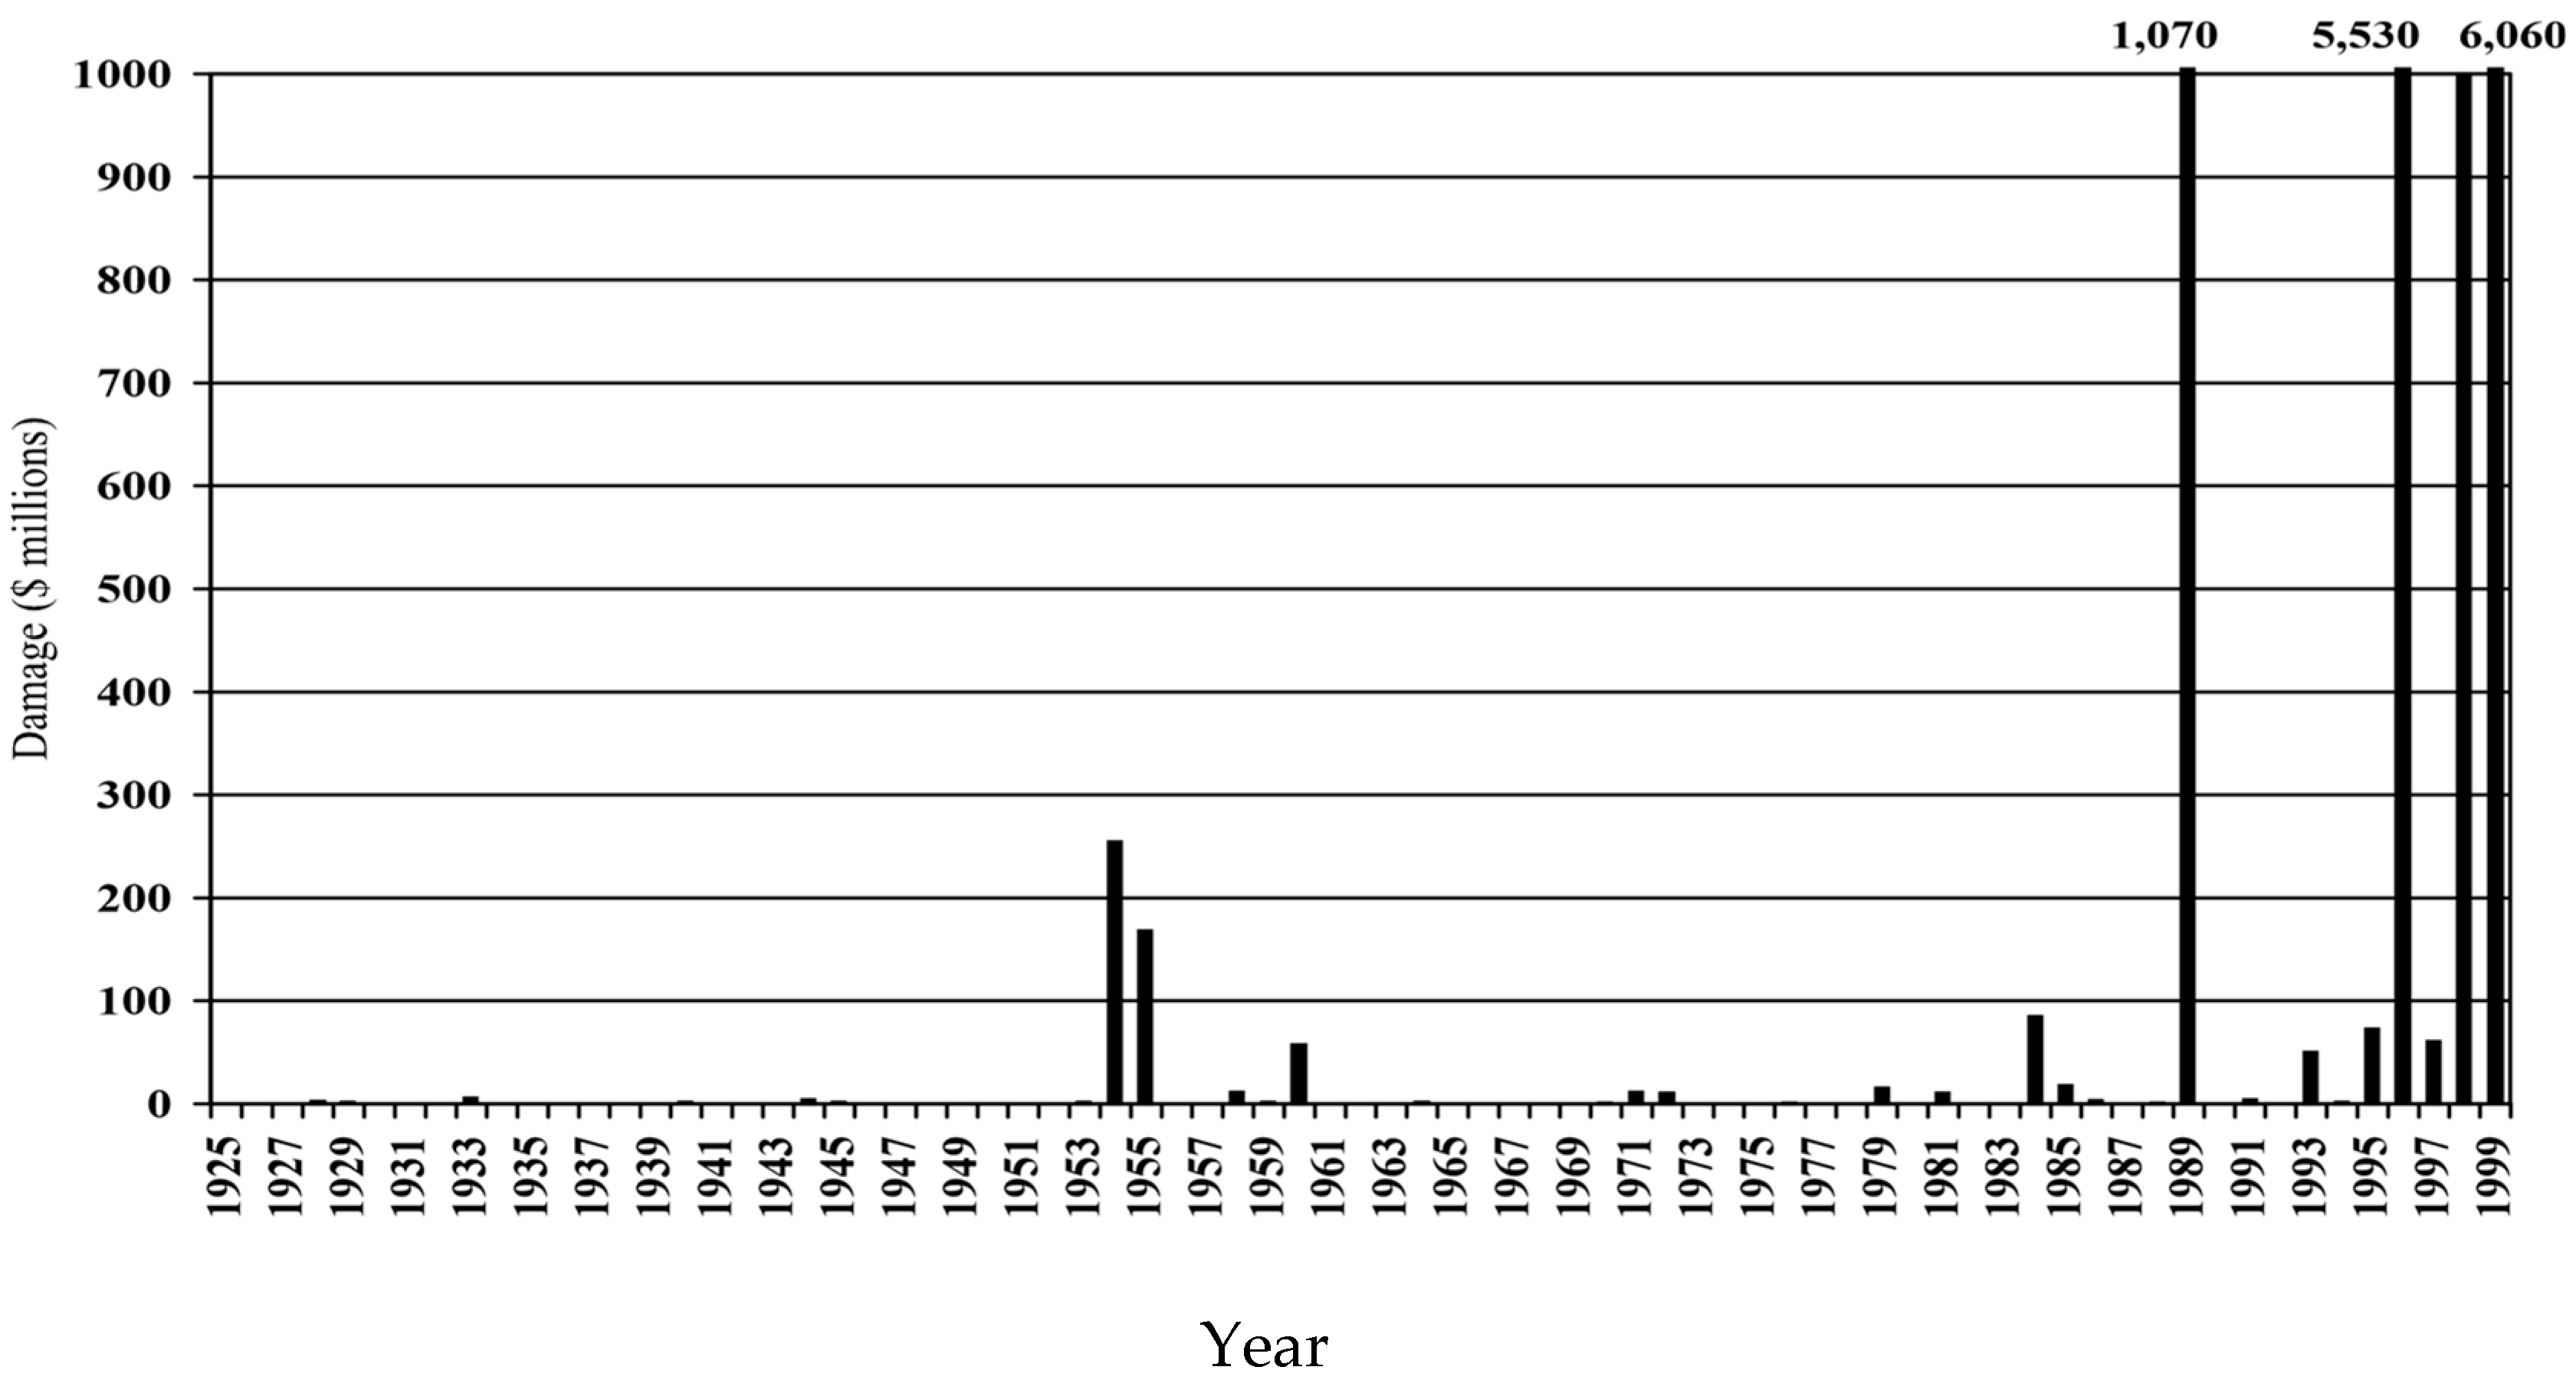
Unadjusted damage totals, influenced by inflation, economic growth, and development, are insufficient for analyzing long-term trends. Since 1989, four hurricanes have caused over USD 1 billion in damage, compared to a maximum annual loss of USD 255 million (1954, Hurricane Hazel) before 1989 (
Figure 2). Damage trends since 1996 appear unprecedented but require normalization to account for inflation, land-use, wealth, and population changes.
2.4. Normalization Methodology
Past studies normalized damage using inflation, population growth, and wealth changes [
2]. This study proposes replacing population growth with housing growth as a more accurate factor for property damage. From 1940 to 2000, North Carolina’s coastal population increased by 370%, while housing totals rose by 780%, reflecting the area’s reliance on tourism and vacation properties not captured in population statistics. Using housing data often doubles damage estimates compared to population-based methods.
Inflation adjustments utilized the Consumer Price Index (CPI), and wealth changes were measured using “fixed reproducible tangible wealth” from the Bureau of Economic Analysis [
36]. Normalized damage values using the housing factor might differ significantly from the population-based approach, particularly for storms from 1940 to 1960 (see data table in
Table A1 and
Table A2). For instance, in 1955, housing normalization values (2.96) exceeded population values (2.2).
Although the normalization procedure used in this study is simplified, it provides a fair comparison of tropical cyclones from 1925 to 2000. The formula for normalized damage is as follows:
where
NL2000 = normalized loss to 2000 values for all counties affected by the storm (including inland counties).
Ly = unadjusted storm damage.
Iy = inflation factor, based on the 2000 Consumer Price Index (CPI).
Wy = wealth factor, based on 2000 fixed reproducible tangible wealth, expressed per capita (state).
Hy, c = housing factor, reflecting the change in the number of houses from year y to 2000 in affected counties.
For example, applying this formula to Hurricane Hazel (1954) gives the following:
L1954 = 254 million (coastal damage: USD 72 M, inland: USD 182 M)
I1954 = 5.86,
W1954 = 1.96,
H1954 = 3.4 for coastal damage (3.03 for inland).
The normalized total damage for Hurricane Hazel is NL2000 = 10.52 billion.
3. Normalization Results
3.1. Normalized Damage Trends
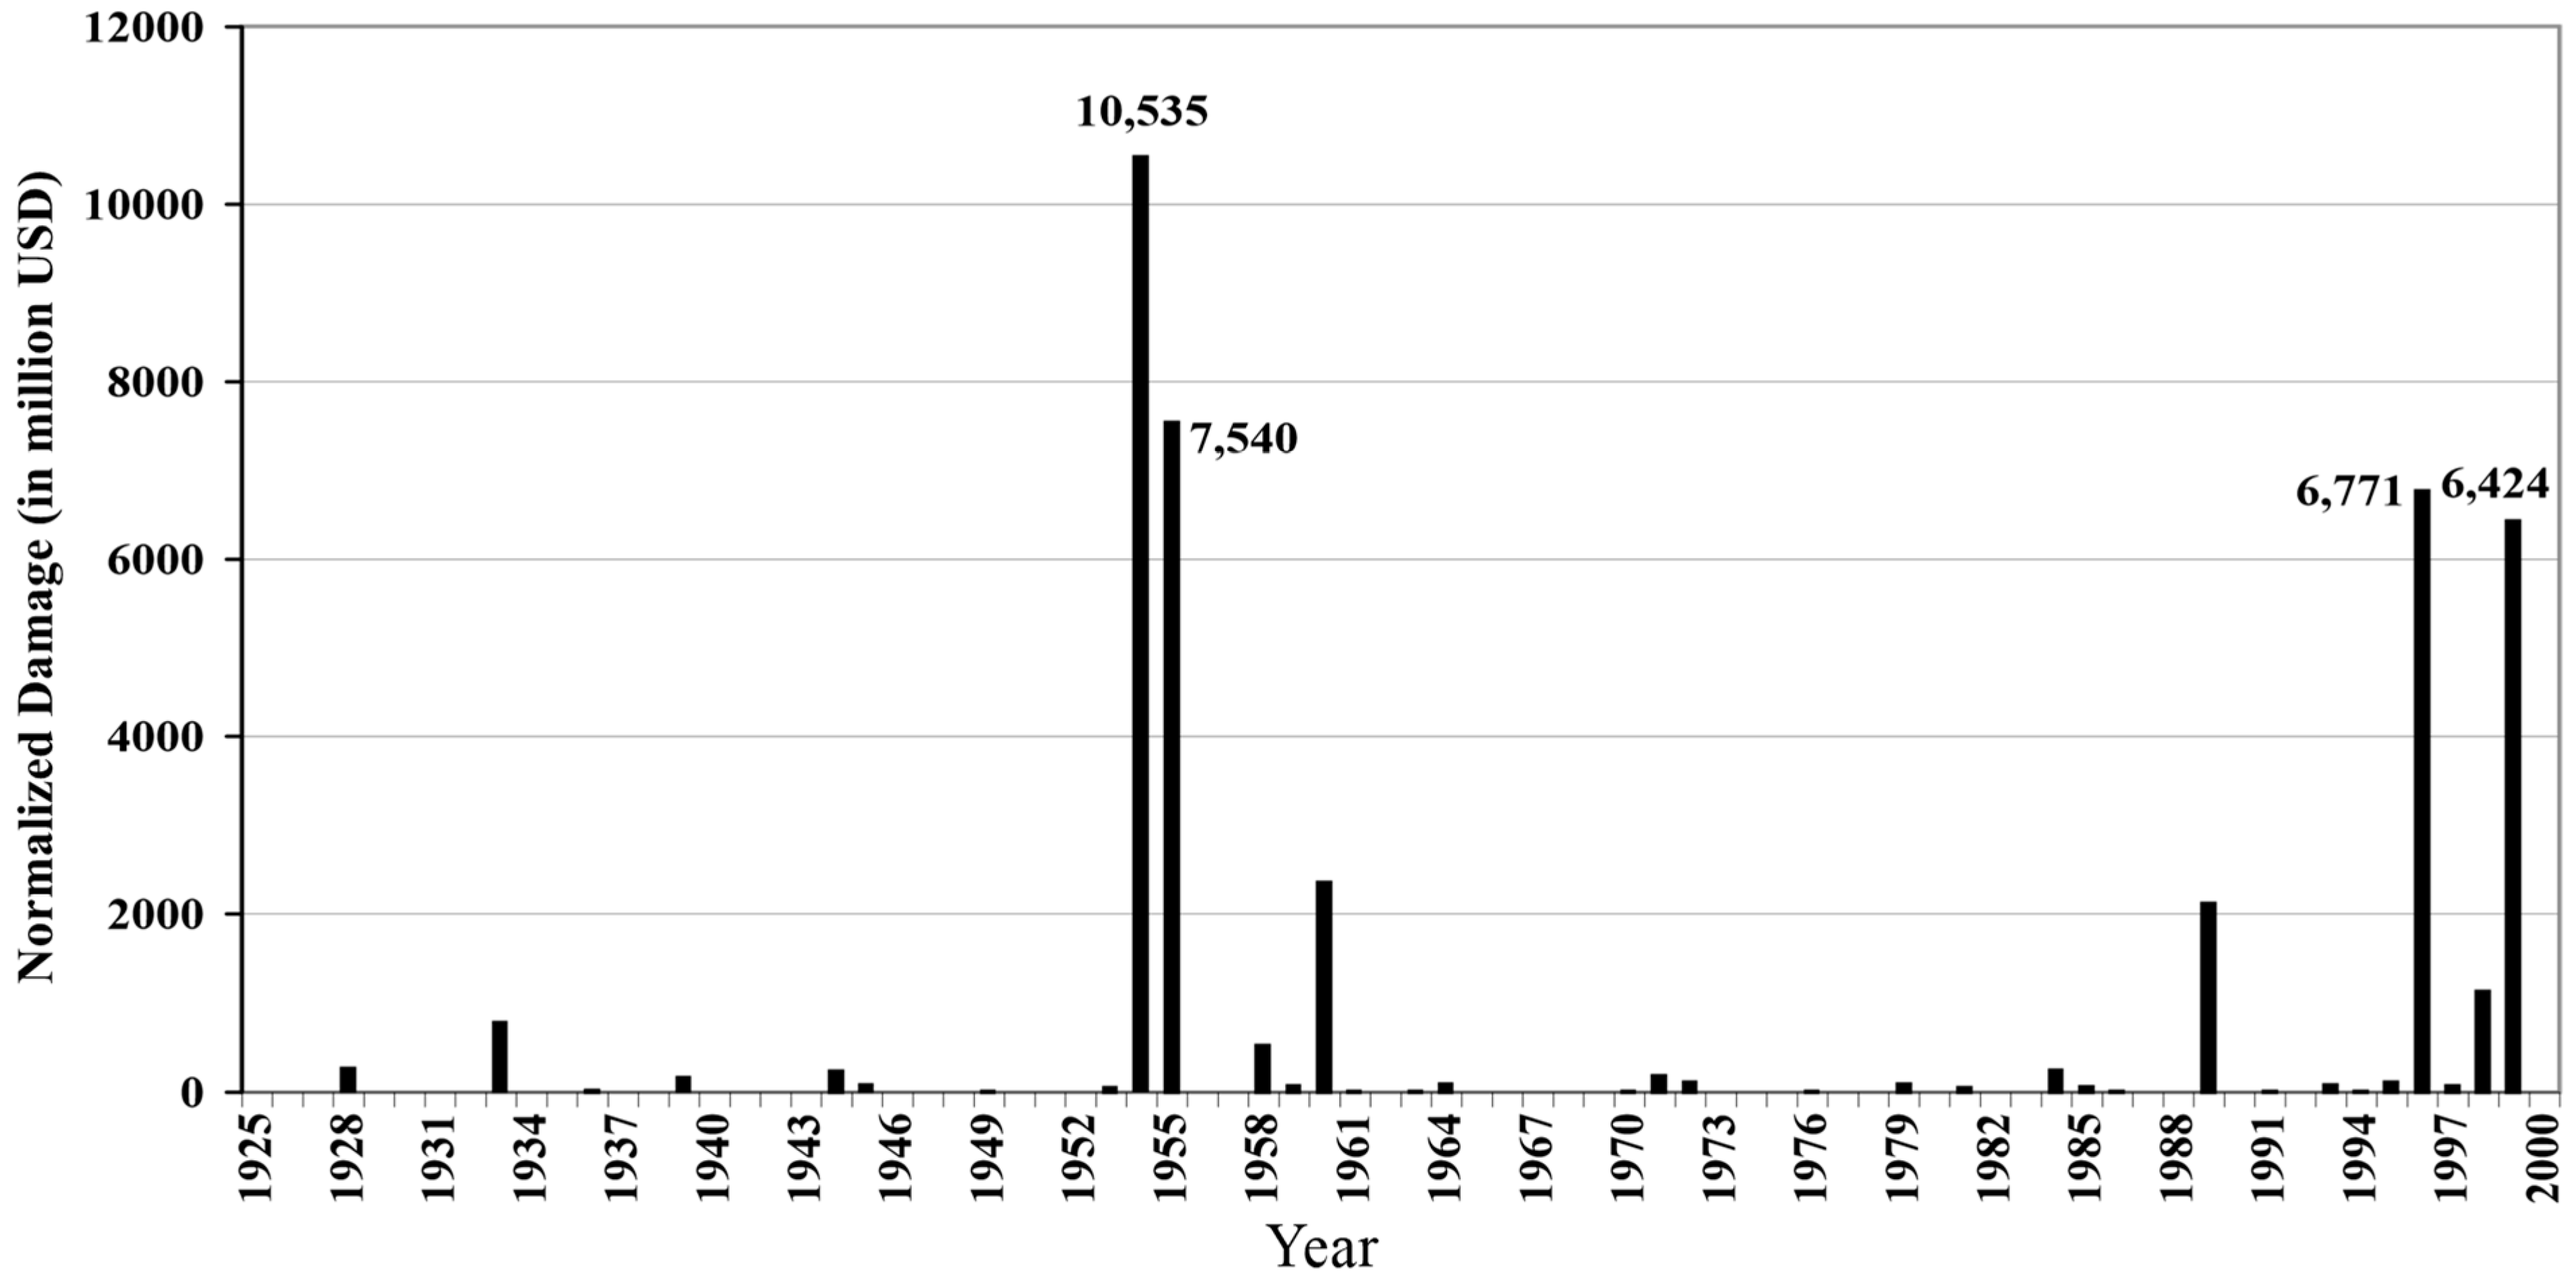
Figure 3 presents the time series of normalized annual damage, which reveals a different trend than the unadjusted totals shown in
Figure 2. While the 1990s saw over USD 13 billion in damage, the active hurricane period of the 1950s would have resulted in more than USD 18 billion in damage had those storms occurred in 2000. Between these active periods (1950s and 1990s), there was relative calm, with only four storms causing significant damage: Hurricanes Helene (1958), Donna (1960), Diana (1984), and Hugo (1989). The period from 1956 to 1995 saw only four storms with damage exceeding USD 200 million.
A key factor influencing this period was the rise in coastal construction and population growth during the 1960s to early 1990s. The North Carolina tropical cyclones included in this study are listed in
Table A1, with details on landfall, intensity, and both unadjusted and normalized damage.
3.2. Comparison of Housing vs. Population Factors
Figure 4 compares the normalized damage totals using housing and population factors. The divergence between the two factors is more significant in earlier years, particularly before 1961, reflecting the greater impact of coastal construction during the 1960s and 1970s. More recent cyclones show less divergence between the two factors, indicating that trends in housing and population growth have become more aligned in recent decades.
3.3. Interpretation of Damage Data
Pielke and Landsea [
2] found that over 83% of tropical cyclone damage in the United States was caused by major hurricanes (Saffir–Simpson categories 3, 4, and 5) [
37]. However, this percentage varies regionally.
Table 1 presents the mean and total damage for each tropical cyclone category in North Carolina, normalized to year 2000 values using the housing factor.
Table 2 shows the same data but based on the population factor. The storms are categorized by intensity at landfall, ranging from tropical depression to category-5 hurricane, with the number of storms per category indicated in parentheses.
In North Carolina, major hurricanes account for only 70% of the total damage, a lower percentage than the national average. Category-3 hurricanes contribute 41.7% of the total damage, and category-2 hurricanes add 21.4%. A significant portion of the damage is due to flooding from weaker storms, especially Tropical Storm Floyd in 1999. Although the dataset is small (36 storms), this highlights that North Carolina faces substantial damage risks from category-2 hurricanes, which can cause both wind and flooding damage. While major hurricanes cause the greatest damage per storm, category-2 storms, due to their flooding potential, should not be underestimated.
Damage studies often focus on individual storms and their unique impacts.
Table 3 compares the damage from Hurricane Andrew in South Florida and Hurricane Floyd in eastern North Carolina. These storms, while both causing record unadjusted damage, differed in their impact mechanisms—high winds versus extreme flooding. In South Florida, Andrew’s destruction to businesses, particularly in Dade County, amounted to nearly USD 6 billion (23% of total losses), but its localized nature meant agricultural losses were minimal (4%). In contrast, 17% of Floyd’s damage in North Carolina was to agriculture, primarily due to flooding that affected animal farms and crops. Understanding the mechanisms behind storm damage—such as wind and flooding—provides better risk assessment insights for future events.
3.4. Separation of Damages
The separation of tropical cyclone damage into wind, flooding, and storm surge categories presents a challenge due to the inherent interdependence between these elements. Wind damage includes the effects from central circulation, squall lines, and tornadoes associated with the cyclone, while flooding is influenced by pre-existing conditions, such as rainfall and terrain vulnerability, and includes freshwater flooding not related to storm surge. Storm surge damage results from wave action and includes coastal erosion and related replenishment costs. However, damage totals are difficult to separate due to the overlapping effects of these categories. For instance, storm surge can weaken a house’s foundation, allowing winds to penetrate the structure, which in turn makes the house more susceptible to water damage from rain.
In analyzing the impact of North Carolina tropical cyclones from 1925 to 2000, damage totals were divided into wind, flooding, and storm surge, and percentages were assigned to each category. These percentages were rounded to the nearest multiple of five to account for the subjective nature of the methodology, as accurately quantifying the damages from each category often proved challenging. The aim of this classification was not to obtain precise figures but rather to observe broader trends in the impact of tropical cyclones.
The separation of damages was based on three main sources of information: published damage statistics (such as those from NCDC Storm Data [
30]), specific reports on individual cyclones, and meteorological data (including wind gusts, storm surge heights, and rainfall totals). These data helped estimate the percentage of damage caused by each category for each cyclone (
Table A2).
Several examples of tropical cyclones in North Carolina illustrate the challenges in damage separation. For instance, Hurricane Floyd (1999) caused significant flooding, estimated at 90% of the total damage, with a smaller percentage attributed to wind and storm surge. In contrast, Hurricane Bonnie (1998) caused 70% of its damage from wind, 20% from flooding, and 10% from storm surge. This variability in the impact of different cyclone types underscores the difficulty in accurately separating damage into categories.
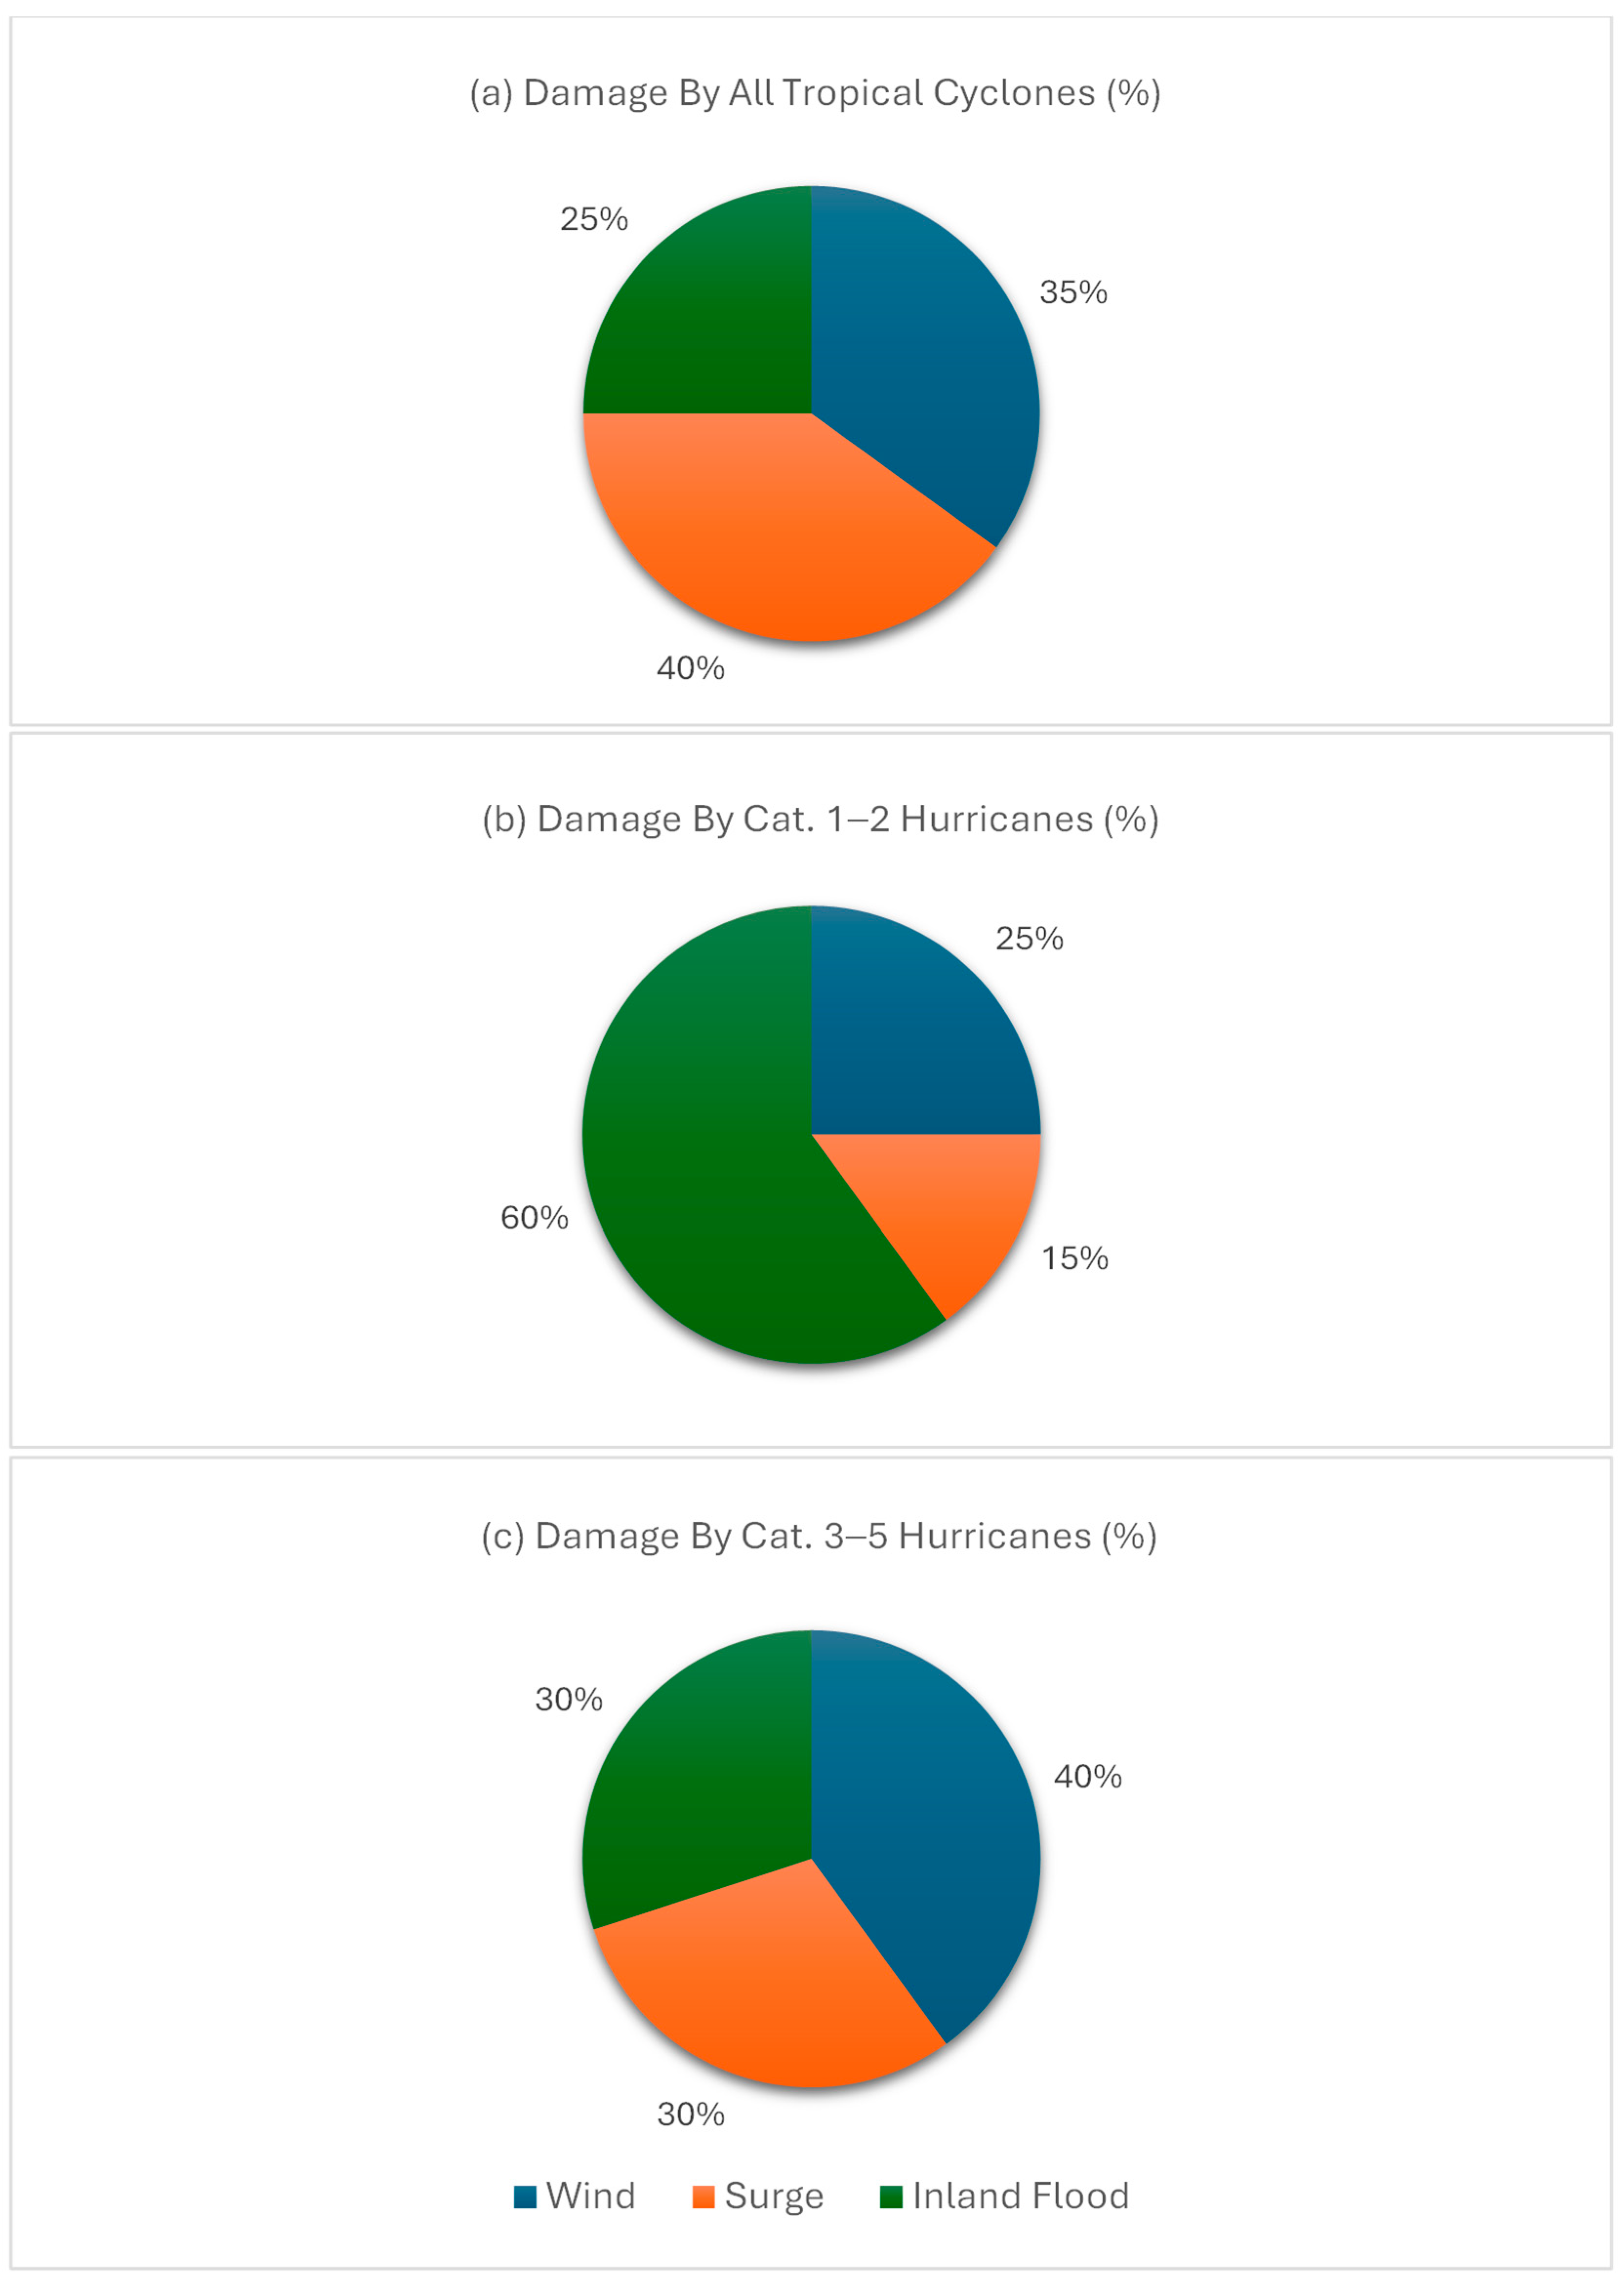
To gain a clearer understanding of the overall trends in tropical cyclone damage in North Carolina, a damage assessment was conducted using normalized data. For all cyclones between 1925 and 2000, flooding was responsible for 40% of the total damage, with wind and storm surge accounting for 35% and 25%, respectively. This pattern shifted when only weaker cyclones (category-1 and -2 hurricanes, along with tropical storms and depressions) were considered, with flooding responsible for 60% of the total damage, while wind and storm surge contributed 25% and 15%, respectively.
For more intense cyclones, such as major hurricanes, wind damage increased in significance, accounting for 40% of the total damage, with flooding and storm surge both contributing 30%. These findings illustrate that, although flooding is a major contributor to tropical cyclone damage in North Carolina, the intensity of the storm plays a crucial role in the distribution of damage among wind, flooding, and storm surge.
Despite the inherent uncertainties in separating the damages, this study provides valuable insight into the overall patterns of destruction caused by tropical cyclones in North Carolina. The percentages offer a general understanding of how different storm elements contribute to damage, though the accuracy of the specific figures should be considered with caution due to the uncertainty in damage assessment methods.
4. Flooding Assessment
4.1. Rainfall Analysis
Rainfall totals for North Carolina tropical cyclones between 1925 and 2000 were calculated for 38 weather stations across the eastern and central parts of the state. Data consisted of 24 h rainfall totals, estimated based on the storm’s arrival and departure times. Some rainfall contributions from other weather systems were challenging to isolate. Weather stations were selected based on geographical coverage and data availability, with those lacking more than 20 years of data excluded. Historical rainfall data prior to 1925 were also incorporated where reliable.
4.2. Results
4.2.1. Relationship Between Intensity and Rainfall
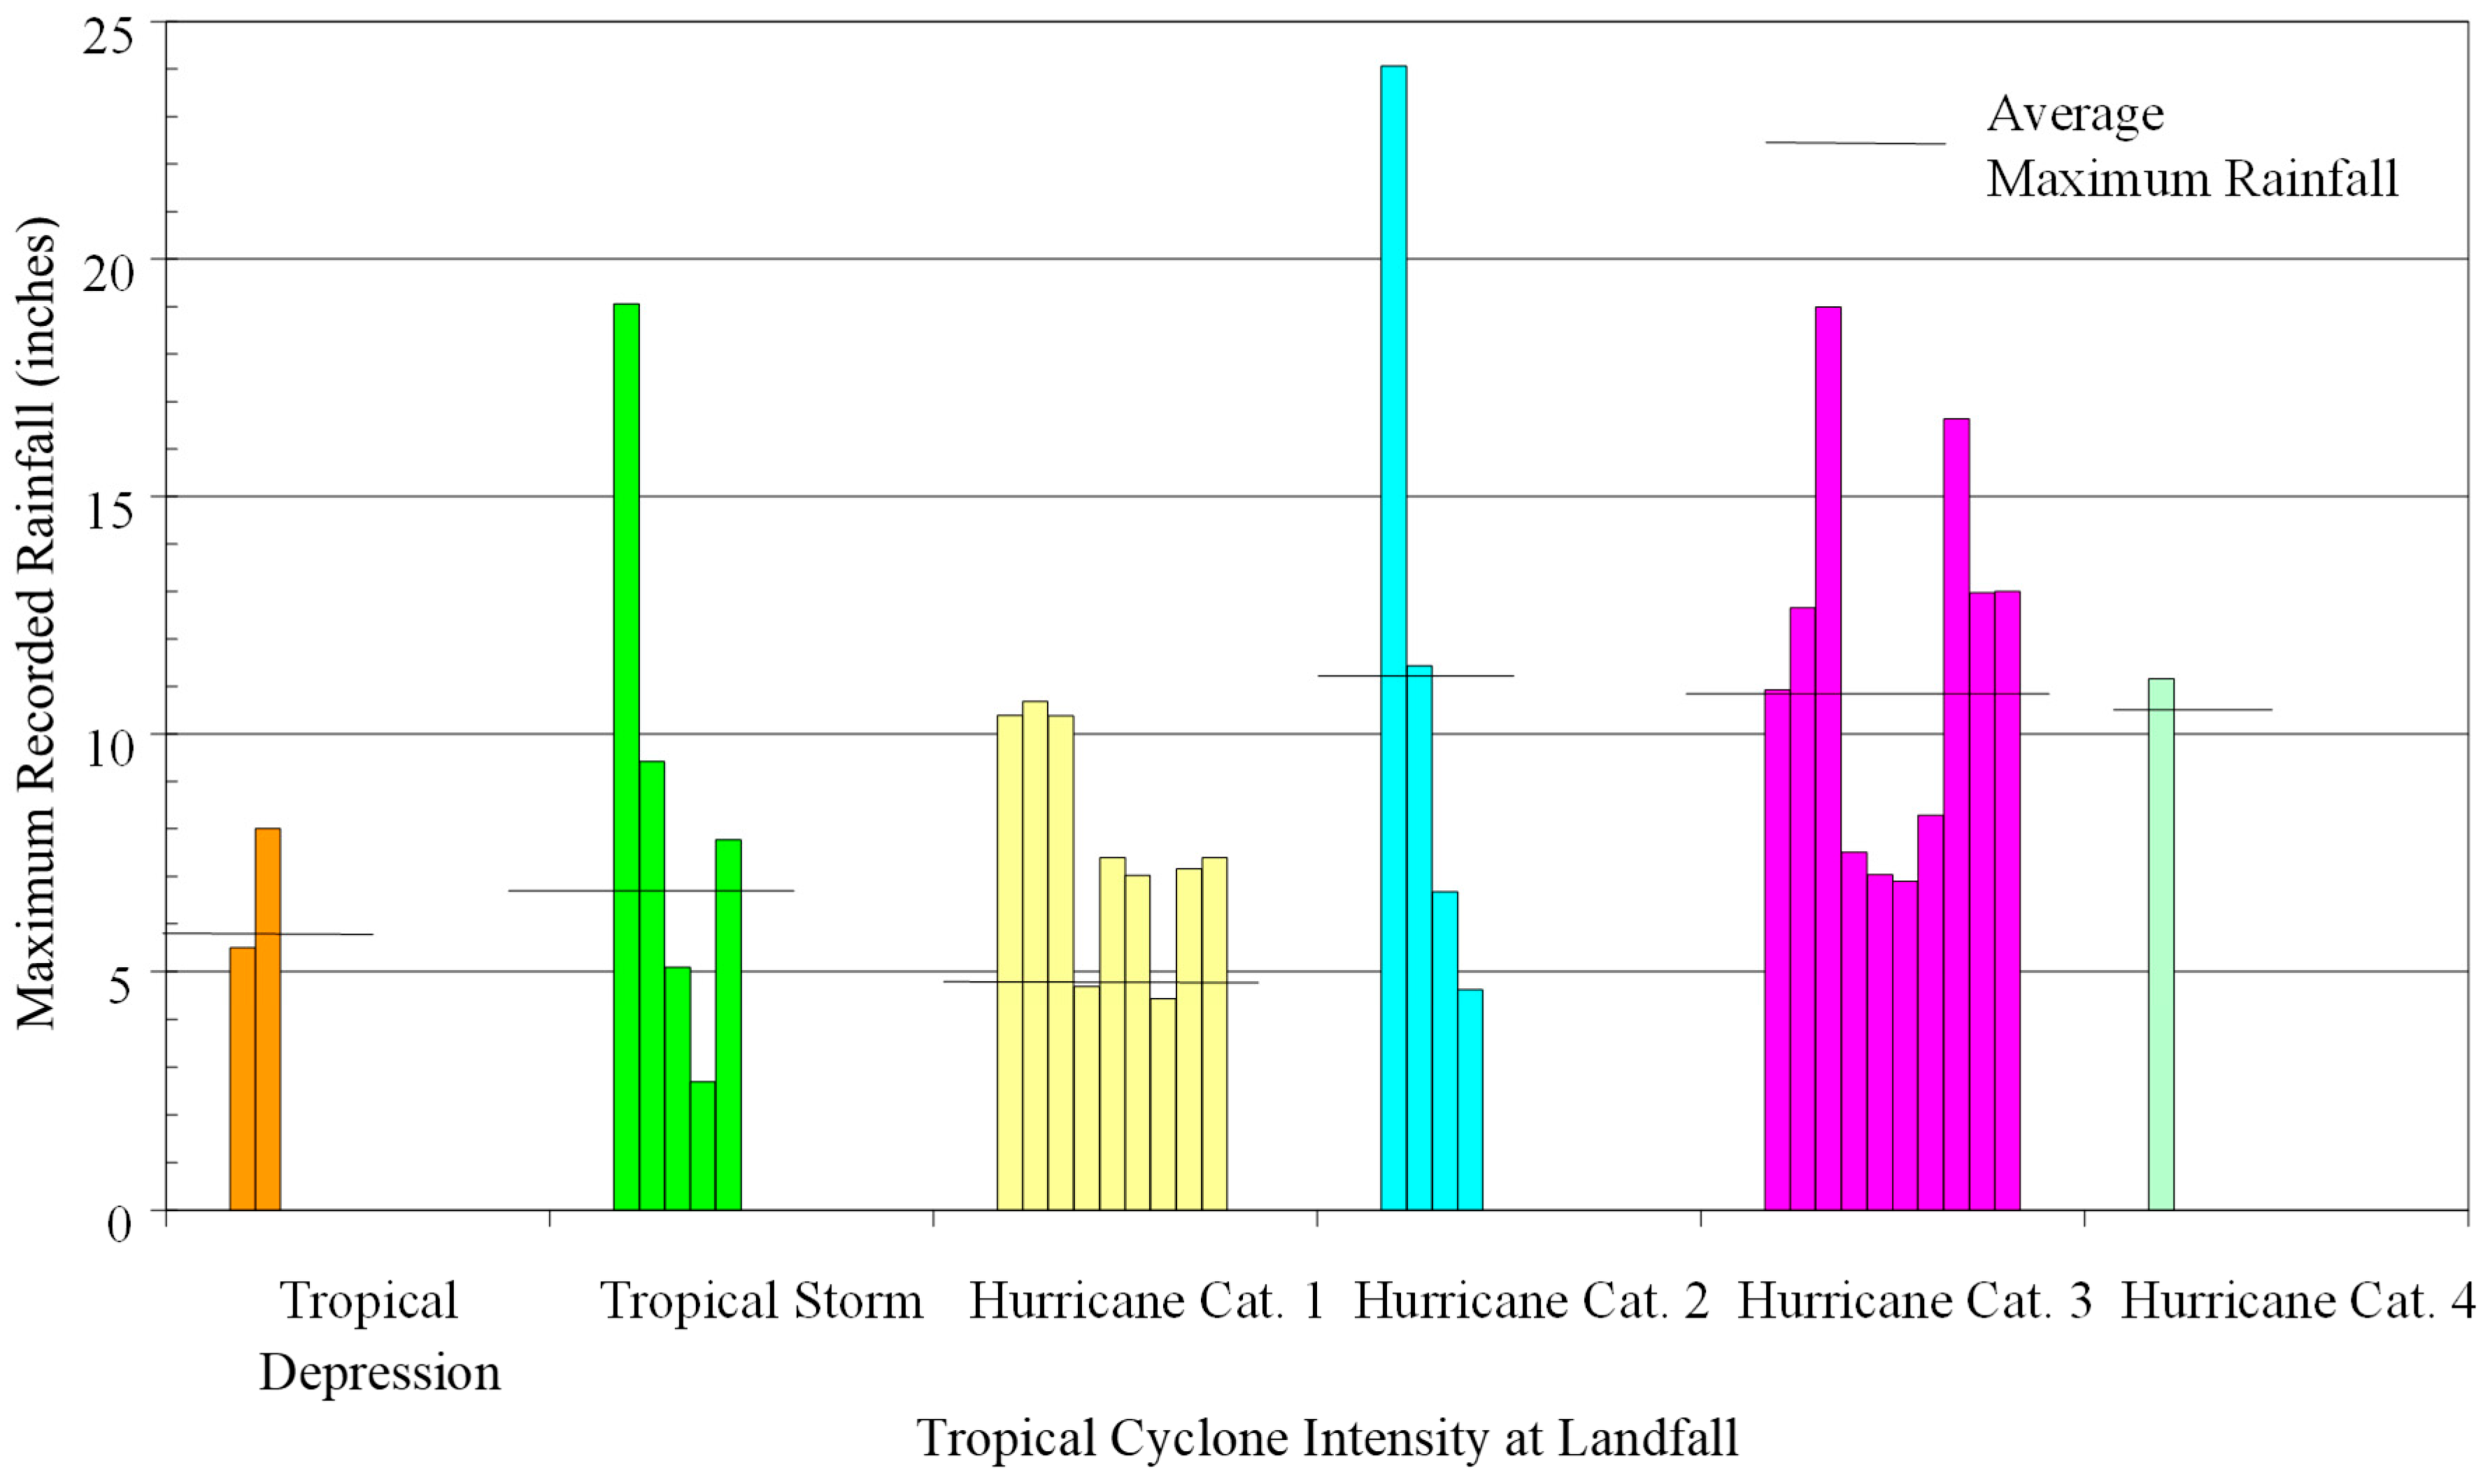
Thirty-one tropical cyclones that directly made landfall in North Carolina from 1925 to 2000 were included in this study. These storms were categorized by intensity, and the corresponding maximum rainfall for each storm was recorded. The analysis revealed a weak correlation between cyclone intensity and rainfall totals in North Carolina (
Figure 5). For example, Tropical Storm Dennis (1999) produced over 19 inches of rain along the Outer Banks, whereas Hurricane Floyd (1999) set a record with two feet of rain in Southport. More intense hurricanes (category 3 and 4) generally produced more than 7 inches of rain, but weaker storms could also generate extreme rainfall.
4.2.2. Maximum Rainfall Distribution
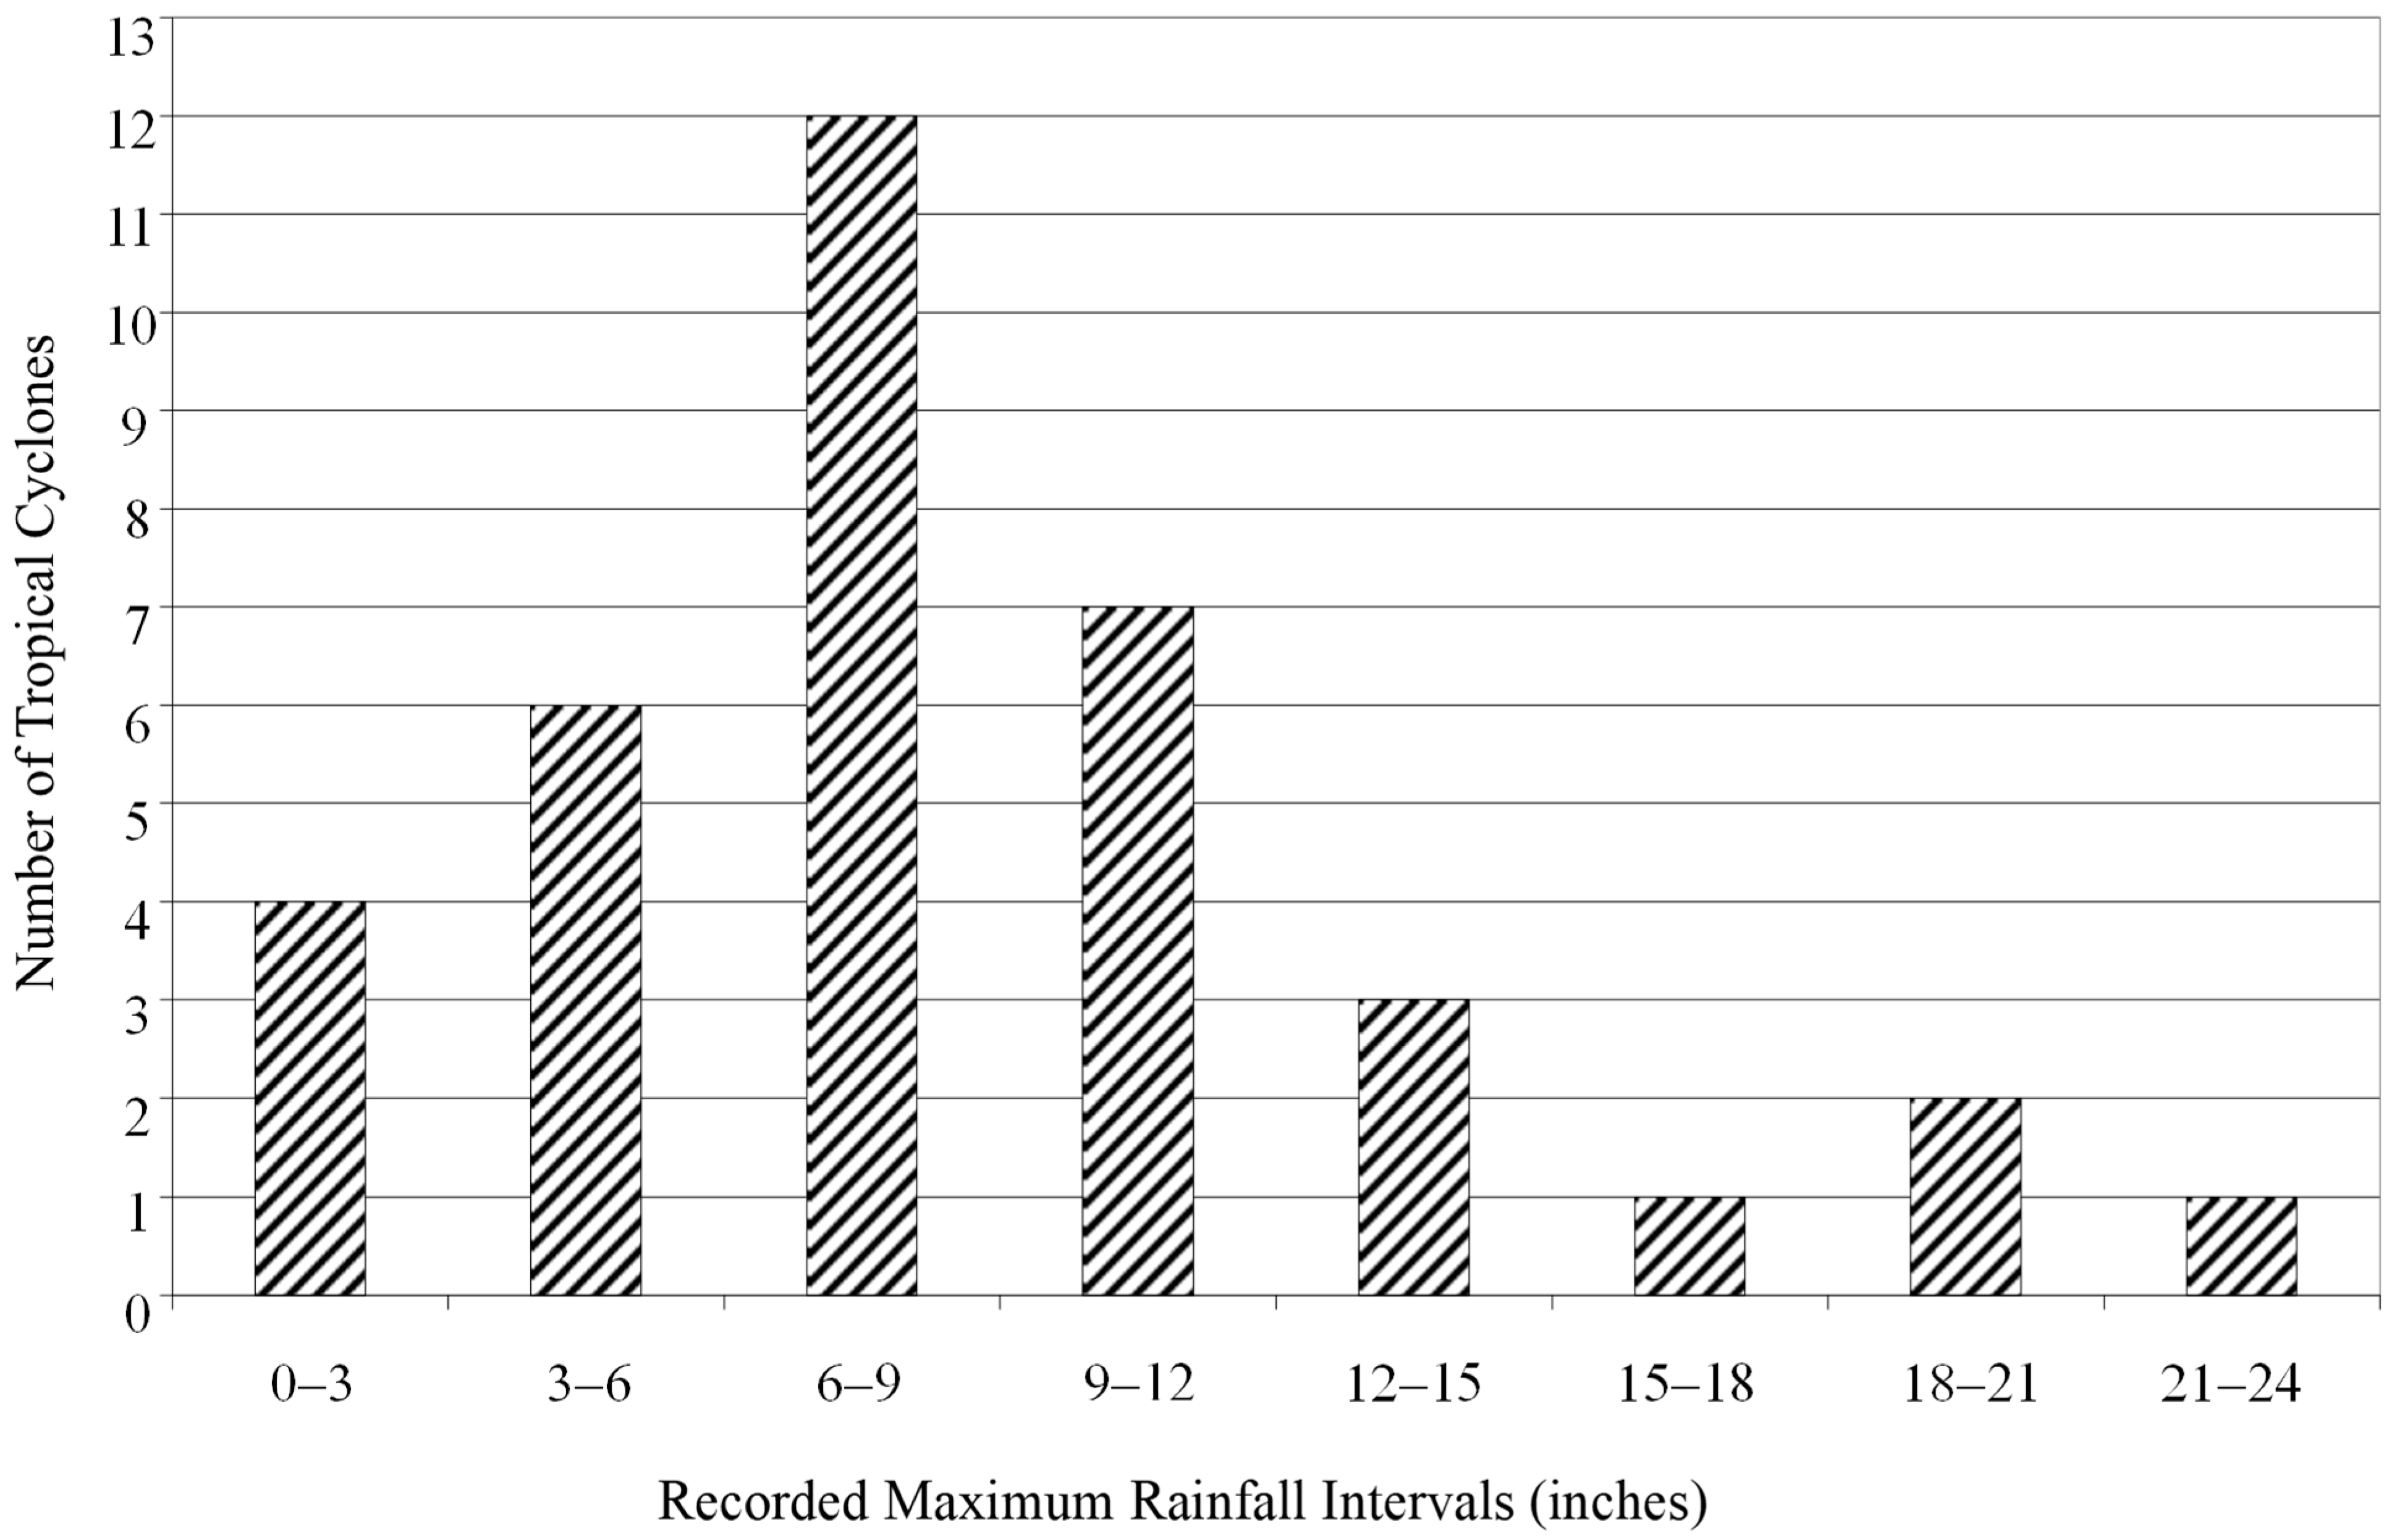
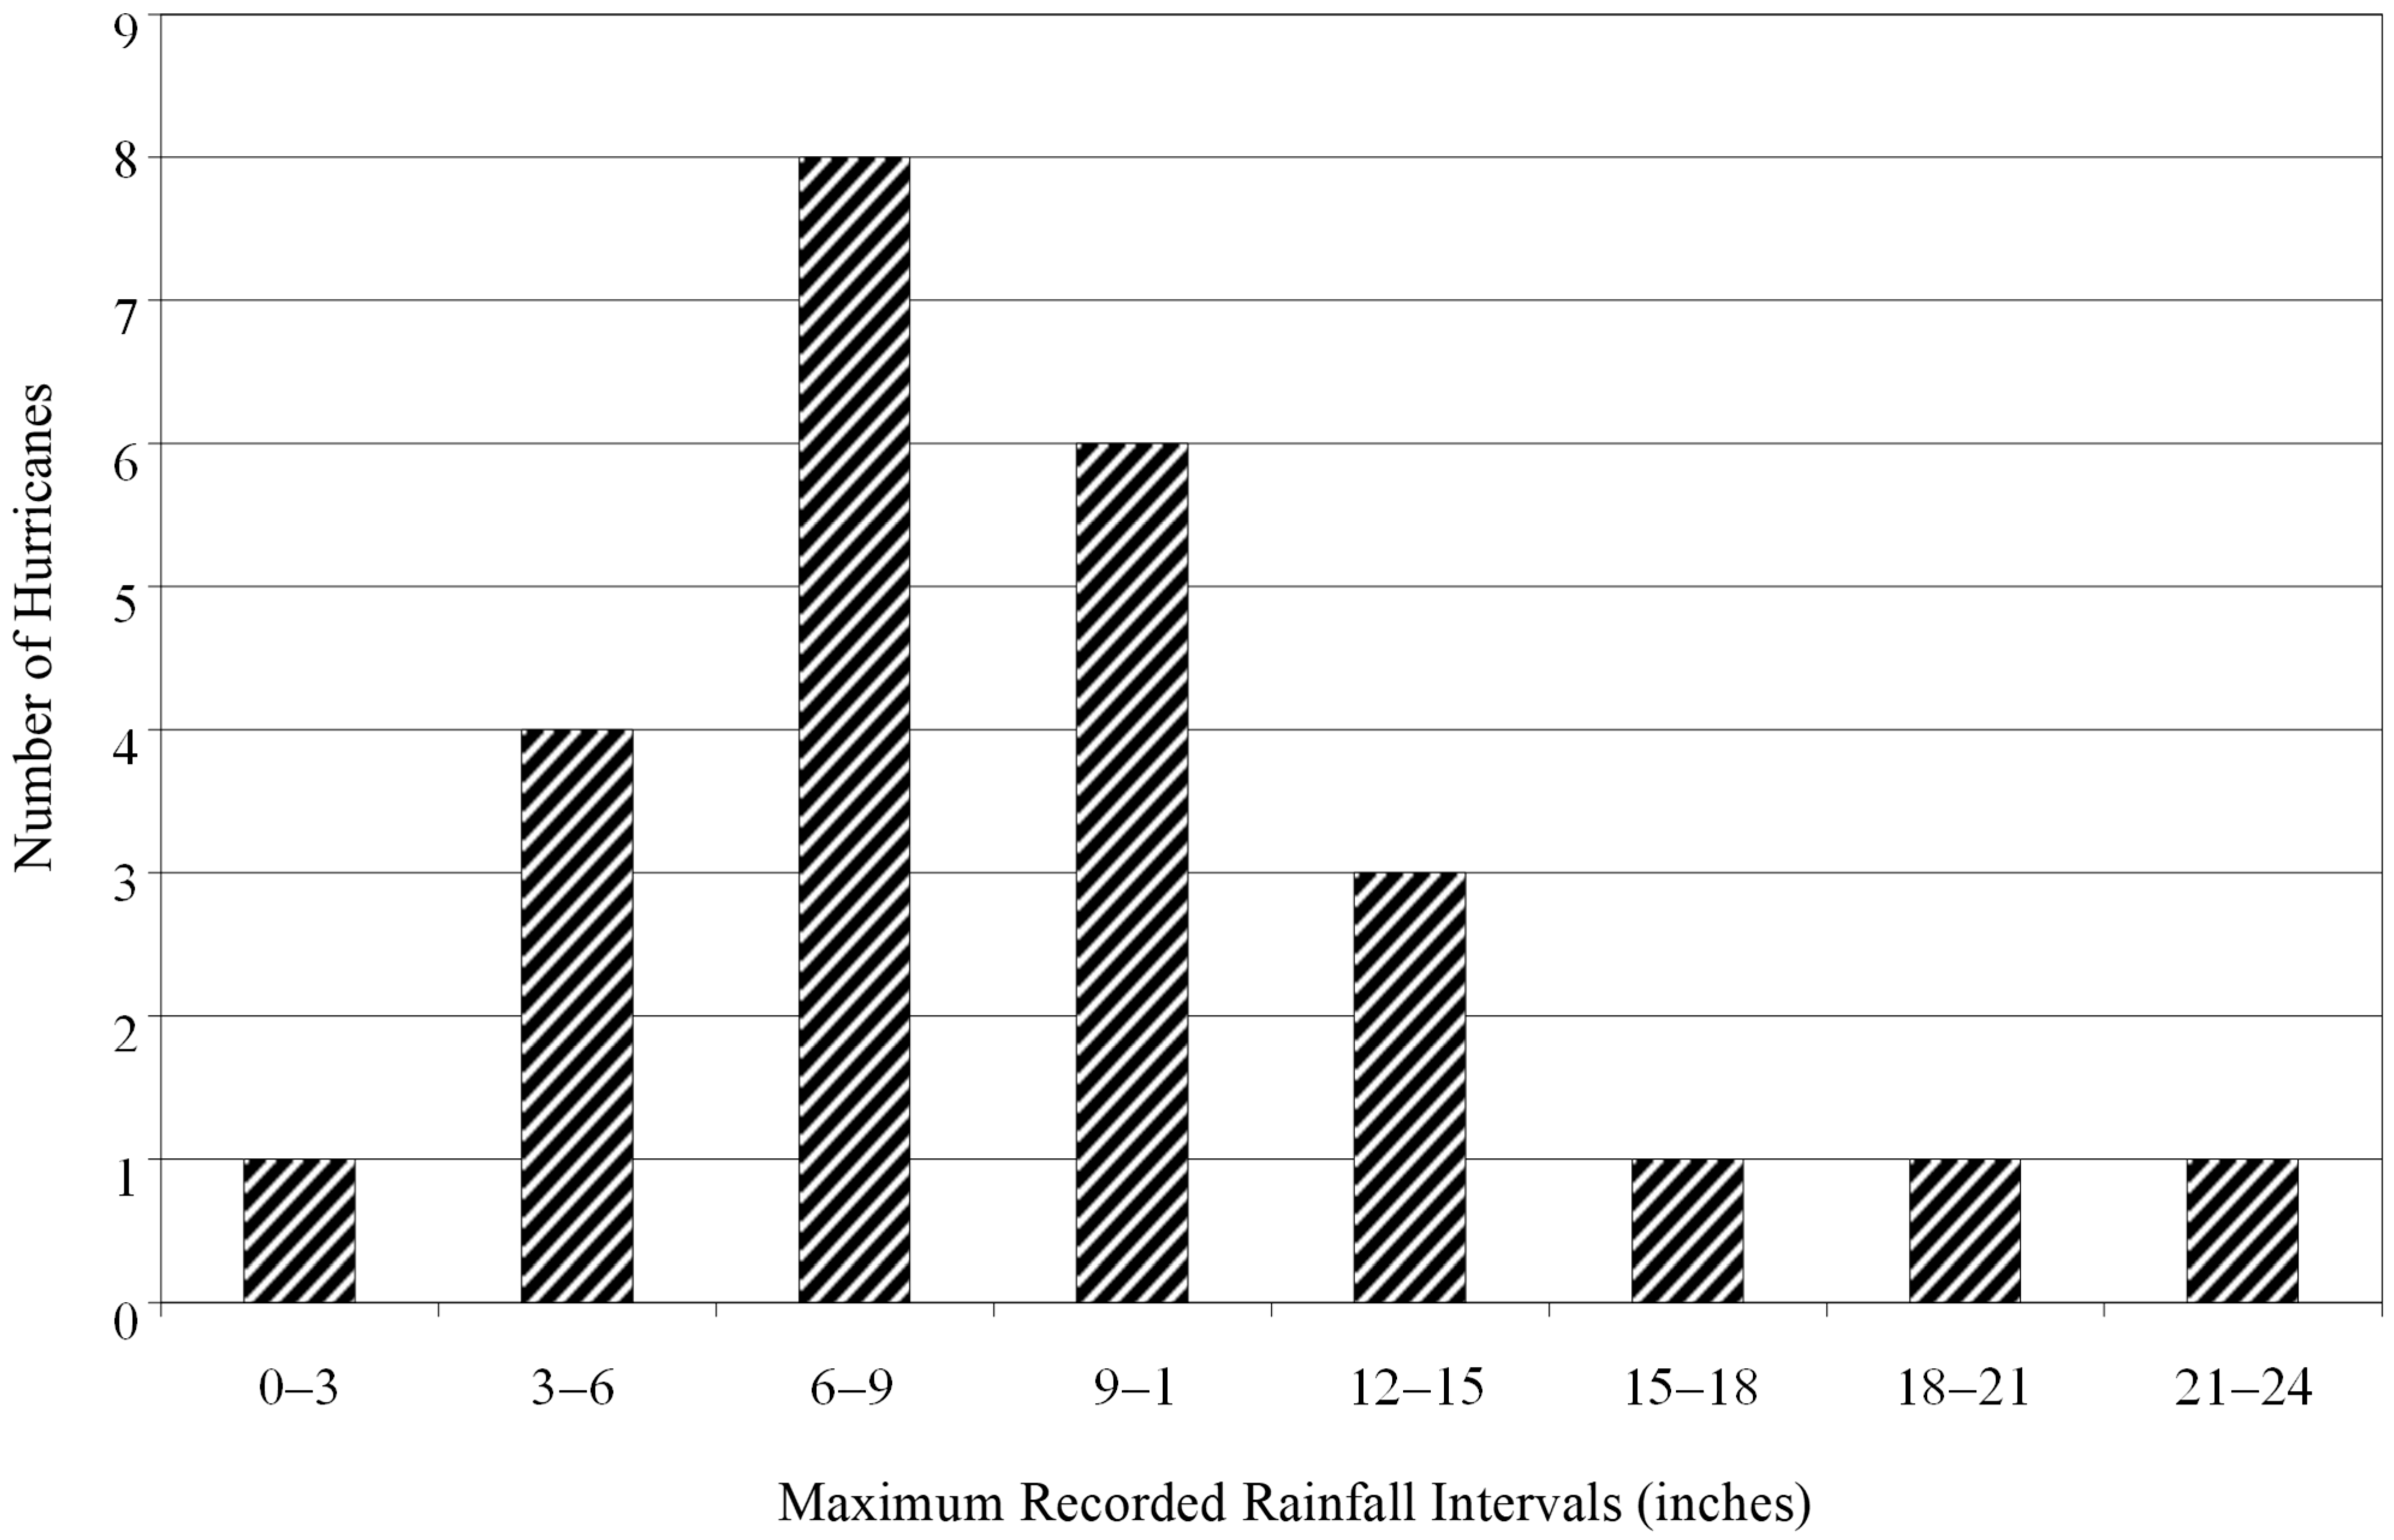
Among the 36 landfalling tropical cyclones, the most common maximum rainfall totals ranged between 6 and 9 inches, followed by 9 to 12 inches. Over 50% of these storms produced rainfall within the 6–12 inch range (
Figure 6). When considering only hurricanes, 50% produced 6–12 inches of rainfall, and 25% exceeded 12 inches (
Figure 7).
4.2.3. Rainfall Volume Determination
To assess flooding potential, total rainfall volume was calculated for 11 tropical cyclones that followed similar tracks across North Carolina (
Table 4). This analysis accounted for rainfall distribution across major river basins, with estimates provided in cubic miles. Among these storms, Hurricane Floyd (1999) produced the largest rainfall volume, totaling approximately 17 km
3, contributing to the most severe flooding event in eastern North Carolina’s history.
4.3. North Carolina Flood Events
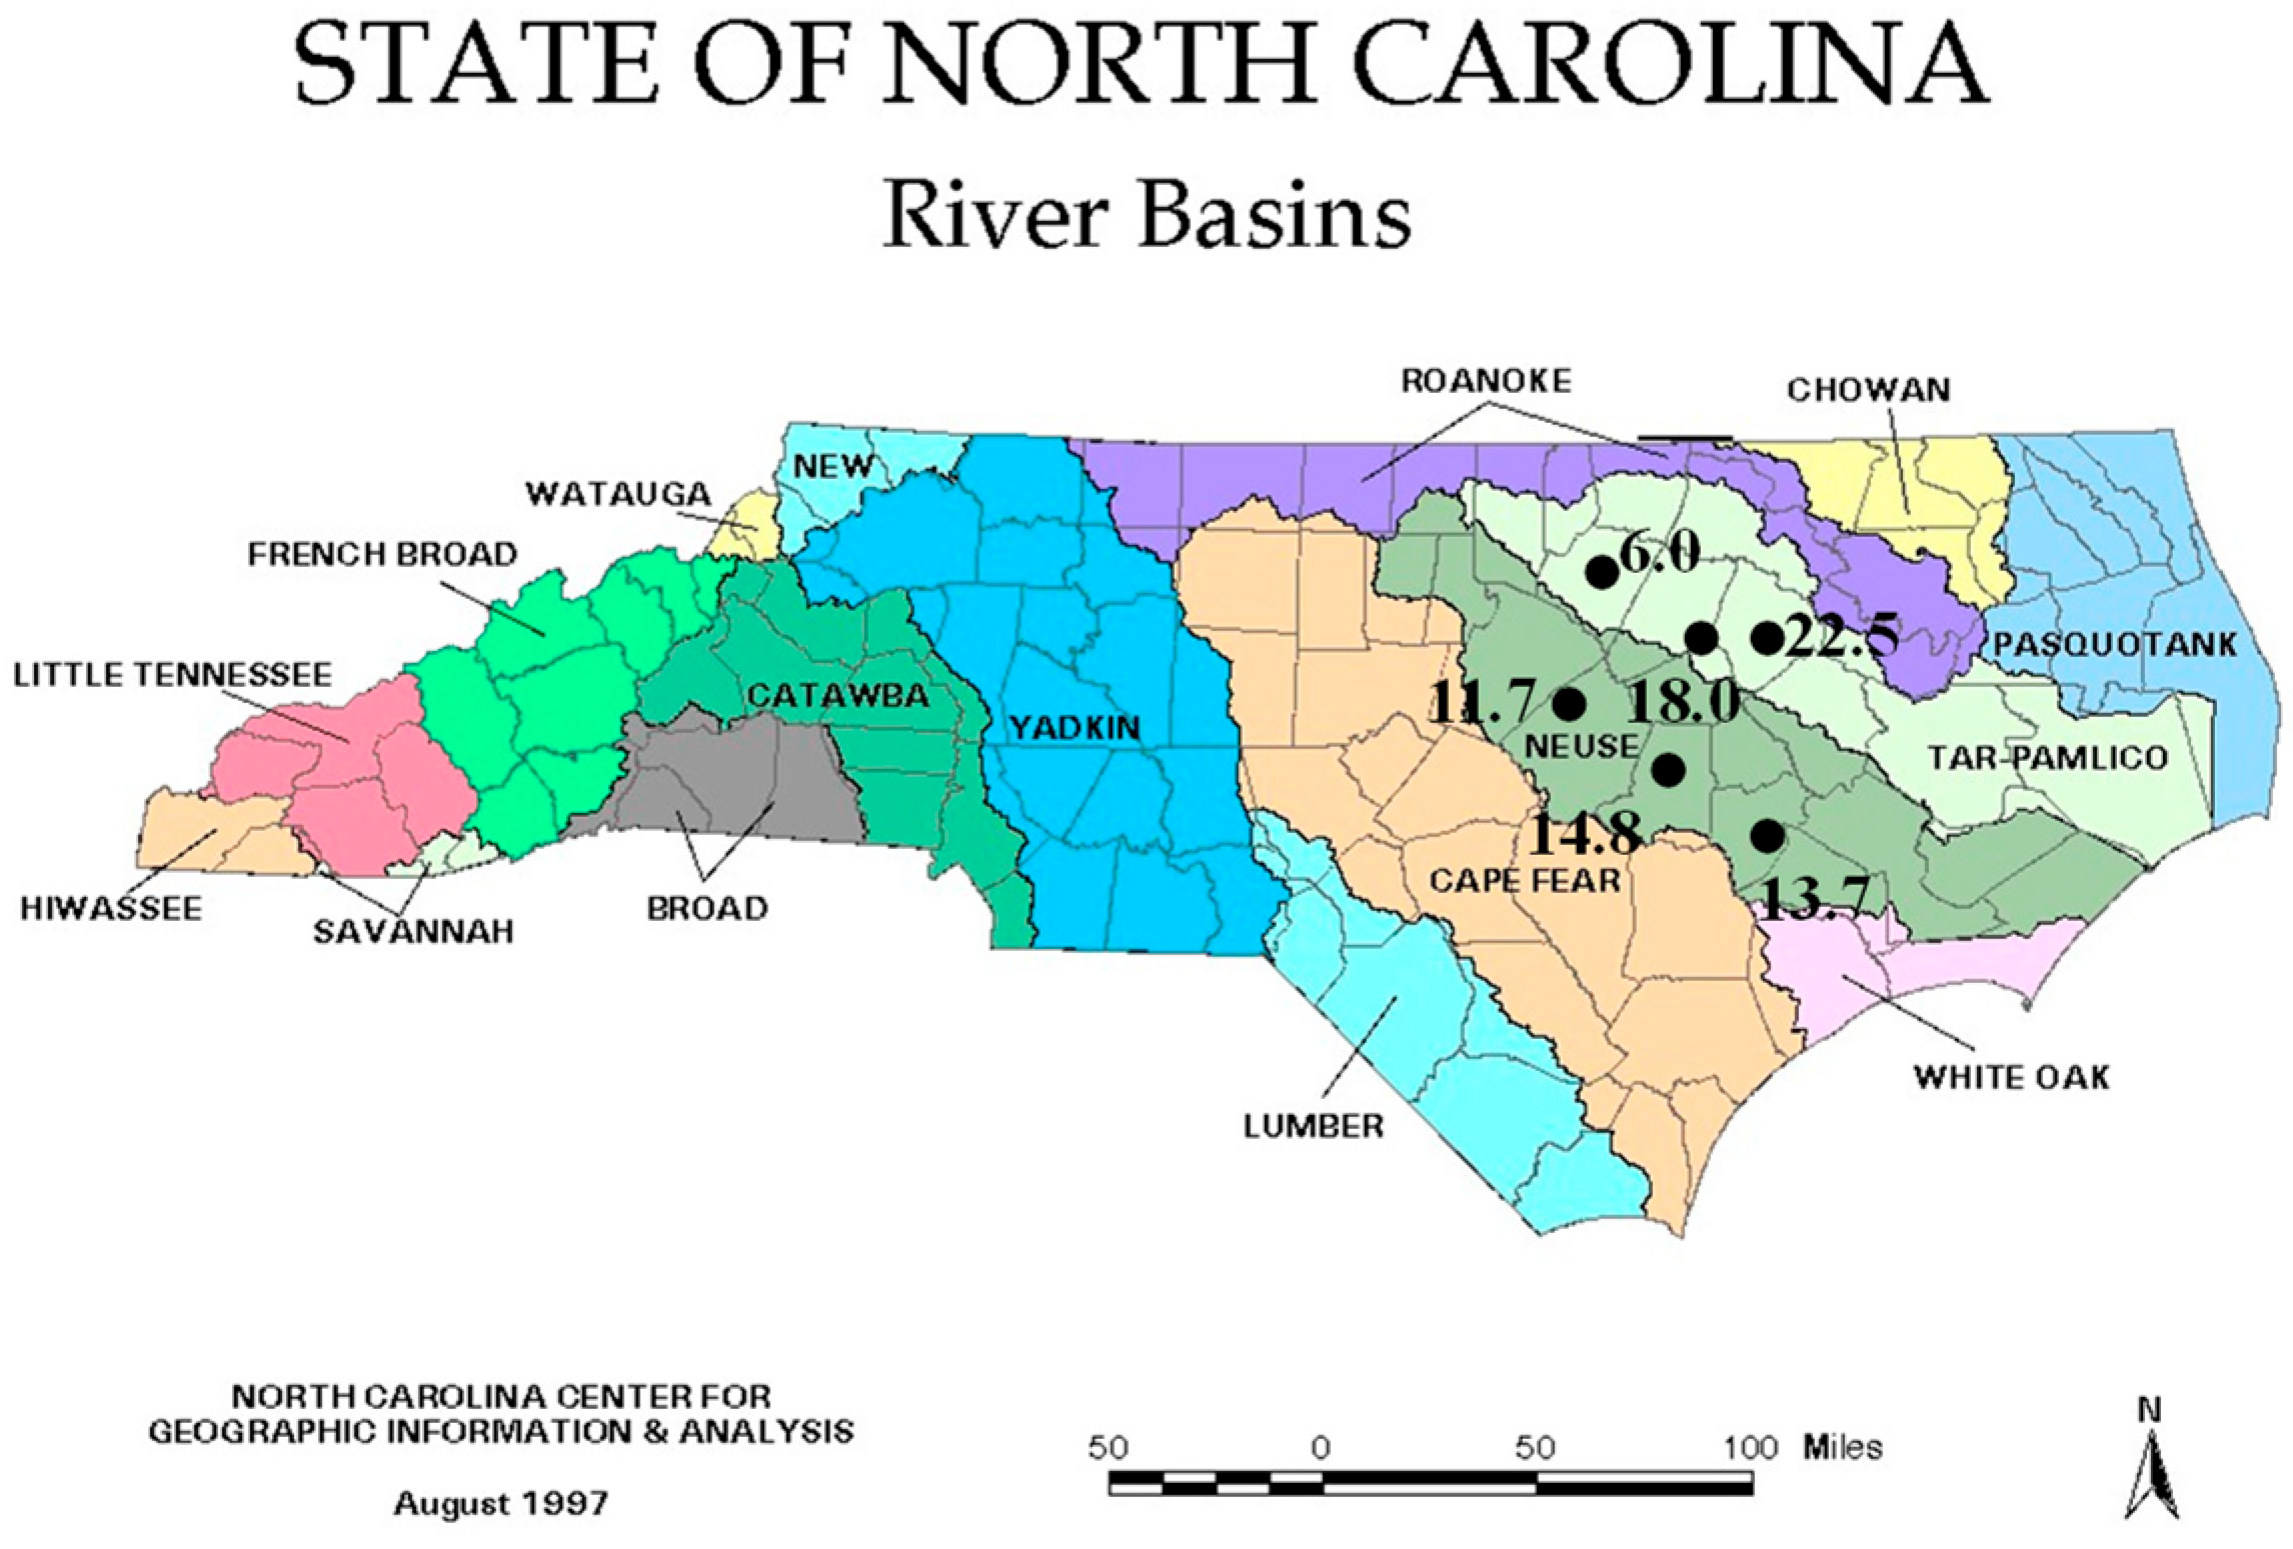
Since 1925, 22 major flooding events in North Carolina have been directly attributed to tropical cyclones. These events were influenced by storm intensity, antecedent rainfall conditions, and mid-latitude atmospheric interactions. Hurricane Floyd (1999) was particularly notable (
Figure 8), producing record-breaking rainfall and interacting with a coastal front and jet/trough dynamics, resulting in USD 6 billion in damages and 56 fatalities—50 of which were due to inland flooding. Similarly, Hurricane Fran (1996) caused widespread flooding, though its impact was less severe than Floyd’s. Other significant flooding events include the 1955 hurricanes Connie, Diane, and Ione, which collectively contributed to over 45 inches of rain in eastern North Carolina over a two-month period.
5. Wind Assessment
Wind data for tropical cyclones in North Carolina are significantly less comprehensive than rainfall data. Only twelve weather stations provided sufficient wind records for this study. To supplement these data, unofficial wind reports from various sources were incorporated. Storm intensity at landfall was primarily determined using HURDAT and best-track data from the National Hurricane Center [
38]. In cases where direct wind observations were unavailable, intensity estimates were derived from alternative sources, such as minimum central pressure, satellite imagery, and aircraft reconnaissance data.
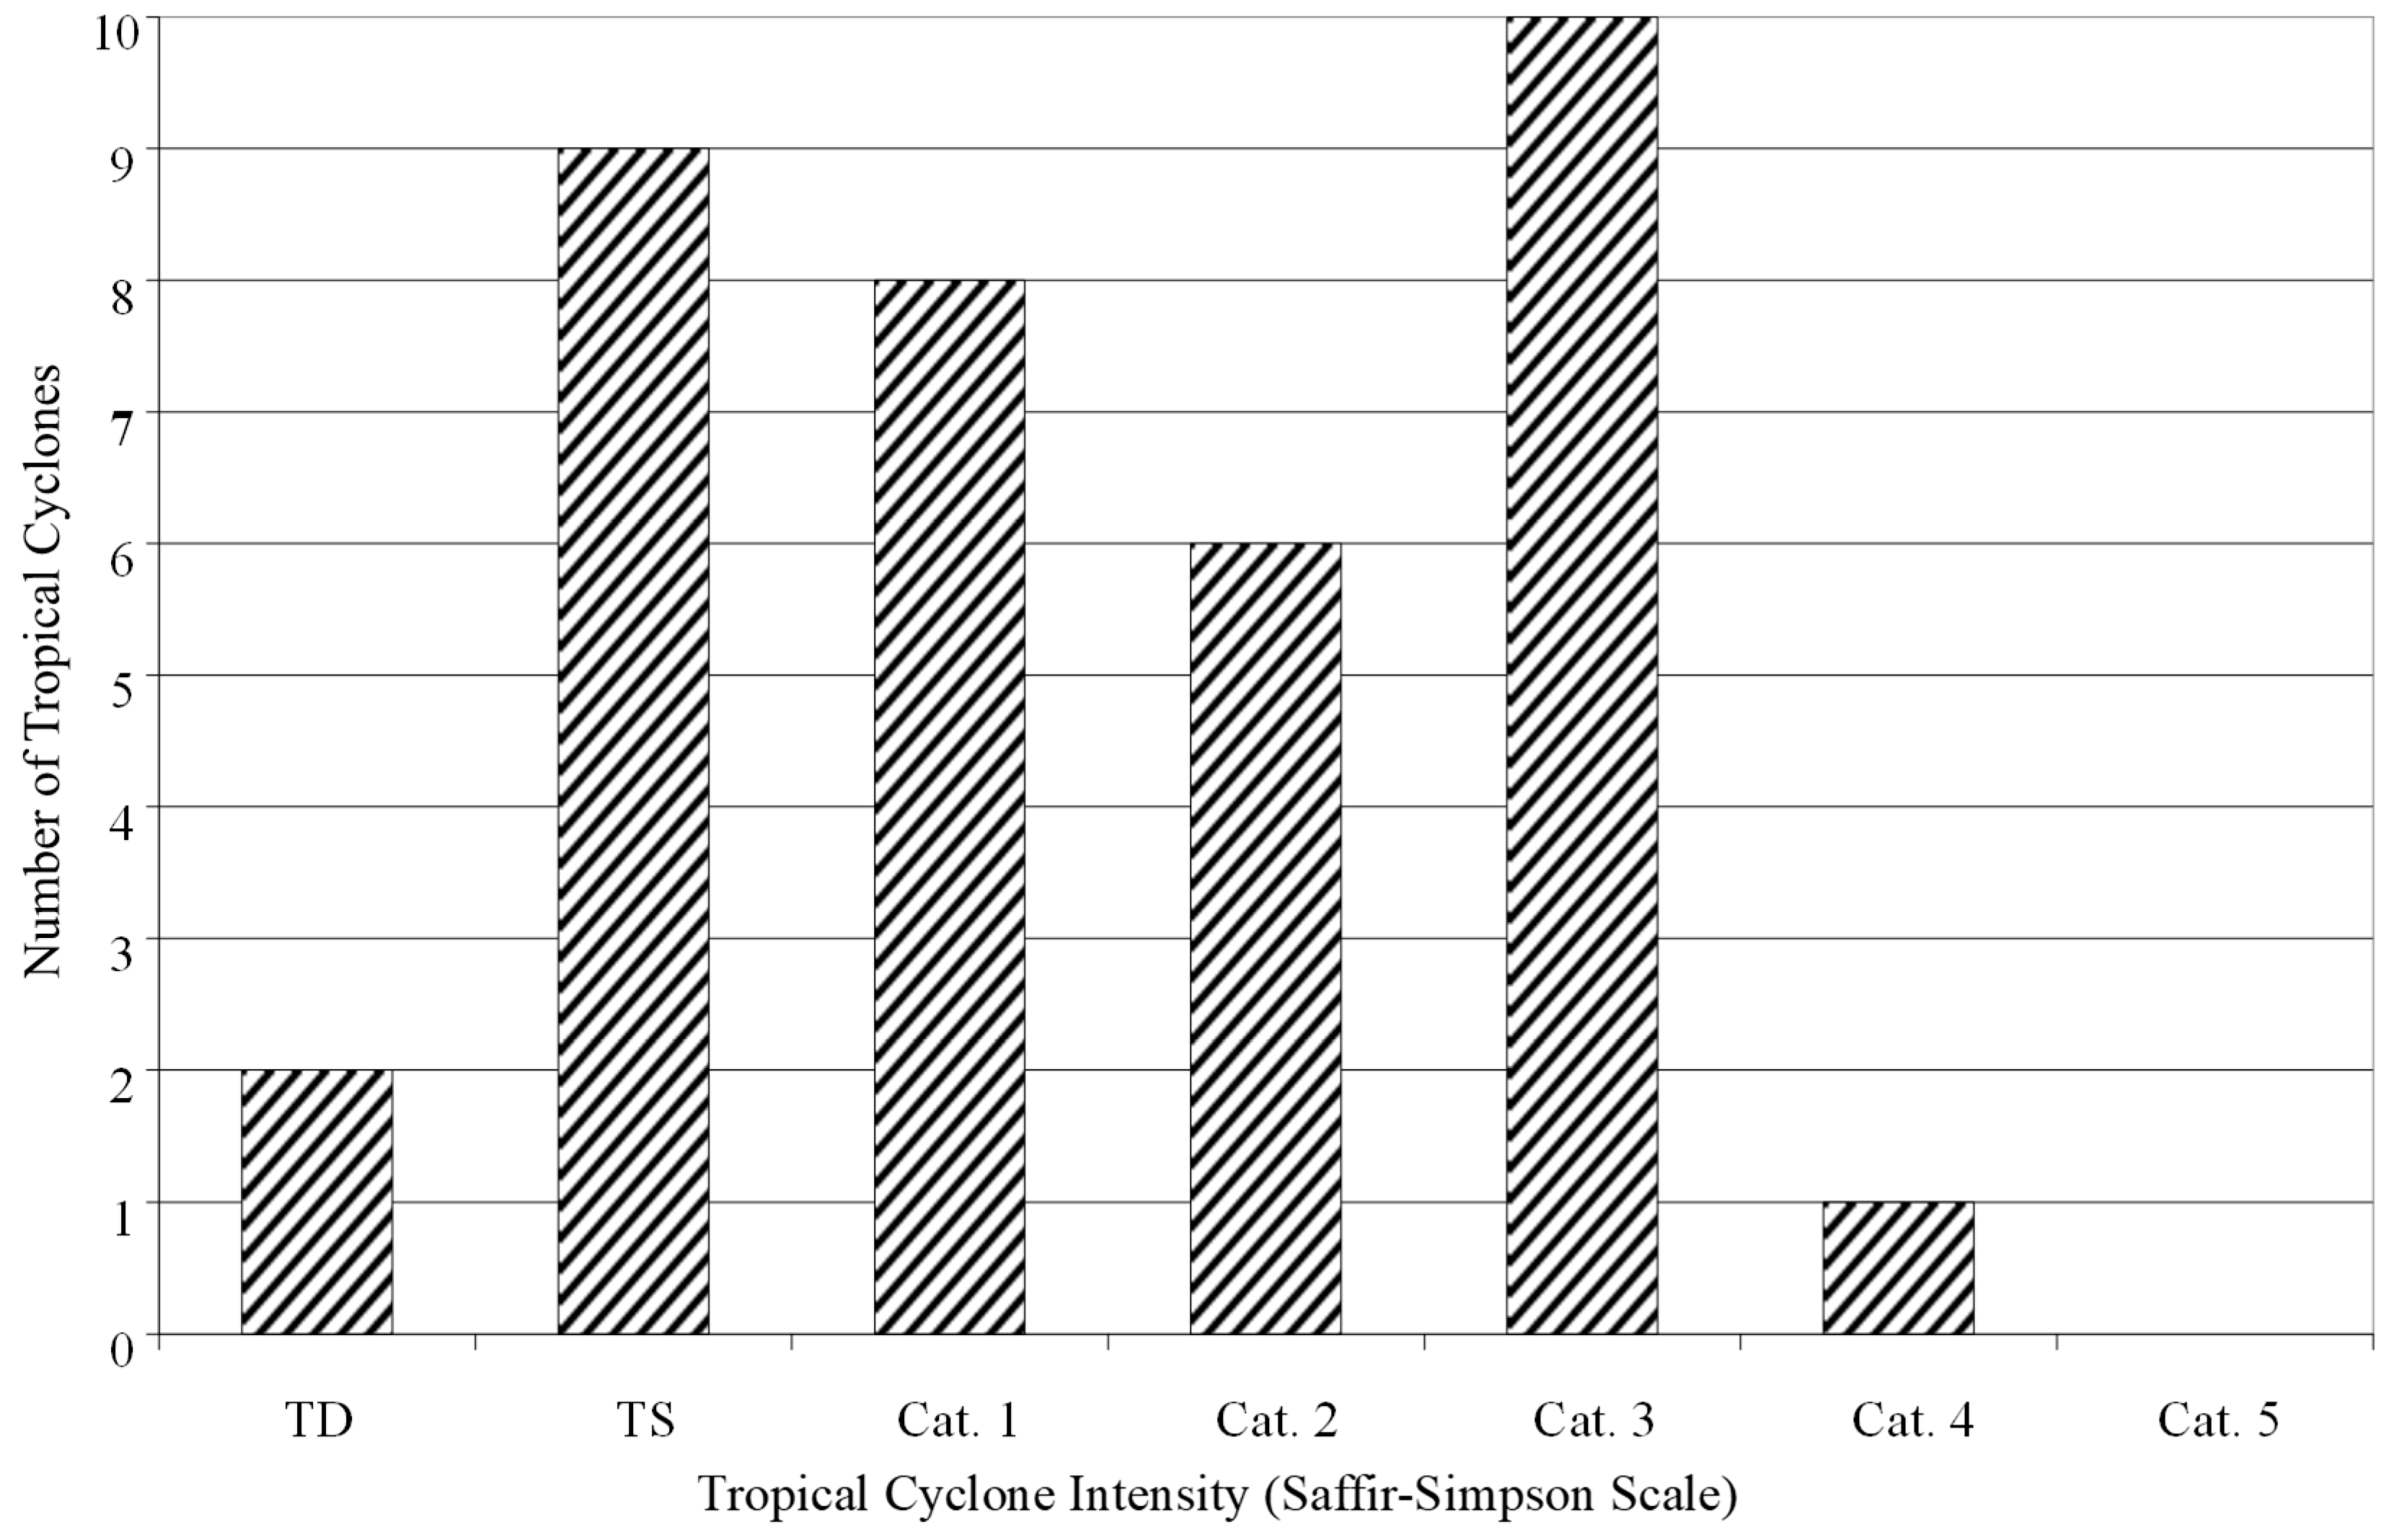
Between 1925 and 2000, 36 tropical cyclones made direct landfall in North Carolina, out of a total of 82 cyclones that impacted the state. Among the 36 landfalling storms, 25 (70%) reached hurricane strength. This high proportion is likely due to the proximity of the warm Gulf Stream waters just off the coast, which often helps intensify or maintain the intensity of tropical systems prior to landfall. From 1925 to 2000, 11 major hurricanes (category 3 or higher) made landfall in North Carolina, with a frequency of approximately 1 every seven years. Notably, Hurricane Hazel (1954) was the only category-4 hurricane to make landfall, and no category-5 hurricanes struck the state during this period. This may reflect the overall low frequency of such intense hurricanes in the Atlantic Basin as well as this study’s 76-year timeframe. Furthermore, geographical and meteorological factors, such as the state’s mid-latitude location (33.8 °N–36.6 °N) and the influence of stronger westerly shear, tend to limit the intensification of storms. The greatest threat to North Carolina comes from category-3 hurricanes, with 10 such storms having made landfall in the state from 1925 to 2000, making them the most frequent type of landfalling tropical cyclone.
Figure 9 illustrates the number of storms categorized by intensity. These data pertain only to storms that made direct landfall; many others weakened as they approached North Carolina.
6. Storm Surge Assessment
Storm surge data for North Carolina are limited, with only nine tidal gauge stations providing sufficient records. Data were sourced from the National Ocean Service (NOS) Center for Operational Oceanographic Products and Services (CO-OPS) [
39].
Table 5 summarizes significant storm surge events from 1950 onward, as earlier data were deemed too sparse for inclusion.
Storm surge levels depend on several key factors, including storm intensity, track orientation, forward speed, and local coastal features. The highest surges occur when strong winds in the storm’s front-right quadrant push water onshore at a near-perpendicular angle. For example, Hurricane Hazel (1954), a category-4 storm moving at 40 knots, generated surges of 10 to 17 feet, devastating coastal communities. Similarly, hurricanes Fran (1996) and Connie (1955) caused significant flooding in the sounds between the mainland and the Outer Banks, where water was trapped against the coastline.
From 1925 to 2000, coastal flooding and beach erosion accounted for approximately 25% of total storm-related damage in North Carolina (
Figure 10a). Erosion, especially along the Outer Banks, remains a major concern. Prolonged wave action from Tropical Storm Dennis (1999) and Hurricane Diana (1984) caused severe shoreline loss. In some cases, such as with Hurricane Bertha (1996), the destruction of protective dunes left coastal communities highly vulnerable to subsequent storms like Hurricane Fran.
7. Summary of Results
This study aimed to enhance the understanding of tropical cyclone impacts and risks in North Carolina during 1925–2000 through four key objectives. The findings provide valuable insights into damage normalization, damage categorization, rainfall–storm speed relationships, and property risk quantification.
- (1)
Re-evaluation of Normalization Procedures
Historical property damage data normalization was improved by shifting from a population-based factor to a housing-based factor. Housing in coastal North Carolina increased by 780% between 1940 and 2000, compared to a 370% population increase, making it a more reasonable metric. Using this revised approach, mid-1950s storm damage was estimated to exceed USD 18 billion (adjusted to year 2000 dollars), while the 1996–1999 period resulted in USD 13 billion in damages. This suggests that the late 1990s, while destructive, were not unprecedented.
- (2)
Damage Categorization
Analyzing 36 direct landfalling cyclones (1925–2000) revealed the following: (1) flooding caused 40% of total damage, wind 35%, and storm surge 25% (
Figure 10a); (2) weaker storms (category 1–2, tropical storms, and depressions) saw 60% of their damage from flooding (
Figure 10b), while major hurricanes (category 3–4) had a more balanced impact: 40% wind, 30% flooding, and 30% storm surge (
Figure 10c). These results emphasize that flooding, rather than storm intensity, is a dominant factor in damage outcomes in North Carolina.
- (3)
Correlation of Rainfall and Meteorological Parameters
Storm intensity showed a weak correlation with total rainfall, as over 50% of landfalling cyclones produced 6–12 inches of rain. Hurricane Floyd (1999) caused North Carolina’s most extreme flooding event in the 20th century, delivering 4.14 cubic miles of rain just 10 days after Tropical Storm Dennis contributed 3.67 cubic miles.
- (4)
Property Risk Quantification
Major hurricanes (category 3–5) were responsible for 70% of all tropical cyclone damage, with category-2 storms contributing 21.4%. Category-3 hurricanes, the most frequent in North Carolina, have a recurrence interval of approximately 7.7 years in the 20th century. These findings highlight the importance of regional risk assessments to improve hazard mitigation and property protection strategies.
8. Discussions and Conclusions
This study underscores the critical role of flooding in tropical cyclone damage in North Carolina, regardless of storm intensity. While wind and storm surge often dominate public perception, inland flooding remains a severe and sometimes underestimated threat, necessitating greater attention in risk assessments and mitigation efforts. Tropical Cyclone Helene of 2024, which was not included in this study, was a vivid reminder of the potential devastation of a weak storm.
Several challenges in compiling historical tropical cyclone damage data were identified, including inconsistencies in reported damage estimates. For instance, Hurricane Fran’s (1996) damage was reported as USD 3.2 billion by the National Hurricane Center but listed as USD 5.2 billion in a separate NCDC report. Similar discrepancies exist for Hurricane Hazel (1954), with estimates ranging from USD 136 million to USD 254 million. The common practice of doubling insured damage to estimate total damage also introduces generalizations rather than precise figures. Meteorological data collection poses additional difficulties. Rainfall measurements can be affected by wind, radar estimates, and instrument limitations, while wind speed, tornado counts, and storm surge data are prone to errors. Inconsistencies in landfall intensity classifications further complicate assessments. For example, while Hurricane Diana (1984) was officially classified as category 2 at landfall, it could be classified as either a category 1, 2, or 3 at landfall depending on how landfall is defined, and similar discrepancies exist for Hurricanes Connie (1955), Ione (1955), and Donna (1960). This study prioritized the NHC best-track reports in cases of conflicting classifications. Ultimately, the accuracy of risk assessments relies on high-quality data. While this study provides insights from 76 years of tropical cyclone activity between 1925 and 2000, improving data collection methods and establishing standardized protocols for damage assessment are crucial for refining future research.
The quantitative aspects of this study should be considered as approximate instead of absolutely accurate due to the uncertainties in some of the source data used in this study. Separation of the damage by wind, inland flooding, and storm surge effects is also approximate as these effects are intertwined. Nevertheless, there is high confidence to conclude that damage caused by tropical cyclone-induced inland flooding is a major form of damage in North Carolina and is less sensitive to storm intensity than the damage caused by wind and storm surge during the study period.
A logical next step is to study the data in the 21st century and compare the results to earlier decades to detect potential temporal variability and trends in tropical cyclone damage patterns in North Carolina.
Author Contributions
Conceptualization, L.X.; methodology, L.X. and D.H.; software, D.H. and L.X.; validation, L.X. and D.H.; formal analysis, L.X. and D.H.; investigation, L.X. and D.H.; resources, L.X.; data curation, D.H.; writing—original draft preparation, D.H. and L.X.; writing—review and editing, L.X.; visualization, D.H. and L.X.; supervision, L.X.; project administration, L.X.; funding acquisition, L.X. All authors have read and agreed to the published version of the manuscript.
Funding
This project was partially supported by Lenovo through a gift to North Carolina State University during the final preparation and publication of this manuscript.
Institutional Review Board Statement
Not applicable.
Informed Consent Statement
Not applicable.
Data Availability Statement
Data sets are included as part of the publication.
Acknowledgments
This study is part of the Master of Science thesis research of the first author under the supervision of the second author [
41].
Conflicts of Interest
The authors declare no conflict of interest.
Appendix A
Table A1.
List of North Carolina tropical cyclones with unadjusted and normalized damage totals in year 2000 dollars. Inflation, wealth, and housing factors for each storm are also listed. The housing factor replaced the population factor that was used in Pielke and Landsea [
2].
Table A1.
List of North Carolina tropical cyclones with unadjusted and normalized damage totals in year 2000 dollars. Inflation, wealth, and housing factors for each storm are also listed. The housing factor replaced the population factor that was used in Pielke and Landsea [
2].
| Tropical Cyclone | Date of Landfall | Unadjusted Damage | Inflation | Wealth | Housing | Normalized Damage |
|---|
| Hurricane Irene | 17 October 1999 | minor | --- |
---
|
---
| minor |
| Hurricane Floyd | 16 September 1999 | USD 6 billion | 1.03 | 1.02 | 1.02 | USD 6.36 billion |
| T.S. Dennis | 4 September 1999 | USD 60 million | 1.03 | 1.02 | 1.02 | USD 64.3 million |
| Hurricane Bonnie | 26 August 1998 | USD 1 billion | 1.05 | 1.02 | 1.04 | USD 1.125 billion |
| T.D. Danny | 24 July 1997 | USD 60 million | 1.07 | 1.03 | 1.04 | USD 72 million |
| T.S. Arthur | 19 June 1996 | no damage | --- |
---
|
---
| none |
| Hurricane Bertha | 12 July 1996 | USD 330 million | 1.1 | 1.04 | 1.09 | USD 411 million |
| Hurricane Fran | 6 September 1996 | USD 5.2 billion | 1.09 | 1.04 | 1.08 | USD 6.36 billion |
| T.S. Jerry | 28 August 1995 | USD 9 million | 1.12 | 1.08 | 1.1 | USD 12 million |
| Hurricane Felix | 17 August 1995 | USD 2 million | 1.12 | 1.08 | 1.1 | USD 3 million |
| T.S. Opal | 5 October 1995 | USD 70 million | 1.12 | 1.08 | 1.1 | USD 93 million |
| T.D. Beryl | 17 August 1994 | USD 1 million | 1.15 | 1.09 | 1.2 | USD 2 million |
| H. Gordon | 18 November 1994 | USD 0.5 million | 1.15 | 1.09 | 1.2 | USD 1 million |
| Hurricane Emily | 31 August 1993 | USD 50 million | 1.19 | 1.1 | 1.2 | USD 78 million |
| Hurricane Bob | 19 August 1991 | USD 4 million | 1.22 | 1.11 | 1.25 | USD 7 million |
| Hurricane Hugo | 22 September 1989 | USD 1.07 billion | 1.38 | 1.12 | 1.28 | USD 2.12 billion |
| T.D. Chris | 29 August 1988 | USD 0.5 million | 1.4 | 1.14 | 1.3 | USD 1 million |
| Hurricane Charley | 17 August 1986 | USD 3 million | 1.5 | 1.16 | 1.4 | USD 7 million |
| T.S. Bob | 25 July 1985 | USD 1.5 million | 1.55 | 1.16 | 1.4 | USD 4 million |
| T.D. Danny | 17 August 1985 | USD 2.5 million | 1.55 | 1.16 | 1.4 | USD 6 million |
| Hurricane Gloria | 27 September 1985 | USD 14 million | 1.59 | 1.17 | 1.49 | USD 38 million |
| T.S. Kate | 23 November 1985 | minor | --- |
---
|
---
| minor |
| Hurricane Diana | 13 September 1984 | USD 79 million | 1.64 | 1.18 | 1.63 | USD 249 million |
| Hurricane Josephine | 12 October 1984 | minor | --- |
---
|
---
| minor |
| T.S. Dennis | 20 August 1981 | USD 10 million | 2.07 | 1.26 | 1.69 | USD 44 million |
| T.S. David | 5 September 1979 | USD 15 million | 2.31 | 1.3 | 1.95 | USD 88 million |
| T.D. Babe | 9 September 1977 | no damage | --- |
---
|
---
| none |
| Hurricane Belle | 9 August 1976 | minor | --- |
---
|
---
| minor |
| T.S. Dottie | 21 August 1976 | USD 0.5 million | 2.9 | 1.4 | 2.2 | USD 4 million |
| T.S. Eloise | 24 September 1975 | minor | --- |
---
|
---
| minor |
| T.S. Agnes | 21 June 1972 | USD 10 million | 4.13 | 1.4 | 1.99 | USD 115 million |
| T.S. Doria | 27 August 1971 | USD 1 million | 4.22 | 1.43 | 2.78 | USD 17 million |
| Hurricane Ginger | 30 September 1971 | USD 10 million | 4.22 | 1.43 | 2.78 | USD 168 million |
| T.D. Alma | 26 May 1970 | no damage | --- |
---
|
---
| none |
| T.S. #4 | 17 August 1970 | USD 0.5 million | 4.25 | 1.44 | 2.8 | USD 9 million |
| T.D. Abby | 8 June 1968 | minor | --- |
---
|
---
| minor |
| Hurricane Gladys | 20 October 1968 | minor | --- |
---
|
---
| none |
| T.S. Doria | 17 September 1967 | minor | --- |
---
|
---
| minor |
| T.S. Alma | 11 June 1966 | minor | --- |
---
|
---
| minor |
| T.D. #1 | 16 June 1965 | minor | --- |
---
|
---
| minor |
| T.S. Cleo | 31 August 1964 | USD 0.5 million | 5.55 | 1.65 | 4.5 | USD 21 million |
| T.S. Dora | 13 September 1964 | USD 0.1 million | 5.55 | 1.65 | 5 | USD 5 million |
| Hurricane Gladys | 21 September 1964 | USD 0.1 million | 5.55 | 1.65 | 5 | USD 5 million |
| Hurricane Isbell | 16 October 1964 | USD 1 million | 5.55 | 1.65 | 5.93 | USD 54 million |
| Hurricane Ginny | 21 October 1963 | USD 0.1 million | 5.6 | 1.68 | 5.5 | USD 5 million |
| Hurricane Alma | 28 August 1962 | minor | --- |
---
|
---
| minor |
| T.S. #6 | 14 September 1961 | no damage | --- |
---
|
---
| none |
| Hurricane Esther | 20 September 1961 | USD 0.1 million | 5.8 | 1.78 | 3.7 | USD 4 million |
| T.S. Brenda | 30 July 1960 | USD 0.25 million | 5.82 | 1.8 | 3.9 | USD 10 million |
| Hurricane Donna | 12 September 1960 | USD 56.5 million | 5.82 | 1.8 | 3.95 | USD 2.34 billion |
| T.D. Cindy | 10 July 1959 | USD 1.1 million | 5.87 | 1.8 | 4 | USD 46 million |
| T.S. Gracie | 30 September 1959 | USD 0.5 million | 5.87 | 1.8 | 4 | USD 21 million |
| Hurricane Helene | 27 September 1958 | USD 11 million | 5.96 | 1.9 | 4.2 | USD 523 million |
| T.D. Flossy | 26 September 1956 | no damage | --- |
---
|
---
| none |
| Hurricane Connie | 12 August 1955 | USD 40 million | 6.4 | 2.06 | 2.96 | USD 1.56 billion |
| Hurricane Diane | 17 August 1955 | USD 80 million | 6.4 | 2.06 | 2.96 | USD 2.54 billion |
| Hurricane Ione | 19 September 1955 | USD 88 million | 6.4 | 2.06 | 2.96 | USD 3.44 billion |
| Hurricane Carol | 31 August 1954 | USD 0.25 million | 6.42 | 2.06 | 3.4 | USD 11 million |
| Hurricane Edna | 11 September 1954 | USD 0.1 million | 6.42 | 2.06 | 3.4 | USD 4 million |
| Hurricane Hazel | 15 October 1954 | USD 254 million | 6.42 | 2.06 | 3.4/3.0 | USD 10.52 billion |
| Hurricane Barbara | 14 August 1953 | USD 1.1 million | 6.5 | 2.08 | 3.65 | USD 54 million |
| T.S. Able | 31 August 1952 | minor | --- |
---
|
---
| minor |
| Hurricane #1 | 24 August 1949 | USD 0.2 million | 7 | 2.2 | 4 | USD 12 million |
| Hurricane #2 (T.S.) | 29 August 1949 | minor | --- |
---
|
---
| minor |
| T.S. #6 (T.D) | 24 September 1947 | minor | --- |
---
|
---
| minor |
| Hurricane #2 (T.S.) | 6 July 1946 | minor | --- |
---
|
---
| minor |
| Hurricane #5 (T.D.) | 9 October 1946 | no damage | --- |
---
|
---
| none |
| Hurricane #1 (TS) | 26 June 1945 | minor | --- |
---
|
---
| minor |
| Hurricane #9 (T.S.) | 18 September 1945 | USD 2 million | 9.7 | 2.4 | 4.5 | USD 209 million |
| Hurricane #3 | 1 August 1944 | USD 2 million | 9.75 | 2.4 | 5 | USD 234 million |
| Hurricane #7 | 14 September 1944 | USD 1.5 million | 9.75 | 2.4 | 4.8 | USD 168 million |
| Hurricane #11 (T.S.) | 20 October 1944 | minor | --- |
---
|
---
| minor |
| T.S. #8 (T.D.) | 12 October 1942 | minor | --- |
---
|
---
| minor |
| Hurricane #2 (T.D.) | 18 August 1939 | USD 1 million | 12.5 | 2.5 | 5 | USD 156 million |
| Hurricane #13 | 18 September 1936 | USD 0.1 million | 12.3 | 2.5 | 5 | USD 15 million |
| Hurricane #2 (T.S.) | 5 September 1935 | minor | --- |
---
|
---
| minor |
| Hurricane #8 | 23 August 1933 | USD 0.25 million | 13 | 2.5 | 5 | USD 40 million |
| Hurricane #13 | 16 September 1933 | USD 4.5 million | 13 | 2.5 | 5 | USD 731 million |
| Hurricane #1 (T.D.) | 11 August 1928 | USD 0.05 million | 10.1 | 2.5 | 5 | USD 6 million |
| Hurricane #4 (T.S.) | 19 September 1928 | $2 million | 10.1 | 2.5 | 5 | USD 252 million |
| T.S. #5 | 3 October 1927 | no damage | --- |
---
|
---
| none |
| Hurricane #2 (T.S.) | 2 December 1925 | no damage | --- |
---
|
---
| none |
Appendix B
Table A2.
List of North Carolina tropical cyclones with unadjusted and normalized damage totals in year 2000 USD values. The normalized totals are based on the Pielke and Landsea [
2] normalization method, including the use of the population factor.
Table A2.
List of North Carolina tropical cyclones with unadjusted and normalized damage totals in year 2000 USD values. The normalized totals are based on the Pielke and Landsea [
2] normalization method, including the use of the population factor.
| Tropical Cyclone | Date of Landfall | Unadjusted Damage | Inflation | Wealth | Population | Normalized Damage |
|---|
| Hurricane Irene | 17 October 1999 | minor | --- |
---
|
---
| minor |
| Hurricane Floyd | 16 September 1999 | USD 6 billion | 1.03 | 1.02 | 1.01 | USD 6.36 billion |
| T.S. Dennis | 4 September 1999 | USD 60 million | 1.03 | 1.02 | 1.01 | USD 64 million |
| Hurricane Bonnie | 26 August 1998 | USD 1 billion | 1.05 | 1.02 | 1.02 | USD 1.092 billion |
| T.D. Danny | 24 July 1997 | USD 60 million | 1.07 | 1.03 | 1.02 | USD 67 million |
| T.S. Arthur | 19 June 1996 | no damage | --- |
---
|
---
| none |
| Hurricane Bertha | 12 July 1996 | USD 330 million | 1.1 | 1.04 | 1.06 | USD 400 million |
| Hurricane Fran | 6 September 1996 | USD 5.2 billion | 1.09 | 1.04 | 1.06 | USD 6.25 billion |
| T.S. Jerry | 28 August 1995 | USD 9 million | 1.12 | 1.08 | 1.07 | USD 12 million |
| Hurricane Felix | 17 August 1995 | USD 2 million | 1.12 | 1.08 | 1.1 | USD 3 million |
| T.S. Opal | 5 October 1995 | USD 70 million | 1.12 | 1.08 | 1.08 | USD 91 million |
| T.D. Beryl | 17 August 1994 | USD 1 million | 1.15 | 1.09 | 1.1 | USD 2 million |
| H. Gordon | 18 November 1994 | USD 0.5 million | 1.15 | 1.09 | 1.1 | USD 1 million |
| Hurricane Emily | 31 August 1993 | USD 50 million | 1.19 | 1.1 | 1.12 | USD 76 million |
| Hurricane Bob | 19 August 1991 | USD 4 million | 1.22 | 1.11 | 1.16 | USD 6 million |
| Hurricane Hugo | 22 September 1989 | USD 1.07 billion | 1.38 | 1.12 | 1.18 | USD 1.836 billion |
| T.D. Chris | 29 August 1988 | USD 0.5 million | 1.4 | 1.14 | 1.19 | USD 1 million |
| Hurricane Charley | 17 August 1986 | USD 3 million | 1.5 | 1.16 | 1.2 | USD 6 million |
| T.S. Bob | 25 July 1985 | USD 1.5 million | 1.55 | 1.16 | 1.22 | USD 3 million |
| T.D. Danny | 17 August 1985 | USD 2.5 million | 1.55 | 1.16 | 1.22 | USD 5 million |
| Hurricane Gloria | 27 September 1985 | USD 14 million | 1.59 | 1.17 | 1.25 | USD 33 million |
| T.S. Kate | 23 November 1985 | minor | --- |
---
|
---
| minor |
| Hurricane Diana | 13 September 1984 | USD 79 million | 1.64 | 1.18 | 1.22 | USD 187 million |
| Hurricane Josephine | 12 October 1984 | minor | --- |
---
|
---
| minor |
| T.S. Dennis | 20 August 1981 | USD 10 million | 2.07 | 1.26 | 1.25 | USD 33 million |
| T.S. David | 5 September 1979 | USD 15 million | 2.31 | 1.3 | 1.3 | USD 59 million |
| T.D. Babe | 9 September 1977 | no damage | --- |
---
|
---
| none |
| Hurricane Belle | 9 August 1976 | minor | --- |
---
|
---
| minor |
| T.S. Dottie | 21 August 1976 | USD 0.5 million | 2.9 | 1.4 | 1.25 | USD 3 million |
| T.S. Eloise | 24 September 1975 | minor | --- |
---
|
---
| minor |
| T.S. Agnes | 21 June 1972 | USD 10 million | 4.13 | 1.4 | 1.37 | USD 79 million |
| T.S. Doria | 27 August 1971 | USD 1 million | 4.22 | 1.43 | 1.75 | USD 11 million |
| Hurricane Ginger | 30 September 1971 | USD 10 million | 4.22 | 1.43 | 1.75 | USD 105 million |
| T.D. Alma | 26 May 1970 | no damage | --- |
---
|
---
| none |
| T.S. #4 | 17 August 1970 | USD 0.5 million | 4.25 | 1.44 | 2.2 | USD 7 million |
| T.D. Abby | 8 June 1968 | minor | --- |
---
|
---
| minor |
| Hurricane Gladys | 20 October 1968 | minor | --- |
---
|
---
| none |
| T.S. Doria | 17 September 1967 | minor | --- |
---
|
---
| minor |
| T.S. Alma | 11 June 1966 | minor | --- |
---
|
---
| minor |
| T.D. #1 | 16 June 1965 | minor | --- |
---
|
---
| minor |
| T.S. Cleo | 31 August 1964 | USD 0.5 million | 5.55 | 1.65 | 2.2 | USD 10 million |
| T.S. Dora | 13 September 1964 | USD 0.1 million | 5.55 | 1.65 | 2 | USD 2 million |
| Hurricane Gladys | 21 September 1964 | USD 0.1 million | 5.55 | 1.65 | 3.3 | USD 3 million |
| Hurricane Isbell | 16 October 1964 | USD 1 million | 5.55 | 1.65 | 4.1 | USD 38 million |
| Hurricane Alma | 28 August 1962 | minor | --- | --- | --- | minor |
| T.S. #6 | 14 September 1961 | no damage | --- | --- | --- | none |
| Hurricane Esther | 20 September 1961 | USD 0.1 million | 5.8 | 1.78 | 3.5 | USD 4 million |
| T.S. Brenda | 30 July 1960 | USD 0.25 million | 5.82 | 1.8 | 2.2 | USD 6 million |
| Hurricane Donna | 12 September 1960 | USD 56.5 million | 5.82 | 1.8 | 2.2 | USD 1.302 billion |
| T.D. Cindy | 10 July 1959 | USD 1.1 million | 5.87 | 1.8 | 2.3 | USD 27 million |
| T.S. Gracie | 30 September 1959 | USD 0.5 million | 5.87 | 1.8 | 2.3 | USD 12 million |
| Hurricane Helene | 27 September 1958 | USD 11 million | 5.96 | 1.9 | 2.4 | USD 299 million |
| T.D. Flossy | 26 September 1956 | no damage | --- | --- | --- | none |
| Hurricane Connie | 12 August 1955 | USD 40 million | 6.4 | 2.06 | 2.2 | USD 1.16 billion |
| Hurricane Diane | 17 August 1955 | USD 80 million | 6.4 | 2.06 | 2.2 | USD 2.32 billion |
| Hurricane Ione | 19 September 1955 | USD 88 million | 6.4 | 2.06 | 2.2 | USD 2.552 billion |
| Hurricane Carol | 31 August 1954 | USD 0.25 million | 6.42 | 2.06 | 2.2 | USD 7 million |
| Hurricane Edna | 11 September 1954 | USD 0.1 million | 6.42 | 2.06 | 2.2 | USD 3 million |
| Hurricane Hazel | 15 October 1954 | USD 254 million | 6.42 | 2.06 | 2.2 | USD 7.39 billion |
| Hurricane Barbara | 14 August 1953 | USD 1.1 million | 6.5 | 2.08 | 3.5 | USD 52 million |
| T.S. Able | 31 August 1952 | minor | --- | --- | --- | minor |
| Hurricane #1 | 24 August 1949 | USD 0.2 million | 7 | 2.2 | 2.4 | USD 7 million |
| Hurricane #2 (T.S.) | 29 August 1949 | minor | --- | --- | --- | minor |
| T.S. #6 (T.D) | 24 September 1947 | minor | --- | --- | --- | minor |
| Hurricane #2 (T.S.) | 6 July 1946 | minor | --- | --- | --- | minor |
| Hurricane #5 (T.D.) | 9 October 1946 | no damage | --- | --- | --- | none |
| Hurricane #1 (TS) | 26 June 1945 | minor | --- | --- | --- | minor |
| Hurricane #9 (T.S.) | 18 September 1945 | USD 2 million | 9.7 | 2.4 | 2.6 | USD 121 million |
| Hurricane #3 | 1 August 1944 | USD 2 million | 9.75 | 2.4 | 2.6 | USD 122 million |
| Hurricane #7 | 14 September 1944 | USD 1.5 million | 9.75 | 2.4 | 2.6 | USD 91 million |
| Hurricane #11 (T.S.) | 20 October 1944 | minor | --- | --- | --- | minor |
| T.S. #8 (T.D.) | 12 October 1942 | minor | --- | --- | --- | minor |
| Hurricane #2 (T.D.) | 18 August 1939 | USD 1 million | 12.5 | 2.5 | 2.9 | USD 91 million |
| Hurricane #13 | 18 September 1936 | USD 0.1 million | 12.3 | 2.5 | 3.1 | USD 10 million |
| Hurricane #2 (T.S.) | 5 September 1935 | minor | --- | --- | --- | minor |
| Hurricane #8 | 23 August 1933 | USD 0.25 million | 13 | 2.5 | 4 | USD 33 million |
| Hurricane #13 | 16 September 1933 | USD 4.5 million | 13 | 2.5 | 4 | USD 585 million |
| Hurricane #1 (T.D.) | 11 August 1928 | USD 0.05 million | 10.1 | 2.5 | 4.5 | USD 6 million |
| Hurricane #4 (T.S.) | 19 September 1928 | USD 2 million | 10.1 | 2.5 | 4.5 | USD 227 million |
| T.S. #5 | 3 October 1927 | no damage | --- | --- | --- | none |
| Hurricane #2 (T.S.) | 2 December 1925 | no damage | --- | --- | --- | none |
Appendix C
Table A3.
Cause of damage: wind/flood/storm surge from North Carolina impacting tropical cyclones (1925–2000).
Table A3.
Cause of damage: wind/flood/storm surge from North Carolina impacting tropical cyclones (1925–2000).
| Tropical Cyclone | Date of Landfall | Unadjusted Damage | Normalized Damage | Wind (%) | Flood(%) | Storm Surge (%) |
|---|
| Hurricane Irene | 17 October 1999 | minor | minor | 0 | 100 | 0 |
| Hurricane Floyd | 16 September 1999 | USD 6 billion | USD 6.36 billion | 5 | 90 | 5 |
| T.S. Dennis | 4 September 1999 | USD 60 million | USD 64.3 million | 10 | 30 | 60 |
| Hurricane Bonnie | 26 August 1998 | USD 1 billion | USD 1.125 billion | 70 | 20 | 10 |
| T.D. Danny | 24 July 1997 | USD 60 million | USD 72 million | 0 | 100 | 0 |
| T.S. Arthur | 19 June 1996 | no damage | none | 0 | 0 | 0 |
| Hurricane Bertha | 12 July 1996 | USD 330 million | USD 411 million | 40 | 30 | 30 |
| Hurricane Fran | 6 September 1996 | USD 5.2 billion | USD 6.36 billion | 50 | 30 | 20 |
| T.S. Jerry | 28 August 1995 | USD 9 million | USD 12 million | 0 | 100 | 0 |
| Hurricane Felix | 17 August 1995 | USD 2 million | USD 3 million | 10 | 0 | 90 |
| T.S. Opal | 5 October 1995 | USD 70 million | USD 93 million | 0 | 100 | 0 |
| T.D. Beryl | 17 August 1994 | USD 1 million | USD 2 million | 0 | 100 | 0 |
| Hurricane Gordon | 18 November 1994 | USD 0.5 million | USD 1 million | 0 | 0 | 100 |
| Hurricane Emily | 31 August 1993 | USD 50 million | USD 78 million | 30 | 0 | 70 |
| Hurricane Bob | 19 August 1991 | USD 4 million | USD 7 million | 90 | 10 | 0 |
| Hurricane Hugo | 22 September 1989 | USD 1.07 billion | USD 2.12 billion | 80 | 0 | 20 |
| T.D. Chris | 29 August 1988 | USD 0.5 million | USD 1 million | 100 | 0 | 0 |
| Hurricane Charley | 17 August 1986 | USD 3 million | USD 7 million | 75 | 20 | 5 |
| T.S. Bob | 25 July 1985 | USD 1.5 million | USD 4 million | 80 | 10 | 10 |
| T.D. Danny | 17 August 1985 | USD 2.5 million | USD 6 million | 10 | 90 | 0 |
| Hurricane Gloria | 27 September 1985 | USD 14 million | USD 38 million | 50 | 0 | 50 |
| T.S. Kate | 23 November 1985 | minor | minor | 0 | 100 | 0 |
| Hurricane Diana | 13 September 1984 | USD 79 million | USD 249 million | 40 | 40 | 20 |
| Hurricane Josephine | 12 October 1984 | minor | minor | 0 | 0 | 100 |
| T.S. Dennis | 20 August 1981 | USD 10 million | USD 44 million | 0 | 100 | 0 |
| T.S. David | 5 September 1979 | USD 15 million | USD 88 million | 40 | 50 | 10 |
| T.D. Babe | 9 September 1977 | no damage | none | 0 | 0 | 0 |
| Hurricane Belle | 9 August 1976 | minor | minor | 10 | 10 | 80 |
| T.S. Dottie | 21 August 1976 | USD 0.5 million | USD 4 million | 0 | 100 | 0 |
| T.S. Eloise | 24 September 1975 | minor | minor | 50 | 50 | 0 |
| T.S. Agnes | 21 June 1972 | USD 10 million | USD 115 million | 10 | 90 | 0 |
| T.S. Doria | 27 August 1971 | USD 1 million | USD 17 million | 50 | 25 | 25 |
| Hurricane Ginger | 30 September 1971 | USD 10 million | USD 168 million | 50 | 30 | 20 |
| T.D. Alma | 26 May 1970 | no damage | none | 0 | 0 | 0 |
| T.S. #4 | 17 August 1970 | USD 0.5 million | USD 9 million | 0 | 0 | 100 |
| T.D. Abby | 8 June 1968 | minor | minor | 10 | 90 | 0 |
| Hurricane Gladys | 20 October 1968 | minor | none | 0 | 0 | 0 |
| T.S. Doria | 17 September 1967 | minor | minor | 0 | 100 | 0 |
| T.S. Alma | 11 June 1966 | minor | minor | 50 | 50 | 0 |
| T.D. #1 | 16 June 1965 | minor | minor | 0 | 100 | 0 |
| T.S. Cleo | 31 August 1964 | USD 0.5 million | USD 21 million | 50 | 50 | 0 |
| T.S. Dora | 13 September 1964 | USD 0.1 million | USD 5 million | 80 | 20 | 0 |
| Hurricane Gladys | 21 September 1964 | USD 0.1 million | USD 5 million | 0 | 0 | 100 |
| Hurricane Isbell | 16 October 1964 | USD 1 million | USD 54 million | 90 | 0 | 10 |
| Hurricane Ginny | 21 October 1963 | USD 0.1 million | USD 5 million | 10 | 10 | 80 |
| Hurricane Alma | 28 August 1962 | minor | minor | 20 | 80 | 0 |
| T.S. #6 | 14 September 1961 | no damage | none | 0 | 0 | 0 |
| Hurricane Esther | 20 September 1961 | USD 0.1 million | USD 4 million | 0 | 0 | 100 |
| T.S. Brenda | 30 July 1960 | USD 0.25 million | USD 10 million | 40 | 60 | 0 |
| Hurricane Donna | 12 September 1960 | USD 56.5 million | USD 2.34 billion | 60 | 0 | 40 |
| T.D. Cindy | 10 July 1959 | USD 1.1 million | USD 46 million | 90 | 10 | 0 |
| T.S. Gracie | 30 September 1959 | USD 0.5 million | USD 21 million | 80 | 20 | 0 |
| Hurricane Helene | 27 September 1958 | USD 11 million | USD 523 million | 100 | 0 | 0 |
| T.D. Flossy | 26 September 1956 | no damage | none | 0 | 0 | 0 |
| Hurricane Connie | 12 August 1955 | USD 40 million | USD 1.56 billion | 30 | 20 | 50 |
| Hurricane Diane | 17 August 1955 | USD 80 million | USD 2.54 billion | 10 | 60 | 30 |
| Hurricane Ione | 19 September 1955 | USD 88 million | USD 3.44 billion | 10 | 70 | 20 |
| Hurricane Carol | 31 August 1954 | USD 0.25 million | USD 11 million | 60 | 0 | 40 |
| Hurricane Edna | 11 September 1954 | USD 0.1 million | USD 4 million | 30 | 20 | 50 |
| Hurricane Hazel | 15 October 1954 | USD 254 million | USD 10.52 billion | 40 | 30 | 30 |
| Hurricane Barbara | 14 August 1953 | USD 1.1 million | USD 54 million | 90 | 10 | 0 |
| T.S. Able | 31 August 1952 | minor | minor | 0 | 100 | 0 |
| Hurricane #1 | 24 August 1949 | USD 0.2 million | USD 12 million | 100 | 0 | 0 |
| Hurricane #2 (T.S.) | 29 August 1949 | minor | minor | 0 | 0 | 0 |
| T.S. #6 (T.D.) | 24 September 1947 | minor | minor | 0 | 0 | 0 |
| Hurricane #2 (T.S.) | 6 July 1946 | minor | minor | 0 | 0 | 0 |
| Hurricane #5 (T.D.) | 9 October 1946 | no damage | none | 0 | 0 | 0 |
| Hurricane #1 (T.S.) | 26 June 1945 | minor | minor | 0 | 0 | 0 |
| Hurricane #9 (T.S.) | 18 September 1945 | USD 2 million | USD 209 million | 0 | 100 | 0 |
| Hurricane #3 | 1 August 1944 | USD 2 million | USD 234 million | 30 | 0 | 70 |
| Hurricane #7 | 14 September 1944 | USD 1.5 million | USD 168 million | 50 | 0 | 50 |
| Hurricane #11 (T.S. | 20 October 1944 | minor | minor | 0 | 100 | 0 |
| T.S. #8 (T.D.) | 12 October 1942 | minor | minor | 0 | 0 | 0 |
| Hurricane #2 (T.D.) | 18 August 1939 | USD 1 million | USD 156 million | 80 | 20 | 0 |
| Hurricane #13 | 18 September 1936 | USD 0.1 million | USD 15 million | 20 | 0 | 80 |
| Hurricane #2 (T.S.) | 5 September 1935 | minor | minor | 0 | 0 | 0 |
| Hurricane #8 | 23 August 1933 | USD 0.25 million | USD 40 million | 30 | 20 | 50 |
| Hurricane #13 | 16 September 1933 | USD 4.5 million | USD 731 million | 50 | 0 | 50 |
| Hurricane #1 (T.D.) | 11 August 1928 | USD 0.05 million | USD 6 million | 100 | 0 | 0 |
| Hurricane #4 (T.S.) | 19 September 1928 | USD 2 million | USD 252 million | 0 | 100 | 0 |
| T.S. #5 | 3 October 1927 | no damage | none | 0 | 0 | 0 |
| Hurricane #2 (T.S.) | 2 December 1925 | no damage | none | 0 | 0 | 0 |
References
- Pielke, R.A., Jr.; Pielke, R.A., Sr. Hurricanes: Their Nature and Impacts on Society; John Wiley and Sons Press: London, UK, 1997; p. 301. [Google Scholar]
- Pielke, R.A., Jr.; Landsea, C.W. Normalized hurricane damages in the United States: 1925-95. Weather. Forecast. 1998, 13, 621–631. [Google Scholar] [CrossRef]
- Czajkowski, J.; Simmons, K.; Sutter, D. An analysis of coastal and inland fatalities in landfalling U.S. hurricanes. Nat. Hazards 2011, 59, 1513–1531. [Google Scholar] [CrossRef]
- Tang, Q.; Xie, L.; Lackmann, G.; Liu, B. Modeling the impacts of the large-scale atmospheric environment on inland flooding during the landfall of hurricane Floyd (1999). Adv. Meteorol. 2013, 9, 294956. [Google Scholar] [CrossRef]
- State Climate Office of North Carolina. A History of Hurricanes in North Carolina. 2000. Available online: http://www.nc-climate.ncsu.edu/ (accessed on 2 April 2025).
- Van Houtven, G.; Woollacott, J.; Bean, A. Climate Change and North Carolina: Near-Term Impacts on Society and RECOMMENDED Actions. RTI Technical Report. 2020. Available online: https://www.edf.org/sites/default/files/content/NC_Costs_of_Inaction.pdf (accessed on 2 April 2025).
- Elsberry, R.L. Predicting hurricane landfall precipitation: Optimistic and pessimistic views from the symposium on precipitation extremes. Bull. Am. Meteorol. Soc. 2002, 83, 1333–1339. [Google Scholar] [CrossRef]
- Liu, M.; Vecchi, G.A.; Smith, J.A.; Knutson, T.R. Causes of large projected increases in hurricane precipitation rates with global warming. npj Clim. Atmos. Sci. 2019, 2, 38. [Google Scholar] [CrossRef]
- Bao, C. Tropical Synoptic Meteorology; Science Press: Beijing, China, 1980; p. 268. [Google Scholar]
- Lonfat, M.; Rogers, R.; Marchok, T.; Marks, F.D., Jr. A Parametric Model for Predicting Hurricane Rainfall. Mon. Weather Rev. 2007, 135, 3086–3097. [Google Scholar] [CrossRef]
- Harr, P.A.; Elsberry, R.L. Extratropical transition of tropical cyclones over the western North Pacific: Part I: Evolution of structural characteristics during the transition process. Mon. Weather Rev. 2000, 128, 2613–2633. [Google Scholar] [CrossRef]
- Lu, P.; Lin, N.; Emanuel, K.; Chavas, D.; Smith, J. Assessing Hurricane Rainfall Mechanisms Using a Physics-Based Model: Hurricanes Isabel (2003) and Irene (2011). J. Atmos. Sci. 2018, 75, 2337–2358. [Google Scholar] [CrossRef]
- Palmén, E. Vertical circulation and release of kinetic energy during the development of Hurricane Hazel into an extratropical cyclone. Tellus 1958, 10, 1–23. [Google Scholar] [CrossRef]
- Klein, P.M.; Harr, P.A.; Elsberry, R.L. Extratropical transition of western North Pacific tropical cyclones: An overview and conceptual model of the transformation stage. Weather. Forecast. 2000, 15, 373–395. [Google Scholar] [CrossRef]
- Bosart, L.F.; Carr, F.H. A case study of excessive rainfall centered around Wellsville, New York, 20–21 June 1972. Mon. Weather Rev. 1978, 106, 348–362. [Google Scholar] [CrossRef]
- Bosart, L.F.; Lackmann, G.M. Postlandfall tropical cyclone reintensification in a weakly baroclinic environment: A case study of Hurricane David (September 1979). Mon. Weather Rev. 1995, 123, 3268–3289. [Google Scholar] [CrossRef]
- Kerns, B.W.; Chen, S.S. Inland flooding and rainfall from Hurricane Irene and Tropical Storm Lee (2011): Coupled atmosphere–wave–ocean model simulations and remote sensing and in situ observations with a machine learning tool. Weather. Forecast. 2023, 38, 677–697. [Google Scholar] [CrossRef]
- Changnon, S.A. The Great Flood of 1993: Causes, Impacts, and Responses; Westview Press: Boulder, CO, USA, 1996; p. 319. [Google Scholar]
- Ayoade, J.O. Chapter 8: Precipitation. In Introduction to Climatology for the Tropics; John Wiley & Sons: Hoboken, NJ, USA, 1983; pp. 125–139. [Google Scholar]
- Georgakakos, K.P.; Hudlow, M.D. Quantitative precipitation forecast techniques for use in hydrologic forecasting. Bull. Am. Meteorol. Soc. 1984, 65, 1186–1200. [Google Scholar] [CrossRef]
- Rinehart, R.E. Radar for Meteorologists; Rinehart Publications: New York, NY, USA, 2004; p. 482. [Google Scholar]
- Serafin, R.J.; Wilson, J.W. Operational weather radar in the United States: Progress and opportunity. Bull. Am. Meteorol. Soc. 2000, 81, 501–518. [Google Scholar] [CrossRef]
- Cerveny, R.S.; Newman, L.E. Climatological relationships between tropical cyclones and rainfall. Mon. Weather Rev. 2000, 128, 3329–3336. [Google Scholar] [CrossRef]
- Wood, E.C.; Frank, W.M. Numerical predictions of rainfall in Hurricane Floyd (1999). In Proceedings of the 24th Hurricanes & Tropical Meteorology Conference, Miami, FL, USA, 22 May 2000; pp. 159–160. [Google Scholar]
- Glickman, T.S. Glossary of Meteorology; American Meteorological Society: Boston, MA, USA, 2000; p. 855. [Google Scholar]
- Landsea, C.W.; Franklin, J.L. Atlantic hurricane database uncertainty and presentation of a new database format. Mon. Weather Rev. 2013, 141, 3576–3592. [Google Scholar] [CrossRef]
- NOAA NCEP Tropical Cyclone Rainfall Database. Available online: https://www.wpc.ncep.noaa.gov/tropical/rain/tcrainfall.html (accessed on 2 April 2025).
- United State Geological Survey (USGS). National Assessment of Hurricane-Induced Coastal Erosion Hazards. South Atlantic Salvo to Duck. 2024. Available online: https://coastal.er.usgs.gov/data-release/doi-F7M906Q6/ (accessed on 2 April 2025).
- Federal Emergency Management Agency (FEMA). North Carolina Economic Impact of Hurricane Floyd. Available online: http://www.fema.gov/library/a_1292nc.htm (accessed on 2 April 2025).
- National Climate Data Center (NCDC). Storm Data: Hurricane Damage Estimates. 2001. Available online: http://www.ncdc.noaa.gov/ (accessed on 2 April 2025).
- Wilmington News Archives, 2001: New Hanover Library. Available online: https://libguides.nhcgov.com/ (accessed on 2 April 2025).
- Miami Herald. (1992, September 24). Available online: https://www.newspapers.com/paper/the-miami-herald/881/ (accessed on 2 April 2025).
- News & Observer. Archived Stories on Hurricane Floyd. Available online: http://news-observer.com/ (accessed on 5 August 2001).
- Barnes, J. North Carolina’s Hurricane History; The University of North Carolina Press: Chapel Hill, NC, USA, 1998; p. 256. [Google Scholar]
- Gall, M.; Borden, K.A.; Cutter, S.L. When do losses count? Six fallacies of natural hazards loss data. Bull. Am. Meteorol. Soc. 2007, 90, 799–810. [Google Scholar] [CrossRef]
- Bureau of Economic Analysis. Fixed Reproducible Tangible Wealth in the United States, 1925–1989; U.S. Government Printing Office: Washington, DC, USA, 1993. [Google Scholar]
- Simpson, R.H. The Hurricane Disaster Potential Scale. Weatherwise 1974, 27, 169–186. [Google Scholar]
- National Hurricane Center. Storm Summaries and Tracks. 2001. Available online: http://www.nhc.noaa.gov/ (accessed on 2 April 2025).
- National Ocean Service (NOS). Tidal Gage Data. 2001. Available online: https://co-ops.nos.noaa.gov/ (accessed on 2 April 2025).
- United States Geological Survey (USGS). Two Months of Flooding in Eastern North Carolina, September–October 1999: Hydrologic, Water-Quality, and Geologic Effects of Hurricanes Dennis, Floyd, and Irene. (Water Resources Investigations Report 00-4093); U.S. Geological Survey: Raleigh, NC, USA, 2000; p. 47. [Google Scholar]
- Hilderband, D.C. Risk Assessment of North Carolina Tropical Cyclones (1925–2000). Master’s Thesis, North Carolina State University, Raleigh, NC, USA, 2002. Available online: https://repository.lib.ncsu.edu/server/api/core/bitstreams/219506e0-d9b4-49ff-ab68-c760ce353a68/content (accessed on 2 April 2025).
Figure 1.
Annual number of tropical cyclones impacting North Carolina from 1925 to 2000.
Figure 1.
Annual number of tropical cyclones impacting North Carolina from 1925 to 2000.
Figure 2.
Annual North Carolina tropical cyclone unadjusted damage totals from 1925 to 2000. Damage totals are not normalized and therefore represent the values at the time the damage occurred.
Figure 2.
Annual North Carolina tropical cyclone unadjusted damage totals from 1925 to 2000. Damage totals are not normalized and therefore represent the values at the time the damage occurred.
Figure 3.
The annual North Carolina tropical cyclone damage totals from 1925 to 2000 normalized to 2000 values. Normalization takes into account inflation, changes in wealth and housing trends.
Figure 3.
The annual North Carolina tropical cyclone damage totals from 1925 to 2000 normalized to 2000 values. Normalization takes into account inflation, changes in wealth and housing trends.
Figure 4.
Comparison of the annual North Carolina tropical cyclone normalized damage totals from 1925 to 2000 based on housing vs. population factors. Damage totals are normalized to 2000 values.
Figure 4.
Comparison of the annual North Carolina tropical cyclone normalized damage totals from 1925 to 2000 based on housing vs. population factors. Damage totals are normalized to 2000 values.
Figure 5.
Maximum recorded rainfall from 31 direct landfalling tropical cyclones along the North Carolina coast (1925–2000). Rainfall data were provided by the NCDC and included 38 official weather stations. The list of tropical cyclones used in this analysis is provided in
Appendix A,
Appendix B and
Appendix C. Five tropical cyclones were omitted because they only briefly brushed the coast.
Figure 6.
Maximum rainfall distribution of direct landfalling North Carolina tropical cyclones (1925–2000).
Figure 6.
Maximum rainfall distribution of direct landfalling North Carolina tropical cyclones (1925–2000).
Figure 7.
Maximum rainfall distribution of direct landfalling North Carolina hurricanes (1925–2000).
Figure 7.
Maximum rainfall distribution of direct landfalling North Carolina hurricanes (1925–2000).
Figure 8.
Hurricane Floyd (1999) location and flood levels (expressed in feet above flood stage) along the Neuse and Tar–Pamlico watershed areas of worst flood damage.
Figure 8.
Hurricane Floyd (1999) location and flood levels (expressed in feet above flood stage) along the Neuse and Tar–Pamlico watershed areas of worst flood damage.
Figure 9.
North Carolina tropical cyclone intensity distribution from 1925 to 2000. Intensity is based on the Saffir–Simpson scale. In total, 36 tropical cyclones made direct landfall in North Carolina from 1925 to 2000.
Figure 9.
North Carolina tropical cyclone intensity distribution from 1925 to 2000. Intensity is based on the Saffir–Simpson scale. In total, 36 tropical cyclones made direct landfall in North Carolina from 1925 to 2000.
Figure 10.
North Carolina tropical cyclone damage assessment (1925–2000). (a) All categories; (b) Cat.-1–2 hurricane damage assessment (1925–2000). (c) Cat.-3–4 hurricane damage assessment (1925–2000) (no Cat.-5 landfall in North Carolina during the study period).
Figure 10.
North Carolina tropical cyclone damage assessment (1925–2000). (a) All categories; (b) Cat.-1–2 hurricane damage assessment (1925–2000). (c) Cat.-3–4 hurricane damage assessment (1925–2000) (no Cat.-5 landfall in North Carolina during the study period).
Table 1.
Damage statistics from direct landfalling North Carolina tropical cyclones (1925–2000) normalized by to 2000 values based on housing data.
Table 1.
Damage statistics from direct landfalling North Carolina tropical cyclones (1925–2000) normalized by to 2000 values based on housing data.
| Category of Storm | Mean Damage * | Total Damage * | Total Damage (%) |
|---|
| Tropical Depressions (2) | 4.5 | 9 | 0.02 |
| Tropical Storms (9) | 14 | 125 | 0.34 |
| Hurricane Cat. 1 (8) | 383 | 3062 | 8.2 |
| Hurricane Cat. 2 (6) | 1327 | 7962 | 21.4 |
| Hurricane Cat. 3 (10) | 1549 | 15,487 | 41.7 |
| Hurricane Cat. 4 (1) | 10,520 | 10,520 | 28.3 |
| Hurricane Cat. 5 (0) | 0 | 0 | 0 |
| Total Damage (36) | USD 37,165 million |
Table 2.
Damage statistics from direct landfalling North Carolina tropical cyclones (1925–2000) based on population data.
Table 2.
Damage statistics from direct landfalling North Carolina tropical cyclones (1925–2000) based on population data.
| Category of Storm | Mean Damage * | Total Damage * | Total Damage (%) |
|---|
| Tropical Depressions (2) | 3.5 | 7 | 0.02 |
| Tropical Storms (9) | 12 | 108 | 0.35 |
| Hurricane Cat. 1 (8) | 330 | 2643 | 8.7 |
| Hurricane Cat. 2 (6) | 1317 | 7902 | 26 |
| Hurricane Cat. 3 (10) | 1235 | 12,348 | 40.6 |
| Hurricane Cat. 4 (1) | 7390 | 7390 | 24.3 |
| Hurricane Cat. 5 (0) | 0 | 0 | 0 |
| Total Damage (36) | USD 30,398 million |
Table 3.
Comparison of loss distributions between Hurricane Andrew and Floyd (%).
Table 3.
Comparison of loss distributions between Hurricane Andrew and Floyd (%).
| Storm Name | Private Property | Agriculture | Environment/Health | Government Property | Education (Schools) | Business Jobs |
|---|
| Andrew | 59 | 4 | 8 | 4 | 2 | 23 |
| Floyd | 73 | 17 | 3 | 4 | 2 | 1 |
Table 4.
Rainfall volume of 11 tropical cyclones affecting North Carolina.
Table 4.
Rainfall volume of 11 tropical cyclones affecting North Carolina.
Tropical
Cyclone | Date of
Landfall | Total Rain Volume
(Cubic Miles) | Maximum
Recorded Rainfall | Intensity: | Ave. Speed
Over NC (kt) | Mid-Latitude Interactions |
|---|
| Floyd | 16 September 1999 | 4.14 | 24.06″ | Cat. 2 | 22 | jet/trough; coastal front |
| Dennis | 4 September 1999 | 3.67 | 19.05″ | T.S. | 8 (drifted off coast) | weak steering current |
| Bonnie | 26 August 1998 | 1.62 | 11.0″ | Cat. 2 | 6 | weak steering current |
| Fran | 6 September 1996 | 3.14 | 12.65″ | Cat. 3 | 16 | - |
| Bertha | 12 July 1996 | 1.69 | 11.43″ | Cat. 2 | 16 | - |
| Diana | 13 September 1984 | 2.76 | 18.98″ | Cat. 1 | 3 (drifted off coast) | embedded cool environment |
| Ginger | 30 September 1971 | 2.7 | 10.69″ | Cat. 1 | 4 | - |
| Doria | 27 August 1971 | 1.33 | 9.43″ | T.S. | 18 | - |
| T.S. #6 | 14 September 1961 | 0.47 | 2.49″ | T.D. | 19 | - |
| Diane | 17 August 1955 | 2.12 | 7.4″ | Cat. 1 | 11 | - |
| Hazel | 15 October 1954 | 2.57 | 11.25″ | Cat. 4 | 40 | intensifying trough to west |
Table 5.
Significant North Carolina tropical cyclone storm surge/coastal erosion events (1950–2000).
Table 5.
Significant North Carolina tropical cyclone storm surge/coastal erosion events (1950–2000).
Tropical
Cyclone | Landfall
Date | Maximum Recorded
Storm Surge | Intensity | Storm Path
at Coastline | Ave. Speed
Over NC (kt) | Other Factors |
|---|
| H. Floyd | 16 September 1999 | 10 ft. @ Masonboro/Long B. | Cat. 2 | angled | 22 | extremely large storm |
| T.S. Dennis | 4 September 1999 | 5–6 ft. @Hatteras/Duck | T.S. | perpendicular | 8 (drifted off coast) | storm stalled off coast causing severe erosion |
| H. Bonnie | 26 August 1998 | 9 ft. @ Manteo | Cat. 2 | near perpendicular | 6 | |
| H. Fran | 6 September 1996 | 12–16 ft. @ Wrightsville B. | Cat. 3 | near perpendicular | 16 | dune system previously destroyed by Bertha |
| H. Bertha | 12 July 1996 | 6 ft. @ Elizabeth City | Cat. 2 | angled | 16 | |
| H. Hugo | 22 September 1989 | 8–10 ft. @ Brunswick County | Cat. 4 | perp. to South Carolina | 26 | |
| H. Gloria | 27 September 1985 | 6–8ft. @ Cherry Point | Cat. 3 | brushed coast | 22 | |
| H. Josephine | 12 October 1984 | na | Cat. 2 | offshore | - | hit at astronomical high tide; strong high to north |
| H. Diana | 13 September 1984 | 7 ft. @ Carolina B. | Cat. 3 | perpendicular | 3 (drifted off coast) | storm off coast for 3 days |
| H. Donna | 12 September 1960 | 6–8 ft. reported unknown | Cat. 3 | angled | 11 | |
| H. Connie | 12 August 1955 | 7–8ft. @ Southport to Nags Head | Cat. 3 | brushed coast | 8 | |
| H. Hazel | 15 October 1954 | 10–17 ft. reported unknown | Cat. 4 | perpendicular | 40 | |
| Disclaimer/Publisher’s Note: The statements, opinions and data contained in all publications are solely those of the individual author(s) and contributor(s) and not of MDPI and/or the editor(s). MDPI and/or the editor(s) disclaim responsibility for any injury to people or property resulting from any ideas, methods, instructions or products referred to in the content. |
© 2025 by the authors. Licensee MDPI, Basel, Switzerland. This article is an open access article distributed under the terms and conditions of the Creative Commons Attribution (CC BY) license (https://creativecommons.org/licenses/by/4.0/).


