Article

Characteristics and Driving Mechanisms of Heatwaves in China During July and August

1
College of Surveying and Geo-Informatics, North China University of Water Resources and Electric Power, Zhengzhou 450046, China
2
Key Laboratory of Mine Spatio-Temporal Information and Ecological Restoration, Ministry of Natural Resources, Jiaozuo 454003, China
3
Hydraulics and Geotechnics Section, KU Leuven, Kasteelpark Arenberg 40, BE-3001 Leuven, Belgium
*
Author to whom correspondence should be addressed.
Atmosphere 2025, 16(4), 434; https://doi.org/10.3390/atmos16040434
Submission received: 6 March 2025 / Revised: 4 April 2025 / Accepted: 6 April 2025 / Published: 8 April 2025
(This article belongs to the Special Issue Extreme Weather Events in a Warming Climate)

Abstract

:
Against the backdrop of global warming, heatwaves in China have become more frequent, posing serious risks to public health and socio-economic stability. However, existing identification methods lack precision, and the driving mechanisms of heatwaves remain unclear. This study applies the Excess Heat Factor (EHF) to characterize heatwaves across China from 2013 to 2023, analyzing their spatiotemporal patterns and exploring key drivers such as atmospheric circulation and soil moisture. Key findings reveal significant regional differences: (1) Frequency and Duration—The southeastern coastal regions (e.g., the Yangtze River Delta) experience higher annual heatwave frequencies (1.75–3.5 events) but shorter durations (6.5–8.5 days). In contrast, the arid northwest has both frequent (1.5–3.5 events per year) and prolonged (8.5–14.5 days) heatwaves, while the Tibetan Plateau sees weaker and shorter events. (2) Driving Factors—Heatwaves in the Yangtze River Delta are primarily driven by an intensified subtropical high, leading to subsidence and clear-sky conditions. In Fujian, anomalous low-level winds enhance heat accumulation, while coastal areas show strong soil moisture–temperature coupling, where drier soils intensify warming. Conversely, soil moisture has a weaker influence on the Tibetan Plateau, suggesting a dominant atmospheric control. It is important to note that the EHF index used in this study does not directly account for humidity, which may limit its applicability in humid regions. Additionally, the ERA5 and ERA5-Land reanalysis data were not systematically validated against ground observations, introducing potential uncertainties.

1. Introduction

Global warming is a key focus of contemporary climate science research. According to the Sixth Assessment Report of the IPCC (2023), the global average temperature has risen by approximately 1.1 °C over the past century [1]. This warming has led to a significant increase in the frequency, duration, and intensity of heatwaves [2,3,4]. Notable events include the European heatwaves of 2003, 2006 [5,6,7], and 2015 [8,9,10]; the extreme heatwave that swept across Central and Eastern Europe and western Russia in 2010 [11,12,13]; and the severe heat event in India in 2015 [14]. It is expected that such extreme events are likely to increase in the future [8,15,16,17]. China has been affected by heatwave events multiple times throughout its history, with regions such as North China and East China being particularly affected [18,19]. Recent studies indicate that heatwave events in China, especially those with spatiotemporal correlations, have significantly increased in terms of impact range, intensity, duration, and shifting [20,21,22,23]. This trend underscores the urgency and importance of accurately identifying and analyzing heatwave events in China.
Currently, heatwave identification primarily relies on absolute temperature thresholds (e.g., daily maximum temperature ≥ 35 °C) or relative thresholds (e.g., the 90th percentile) [24,25,26,27,28]. The absolute threshold method is simple and intuitive but fails to account for regional climate variations [29]. For instance, a temperature of 35 °C may have vastly different impacts in northern and southern Chinese cities. The relative threshold method is more flexible and adaptable to regional differences, making it widely used in heatwave identification and definition [30,31]. However, it does not fully consider the cumulative effects of nighttime temperatures or human adaptation factors [32,33].
To overcome these limitations, this study employs the Excess Heat Factor (EHF) [32,34] to identify heatwave events and quantify their intensity. EHF not only accounts for extreme daytime temperatures but also incorporates the cumulative effects of nighttime heat and human adaptation to high-temperature environments [33,35,36,37], enabling a more comprehensive and accurate assessment of heatwave intensity [32,38]. In addition to heatwave identification, investigating the driving factors behind heatwaves is crucial. Understanding key meteorological drivers enhances heatwave forecasting and warnings [39].
Current research on heatwave drivers mainly focuses on large-scale climate modes [40,41], sea surface temperature (SST) variations [42,43,44], and urbanization-related heatwave effects [45,46,47,48]. Large-scale climate patterns significantly influence heatwave characteristics: ENSO events markedly increase the frequency, duration, and spatial extent of heatwaves [49], while the positive phase of the AMO has intensified heatwave occurrences over the past two decades through warming effects and enhanced internal atmospheric variability [40]. Rising SSTs are positively correlated with heatwave activity, with moderate heatwaves showing higher sensitivity to SST changes [43]. Urbanization exacerbates heatwave risks through the urban heat island effect; daytime intensification is mainly due to differences in surface evapotranspiration, while nighttime effects are largely driven by increased anthropogenic heat emissions and strengthened warm advection [50]. Despite these advances, the specific roles of atmospheric circulation and soil moisture in heatwave formation and evolution remain insufficiently explored [51,52,53,54].
In summary, this study aims to identify heatwave events in China during July–August from 2013 to 2023 using the EHF, and to analyze their spatial patterns and driving mechanisms. The specific objectives are as follows: (1) to quantify heatwave intensity with EHF, addressing limitations of traditional threshold methods by incorporating heat accumulation and nighttime temperature; (2) to reveal spatial distribution, frequency, duration, and intensity patterns of heatwaves, highlighting regional disparities; and (3) to investigate the roles of atmospheric circulation anomalies and soil moisture variations in driving heatwave events.

2. Materials and Methods
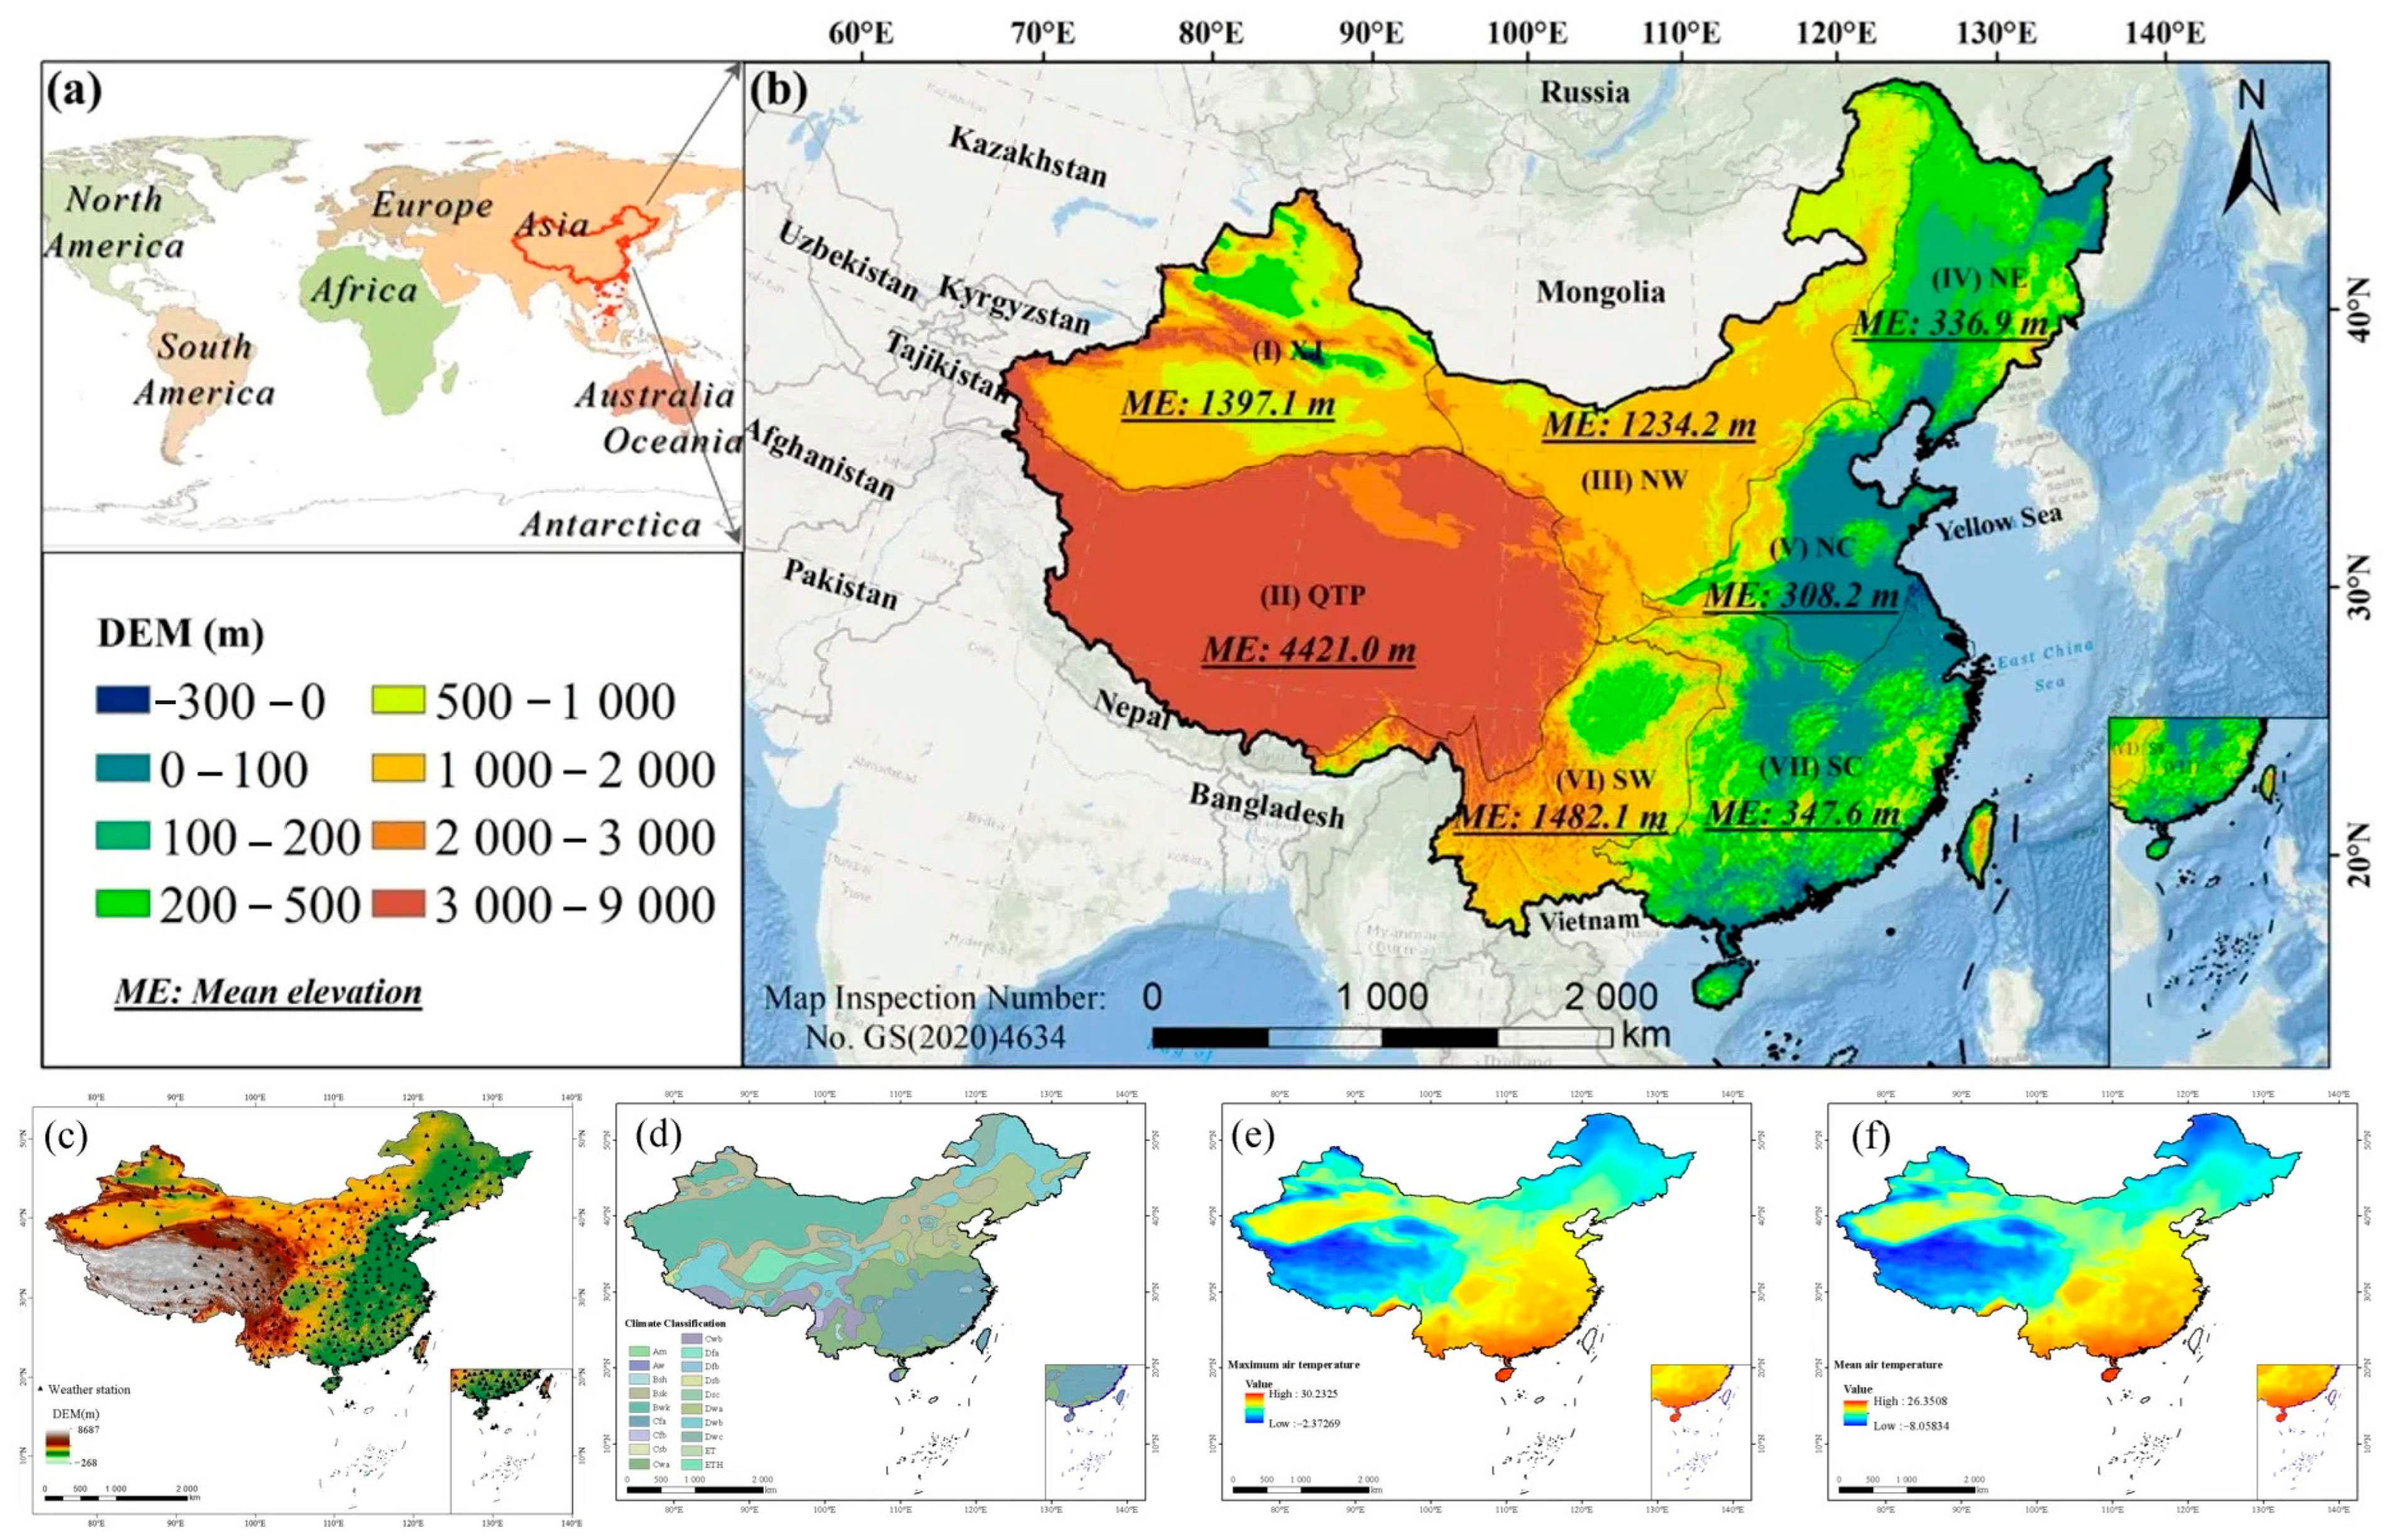
2.1. Study Area

China is located in East Asia, bordered by the Pacific Ocean to the east, with a complex and diverse topography (Figure 1). The terrain is characterized by a high western region and a low eastern region, forming a step-like distribution [55,56,57]. Approximately 67% of the country consists of plateaus, mountains, and hills, including the Tibetan Plateau and the Loess Plateau, while the remaining 33% is mainly composed of basins and plains, such as the Sichuan Basin and the North China Plain [58]. China’s complex terrain features (including vast mountain ranges and plateaus) interact with global climate change, amplifying the frequency and intensity of heatwaves in recent years. This dual effect has created substantial challenges across multiple sectors: reduced crop yields in agriculture, exacerbated urban heat island effects, and elevated health risks particularly for vulnerable populations [59]. With its vast territory and long-term accumulation of climate observation data, China provides unique and rich data resources for in-depth studies on the driving mechanisms and impacts of heatwaves. Since the 1960s, China’s mean annual air temperature (MAT) has shown a significant upward trend, with an accelerated warming rate observed after 1980 [60]. Over the past 50 years, the average air temperature in most cities has increased by 0.5 °C, resulting in a total MAT rise of 1.44 °C across China. The warming rate generally increases from south to north, except for the Tibetan Plateau [61]. Multi-model ensemble projections based on the highest-ranked models (BMME) indicate that by the end of the 21st century, the annual growth rates of air temperature and precipitation in China will continue to rise. The projected increase under the SSP5-8.5 scenario is higher than that under the SSP2-4.5 scenario, with particularly pronounced warming in high-latitude and high-altitude regions [62].

2.2. Data Collection

The air temperature data used in this study were obtained from the National Centers for Environmental Information (NCEI) under the U.S. National Oceanic and Atmospheric Administration (NOAA). The dataset includes daily meteorological observations from global stations spanning from 1929 to the present. This study selected daily maximum, minimum, and average air temperature data in China from 2013 to 2023, covering over 400 meteorological stations nationwide. We screened over 400 meteorological stations and selected those with continuous temperature observations for July–August from 2013 to 2023. After quality control, we removed records with missing values, standardized temperature units, and calculated the daily average temperatures for each station. The processed data were then converted into standard NetCDF format, yielding a dataset of 388 qualified stations for analysis. The choice of July–August as the study period is based on the climate zoning standards issued by the China Meteorological Administration (GB/T 35221-2017) [64], which indicate that heatwave events in most regions of China primarily occur from mid-July to mid-August. This study utilizes NOAA meteorological station data to calculate EHF. To explore the relationship between large-scale atmospheric circulation and heatwaves, this study utilized the fifth-generation reanalysis dataset (ERA5) provided by the European Centre for Medium-Range Weather Forecasts (ECMWF). Daily data on geopotential height and wind fields were extracted from the ERA5 dataset, with a spatial resolution of 0.25° × 0.25°. In addition, soil moisture data were sourced from the ERA5-Land reanalysis dataset provided by ECMWF, with daily surface soil moisture data (0–10 cm below the surface) from 2013 to 2023 to support the study of the impact of soil moisture on heatwaves. The wind fields data from ERA5 and the soil moisture data from ERA5-Land show good consistency with ground-based observations [65,66,67]. Terrain data were obtained from the 2022 release of the Global Bathymetric Chart of the Oceans (GEBCO), which includes a global digital elevation model (DEM) covering land elevation and ocean depth. The spatial resolution is in arc-seconds, with units in meters, and the coordinate projection system is GCS_WGS_1984.

2.3. Methodology

2.3.1. Calculation Method of the EHF

In previous studies, various methods have been proposed to define the concept of heatwaves [68,69]. However, a unified standard for the exact definition of heatwaves has not yet been established [70,71,72]. Existing methods primarily use absolute or relative air temperature thresholds combined with duration criteria. The absolute threshold method applies fixed air temperature standards (e.g., 35 °C), but overlooks regional variability. The relative threshold method, based on local climate percentiles (e.g., 90th or 95th), is more adaptable but has limitations: it neglects cumulative heat exposure, lacks a comprehensive intensity measure, and ignores physiological adaptation. Additionally, heatwave duration definitions vary widely (1–7 days) [72], leading to inconsistencies. Given that most studies currently focus on the health impacts of heatwaves, and existing research suggests that daily mean air temperature is often a better predictor of health outcomes than daily maximum air temperature [73], the EHF method—calculated based on daily mean air temperature—offers several advantages. It accounts for the cumulative effects of heat exposure, incorporates human adaptation factors, and provides a more comprehensive representation of the actual impact mechanisms of extreme heat on human health. Therefore, this study adopts the EHF method to define and identify heatwave events. EHF has been widely used in heat event research in regions such as Australia and Europe [74,75,76]. The EHF was proposed by Nairn et al., and its core concept is based on the notions of “excess heat” and “heat stress” [36,69].The EHF not only considers the abnormal air temperature rise over three days relative to the previous month, but also incorporates the 95th percentile threshold in climatology [77]. This allows it to comprehensively reflect the key characteristics of heatwaves, including abnormal air temperature increases, exceedance of specific climatic thresholds, and the accumulation of heat prior to the onset of the heatwave. Although the EHF calculation does not directly incorporate humidity parameters, it indirectly reflects the influence of relative humidity by using the average daily air temperature as the simple mean of the daily maximum and minimum air temperature. This is because changes in relative humidity directly affect the diurnal air temperature range, which is reflected in the daily average air temperature values [32,75].
The calculation of EHF for each meteorological station is based on two excess heat indices, namely E H I s i g and E H I a c c l . Before computing these indices, it is necessary to determine the extreme heat threshold and daily average temperature for each station.
In this study, the period from 2013 to 2023 was set as the reference period, and the extreme heat threshold for each station was determined using the following method: First, the daily average temperature series from 2013 to 2023 for each station was arranged in ascending order. Then, the 95th percentile value was taken as the extreme heat threshold for that station. The method for calculating the daily average temperature at each station is shown in Equation (1).
T i = T max + T m i m 2
After obtaining the daily average temperature and the extreme heat threshold for each station, E H I s i g and E H I a c c l are calculated accordingly. Their calculation methods are shown in Equations (2) and (3), respectively.
E H I s i g = T i + T i 1 + T i 2 3 T 95
In the equations, T i represents the daily average temperature on day i , and T 95 denotes the extreme heat threshold for each station. The choice of a three-day period for calculating the heatwave index is based on studies of the delayed effects of high air temperature on human health. Research has shown that the lag period varies by region: approximately one day in Melbourne [78] and three days in Adelaide [19]. Due to higher summer air temperature in Adelaide, the residents have a greater tolerance for heat, consistent with observations in Barcelona [79] and London [80]. Nairn and Fawcett [36], based on data from Langlois et al. [34], confirmed that consecutive extreme high-air temperature days significantly increase mortality rates.
A positive E H I s i g indicates that the three-day average air temperature is warmer than the local annual climate anomaly; if it is negative or zero, the air temperature does not meet the threshold for a heatwave event.
E H I a c c l = T i + T i 1 + T i 2 3 T i 3 + + T i 32 30
In the equation, T i is defined as above. E H I a c c l can be referred to as the adaptation index, which evaluates heat adaptation by comparing the three-day daily average air temperature with the recent 30-day daily average air temperature. Human physiological adaptation to high air temperature typically takes 2 to 6 weeks [36]. This study adopts a 30-day period as the reference for recent air temperature based on related research [32]. Based on the calculated E H I s i g and E H I a c c l , the EHF is defined as follows:
E H F = max 1 , E H I a c c l × E H I s i g
If E H I a c c l ≥ 1, it is directly used as a multiplier to emphasize the lack of human adaptation to the heatwave. If E H I a c c l < 1, its value is set to 1, in which case E H F = E H I s i g , reflecting only the absolute temperature anomaly. A positive E H F value defines the heatwave conditions on day i . The occurrence of a heatwave requires the EHF to be positive for at least three consecutive days (i.e., E H F for three consecutive days).

2.3.2. Definition of the Characteristics of Heatwaves

Based on the EHF, we have defined the key characteristics of heatwave events, including Heatwave Number (HWN), Heatwave Frequency (HWF), Heatwave Duration (HWD), and Heatwave Intensity (HWI), with specific definitions provided in Table 1. Among these, HWN represents the total number of heatwave events during the study period; HWF refers to the total number of days identified as heatwave days within a season (i.e., the sum of days within periods where EHF is positive for at least three consecutive days), used to reflect the overall duration of the heatwave’s impact on the season; HWD is calculated by determining the duration of the longest heatwave event in each season, revealing the potential sustained threat of heatwaves; HWI records the peak intensity of heatwave events in a season, reflecting the extreme strength of the heatwaves. It is important to note that HWF, as a measure of the total number of days involved in heatwave events, is influenced by both HWN and HWD, indicating that the frequency and duration of heatwaves are equally important in assessing their overall impact.

3. Results

3.1. Extreme Heat Thresholds

Figure 2 shows the extreme heat thresholds for meteorological stations in China from July to August during 2013 to 2023. This threshold is calculated by arranging the daily average temperatures from meteorological stations for 2013–2023 in ascending order and determining the 95th percentile value, which represents the extreme high-temperature threshold for each station. These thresholds are influenced by multiple factors such as terrain, atmospheric circulation, and soil moisture, resulting in significant regional variations. In the eastern regions, particularly in the Yangtze River Basin, the eastern coastal areas, and the southern regions, the extreme heat thresholds are generally higher, ranging between 25 °C and 35 °C, with some areas exceeding 35 °C. These regions experience high summer air temperatures with prolonged durations, and the heat thresholds in the Yangtze River Basin and surrounding areas are particularly notable. The eastern coastal areas, influenced by the maritime climate, are hot and humid during the summer, and the extreme heat thresholds are also at a relatively high level. The southern regions, especially in South China near the equator, experience frequent high air temperature year-round, with high extreme heat thresholds, indicating that these areas are consistently and widely affected by heatwave events [25]. In the northwestern regions, such as the Tarim Basin, Hexi Corridor, and Junggar Basin, the extreme heat thresholds are similarly high. These areas are characterized by low rainfall, high evaporation, and rapid surface air temperature rise. Combined with dry soil and sparse vegetation cover, extreme heat events are particularly severe [81,82]. The extreme heat thresholds on the Tibetan Plateau are relatively low, but in low-altitude river valleys such as the Qaidam Basin and the Yarlung Tsangpo Valley, the extreme heat thresholds are relatively higher. These areas are flat, surrounded by high mountains, and are prone to the formation of local heat low-pressure systems, leading to significant air temperature increases [83]. Additionally, sparse vegetation cover and intense solar radiation further exacerbate the frequency and intensity of extreme heat events [84]. Overall, the extreme heat thresholds in China from 2013 to 2023 exhibited a distinct east–high, west–low spatial pattern. The highest thresholds were observed in the Yangtze River Basin, eastern coastal areas, and southern China, followed by the arid regions in the northwest. In contrast, most areas of the Tibetan Plateau had much lower thresholds, with higher values only in certain river valleys. This indicates that eastern and northwestern China are key regions at high risk of extreme heat.

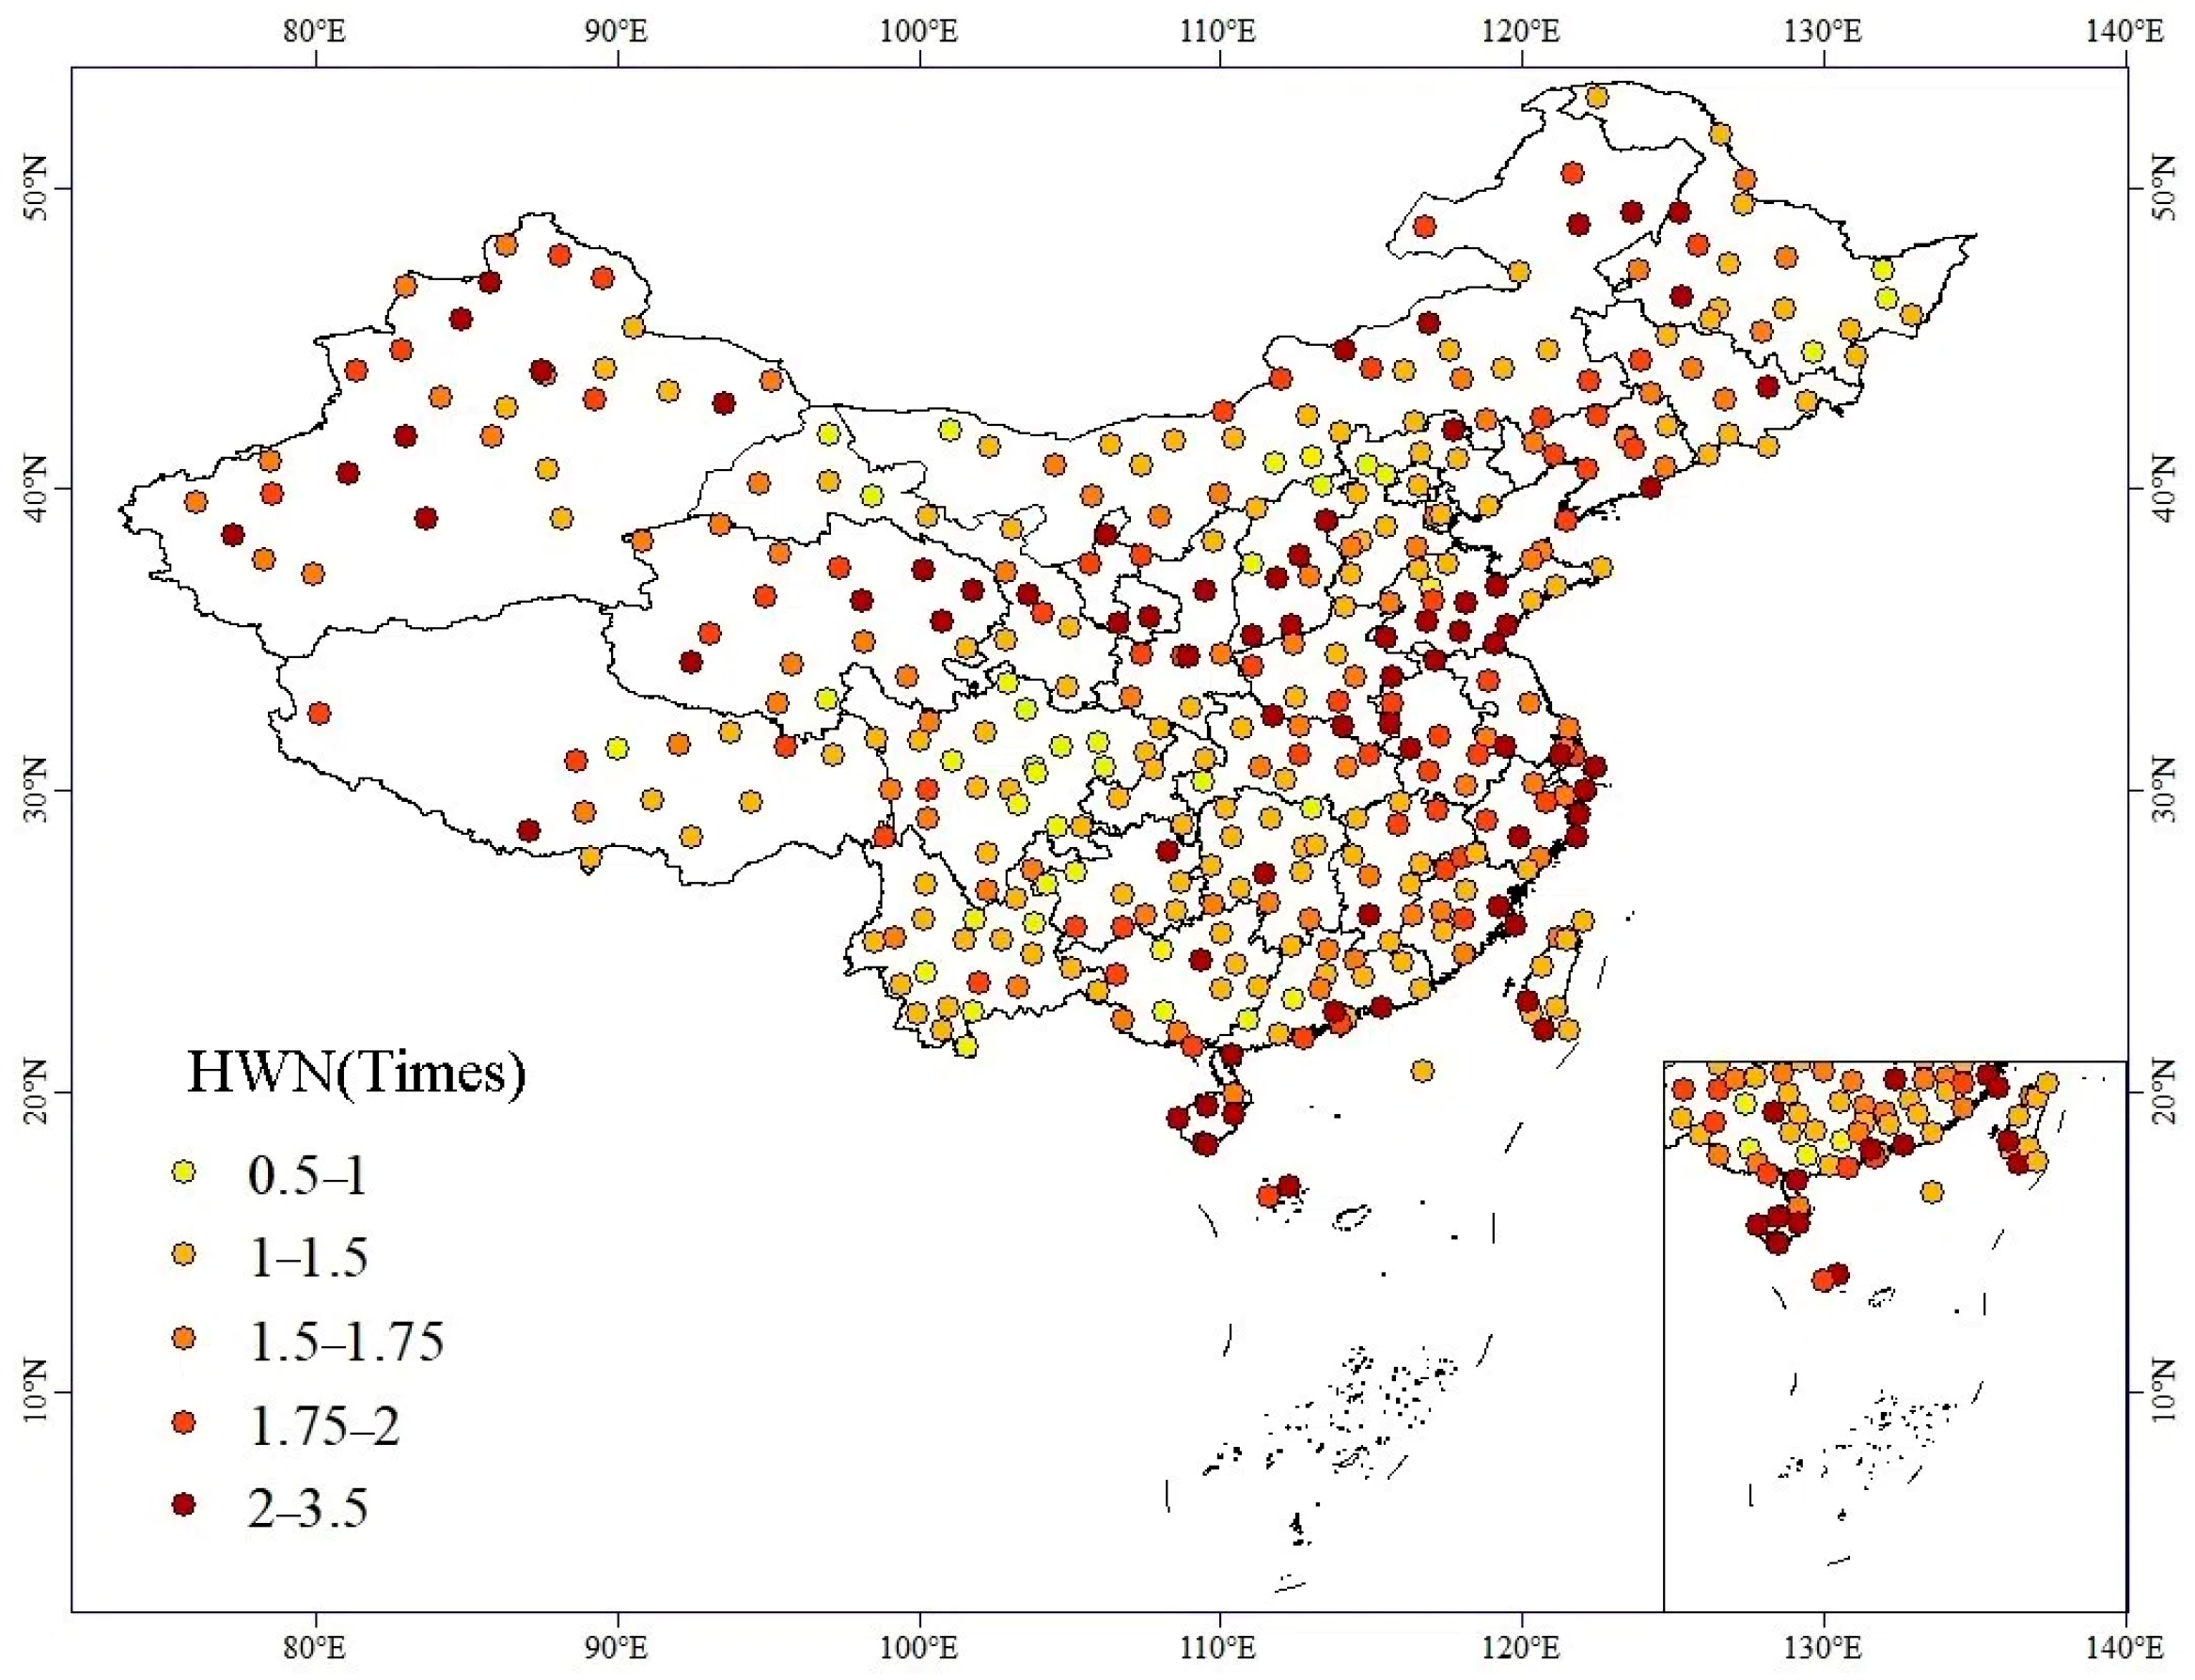
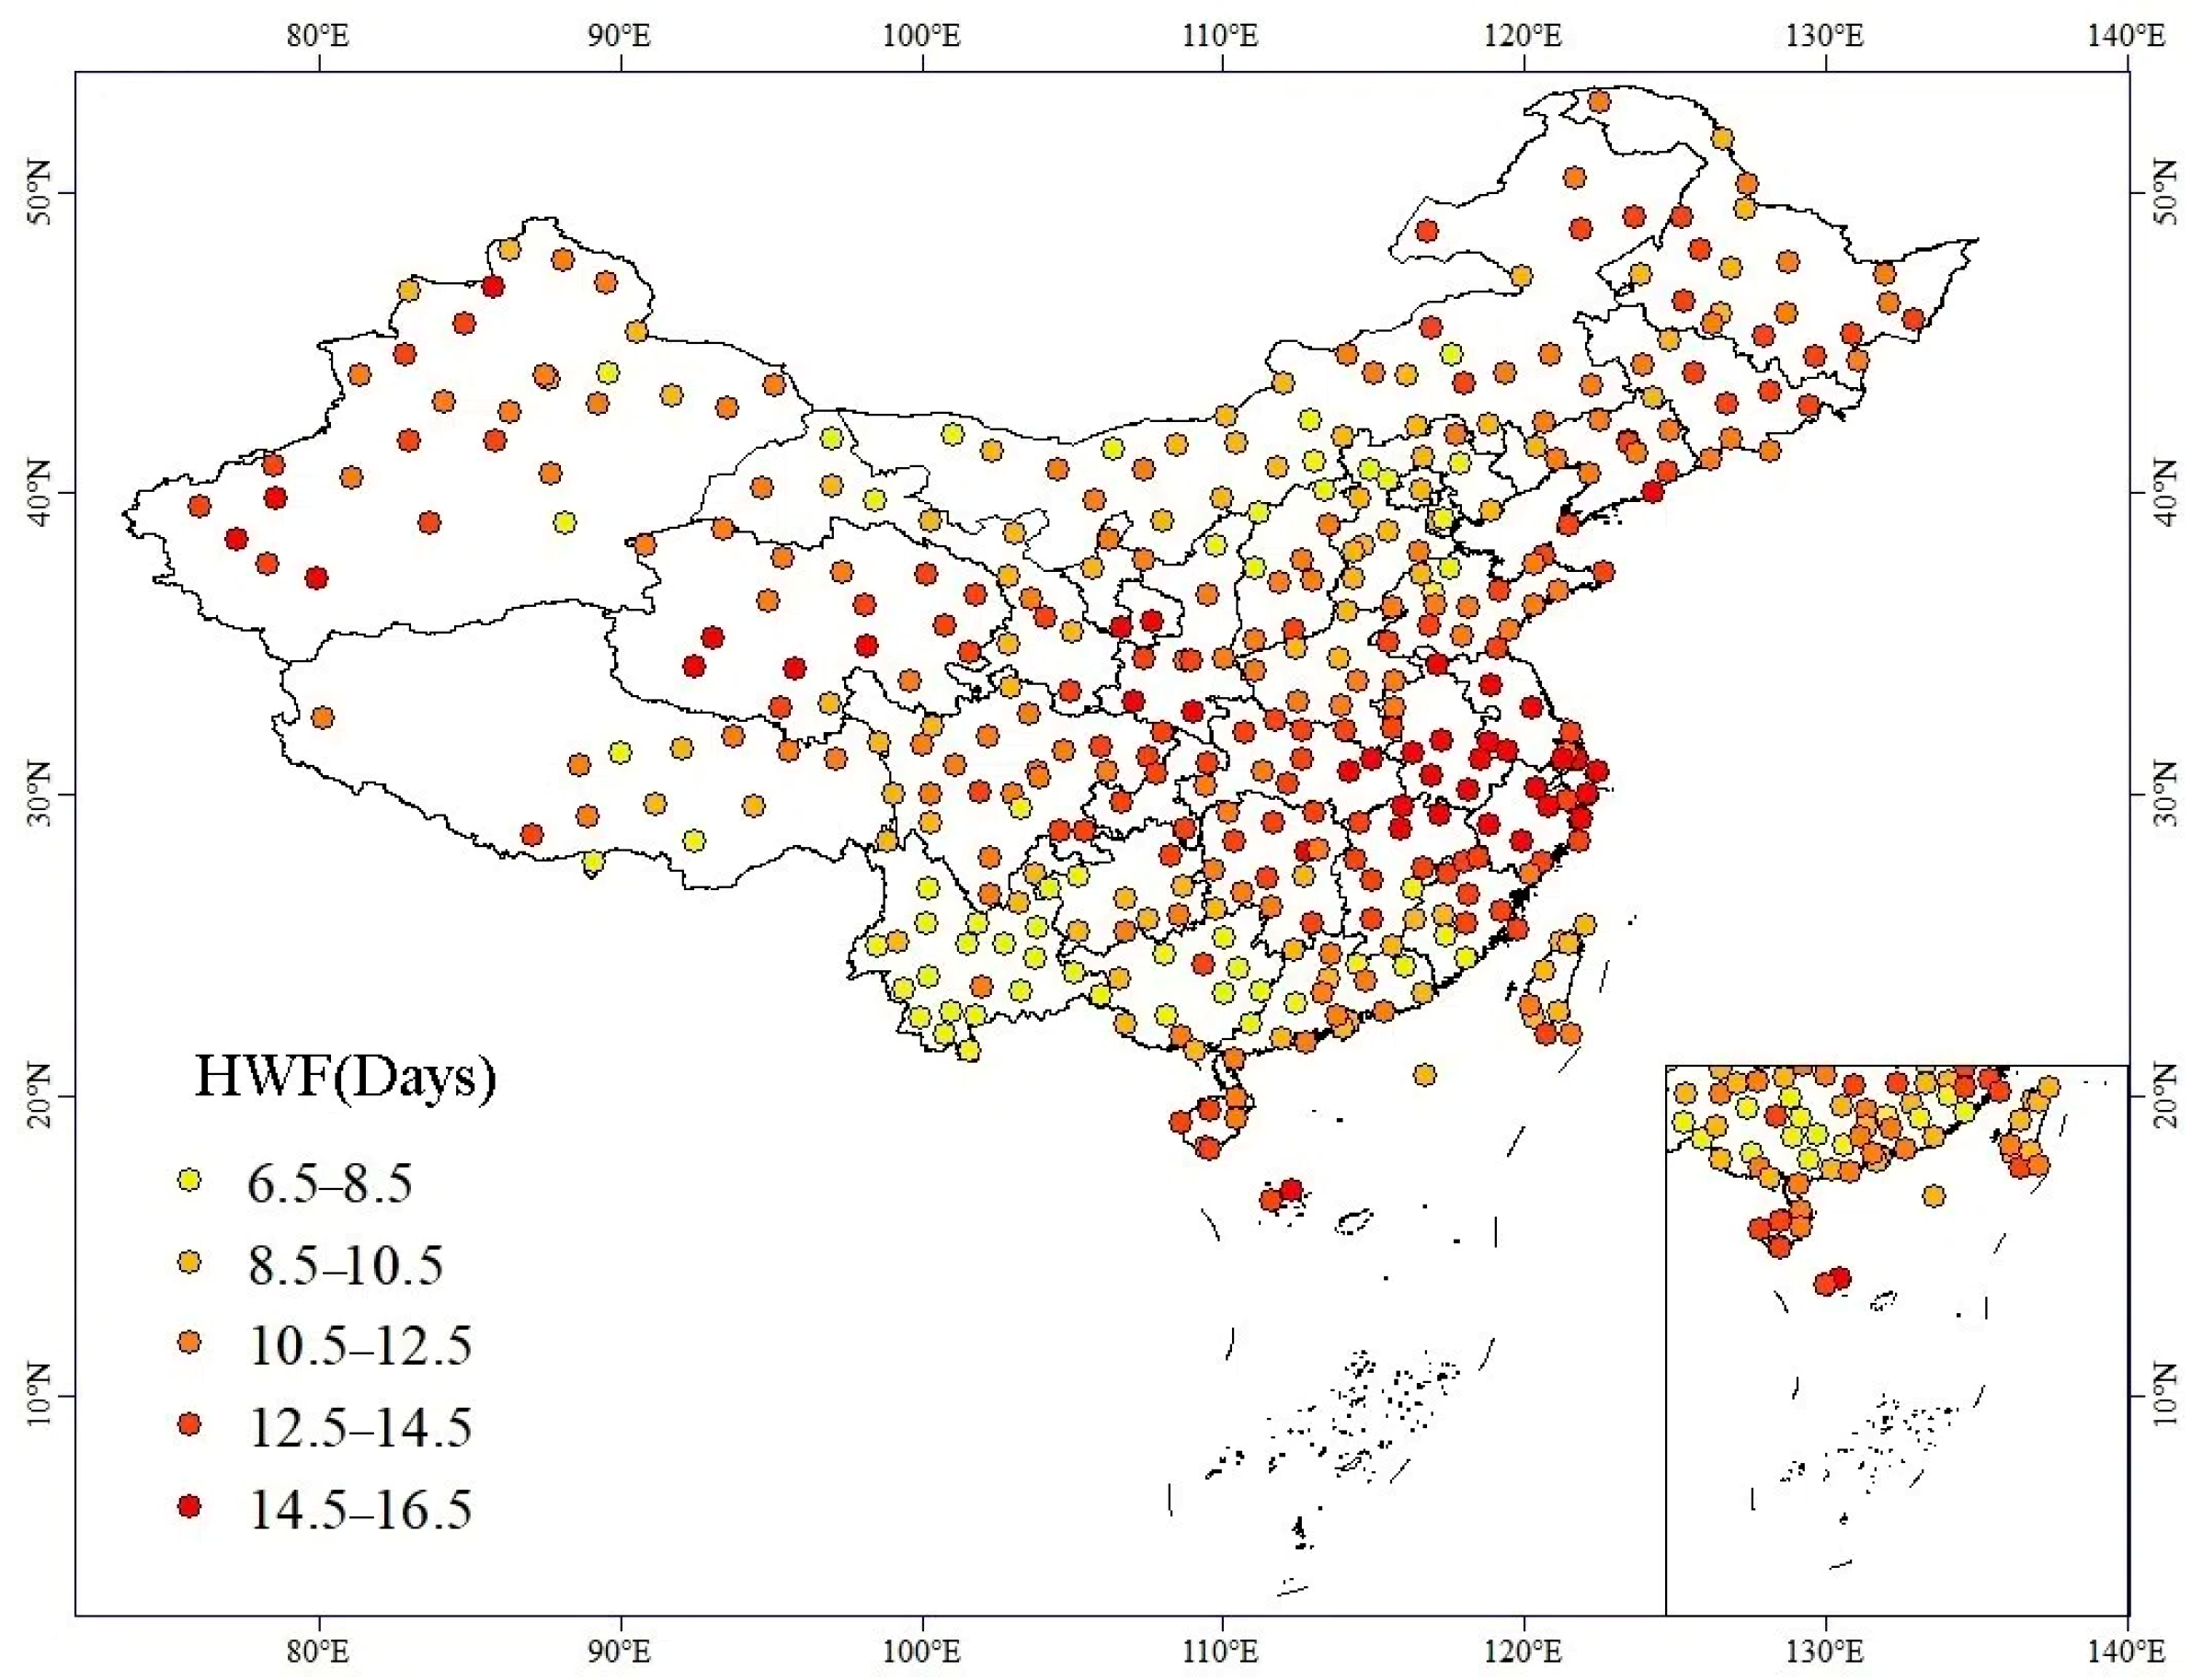
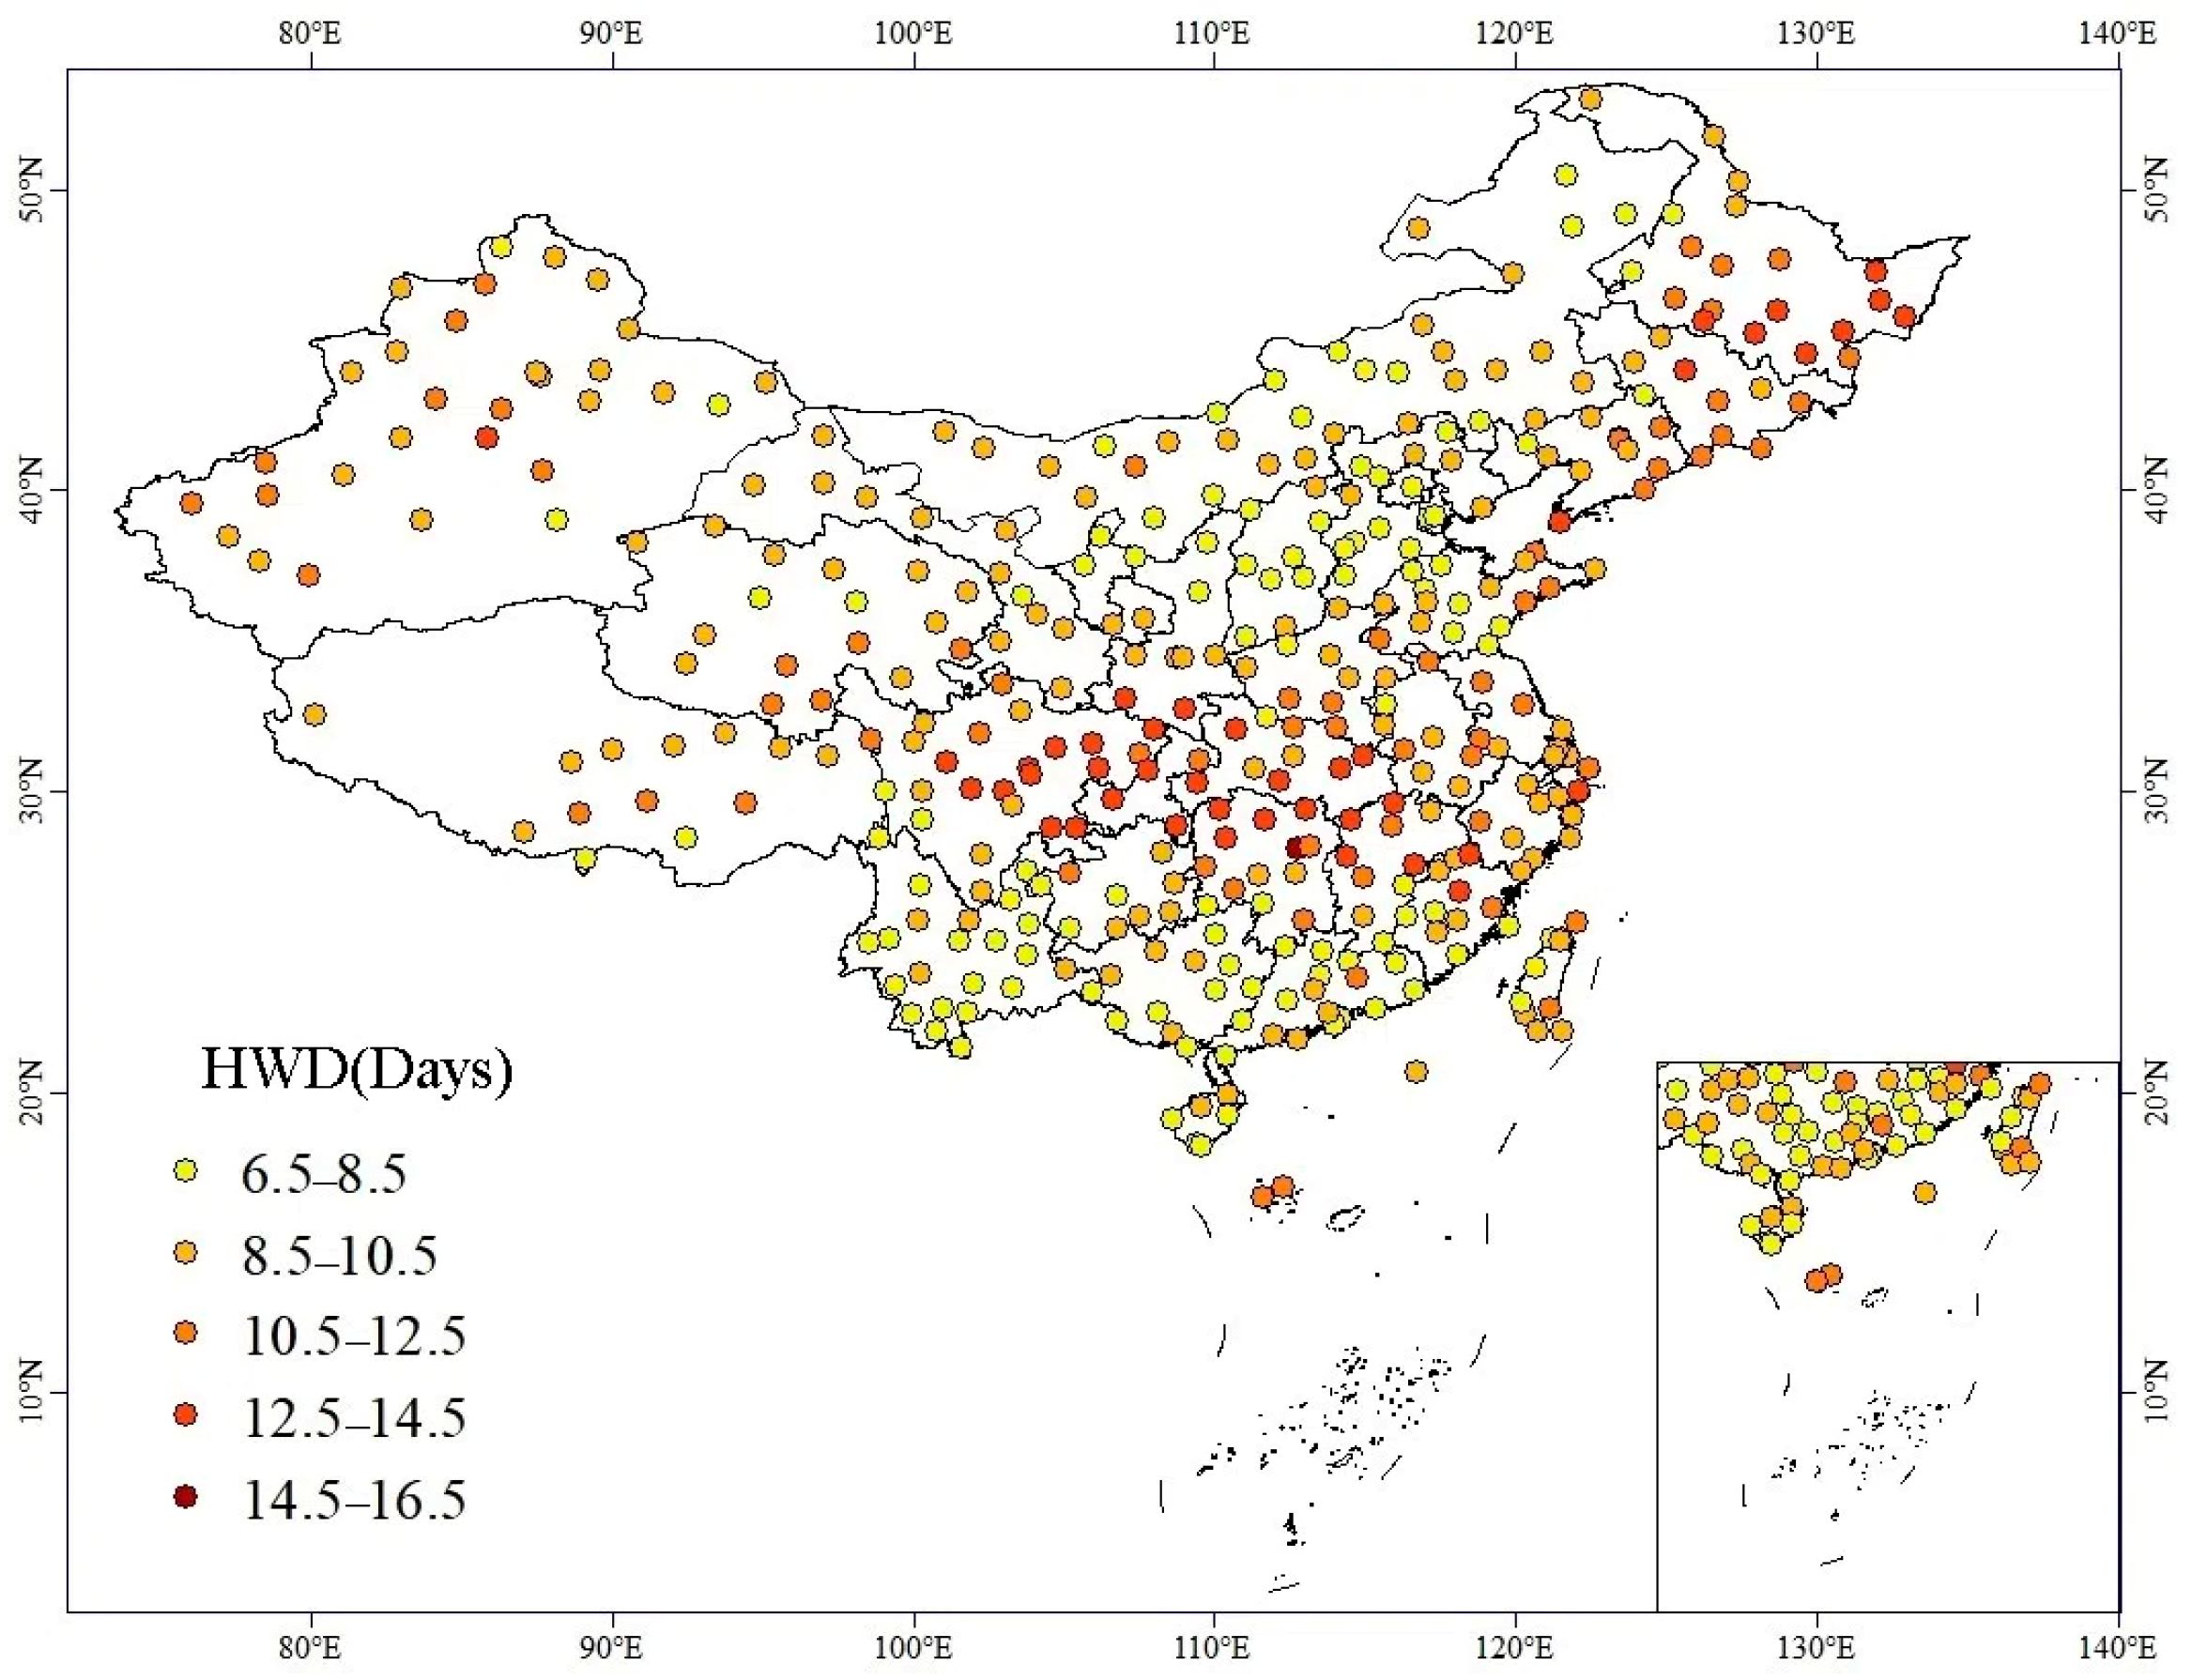
3.2. Heatwave and Its Characterization Analysis

Based on the EHF, we obtained key characteristics of heatwave events, including the HWN, HWF, HWD, and HWI. Their spatial distribution is shown in Figure 3, Figure 4, Figure 5 and Figure 6. Figure 3 shows the spatial distribution of the number of HWN. From the figure, it can be observed that the regions with higher HWN are in eastern China, including North-Central China, East China, Hainan Province, and the northwestern Xinjiang region. In these areas, the number of heatwave events typically ranges from 2 to 3.5 per year. In contrast, the number of heatwave events is lower in the Qinghai Province and the eastern Tibetan Plateau, where it occurs only 0.5 to 1 time per year. This indicates that heatwaves occur more frequently in eastern and northwestern monsoon regions, while the western plateau and mountainous areas are less frequently affected by heatwaves. In most areas nationwide, the number of heatwave events ranges from 1 to 2 per year. Figure 4 presents the distribution of HWF. The data show that the regions with the highest average HWF per year are still concentrated in the eastern regions, particularly East China and Hainan Province, where the annual average days range from 12.5 to 14.5 days. This indicates that these regions not only experience a high HWF but also have prolonged durations. In comparison, the southwest region has a lower HWF per year, typically ranging from 6.75 to 9 days. The eastern part of the northwest region generally experiences heatwaves for 6.75 to 11.25 days per year, while the Tibetan Plateau has a wider range of HWF, fluctuating between 9 and 13.5 days per year. Notably, regions experiencing two or more heatwave events annually generally have an average HWF exceeding 13.5, such as Zhejiang Province and Hainan Province, where the average HWF can even reach 15.75, reflecting the persistence and frequency of extreme heat events in these regions. Analysis of HWN and HWF indicates that eastern China, northern central China, Hainan, and Xinjiang are high-frequency heatwave regions, experiencing 2 to 3.5 events per year. In contrast, the western plateau regions show the lowest frequency (0.5–1 event per year). HWF in eastern China and Hainan reaches 12.5–15.75 days per year, significantly higher than in other regions. Notably, although the HWN over the Tibetan Plateau is low, certain areas still exhibit HWF values of 9–13.5 days per year, suggesting that individual heatwave events there may last longer.
From Figure 5, the spatial distribution of HWD can be observed. The Tibetan Plateau and southern China, including Yunnan, Guangdong, and Guangxi, generally have shorter average HWD, with most areas being below 8.5 days, indicating that these regions experience fewer prolonged heatwave events. In stark contrast, the Tarim Basin in northwest China and the Sichuan and Chongqing regions in the west have generally longer heatwave durations, with most areas ranging between 10.5 and 14.5 days. Notably, the spatial distribution of HWF and HWD shows certain similarities: low-value regions are concentrated in Yunnan and parts of North China, while high-value areas are mainly found in the eastern monsoon regions, particularly along the southeastern coast and in the Sichuan and Chongqing areas in the west. Figure 6 displays the spatial distribution of HWI, which shows a clear latitudinal variation. Specifically, the HWI is relatively low in the southern regions, indicating that heatwave events in these areas are milder. In contrast, the HWI is higher in the northern regions, reflecting that heatwaves in these areas are more intense.
Combined analysis of HWF, HWD, HWN, and HWI reveals significant spatial heterogeneity in heatwave events across China, with distinct regional patterns: (1) Eastern China, northern Central China, and Hainan show the highest heatwave frequency (HWN: 2–3.5 events/year) and total days (HWF: 12.5–15.75 days/year), along with relatively long durations (HWD: 10.5–14.5 days), forming “high-frequency–long-duration” risk zones. These may be linked to monsoon stagnation and intensified urban heat island effects. (2) Northwestern arid regions (e.g., the Tarim Basin in Xinjiang) and the Sichuan Basin are characterized by strong heatwaves (high HWI) and extended durations (HWD: 10.5–14.5 days), with moderate to high numbers (HWN: 2–3.5 events/year), displaying a “long-duration–high-intensity” pattern. This may result from the combined effects of arid climates and basin topography. (3) The Tibetan Plateau experiences the weakest heatwave activity overall (HWN: 0.5–1 event/year, HWD < 8.5 days), yet some valley areas (e.g., the Yarlung Tsangpo River valley) can accumulate up to 9–13.5 heatwave days per year. This suggests that strong solar radiation and local topography may prolong individual heatwave events. (4) Southern coastal regions (e.g., Guangdong, Guangxi, Yunnan) exhibit a “high-frequency–short-duration–low-intensity” pattern, with higher event numbers (HWN: 1–2 events/year), short durations (HWD < 8.5 days), and low intensity, largely influenced by maritime regulation.
Additionally, heatwave intensity in northern China shows a marked latitudinal gradient, generally higher than in the south, likely due to larger diurnal temperature ranges and stronger radiation under a continental climate. Overall, China’s heatwave risk types demonstrate clear east–west divergence (frequency and duration dominate in the east; intensity in the northwest) and north–south contrast (higher intensity in the north; lower in the south).

3.3. Relationship Between Heatwaves, Atmospheric Circulation, and Soil Moisture

This study also selected several typical regions as key research areas, including the Yangtze River Delta, Fujian, Guangdong, Guangxi, Hainan, and the Tibetan Plateau (see Figure 7).

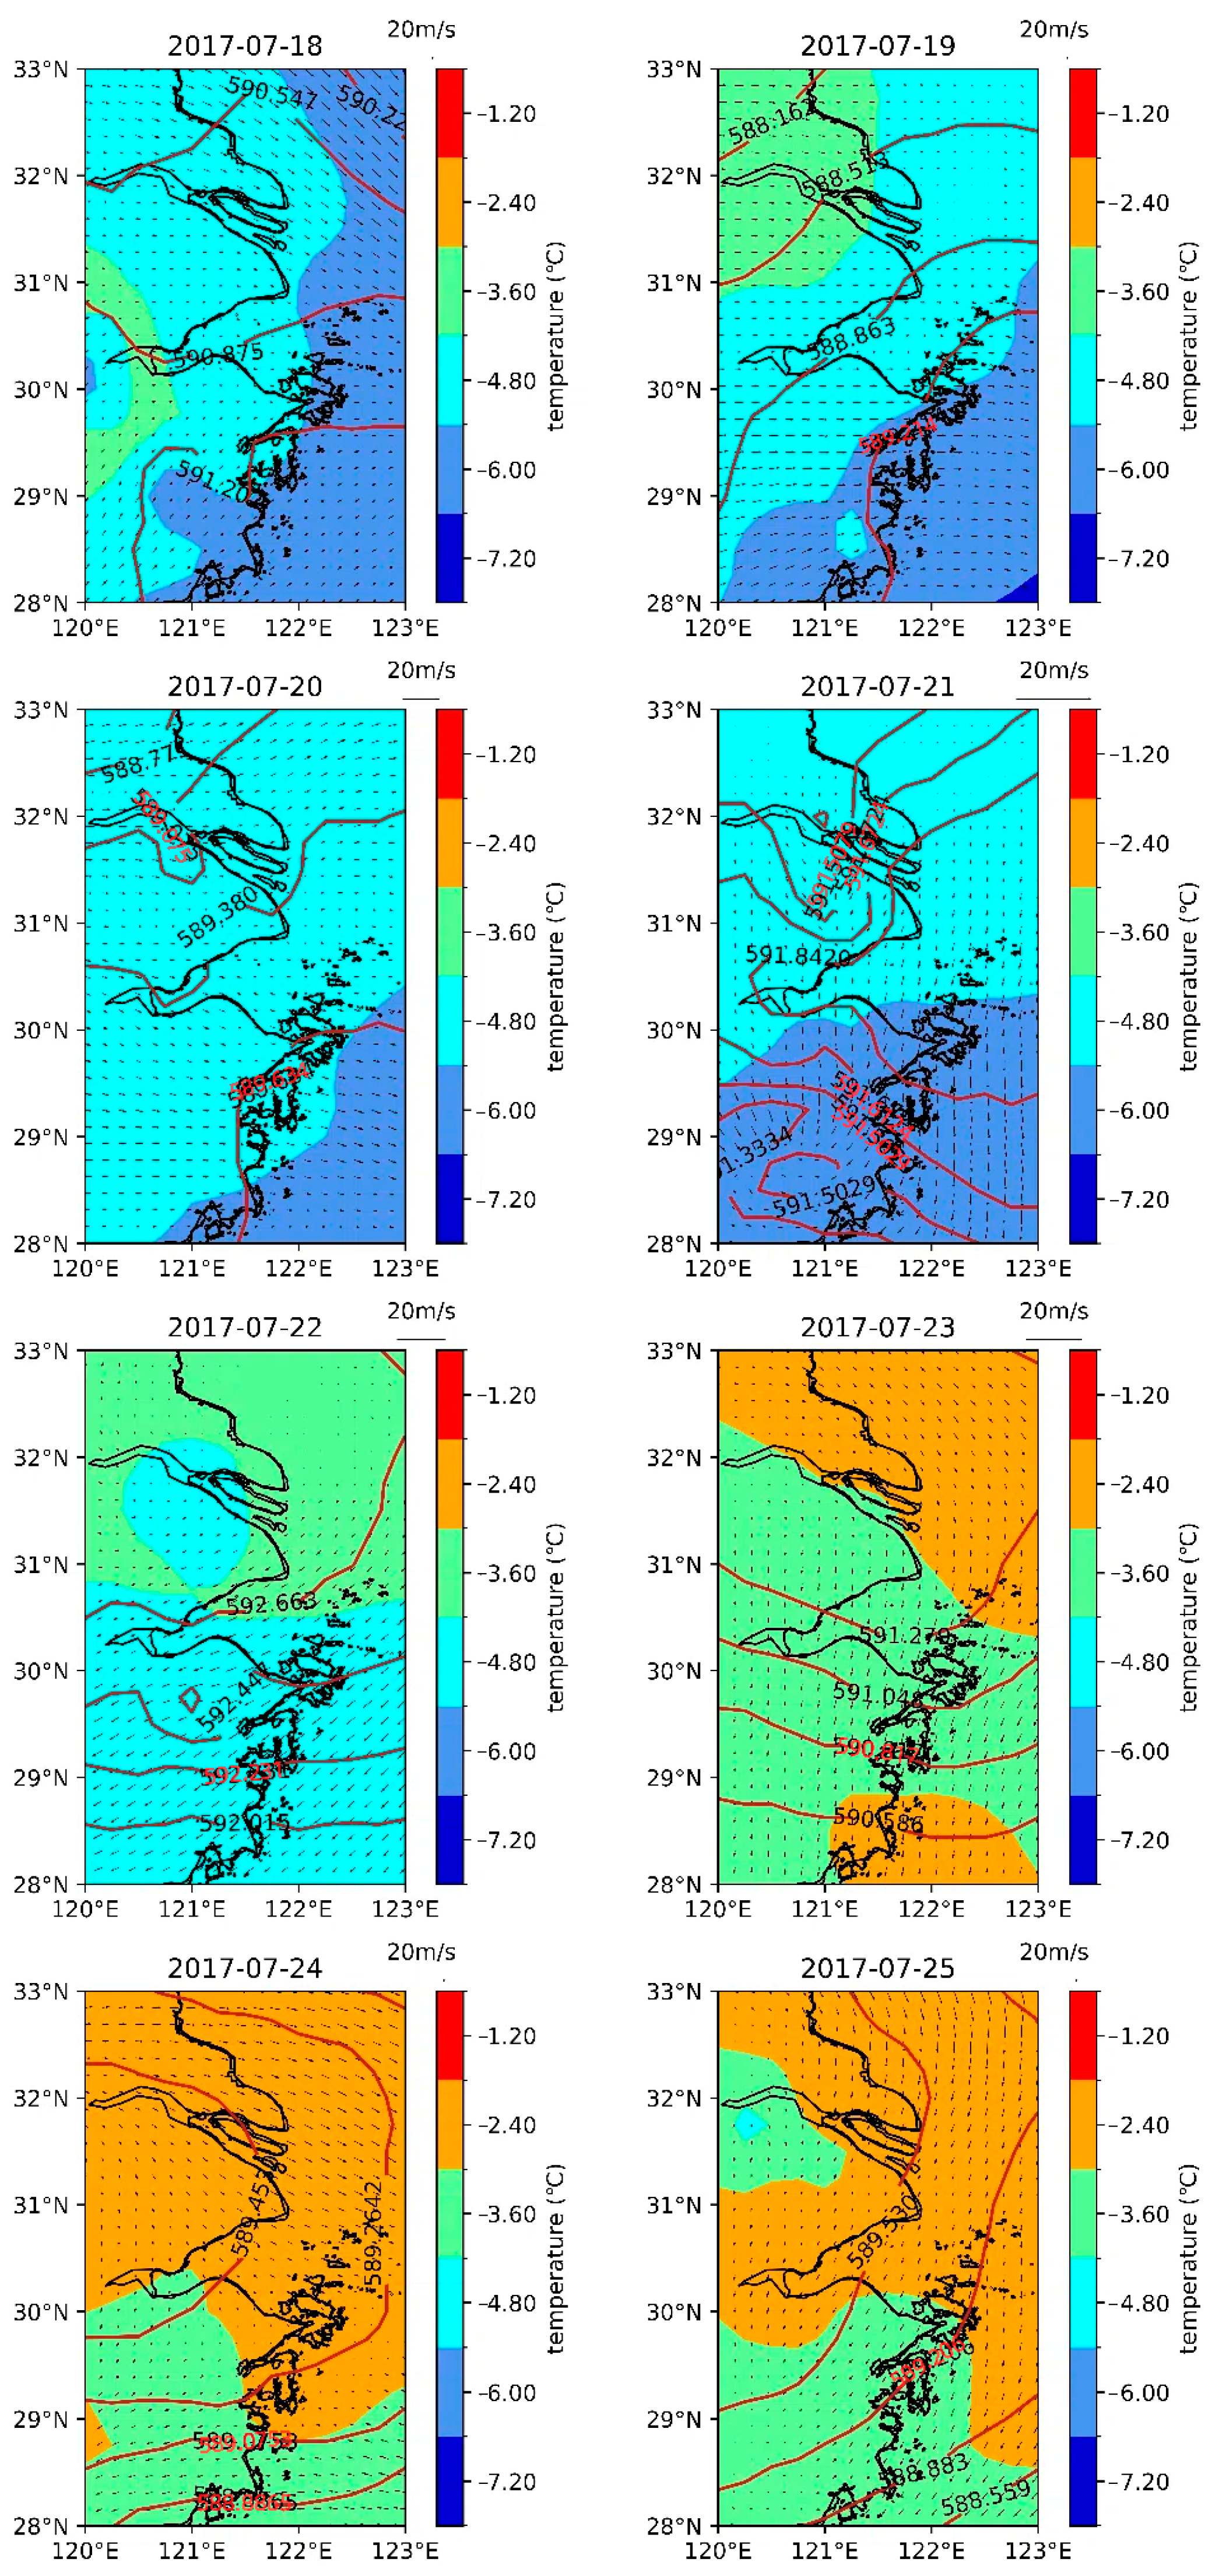
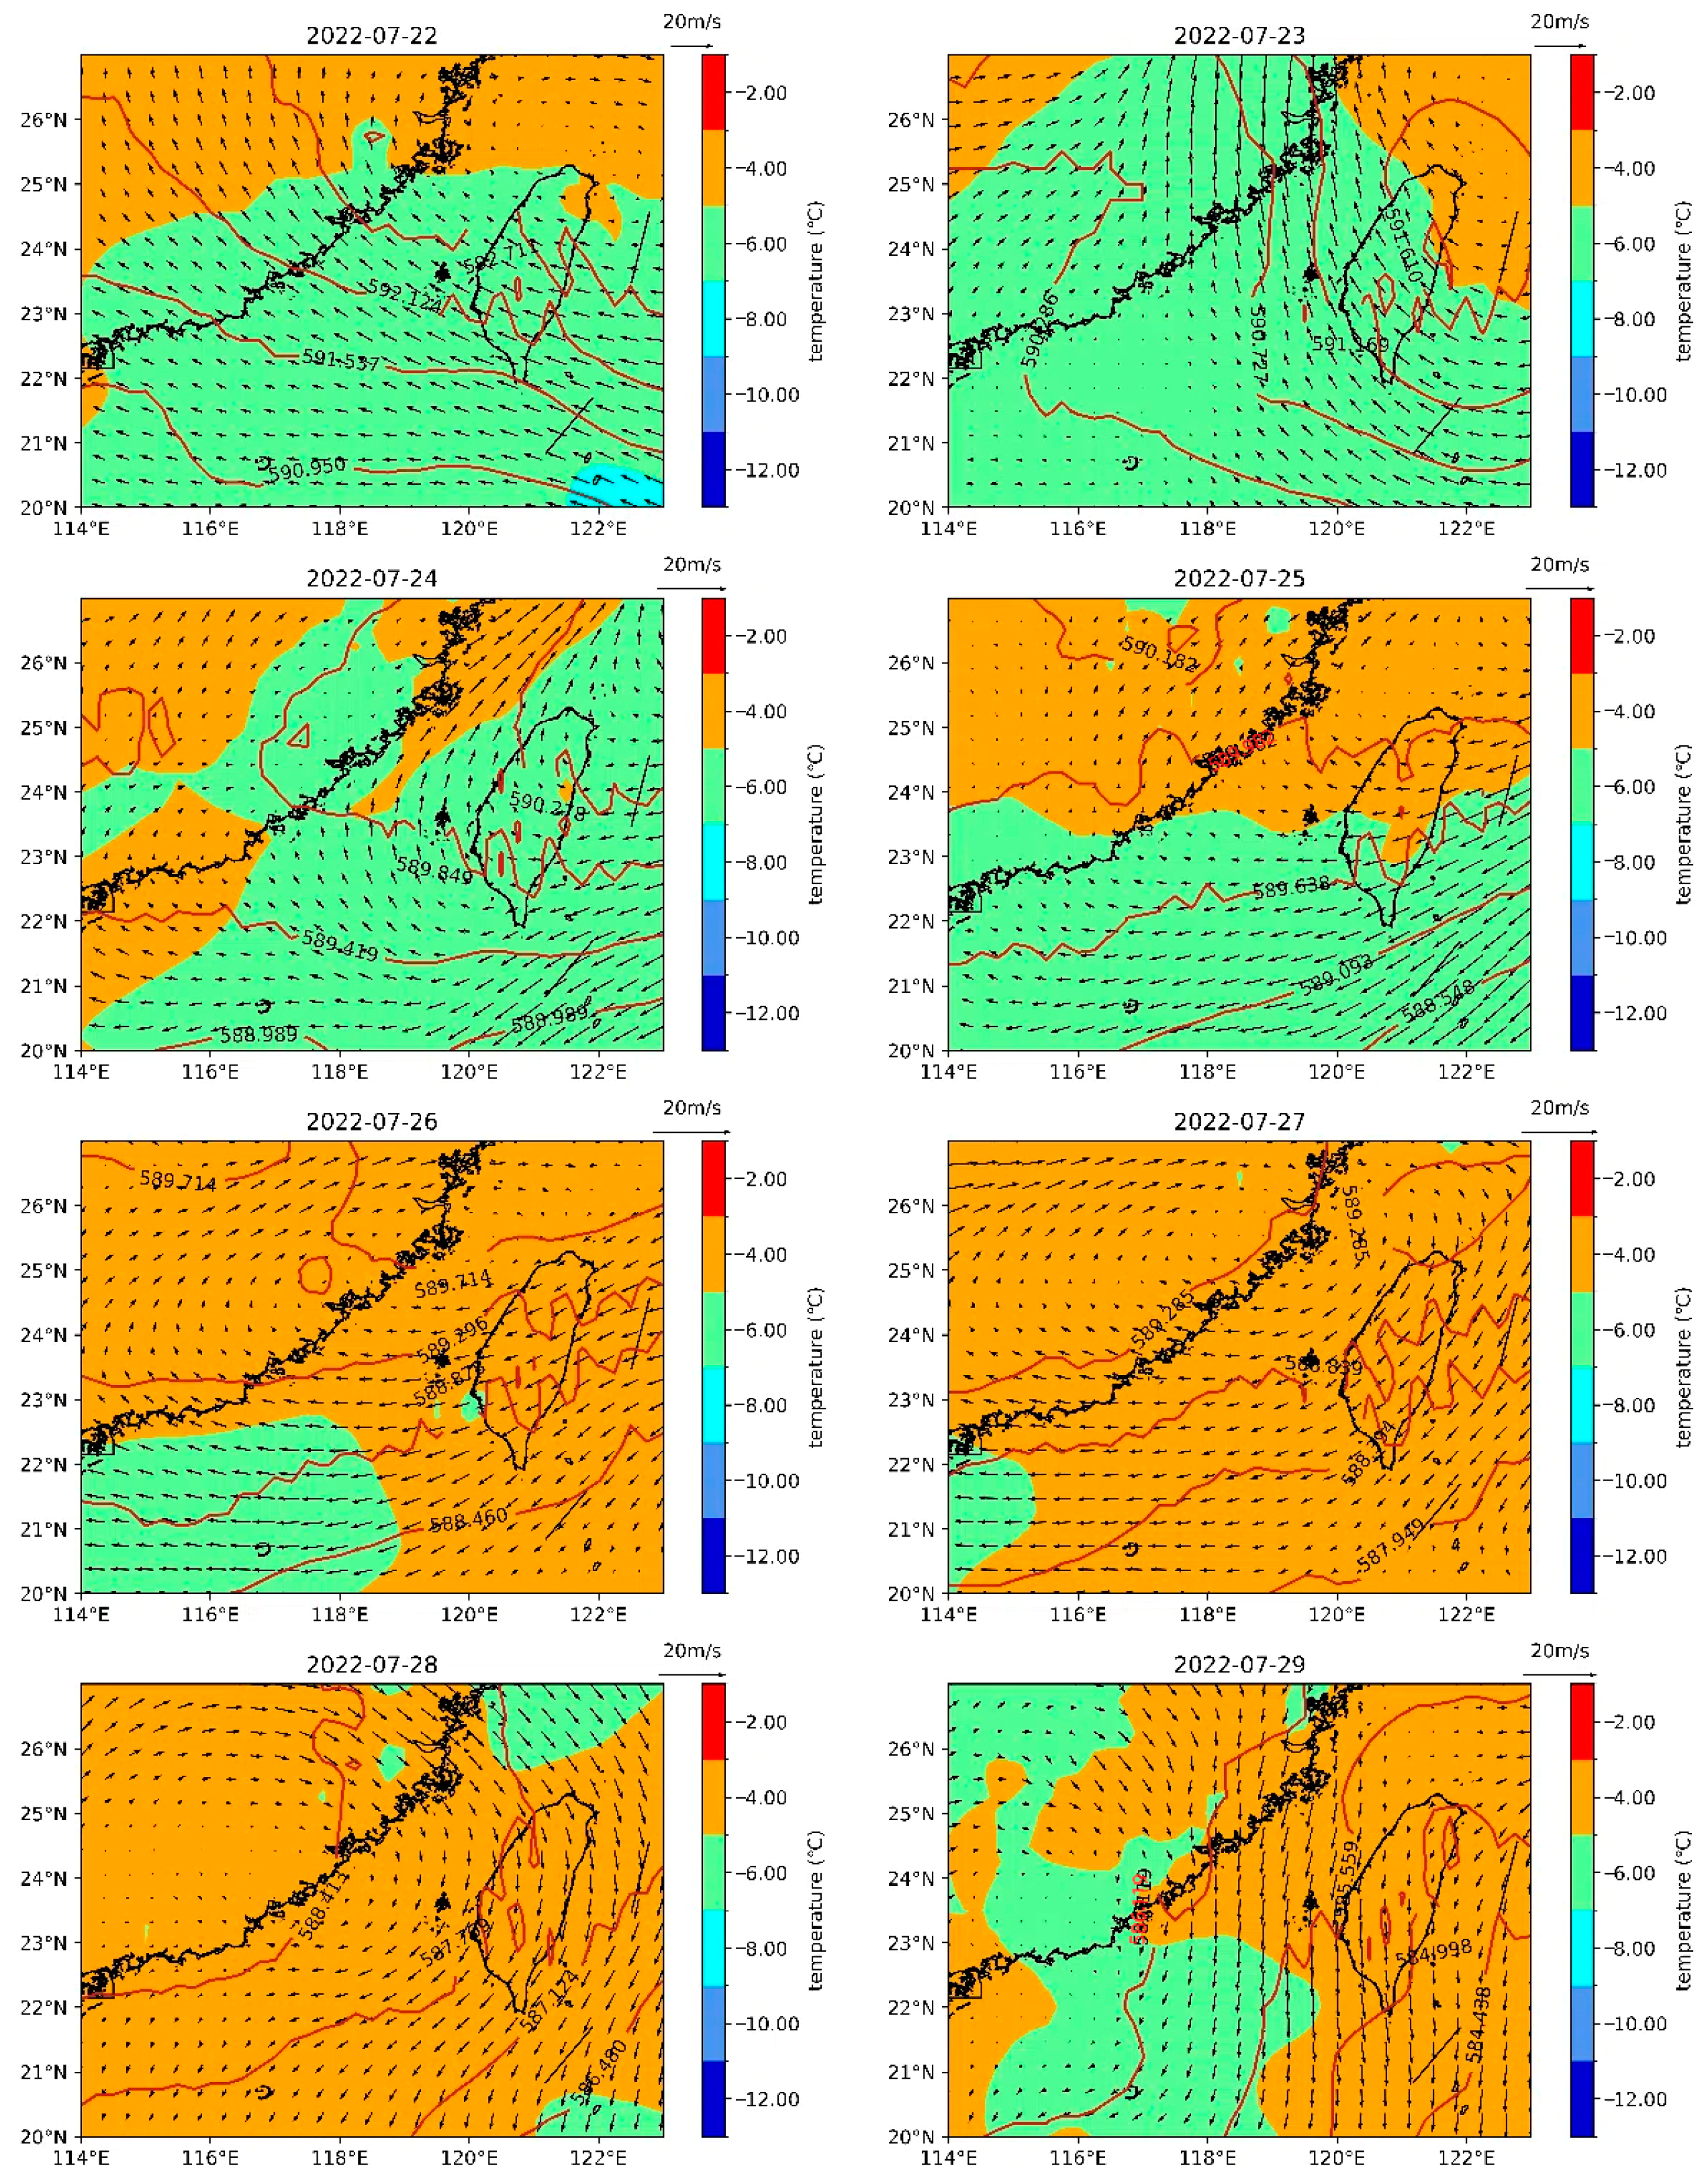
3.3.1. Atmospheric Circulation and Heatwaves

Atmospheric circulation significantly affects heatwaves in the Yangtze River Delta. As shown in Figure 8, during 18–25 July 2017, fluctuations in the 580 hPa level led to surface warming, enhancing boundary layer instability, which in turn triggered a strengthened circulation system. From July 22 to 25, the increase in surface air temperature amplified the upward movement of the lower atmosphere, promoting the formation and development of convective clouds, which affected the water vapor cycle and energy transfer in the atmosphere, creating localized circulation patterns. Additionally, the rise in surface air temperature also influenced the wind field structure in the atmosphere, driving horizontal atmospheric movement and reshaping the atmospheric circulation. During heatwaves, surface air temperatures exhibit a significant increasing trend, and these areas are often marked in red or dark red, representing extremely high air temperature. The formation of these high-air temperature areas is usually the result of intense solar radiation, the characteristics of surface cover, and local climatic conditions working together.
Anomalous changes in atmospheric circulation play a key role in sustaining and intensifying heatwaves, especially the flow patterns of the lower atmosphere. As shown in Figure 9, during the heatwave in Fujian from 22 to 29 July 2022, the increase in surface air temperature caused the lower atmosphere to expand due to heating, generating upward movement (labeled as “Upward Airflow”). This upward airflow facilitated the formation and development of convective clouds, further influencing the water vapor cycle and energy transfer in the atmosphere. At the same time, the wind field structure in the atmosphere also changed, and the horizontal pressure gradient force drove the atmosphere to produce horizontal movement (labeled as “Horizontal Airflow”), forming a specific circulation pattern that influenced the formation of sustained high air temperature in the region. In the case illustrated by Figure 8, fluctuations at the 580 hPa level triggered localized atmospheric circulation anomalies, significantly enhancing boundary layer instability. This process promoted surface temperature rise and the development of localized extreme heat events. In contrast, the case in Figure 9 reflects a different mechanism: intense surface heating induced low-level upward motion and horizontal airflow changes, which subsequently affected convective cloud formation and moisture cycling, thereby sustaining and intensifying the heatwave. The first case highlights how circulation anomalies can initiate heatwaves through boundary layer processes (580 hPa fluctuation → enhanced turbulence → increased sensible heat flux), while the second case demonstrates a surface–atmosphere positive feedback mechanism that maintains the heatwave (high temperature → suppressed convection → increased radiative heating).
The area shown in Figure 10 is located at the junction of Guangdong, Guangxi, and Hainan, with a focus on the distribution and variation of the subtropical high-pressure system. The subtropical high-pressure system is one of the main weather systems affecting many regions during the summer. During the heatwave in this region from 24 to 31 July 2023, the subtropical high-pressure system anomalously intensified and remained in control of the area for a long period. This anomalous intensification led to clear and mostly cloudless weather, allowing solar radiation to reach the surface directly, which further exacerbated the rise in surface air temperature. Meanwhile, the strengthening of the subtropical high-pressure system also suppressed the upward movement of the lower atmosphere, reducing cloud cover and water vapor condensation, thereby intensifying the strength and duration of the heatwave.
From 10 to 18 August 2022, the Tibetan Plateau experienced an unusual heatwave event (Figure 11). While atmospheric circulation is a key factor in climate systems and affects regional air temperature distribution through the transport of warm and moist air, its role in this particular heatwave event was not significant. Instead, this heatwave event was closely tied to the geographic location and topographic characteristics of the Tibetan Plateau. The high elevation and diverse terrain of the Tibetan Plateau create a unique and complex climate system, where surface energy balance, topography, and local circulation interact to influence air temperature changes. This interplay causes energy to accumulate in localized areas, leading to the formation of localized heat islands and local circulation, which, to some extent, affects the air temperature distribution. The balance between surface radiation absorption and heat release directly influences air temperature variation. Moreover, the undulating topography and diverse landforms regulate air movement patterns, thereby affecting the formation and intensity of local circulations. Therefore, to fully understand this heatwave event, it is crucial to consider not only atmospheric circulation but also other factors such as surface energy balance, topographical features, and local circulation dynamics.
In the analysis of atmospheric circulation, we particularly focus on the subtropical high-pressure belt near 30° N. This high-pressure system plays a crucial role in the global climate, and when it anomalously strengthens and advances northward, its influence expands to more regions. When such an enhanced high-pressure system continuously controls a region, the area experiences prolonged subsiding airflow, causing the air to undergo adiabatic warming. This downward airflow continuously transports heat from the upper atmosphere to the surface, causing rapid air temperature increases. The extent and speed of this air temperature rise are often closely linked to the intensity and duration of the heatwave. Particularly when the abnormal high-pressure system combines with specific circulation patterns, it can form a “heat dome”. In this climatic pattern, the high-pressure system acts as a lid, tightly trapping hot air in the high-air temperature area and preventing the entry of cooler air. This closed state causes air temperature within the heat dome to continue rising, creating an extreme heat zone. Therefore, when predicting and responding to heatwave events, it is essential to closely monitor changes in the subtropical high-pressure belt in atmospheric circulation maps and its interactions with other circulation systems. This approach will enable more accurate predictions of heatwave occurrence and evolution.

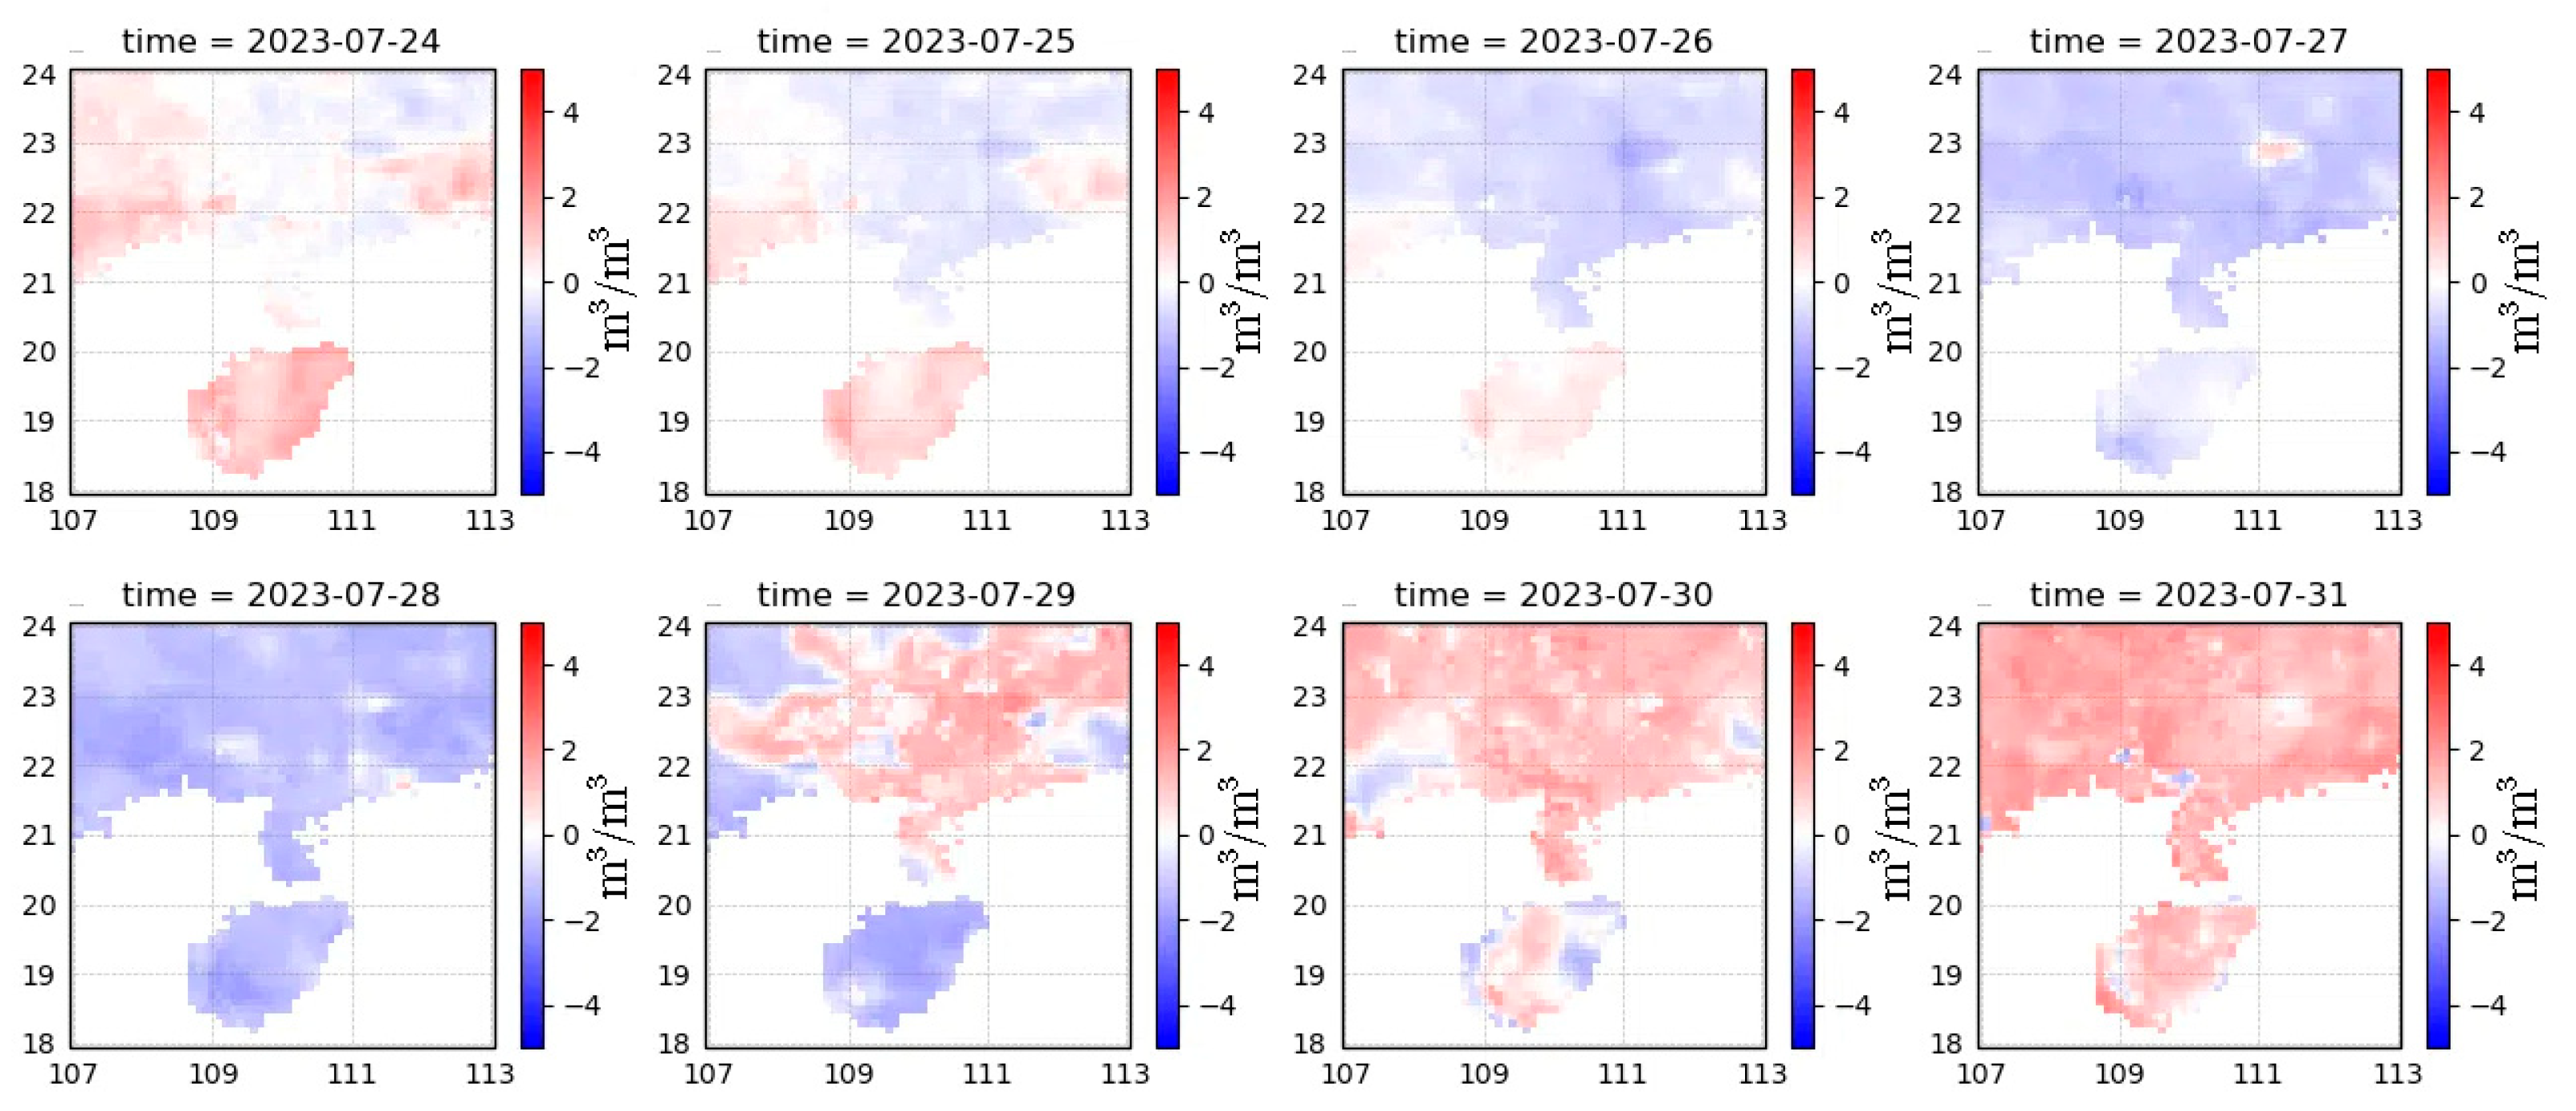
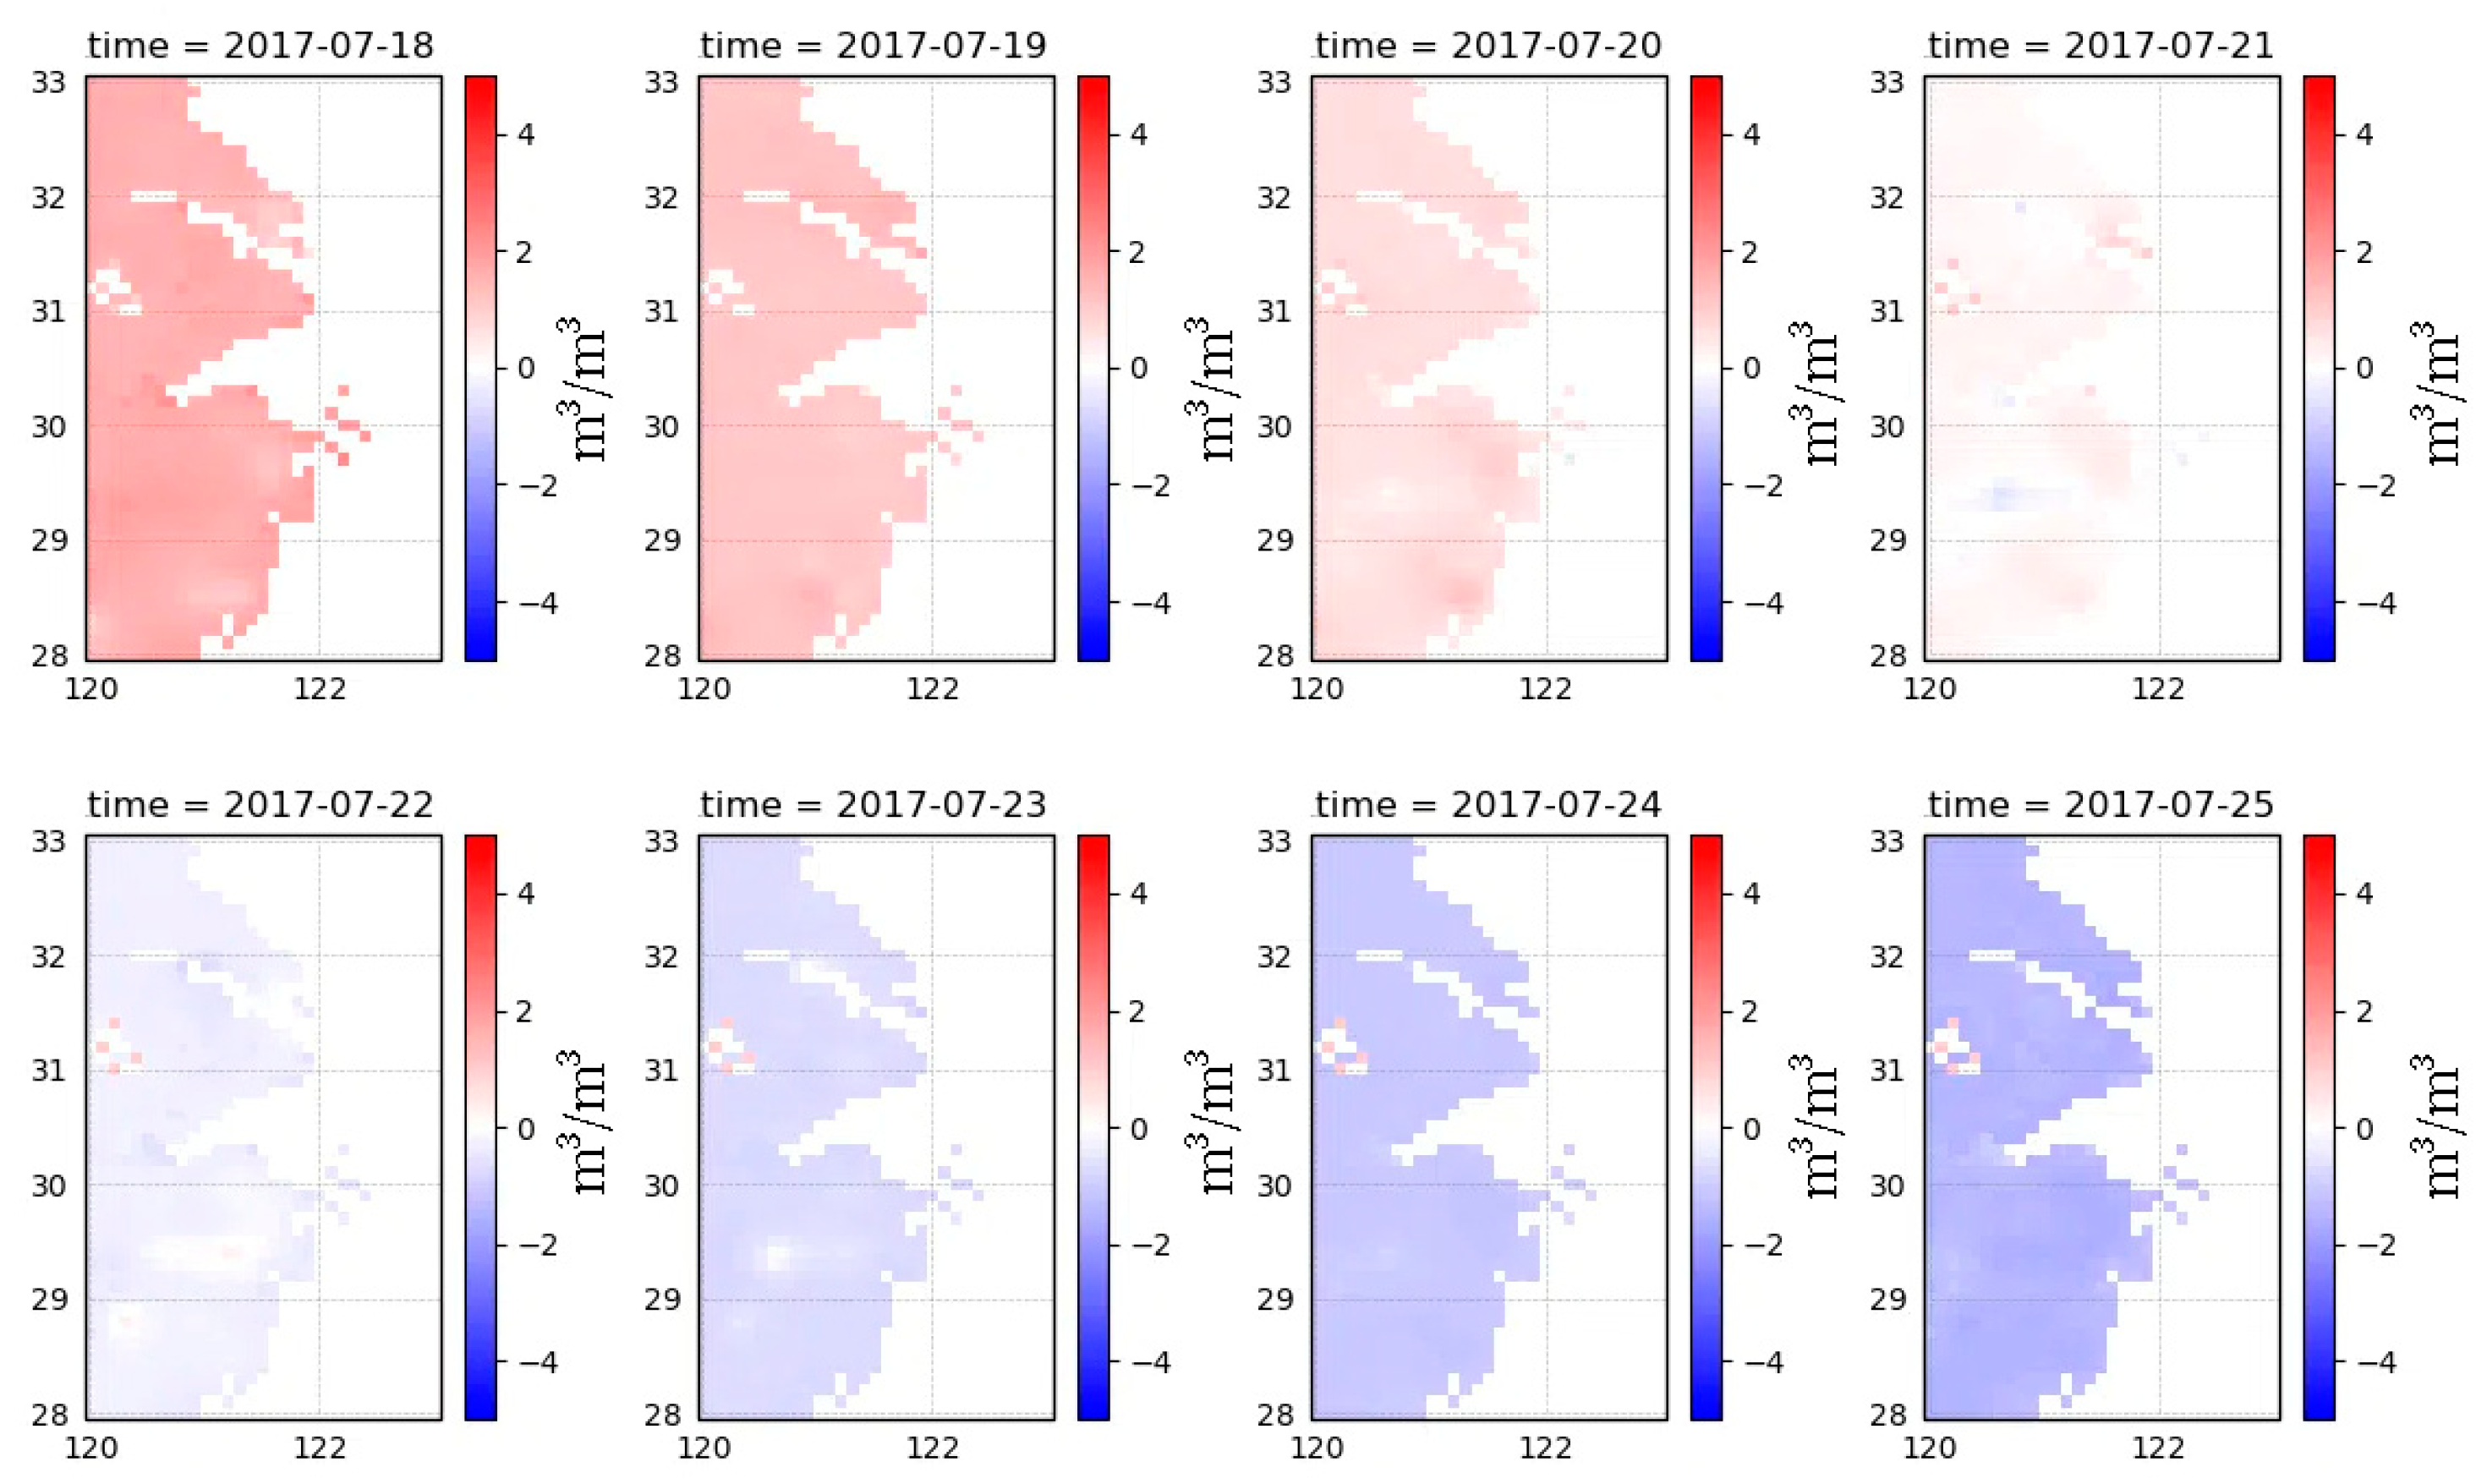
3.3.2. The Role of Soil Moisture in Driving Heatwaves

Soil moisture is a key factor in regulating energy and water exchange between the atmosphere and the land surface. While it has a noticeable but relatively limited influence on the driving mechanisms of heatwaves in certain regions, its impact remains secondary compared to atmospheric circulation. During heatwave periods, normal soil moisture (represented in red) helps stabilize surface air temperature, whereas abnormally low soil moisture (represented in blue) can indicate a rapid increase in land surface air temperature. As shown in Figure 12, in Guangdong, Guangxi, and Hainan, soil moisture exhibited a declining trend from 24 to 28 July 2023 due to intense evaporation caused by the heatwave and insufficient precipitation. This reduction in soil moisture may have further intensified surface air temperature increases, creating favorable conditions for heatwave formation. A similar trend was observed in the Yangtze River Delta (Figure 13) and Fujian (Figure 14) regions, where soil moisture also decreased during the heatwave, driven by mechanisms comparable to those in Guangdong, Guangxi, and Hainan.
Although soil moisture varies during heatwave events, comprehensive analysis suggests that it primarily acts as a secondary factor. The dominant driver of heatwaves is changes in atmospheric circulation patterns, particularly the intensification and persistence of the subtropical high. These circulation patterns enhance subsidence, leading to clear, dry, and hot weather conditions. Soil moisture influences heatwaves indirectly by affecting the surface energy balance and hydrological cycle; low soil moisture reduces vegetation transpiration, exacerbating surface warming. However, compared to atmospheric circulation, its impact is relatively minor and is further constrained by factors such as vegetation cover and soil type. Additionally, soil moisture variations influence atmospheric moisture content: high humidity promotes water vapor evaporation, releasing latent heat that further warms the atmosphere, whereas low humidity increases boundary-layer instability, promoting convective cloud development, which indirectly affects heatwave intensity and spread. In summary, soil moisture plays an auxiliary role in influencing surface air temperature, water vapor dynamics, and circulation patterns in coastal heatwave events, while atmospheric circulation remains the dominant factor.
A detailed analysis of soil moisture data from the Tibetan Plateau during 10–18 August 2022 (Figure 15) requires consideration of its unique high-altitude and low-pressure climate. First, the high elevation of the plateau results in generally lower air temperatures, even during summer, making it significantly cooler than coastal regions. These cooler conditions slow down soil moisture evaporation, helping to maintain relatively stable soil moisture levels. Additionally, August is the peak of the rainy season, providing an abundant source of moisture to the soil and further sustaining its stability. However, frequent heatwaves can accelerate soil moisture loss, potentially leading to a decline in soil moisture. Nevertheless, due to the region’s relatively lower air temperature, soil moisture evaporation does not occur as rapidly as in coastal areas. As a result, despite fluctuations, soil moisture levels in the Tibetan Plateau remain more stable compared to those in Guangdong, Guangxi, Hainan, the Yangtze River Delta, and Fujian, where intense solar radiation and higher air temperature cause greater soil moisture variability.

4. Discussion

Through a systematic analysis of the spatial and temporal distribution characteristics and driving mechanisms of heatwaves in China, this study elucidates the interaction between regional climate responses and extreme events in the context of global warming [85,86]. The study finds that the regional differences in heatwave distribution across China are closely related to the heterogeneous responses of regional climate systems, a pattern that aligns with the broader impacts of climate change [27]. Ji et al. [27] reported a higher frequency of heatwaves in the Yangtze River Basin and longer durations of heatwaves in Xinjiang from 1961 to 2020, and they noted that this trend is consistent with the conclusions drawn in this study. Similarly, Wu et al., 2023 [87] pointed out that the frequency of heatwaves was higher in the northwest, eastern, and central regions of China during the period of 1990 to 2019, which aligns with our findings. However, discrepancies exist in the Tibetan Plateau. Our study shows that heatwave events are relatively rare in this region, while Wu et al., 2023 [87] observed a very high frequency of heatwaves in the southeastern Tibetan region. This may be due to differences in definitions or data resolution. Specifically, these discrepancies may arise from differences in the heatwave identification method and definitions used in our study.
In terms of regional differences in heatwave occurrence, the eastern coastal areas and the Yangtze River Basin experience a higher frequency of heatwaves, primarily related to the anomalous strengthening of the subtropical high-pressure system. This is consistent with earlier studies linking climate circulation anomalies to extreme heat events [88,89,90]. In contrast, the arid northwest regions, such as Xinjiang, experience longer-lasting heatwaves, which may be associated with uneven surface energy distribution due to low soil moisture. This region appears to be trapped in a vicious cycle of ‘dry soil → rising temperatures → increased evaporation → further soil drying’, thereby intensifying the positive feedback mechanism between the soil and atmosphere [91,92]. These spatial differences suggest that heatwave events are not driven by a single factor but are the result of interactions among multiple meteorological driving factors [93].
The westward extension and strengthening of the subtropical high-pressure system, along with the subsidence process, have become the primary driving factors for the frequent heatwaves in eastern China. Key mechanisms include the suppression of convection and the enhancement of surface net radiation, which in turn increases temperatures [94]. This mechanism aligns with the circulation-dominated heatwave theory framework [95] and has been validated by the 2022 heatwave event in southern China. Studies show that the anomalous westward extension of the Northwest Pacific subtropical high led to widespread warming [90]. In contrast, the regulating effect of soil moisture on heatwaves varies by region: in the humid southern areas, evaporative cooling mitigates the high-temperature phenomenon [96], while in arid regions, the enhanced energy exchange between the surface and atmosphere exacerbates the heat effect [97,98]. In the Tibetan Plateau, due to the lower atmospheric energy transfer efficiency at high altitudes, heatwave events are rare and short-lived. The strong radiative cooling effect (manifested by rapid nighttime temperature drops) and frequent valley wind circulation accelerate heat dissipation, thus suppressing the persistence of high temperatures [27,99].
Although this study provides important insights into the spatiotemporal distribution and driving mechanisms of heatwaves, there are still certain limitations. First, the 11-year data period from 2013 to 2023 limits the analysis of long-term trends, and may not fully capture the impacts of climate events such as El Niño or the Atlantic Multidecadal Oscillation (AMO). As noted by Wei et al. [40], these climate events play a significant role in intensifying heatwaves. Climate research generally suggests using data periods of over 30 years to derive robust trends, so our results may reflect short-term anomalies rather than long-term climate patterns. Second, the applicability of ERA5 data in complex terrains (such as the Tibetan Plateau) warrants further examination. Zhao et al. [100] pointed out that ERA5 underestimates precipitable water vapor estimates, which may affect the representation of heatwaves in high-altitude areas. Moreover, the EHF index does not account for humidity, which may underestimate the heat stress of humid-heat compound events, particularly in southern regions where high humidity exacerbates heat stress [101]. This contrasts with the findings of Cheng et al. [98], who emphasized the important role of humidity in southern heatwaves, suggesting that our temperature-based index may overlook the critical impact of humidity on heatwaves.
Future research could address the short-term data limitation by extending the observation period to over 30 years and using CMIP6 models for multi-scenario simulations (SSP1-2.6 to SSP5-8.5) to explore the nonlinear changes in heatwave responses to rising greenhouse gas concentrations [102]. Additionally, combining Landsat 8 surface temperature data (30 m resolution) with drone-based thermal infrared remote sensing could improve spatial accuracy in complex terrains [103]. Developing multi-physics coupled models that integrate temperature, humidity, and wind speed with human heat tolerance thresholds would help establish health risk-oriented heatwave warning systems, enhancing their practical utility. Interdisciplinary collaborations, such as epidemiological studies quantifying the heatwave mortality dose–response relationship [101], or agricultural models assessing crop yield risks [104], would contribute to enhancing the scientific rigor and practical effectiveness of heatwave response strategies.

5. Conclusions

This study is based on observational data from 388 meteorological stations in China from 2013 to 2023. Using EHF, HWN, HWF, HWD, and HWI indices, it systematically reveals the spatial distribution patterns and characteristics of heatwaves. Furthermore, the study explores the driving mechanisms of atmospheric circulation and soil moisture using ERA5 reanalysis data. The results show that: (1) In terms of spatial distribution, the eastern coastal regions and the Yangtze River Basin, dominated by the subtropical high, experience frequent heatwaves, with the number of heatwave days generally ranging from 8.5 to 12.5 days per year, averaging 2 to 3.5 days. However, the intensity of these heatwaves is lower than that in the northern and northwestern regions, with intensities ranging from 5 to 15 °C2. In the northwest inland areas (e.g., the Tarim Basin and the Hexi Corridor), due to strong evaporation and dry soil, the duration of heatwaves is the longest, lasting 10.5 to 16.5 days, with higher intensities ranging from 30 to 120 °C2. On the Tibetan Plateau’s low-elevation river valleys (e.g., the Yarlung Tsangpo River Valley), driven by local circulations, the occurrence of heatwave events is relatively low, averaging 0.5 to 1.75 times per year, with short durations (6.5 to 10.5 days) and low intensities (5 to 30 °C2). (2) A driving mechanism, atmospheric circulation, particularly the dynamic variations of the subtropical high, plays a dominant role in the formation and persistence of heatwaves. The abnormal intensification of the subtropical high leads to prevailing subsidence airflow, suppressing cloud and precipitation formation while enhancing surface radiative heating, thereby contributing to the heat dome effect. This significantly prolongs the duration and intensifies the severity of heatwaves. Additionally, soil moisture indirectly influences heatwave development by regulating surface energy balance and water cycles, exerting a modulating effect on heatwave formation and progression. (3) This study has certain limitations in terms of data and methodology. First, the wind field and soil moisture data in the ERA5 reanalysis dataset used in this study lack validation against ground-based meteorological observations, which may affect the regional applicability and accuracy of the data. Second, the heatwave index (EHF) used in the study is based solely on air temperature, without incorporating key meteorological variables such as relative humidity, which results in a lack of comprehensiveness in the heat stress assessment. These limitations may, to some extent, impact the reliability of the study’s conclusions. (4) Regarding regional adaptation strategies, for the eastern urban clusters, enhancing heat island mitigation technologies (e.g., high-albedo materials) and health warning systems is recommended. In arid northwestern regions, optimizing irrigation strategies to improve soil moisture retention is crucial. Meanwhile, on the Tibetan Plateau, establishing an eco-adaptive management framework based on local circulation characteristics is necessary to mitigate heatwave impacts.

Author Contributions

Conceptualization, J.L.; methodology, J.L.; software, J.L.; validation, J.L.; formal analysis, J.L.; investigation, J.L.; resources, J.L.; data curation, M.L.; writing—original draft preparation, J.L. and M.L.; writing—review and editing, J.L. and M.L.; visualization, J.L.; supervision, J.L.; project administration, J.L.; funding acquisition, J.L. All authors have read and agreed to the published version of the manuscript.

Funding

This research was jointly funded by the Key Laboratory of Mine Spatio-Temporal Information and Ecological Restoration, MNR (Grant No. KLM202301), Henan Provincial Science and Technology Research (Grant No. 242102320017), and Henan Province Joint Fund Project of Science and Technology (Grant No. 222103810097).

Institutional Review Board Statement

Not applicable.

Informed Consent Statement

Not applicable.

Data Availability Statement

The raw data supporting the conclusions of this article will be made available by the authors on request.

Conflicts of Interest

The authors declare no conflicts of interest.

References

  1. IPCC Climate Change 2023: Synthesis Report. Contribution of Working Groups I, II and III to the Sixth Assessment Report of the Intergovernmental Panel on Climate Change; The Australian National University: Canberra, Australia, 2023; ISBN 92-9169-164-X.
  2. Perkins-Kirkpatrick, S.E.; Gibson, P.B. Changes in Regional Heatwave Characteristics as a Function of Increasing Global Temperature. Sci. Rep. 2017, 7, 12256. [Google Scholar]
  3. Dosio, A.; Mentaschi, L.; Fischer, E.M.; Wyser, K. Extreme Heat Waves Under 1.5 °C and 2 °C Global Warming. Environ. Res. Lett. 2018, 13, 54006. [Google Scholar] [CrossRef]
  4. Perkins-Kirkpatrick, S.E.; Lewis, S.C. Increasing Trends in Regional Heatwaves. Nat. Commun. 2020, 11, 3357. [Google Scholar] [CrossRef]
  5. García-Herrera, R.; Díaz, J.; Trigo, R.M.; Luterbacher, J.; Fischer, E.M. A Review of the European Summer Heat Wave of 2003. Crit. Rev. Environ. Sci. Technol. 2010, 40, 267–306. [Google Scholar] [CrossRef]
  6. Monteiro, A.; Carvalho, V.; Oliveira, T.; Sousa, C. Excess Mortality and Morbidity During the July 2006 Heat Wave in Porto, Portugal. Int. J. Biometeorol. 2013, 57, 155–167. [Google Scholar] [CrossRef]
  7. Rebetez, M.; Dupont, O.; Giroud, M. An Analysis of the July 2006 Heatwave Extent in Europe Compared to the Record Year of 2003. Theor. Appl. Climatol. 2009, 95, 1–7. [Google Scholar] [CrossRef]
  8. Lee, S.-M.; Min, S.-K. Heat Stress Changes over East Asia Under 1.5 and 2.0 °C Global Warming Targets. J. Clim. 2018, 31, 2819–2831. [Google Scholar] [CrossRef]
  9. Hoy, A.; Hänsel, S.; Skalak, P.; Ustrnul, Z.; Bochníček, O. The Extreme European Summer of 2015 in a Long-Term Perspective. Int. J. Climatol. 2017, 37, 943–962. [Google Scholar] [CrossRef]
  10. Krzyżewska, A.; Dyer, J. The August 2015 Mega-Heatwave in Poland in the Context of Past Events. Weather 2018, 73, 207–214. [Google Scholar] [CrossRef]
  11. Song, X.; Zhang, Z.; Chen, Y.; Wang, P.; Xiang, M.; Shi, P.; Tao, F. Spatiotemporal Changes of Global Extreme Temperature Events (ETEs) since 1981 and the Meteorological Causes. Nat. Hazard. 2014, 70, 975–994. [Google Scholar] [CrossRef]
  12. Grumm, R.H. The Central European and Russian Heat Event of July–August 2010. Bull. Am. Meteorol. Soc. 2011, 92, 1285–1296. [Google Scholar] [CrossRef]
  13. Barriopedro, D.; Fischer, E.M.; Luterbacher, J.; Trigo, R.M.; García-Herrera, R. The Hot Summer of 2010: Redrawing the Temperature Record Map of Europe. Science 2011, 332, 220–224. [Google Scholar] [CrossRef]
  14. Mishra, V.; Mukherjee, S.; Kumar, R.; Stone, D.A. Heat Wave Exposure in India in Current, 1.5 °C, and 2.0 °C Worlds. Environ. Res. Lett. 2017, 12, 124012. [Google Scholar] [CrossRef]
  15. Suarez-Gutierrez, L.; Müller, W.A.; Li, C.; Marotzke, J. Hotspots of Extreme Heat Under Global Warming. Clim. Dyn. 2020, 55, 429–447. [Google Scholar] [CrossRef]
  16. Vogel, M.M.; Zscheischler, J.; Fischer, E.M.; Seneviratne, S.I. Development of Future Heatwaves for Different Hazard Thresholds. J. Geophys. Res. Atmos. 2020, 125, e2019JD032070. [Google Scholar] [CrossRef]
  17. Liu, J.; Ren, Y.; Tao, H.; Liu, T.; Chen, H. The response of heatwave to carbon emission in China. China Environ. Sci. 2021, 42, 415–424. [Google Scholar]
  18. Jiang, J.; Liu, Y.; Mao, J.; Wu, G. Extreme Heatwave over Eastern China in Summer 2022: The Role of Three Oceans and Local Soil Moisture Feedback. Environ. Res. Lett. 2023, 18, 44025. [Google Scholar] [CrossRef]
  19. Qian, C.; Ye, Y.; Jiang, J.; Zhong, Y.; Zhang, Y.; Pinto, I.; Huang, C.; Li, S.; Wei, K. Rapid Attribution of the Record-Breaking Heatwave Event in North China in June 2023 and Future Risks. Environ. Res. Lett. 2024, 19, 14028. [Google Scholar] [CrossRef]
  20. Xu, W.; Yuan, W.; Wu, D.; Zhang, Y.; Shen, R.; Xia, X.; Ciais, P.; Liu, J. Impacts of Record-Breaking Compound Heatwave and Drought Events in 2022 China on Vegetation Growth. Agric. For. Meteorol. 2024, 344, 109799. [Google Scholar] [CrossRef]
  21. Wu, X.; Jiang, D.; Zhang, F. Increasing Impact of Compound Agricultural Drought and Hot Events on Maize Yield in China. Clim. Res. 2023, 90, 17–29. [Google Scholar]
  22. Zhao, L.; Li, X.; Zhang, Z.; Yuan, M.; Sun, S.; Qu, S.; Hou, M.; Lu, D.; Zhou, Y.; Lin, A. Developing a Novel Framework to Re-Examine Half a Century of Compound Drought and Heatwave Events in Mainland China. Sci. Total Environ. 2023, 874, 162366. [Google Scholar] [CrossRef] [PubMed]
  23. Shi, P.; Li, Y.; Biswas, A.; Wei, K.; Hou, M. Spatial-Temporal Evolution and Intrinsic Drivers of Compound Drought and Heatwave Events in Mainland China. Sci. Total Environ. 2024, 948, 174834. [Google Scholar] [CrossRef]
  24. Chen, H.; Zhao, L.; Cheng, L.; Zhang, Y.; Wang, H.; Gu, K.; Bao, J.; Yang, J.; Liu, Z.; Huang, J. Projections of Heatwave-Attributable Mortality Under Climate Change and Future Population Scenarios in China. Lancet Reg. Health—West. Pac. 2022, 28, 100582. [Google Scholar] [CrossRef]
  25. Chen, Y.; Liao, Z.; Shi, Y.; Tian, Y.; Zhai, P. Detectable Increases in Sequential Flood-Heatwave Events across China during 1961–2018. Geophys. Res. Lett. 2021, 48, e2021GL092549. [Google Scholar] [CrossRef]
  26. Wang, P.; Tang, J.; Wang, S.; Dong, X.; Fang, J. Regional Heatwaves in China: A Cluster Analysis. Clim. Dyn. 2018, 50, 1901–1917. [Google Scholar]
  27. Ji, H.; Feng, A.; Zhao, Y.; Liao, J.; Zhang, Z.; Gu, C.; Feng, A. Characteristics of Heat Waves in Mainland China since 1961 Based on Absolute and Relative Methods. Atmosphere 2023, 14, 544. [Google Scholar] [CrossRef]
  28. Mukherjee, S.; Ashfaq, M.; Mishra, A.K. Compound Drought and Heatwaves at a Global Scale: The Role of Natural Climate Variability-Associated Synoptic Patterns and Land-Surface Energy Budget Anomalies. J. Geophys. Res. Atmos. 2020, 125, e2019JD031943. [Google Scholar] [CrossRef]
  29. Yang, J.; Yin, P.; Sun, J.; Wang, B.; Zhou, M.; Li, M.; Tong, S.; Meng, B.; Guo, Y.; Liu, Q. Heatwave and Mortality in 31 Major Chinese Cities: Definition, Vulnerability and Implications. Sci. Total Environ. 2019, 649, 695–702. [Google Scholar] [CrossRef]
  30. Luo, M.; Wu, S.; Liu, Z.; Lau, N. Contrasting Circulation Patterns of Dry and Humid Heatwaves over Southern China. Geophys. Res. Lett. 2022, 49, e2022GL099243. [Google Scholar] [CrossRef]
  31. Marghidan, C.P.; Van Aalst, M.; Blanford, J.; Guigma, K.; Pinto, I.; Maure, G.; Marrufo, T. Heatwaves in Mozambique 1983–2016: Characteristics, Trends and City-Level Summaries Using High-Resolution CHIRTS-Daily. Weather Clim. Extrem. 2023, 40, 100565. [Google Scholar]
  32. Nairn, J.R.; Fawcett, R.J. The Excess Heat Factor: A Metric for Heatwave Intensity and Its Use in Classifying Heatwave Severity. Int. J. Environ. Res. Public Health 2015, 12, 227–253. [Google Scholar] [CrossRef] [PubMed]
  33. Nairn, J.; Ostendorf, B.; Bi, P. Performance of Excess Heat Factor Severity as a Global Heatwave Health Impact Index. Int. J. Environ. Res. Public Health 2018, 15, 2494. [Google Scholar] [CrossRef]
  34. Langlois, N.; Herbst, J.; Mason, K.; Nairn, J.; Byard, R.W. Using the Excess Heat Factor (EHF) to Predict the Risk of Heat Related Deaths. J. Forensic Legal Med. 2013, 20, 408–411. [Google Scholar] [CrossRef]
  35. Jegasothy, E.; McGuire, R.; Nairn, J.; Fawcett, R.; Scalley, B. Extreme Climatic Conditions and Health Service Utilisation Across Rural and Metropolitan New South Wales. Int. J. Biometeorol. 2017, 61, 1359–1370. [Google Scholar] [CrossRef]
  36. Nairn, J.R.; Fawcett, R.G. Defining Heatwaves: Heatwave Defined as a Heat-Impact Event Servicing All Community and Business Sectors in Australia; Centre for Australian Weather and Climate Research: Melbourne, Australia, 2013; ISBN 1-922173-11-8.
  37. Hatvani-Kovacs, G.; Belusko, M.; Pockett, J.; Boland, J. Can the Excess Heat Factor Indicate Heatwave-Related Morbidity? A Case Study in Adelaide, South Australia. Ecohealth 2016, 13, 100–110. [Google Scholar] [CrossRef] [PubMed]
  38. Zhou, Q.-Y.; Gao, M.-N.; Yang, J.; Sun, X.-Y.; Lu, Y.-Y.; Jiang, T.; Su, B.-D.; Zhu, T. Future Changes in Population Exposure to Intensified Heatwaves over Three Major Urban Agglomerations in China Based on Excess Heat Factor. Adv. Clim. Chang. Res. 2025, 16, 12–24. [Google Scholar] [CrossRef]
  39. Perkins, S.E. A Review on the Scientific Understanding of Heatwaves—Their Measurement, Driving Mechanisms, and Changes at the Global Scale. Atmos. Res. 2015, 164, 242–267. [Google Scholar] [CrossRef]
  40. Wei, J.; Han, W.; Wang, W.; Zhang, L.; Rajagopalan, B. Intensification of Heatwaves in China in Recent Decades: Roles of Climate Modes. NPJ Clim. Atmos. Sci. 2023, 6, 98. [Google Scholar] [CrossRef]
  41. Luo, M.; Lau, N.-C.; Liu, Z. Different Mechanisms for Daytime, Nighttime, and Compound Heatwaves in Southern China. Weather Clim. Extrem. 2022, 36, 100449. [Google Scholar] [CrossRef]
  42. Deng, K.; Yang, S.; Ting, M.; Zhao, P.; Wang, Z. Dominant Modes of China Summer Heat Waves Driven by Global Sea Surface Temperature and Atmospheric Internal Variability. J. Clim. 2019, 32, 3761–3775. [Google Scholar] [CrossRef]
  43. Wei, J.; Wang, W.; Shao, Q.; Yu, Z.; Chen, Z.; Huang, Y.; Xing, W. Heat Wave Variations across China Tied to Global SST Modes. J. Geophys. Res. Atmos. 2020, 125, e2019JD031612. [Google Scholar] [CrossRef]
  44. Pun, I.-F.; Hsu, H.-H.; Moon, I.-J.; Lin, I.; Jeong, J.-Y. Marine Heatwave as a Supercharger for the Strongest Typhoon in the East China Sea. NPJ Clim. Atmos. Sci. 2023, 6, 128. [Google Scholar] [CrossRef]
  45. Liang, L.; Yu, L.; Wang, Z. Identifying the Dominant Impact Factors and Their Contributions to Heatwave Events over Mainland China. Sci. Total Environ. 2022, 848, 157527. [Google Scholar] [CrossRef] [PubMed]
  46. Jiang, S.; Lee, X.; Wang, J.; Wang, K. Amplified Urban Heat Islands during Heat Wave Periods. J. Geophys. Res. Atmos. 2019, 124, 7797–7812. [Google Scholar] [CrossRef]
  47. He, B.-J.; Wang, J.; Zhu, J.; Qi, J. Beating the Urban Heat: Situation, Background, Impacts and the Way Forward in China. Renew. Sustain. Energy Rev. 2022, 161, 112350. [Google Scholar] [CrossRef]
  48. Shi, Z.; Jia, G. Changes in Urban Heat Island Intensity During Heatwaves in China. Environ. Res. Lett. 2024, 19, 74061. [Google Scholar]
  49. Wu, S.; Luo, M.; Liu, Z.; Wang, X.; Huang, Z.; Li, X. Longer- and Slower-Moving Contiguous Heatwaves Linked to El Niño. Geophys. Res. Lett. 2024, 51, e2024GL109067. [Google Scholar] [CrossRef]
  50. He, X.; Wang, J.; Feng, J.; Yan, Z.; Miao, S.; Zhang, Y.; Xia, J. Observational and Modeling Study of Interactions Between Urban Heat Island and Heatwave in Beijing. J. Clean. Prod. 2020, 247, 119169. [Google Scholar] [CrossRef]
  51. Freychet, N.; Tett, S.; Wang, J.; Hegerl, G. Summer Heat Waves over Eastern China: Dynamical Processes and Trend Attribution. Environ. Res. Lett. 2017, 12, 24015. [Google Scholar] [CrossRef]
  52. Wang, W.; Zhou, W.; Li, X.; Wang, X.; Wang, D. Synoptic-Scale Characteristics and Atmospheric Controls of Summer Heat Waves in China. Clim. Dyn. 2016, 46, 2923–2941. [Google Scholar] [CrossRef]
  53. Wang, P.; Zhang, Q.; Yang, Y.; Tang, J. The Sensitivity to Initial Soil Moisture for Three Severe Cases of Heat Waves over Eastern China. Front. Environ. Sci. 2019, 7, 18. [Google Scholar] [CrossRef]
  54. Miralles, D.G.; Gentine, P.; Seneviratne, S.I.; Teuling, A.J. Land–Atmospheric Feedbacks during Droughts and Heatwaves: State of the Science and Current Challenges. Ann. N. Y. Acad. Sci. 2019, 1436, 19–35. [Google Scholar] [CrossRef]
  55. Han, R.; Li, Z.; Li, Z.; Han, Y. Spatial–Temporal Assessment of Historical and Future Meteorological Droughts in China. Atmosphere 2021, 12, 787. [Google Scholar] [CrossRef]
  56. Liu, Y.; Tian, J.; Liu, R.; Ding, L. Influences of Climate Change and Human Activities on NDVI Changes in China. Remote Sens. 2021, 13, 4326. [Google Scholar] [CrossRef]
  57. Lei, X.; Wang, Z.; Lin, G.; Lai, C. Response of Vegetation Dynamics to Drought at the Eco-Geographical Region Scale Across China. Arabian J. Geosci. 2021, 14, 2649. [Google Scholar] [CrossRef]
  58. Wei, W.; Zhang, J.; Zhou, J.; Zhou, L.; Xie, B.; Li, C. Monitoring Drought Dynamics in China Using Optimized Meteorological Drought Index (OMDI) Based on Remote Sensing Data Sets. J. Environ. Manag. 2021, 292, 112733. [Google Scholar] [CrossRef]
  59. Zheng, Z.; Lin, X.; Chen, L.; Yan, C.; Sun, T. Effects of Urbanization and Topography on Thermal Comfort During a Heat Wave Event: A Case Study of Fuzhou, China. Sustain. Cities Soc. 2024, 102, 105233. [Google Scholar] [CrossRef]
  60. Yue, T.-X.; Zhao, N.; Ramsey, R.D.; Wang, C.-L.; Fan, Z.-M.; Chen, C.-F.; Lu, Y.-M.; Li, B.-L. Climate Change Trend in China, with Improved Accuracy. Clim. Chang. 2013, 120, 137–151. [Google Scholar] [CrossRef]
  61. Song, M.; Wang, J.; Zhao, J. Effects of rising and extreme temperatures on production factor efficiency: Evidence from China’s cities. Int. J. Prod. Econ. 2023, 260, 108847. [Google Scholar] [CrossRef]
  62. Yang, X.; Zhou, B.; Xu, Y.; Han, Z. CMIP6 Evaluation and Projection of Temperature and Precipitation over China. Adv. Atmos. Sci. 2021, 38, 817–830. [Google Scholar] [CrossRef]
  63. Liu, J.; Zhang, T.; Ren, Y.; Willems, P.; Mirchi, A.; Arshad, A.; Liu, T.; Pham, Q.B. Three-Dimensional Evaluation Framework of Hazard–Exposure–Vulnerability for Mapping Heatwave Risk and Associated Dominant Dimensions in China. Int. J. Climatol. 2024, 44, 5136–5155. [Google Scholar] [CrossRef]
  64. General Administration of Quality Supervision, Inspection and Quarantine of the People’s Republic of China; Standardization Administration of the People’s Republic of China. GB/T 35221-2017 Specifications for Surface Meteorological Observation—General. Available online: https://www.cma.gov.cn/zfxxgk/gknr/flfgbz/bz/202209/t20220921_5099079.html (accessed on 5 April 2025).
  65. Wu, Z.; Feng, H.; He, H.; Zhou, J.; Zhang, Y. Evaluation of Soil Moisture Climatology and Anomaly Components Derived from ERA5-Land and GLDAS-2.1 in China. Water Resour. Manag. 2021, 35, 629–643. [Google Scholar] [CrossRef]
  66. Liu, H.; Dong, L.; Yan, R.; Zhang, X.; Guo, C.; Liang, S.; Tu, J.; Feng, X.; Wang, X. Evaluation of Near-Surface Wind Speed Climatology and Long-Term Trend over China’s Mainland Region Based on ERA5 Reanalysis. Clim. Environ. Res. 2021, 26, 299–311. [Google Scholar]
  67. Liu, Y.; Yang, Y. Detecting a Declining Trend of Multidepth Soil Moisture over the Mongolian Plateau from 1950 to 2020 Using ERA5-Land Reanalysis Datasets. IEEE Access 2022, 10, 95509–95526. [Google Scholar] [CrossRef]
  68. You, Q.; Jiang, Z.; Kong, L.; Wu, Z.; Bao, Y.; Kang, S.; Pepin, N. A Comparison of Heat Wave Climatologies and Trends in China Based on Multiple Definitions. Clim. Dyn. 2017, 48, 3975–3989. [Google Scholar] [CrossRef]
  69. Perkins, S.E.; Alexander, L.V. On the Measurement of Heat Waves. J. Clim. 2013, 26, 4500–4517. [Google Scholar] [CrossRef]
  70. Jun, Y.; Liu, H.Z.; Ou, C.Q.; Lin, G.Z.; Yan, D.; Qin, Z.; Shen, J.C.; Chen, P.Y. Impact of Heat Wave in 2005 on Mortality in Guangzhou, China. Biomed. Environ. Sci. 2013, 26, 647–654. [Google Scholar]
  71. Tong, S.; FitzGerald, G.; Wang, X.-Y.; Aitken, P.; Tippett, V.; Chen, D.; Wang, X.; Guo, Y. Exploration of the Health Risk-Based Definition for Heatwave: A Multi-City Study. Environ. Res. 2015, 142, 696–702. [Google Scholar] [CrossRef]
  72. Xu, Z.; FitzGerald, G.; Guo, Y.; Jalaludin, B.; Tong, S. Impact of Heatwave on Mortality Under Different Heatwave Definitions: A Systematic Review and Meta-Analysis. Environ. Int. 2016, 89, 193–203. [Google Scholar] [CrossRef]
  73. Xu, Z.; Cheng, J.; Hu, W.; Tong, S. Heatwave and Health Events: A Systematic Evaluation of Different Temperature Indicators, Heatwave Intensities and Durations. Sci. Total Environ. 2018, 630, 679–689. [Google Scholar] [CrossRef]
  74. Tolika, K. Assessing Heat Waves over Greece Using the Excess Heat Factor (EHF). Climate 2019, 7, 9. [Google Scholar] [CrossRef]
  75. Oliveira, A.; Lopes, A.; Soares, A. Excess Heat Factor Climatology, Trends, and Exposure across European Functional Urban Areas. Weather Clim. Extremes 2022, 36, 100455. [Google Scholar] [CrossRef]
  76. Borg, M.; Nitschke, M.; Williams, S.; McDonald, S.; Nairn, J.; Bi, P. Using the Excess Heat Factor to Indicate Heatwave-Related Urinary Disease: A Case Study in Adelaide, South Australia. Int. J. Biometeorol. 2019, 63, 435–447. [Google Scholar] [CrossRef] [PubMed]
  77. Perkins-Kirkpatrick, S.; White, C.; Alexander, L.; Argüeso, D.; Boschat, G.; Cowan, T.; Evans, J.; Ekström, M.; Oliver, E.; Phatak, A. Natural Hazards in Australia: Heatwaves. Clim. Chang. 2016, 139, 101–114. [Google Scholar] [CrossRef]
  78. Nicholls, N.; Skinner, C.; Loughnan, M.; Tapper, N. A Simple Heat Alert System for Melbourne, Australia. Int. J. Biometeorol. 2008, 52, 375–384. [Google Scholar] [CrossRef] [PubMed]
  79. Saez, M.; Sunyer, J.; Castellsagué, J.; Murillo, C.; Antó, J.M. Relationship between Weather Temperature and Mortality: A Time Series Analysis Approach in Barcelona. Int. J. Epidemiol. 1995, 24, 576–582. [Google Scholar] [CrossRef] [PubMed]
  80. Hajat, S.; Kovats, R.S.; Atkinson, R.W.; Haines, A. Impact of Hot Temperatures on Death in London: A Time Series Approach. J. Epidemiol. Community Health 2002, 56, 367–372. [Google Scholar] [CrossRef]
  81. Ding, T.; Qian, W. Geographical Patterns and Temporal Variations of Regional Dry and Wet Heatwave Events in China During 1960–2008. Adv. Atmos. Sci. 2011, 28, 322–337. [Google Scholar] [CrossRef]
  82. Luo, M.; Ning, G.; Xu, F.; Wang, S.; Liu, Z.; Yang, Y. Observed Heatwave Changes in Arid Northwest China: Physical Mechanism and Long-Term Trend. Atmos. Res. 2020, 242, 105009. [Google Scholar] [CrossRef]
  83. Tan, Z.; Liu, Y.; Tang, W.; Li, D.; Gao, J.; Luo, M. Impact of the Tibetan Plateau Heat Source on Heatwaves in China. Clim. Dyn. 2025, 63, 2. [Google Scholar] [CrossRef]
  84. Dong, C.; Wang, X.; Ran, Y.; Nawaz, Z. Heatwaves Significantly Slow the Vegetation Growth Rate on the Tibetan Plateau. Remote Sens. 2022, 14, 2402. [Google Scholar] [CrossRef]
  85. Change, I.P.O.C. Climate Change 2007: The Physical Science Basis. Agenda 2007, 6, 333. [Google Scholar]
  86. Sun, Y.; Zhang, X.; Zwiers, F.W.; Song, L.; Wan, H.; Hu, T.; Yin, H.; Ren, G. Rapid Increase in the Risk of Extreme Summer Heat in Eastern China. Nat. Clim. Chang. 2014, 4, 1082–1085. [Google Scholar] [CrossRef]
  87. Wu, W.; Liu, Q.; Li, H.; Huang, C. Spatiotemporal Distribution of Heatwave Hazards in the Chinese Mainland for the Period 1990–2019. Int. J. Environ. Res. Public Health 2023, 20, 1532. [Google Scholar] [CrossRef] [PubMed]
  88. Ming, Y.; Shuqing, S. A Study on the Response of Subtropical High over the Western Pacific on the SST Anomaly. Chin. J. Atmos. Sci. (Chin. Ed.) 2000, 24, 206–213. [Google Scholar]
  89. Yimin, L.; Guoxiong, W. Progress in the Study on the Formation of the Summertime Subtropical Anticyclone. Adv. Atmos. Sci. 2004, 21, 322–342. [Google Scholar] [CrossRef]
  90. Gong, H.; Ma, K.; Hu, Z.; Dong, Z.; Ma, Y.; Chen, W.; Wu, R.; Wang, L. Attribution of the August 2022 Extreme Heatwave in Southern China: Role of Dynamical and Thermodynamical Processes. Bull. Am. Meteorol. Soc. 2024, 105, E193–E199. [Google Scholar] [CrossRef]
  91. Entekhabi, D.; Rodriguez-Iturbe, I.; Castelli, F. Mutual Interaction of Soil Moisture State and Atmospheric Processes. J. Hydrol. 1996, 184, 3–17. [Google Scholar] [CrossRef]
  92. Dong, D.; Tao, H.; Zhang, Z. Historic Evolution of Population Exposure to Heatwaves in Xinjiang Uygur Autonomous Region, China. Sci. Rep. 2023, 13, 7401. [Google Scholar] [CrossRef]
  93. Liu, J.; Wang, A.; Zhang, T.; Pan, P.; Ren, Y. Projected Increase in Heatwaves under 1.5 and 2.0 C Warming Levels Will Increase the Socio-Economic Exposure Across China by the Late 21st Century. Atmosphere 2024, 15, 900. [Google Scholar] [CrossRef]
  94. Dong, B.; Sutton, R.T.; Shaffrey, L. Understanding the Rapid Summer Warming and Changes in Temperature Extremes Since the Mid-1990s over Western Europe. Clim. Dyn. 2017, 48, 1537–1554. [Google Scholar] [CrossRef]
  95. Miralles, D.G.; Teuling, A.J.; Van Heerwaarden, C.C.; Vilà-Guerau de Arellano, J. Mega-Heatwave Temperatures Due to Combined Soil Desiccation and Atmospheric Heat Accumulation. Nat. Geosci. 2014, 7, 345–349. [Google Scholar] [CrossRef]
  96. Chen, L.; Chen, H.; Qi, Y. Regional Differences in the Effects of Land–Atmosphere Coupling on Summer High-Temperature Events in Eastern China and Their Possible Mechanisms. Chin. J. Atmos. Sci. 2024, 49, 107–122. [Google Scholar] [CrossRef]
  97. Seneviratne, S.I.; Lüthi, D.; Litschi, M.; Schär, C. Land–Atmosphere Coupling and Climate Change in Europe. Nature 2006, 443, 205–209. [Google Scholar] [CrossRef]
  98. Cheng, S.; Wang, S.; Li, M.; He, Y. Summer Heatwaves in China During 1961–2021: The Impact of Humidity. Atmos. Res. 2024, 304, 107366. [Google Scholar] [CrossRef]
  99. Lu, G.; Li, Q.; Sun, X.; Zhao, M.; Dong, L.; Wu, Q.; Wang, L.; Zhao, L.; Duan, C.; Yin, Y. Comparative Analysis of Peak-Summer Heatwaves in the Yangtze–Huaihe River Basin of China in 2022 and 2013: Thermal Effects of the Tibetan Plateau. Atmos. Res. 2024, 300, 107222. [Google Scholar] [CrossRef]
  100. Zhao, J.; Li, T.; Shi, K.; Qiao, Z.; Xia, Z. Evaluation of ERA-5 Precipitable Water Vapor Data in Plateau Areas: A Case Study of the Northern Qinghai-Tibet Plateau. Atmosphere 2021, 12, 1367. [Google Scholar] [CrossRef]
  101. Zhang, J.; Ren, G.; You, Q. Assessing the Escalating Human-Perceived Heatwaves in a Warming World: The Case of China. Weather Clim. Extrem. 2024, 43, 100643. [Google Scholar] [CrossRef]
  102. Guo, X.; Huang, J.; Luo, Y.; Zhao, Z.; Xu, Y. Projection of Heat Waves over China for Eight Different Global Warming Targets Using 12 CMIP5 Models. Theor. Appl. Climatol. 2017, 128, 507–522. [Google Scholar] [CrossRef]
  103. Jiang, Y.; Yang, K.; Shao, C.; Zhou, X.; Zhao, L.; Chen, Y.; Wu, H. A Downscaling Approach for Constructing High-Resolution Precipitation Dataset over the Tibetan Plateau from ERA5 Reanalysis. Atmos. Res. 2021, 256, 105574. [Google Scholar] [CrossRef]
  104. Jones, J.W.; Hoogenboom, G.; Porter, C.H.; Boote, K.J.; Batchelor, W.D.; Hunt, L.; Wilkens, P.W.; Singh, U.; Gijsman, A.J.; Ritchie, J.T. The DSSAT Cropping System Model. Eur. J. Agron. 2003, 18, 235–265. [Google Scholar] [CrossRef]
Figure 1. Figures (a,b) illustrate China’s geographical location within the global context and its neighboring countries in Asia (cited from [63]). Figure (c) presents the distribution of meteorological stations used in this study. Figure (d) displays China’s Köppen–Geiger climate classification. Figures (e,f) show the multi-year average temperature and multi-year average maximum temperature of China, respectively.
Atmosphere 16 00434 g001
Figure 2. Extreme heat thresholds at meteorological stations in China from July to August 2013–2023.
Atmosphere 16 00434 g002
Figure 3. Annual average number of heatwave events (HWN) at meteorological stations in China from July to August 2013–2023.
Atmosphere 16 00434 g003
Figure 4. Annual average frequency of heatwave events (HWF) at meteorological stations in China from July to August 2013–2023.
Atmosphere 16 00434 g004
Figure 5. Annual average duration of heatwave events (HWD) at meteorological stations in China from July to August 2013–2023.
Atmosphere 16 00434 g005
Figure 6. Annual average intensity of heatwave events (HWI) at meteorological stations in China from July to August 2013–2023.
Atmosphere 16 00434 g006
Figure 7. Selected typical research areas for studying the driving factors of heatwaves.
Atmosphere 16 00434 g007
Figure 8. Schematic of atmospheric circulation in the Yangtze River Delta from 18 to 25 July 2017.
Atmosphere 16 00434 g008
Figure 9. Schematic of atmospheric circulation in Fujian from 22 to 29 July 2022.
Atmosphere 16 00434 g009
Figure 10. Schematic of atmospheric circulation in Guangdong, Guangxi, and Hainan from 24 to 31 July 2023.
Atmosphere 16 00434 g010
Figure 11. Schematic of atmospheric circulation in the Tibetan Plateau from 10 to 18 August 2022.
Atmosphere 16 00434 g011
Figure 12. Anomalies in soil moisture in Guangdong, Guangxi, and Hainan during 24–31 July 2023.
Atmosphere 16 00434 g012
Figure 13. Anomalies in soil moisture in the Yangtze River Delta during 18–25 July 2017.
Atmosphere 16 00434 g013
Figure 14. Anomalies in soil moisture in Fujian during 22–29 July 2022.
Atmosphere 16 00434 g014
Figure 15. Anomalies in soil moisture in the Tibetan Plateau during 10–18 August 2022.
Atmosphere 16 00434 g015
Table 1. Definition of Heatwave Characteristics Based on EHF.
IndicatorsDefinition
HWNNumber of heatwaves
HWFNumber of days with EHF > 0 in heatwave events
HWDLongest consecutive days with EHF > 0 in heatwave events
HWIHighest EHF recorded in heatwave events
Disclaimer/Publisher’s Note: The statements, opinions and data contained in all publications are solely those of the individual author(s) and contributor(s) and not of MDPI and/or the editor(s). MDPI and/or the editor(s) disclaim responsibility for any injury to people or property resulting from any ideas, methods, instructions or products referred to in the content.

