1. Introduction
With the accelerating progress of global urbanization and industrialization, air pollution has increasingly become a major challenge restricting the sustainable development of the economy and society [
1,
2]. Currently, approximately 90% of the global population breathes air that exceeds the air pollution limitation set by the World Health Organization, which leads to about 8 million deaths each year [
3]. From a social perspective, air pollution may increase the health costs of residents, thereby increasing the overall health expenditure of society [
4,
5]. To address this issue, a series of international cooperation initiatives or projects have been launched at the international level, such as the Paris Climate Agreement [
6], the World Health Organization (WHO) Air Quality Guidelines [
7], and the United Nations Sustainable Development Goals [
8]. This indicates that people’s understanding of the spatial spillover effects and externalities of air pollution [
9,
10,
11,
12] is gradually deepening, and the control of air pollution has become a core issue in global public health and environmental governance. At the national level, taking China, the world’s largest energy consumer and carbon emitter [
13], as an example, a series of environmental regulations have been introduced to address environmental issues, such as suppressing pollution emissions at the source [
14], strengthening pollution monitoring and management nationwide [
15], and setting long-term goals for air quality improvement [
16].
Compared with air pollution in other regions, the air pollution problem in large cities—cities with a population exceeding 10 million—has multidimensional particularities. On the one hand, due to the unique climatic environment of cities, the urban heat island effect can significantly amplify air pollution [
17,
18]. On the other hand, factors such as industrial agglomeration [
19], energy consumption [
20], transportation [
21], and population density [
22] all contribute to air pollution. Therefore, urban air pollution exhibits characteristics of high intensity and complex and multiple sources, and these effects are closely related to the size of the city. With the continuous and accelerating expansion of global cities in the future [
23], targeted research on air pollution in large cities is urgently needed.
In response to this trend, scholars have conducted research from different directions. They have optimized the monitoring and management of urban air quality by constructing urban environmental quality indices [
24], setting up spatiotemporal prediction models [
25], and quantifying the hazards of particulate matter [
26]. Other studies have focused on the multiple impacts of urban air pollution, including health threats [
27] and economic damages [
28]. In addition, other studies have proposed governance strategies for urban air pollution, such as promoting inter-regional cooperation [
29], strengthening the construction of green infrastructure [
30,
31], and promoting the use of clean energy [
32].
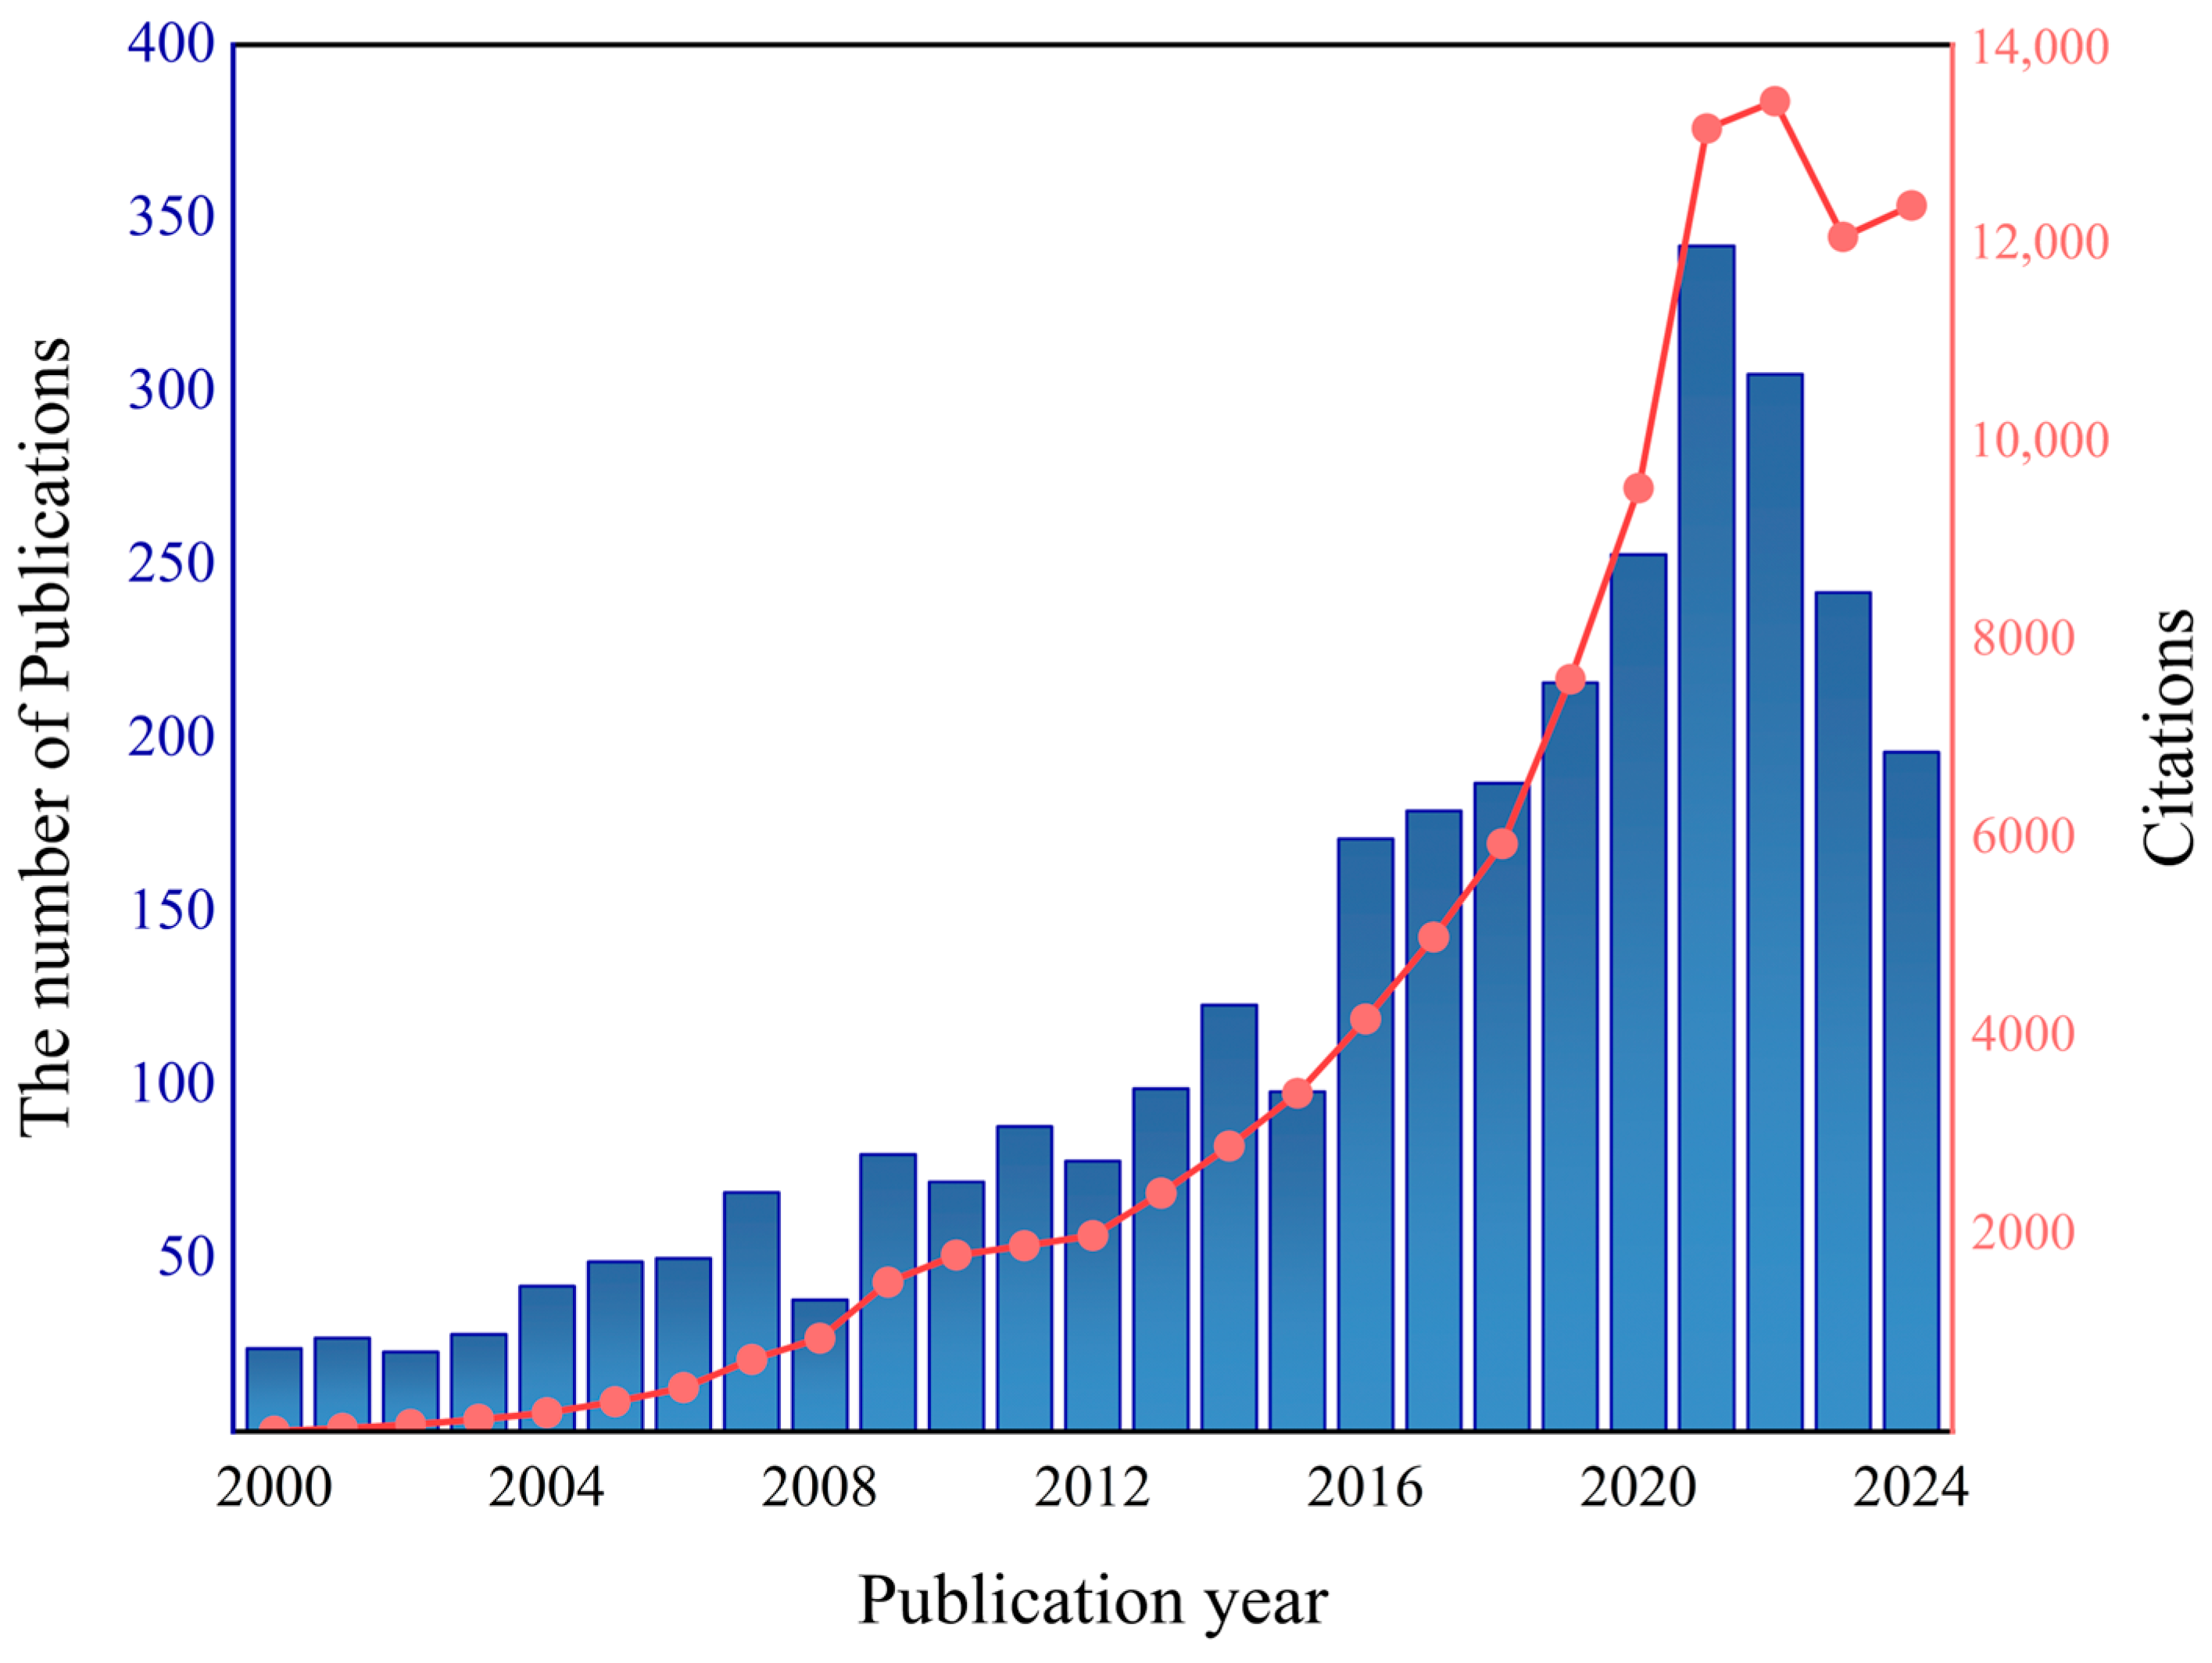
Figure 1 shows the annual number of published papers and the number of citations in the research literature on air pollution in metropolitan areas and megacities, with a time span from 2000 to 2024. It can be seen that with the acceleration of the urbanization process, research on air pollution in large cities has surged over time, and this trend has been particularly evident since 2016. This indicates that this field is developing rapidly and is receiving increasing attention from the academic community.
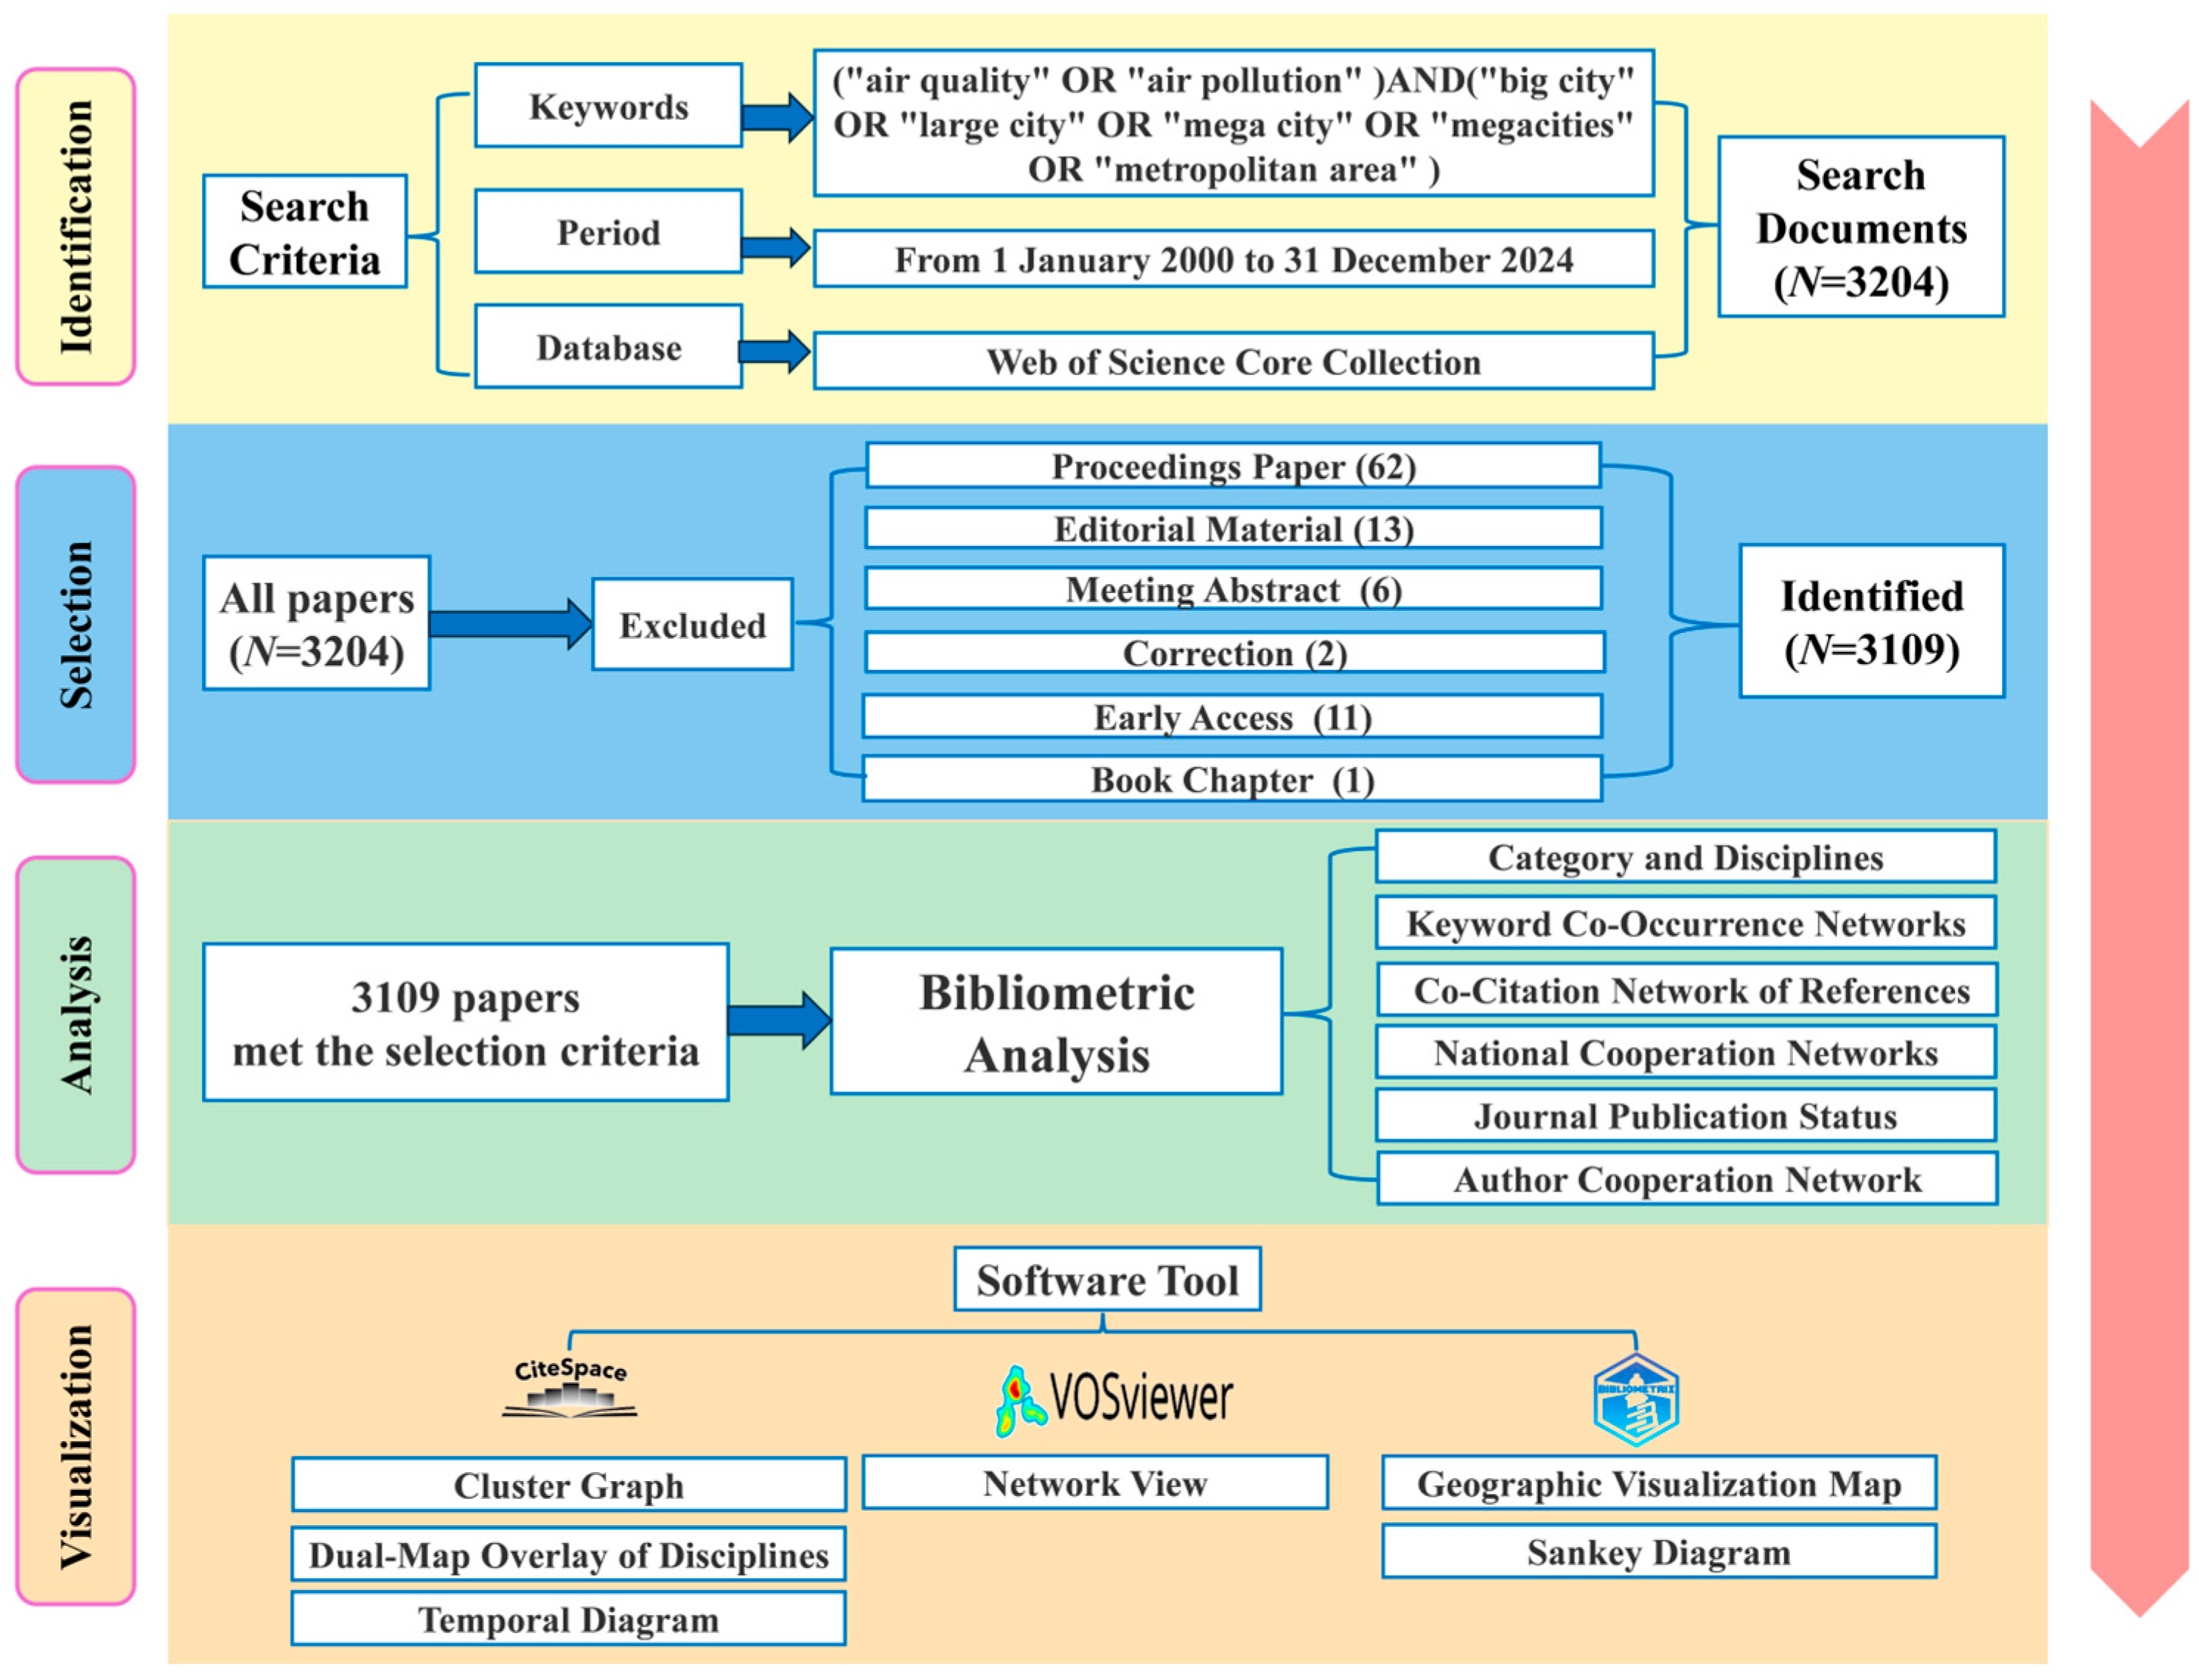
The existing literature related to air pollution in metropolitan areas and megacities can mainly be classified into three aspects of research: “pollutants—health effects—monitoring and governance”. However, most of these studies often have the following limitations: (1) The research objects are only some cities, regions, or countries, which reduces the universality and persuasiveness of the research. (2) The research time span is insufficient, and it is impossible to capture the long-term evolution laws of pollution mechanisms. (3) The research topics are fragmented. Most studies analyze single aspects, such as pollution sources, health hazards, or policy effects in isolation, without taking an overall perspective. To make up for the deficiencies of previous studies in long-term time series tracking, regional expansion analysis, and theme coupling research, this paper uses the bibliometric method, integrating Citespace, VOSviewer, and Bibliometrix, to systematically integrate 3109 relevant records from the literature between 2000 and 2024 and conduct a multidimensional analysis of air pollution in large cities. Compared with traditional reviews, this method can better systematically identify the coupling paths of “pollutants—health effects—monitoring and governance” through co-occurrence networks and clustering algorithms. Focusing on large city areas can deepen the understanding of the characteristics of air pollution and the difficulties in governance in this specific environment. In this way, the research hotspots and development trends in this field can be determined, providing a reference for future research directions in this field.
The purpose of this study is to address the following six research questions: (1) What is the overall development trend of research on air pollution in large cities? (2) What are the most prominent themes and keywords in the literature? (3) How is the subject distribution in the research on air quality in large cities? (4) What is the geographical distribution of the research? (5) Which countries are involved, and what is the pattern of international cooperation? (6) Which journals hold important positions in this field?
3. Results
3.1. Literature Classification in Megacities’ Air Pollution
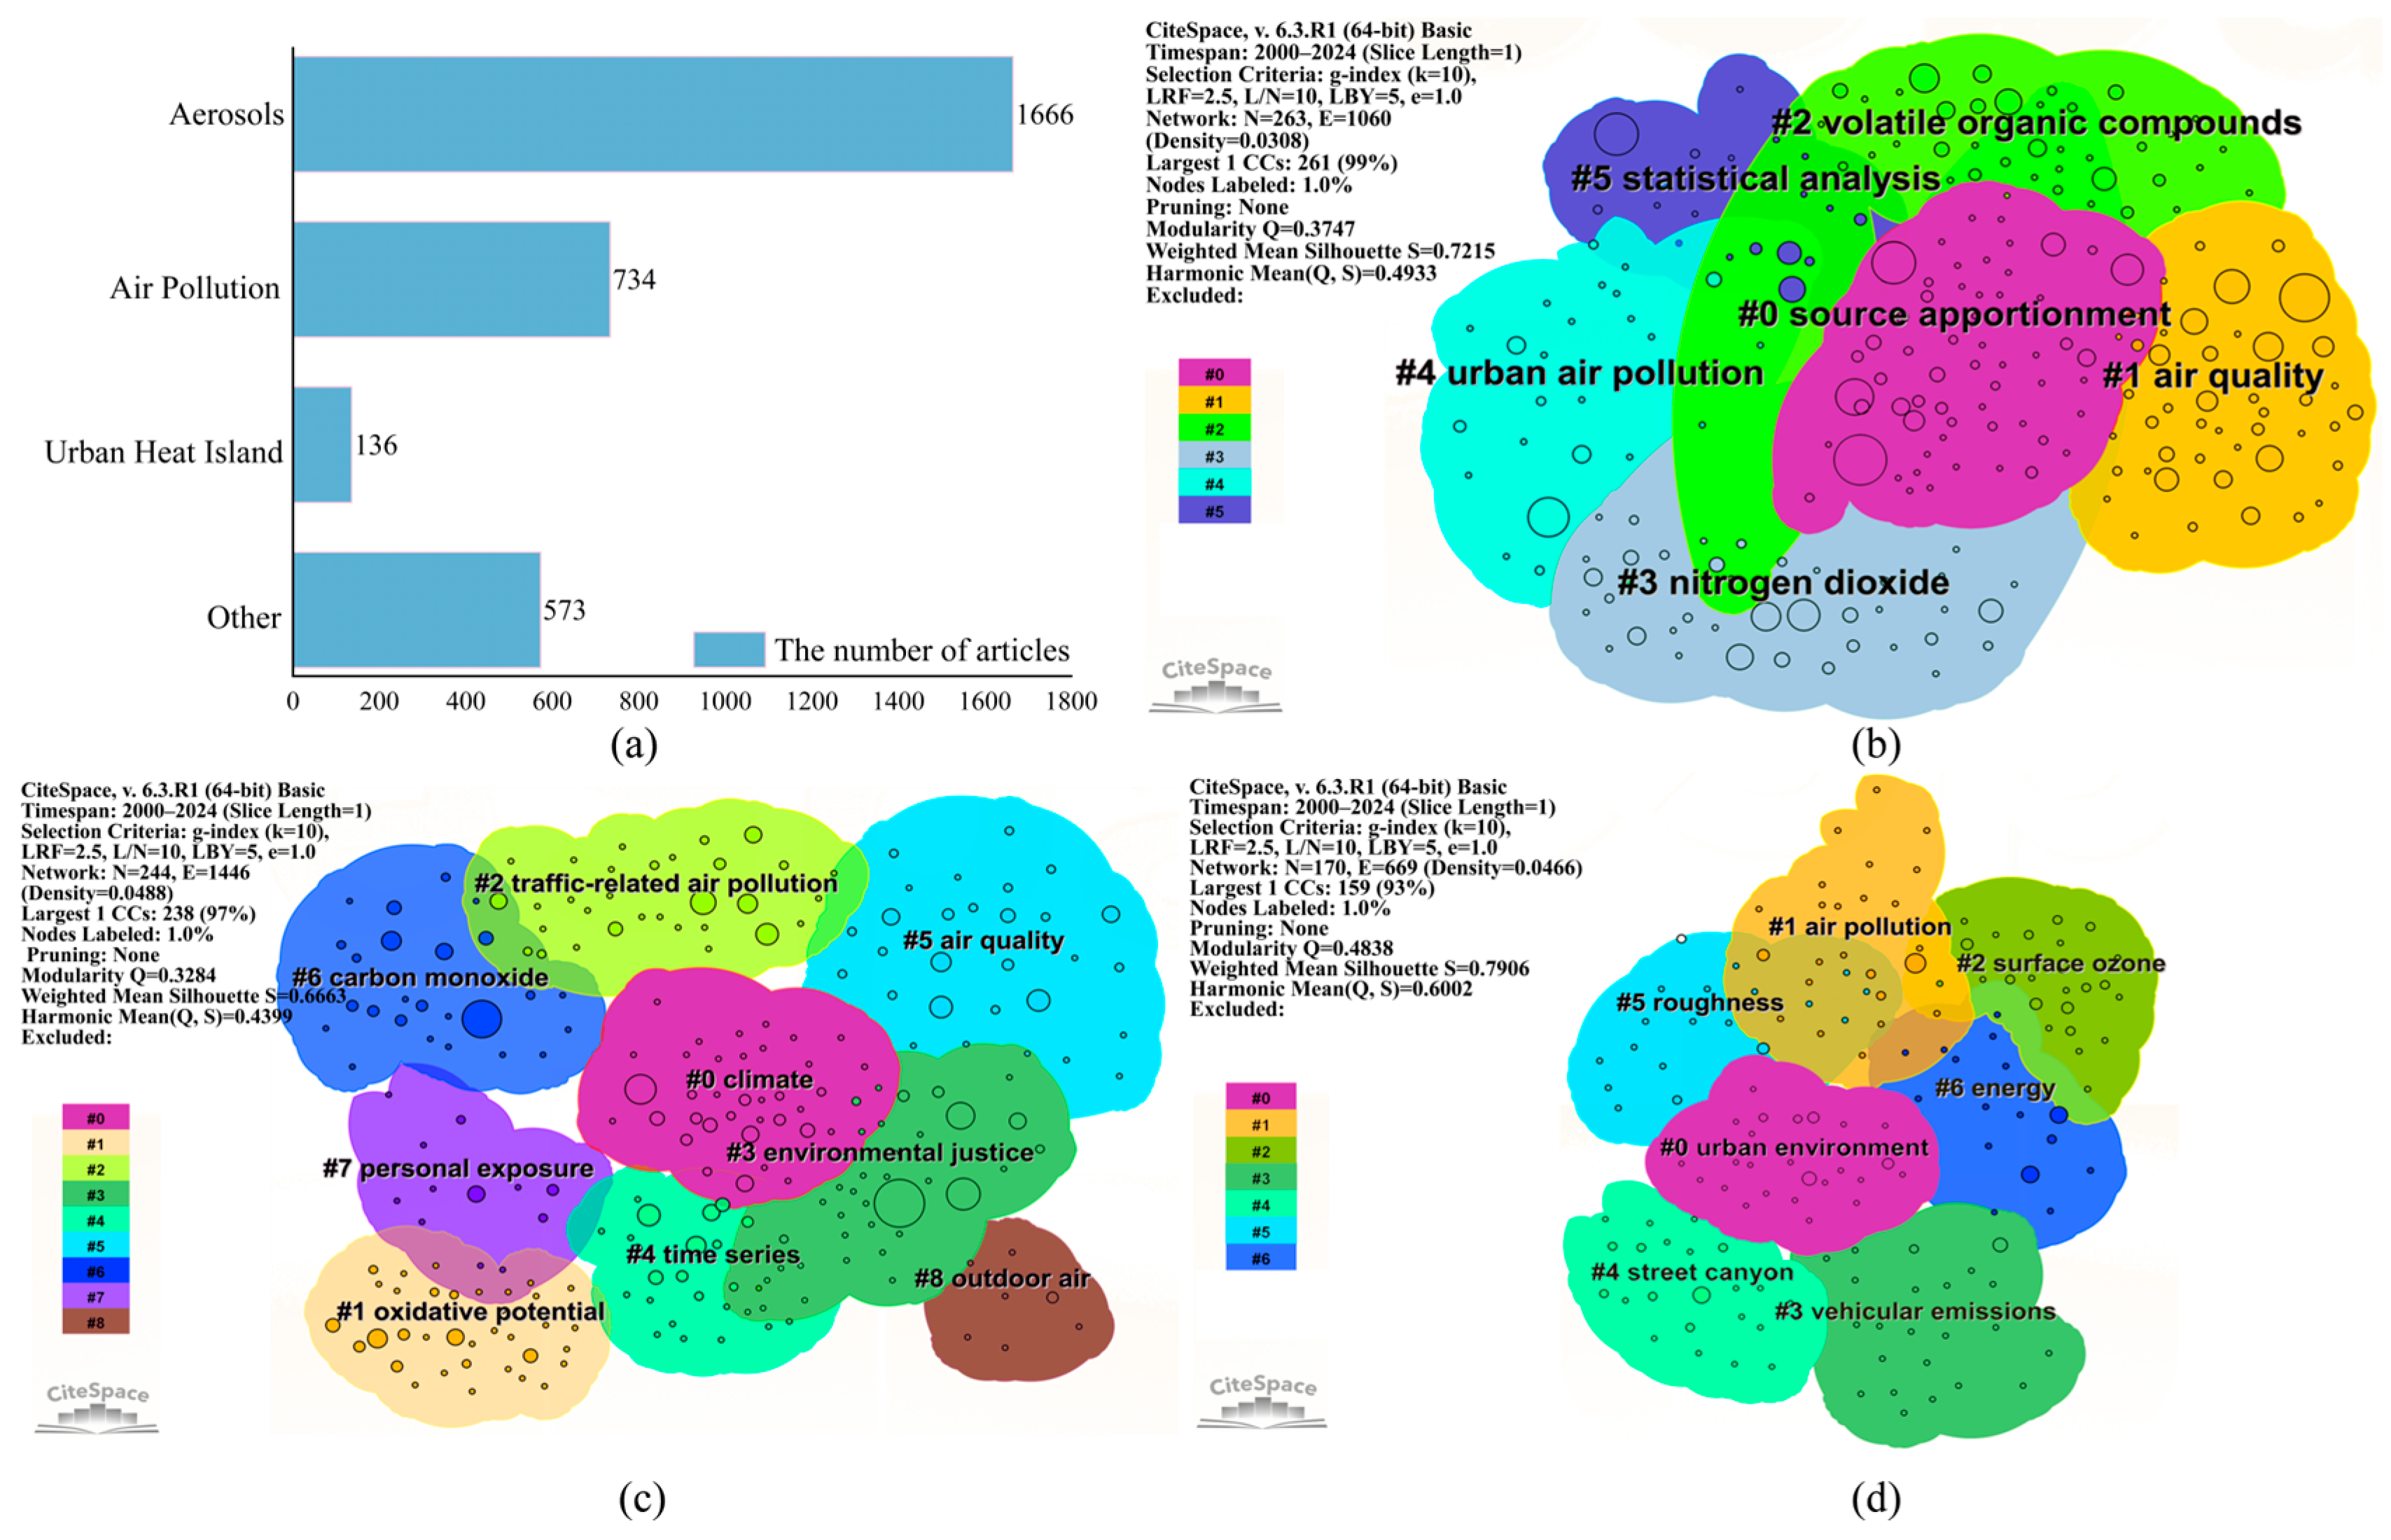
Based on the 3109 research articles related to urban air pollution, the categorization results are shown in
Figure 3a. Among these studies, aerosols represent the most extensively studied topic, with a total of 1666 articles. Aerosols refer to tiny particles suspended in the air, which have significant impacts on climate, environment, and human health [
36,
37,
38,
39], making them a central focus of research. Following this, the topics of air pollution and urban heat islands have received 573 and 136 publications, respectively. This trend suggests that researchers are increasingly recognizing the role of aerosols in air pollution. Additionally, since the urban heat island effect can exacerbate air pollution levels in cities [
18,
40], it has also drawn considerable research attention.
To gain deeper insights, a keyword clustering analysis was performed on the categorized literature.
Figure 3b presents the keyword clustering results for aerosol research, which primarily focus on source apportionment, volatile organic compounds (VOCs), and nitrogen dioxide (NO
2). Meanwhile,
Figure 3c illustrates the clustering results for air pollution, highlighting key topics such as climate, oxidative potential, traffic-related air pollution, and environmental justice. For urban heat island research,
Figure 3d reveals that the most frequently discussed topics include urban environment, air quality, ground-level ozone, and street canyon effects.
Overall, aerosols and urban heat islands play a crucial role in urban air pollution research, and the three topics are closely interconnected. Aerosols are not only major air pollutants but may also interact with urban heat island effects, further worsening air pollution in metropolitan areas. Therefore, future research should focus on unraveling the coupling mechanisms between aerosols, urban heat islands, and air pollution. A deeper understanding of these interactions will contribute to the development of more comprehensive and effective urban pollution control strategies.
3.2. Category and Disciplines
In bibliometric research, dual-map overlay can demonstrate the dynamic evolution process of research trends and knowledge transfer among different subject categories by creating and combining two independent subject maps [
41]. As shown in
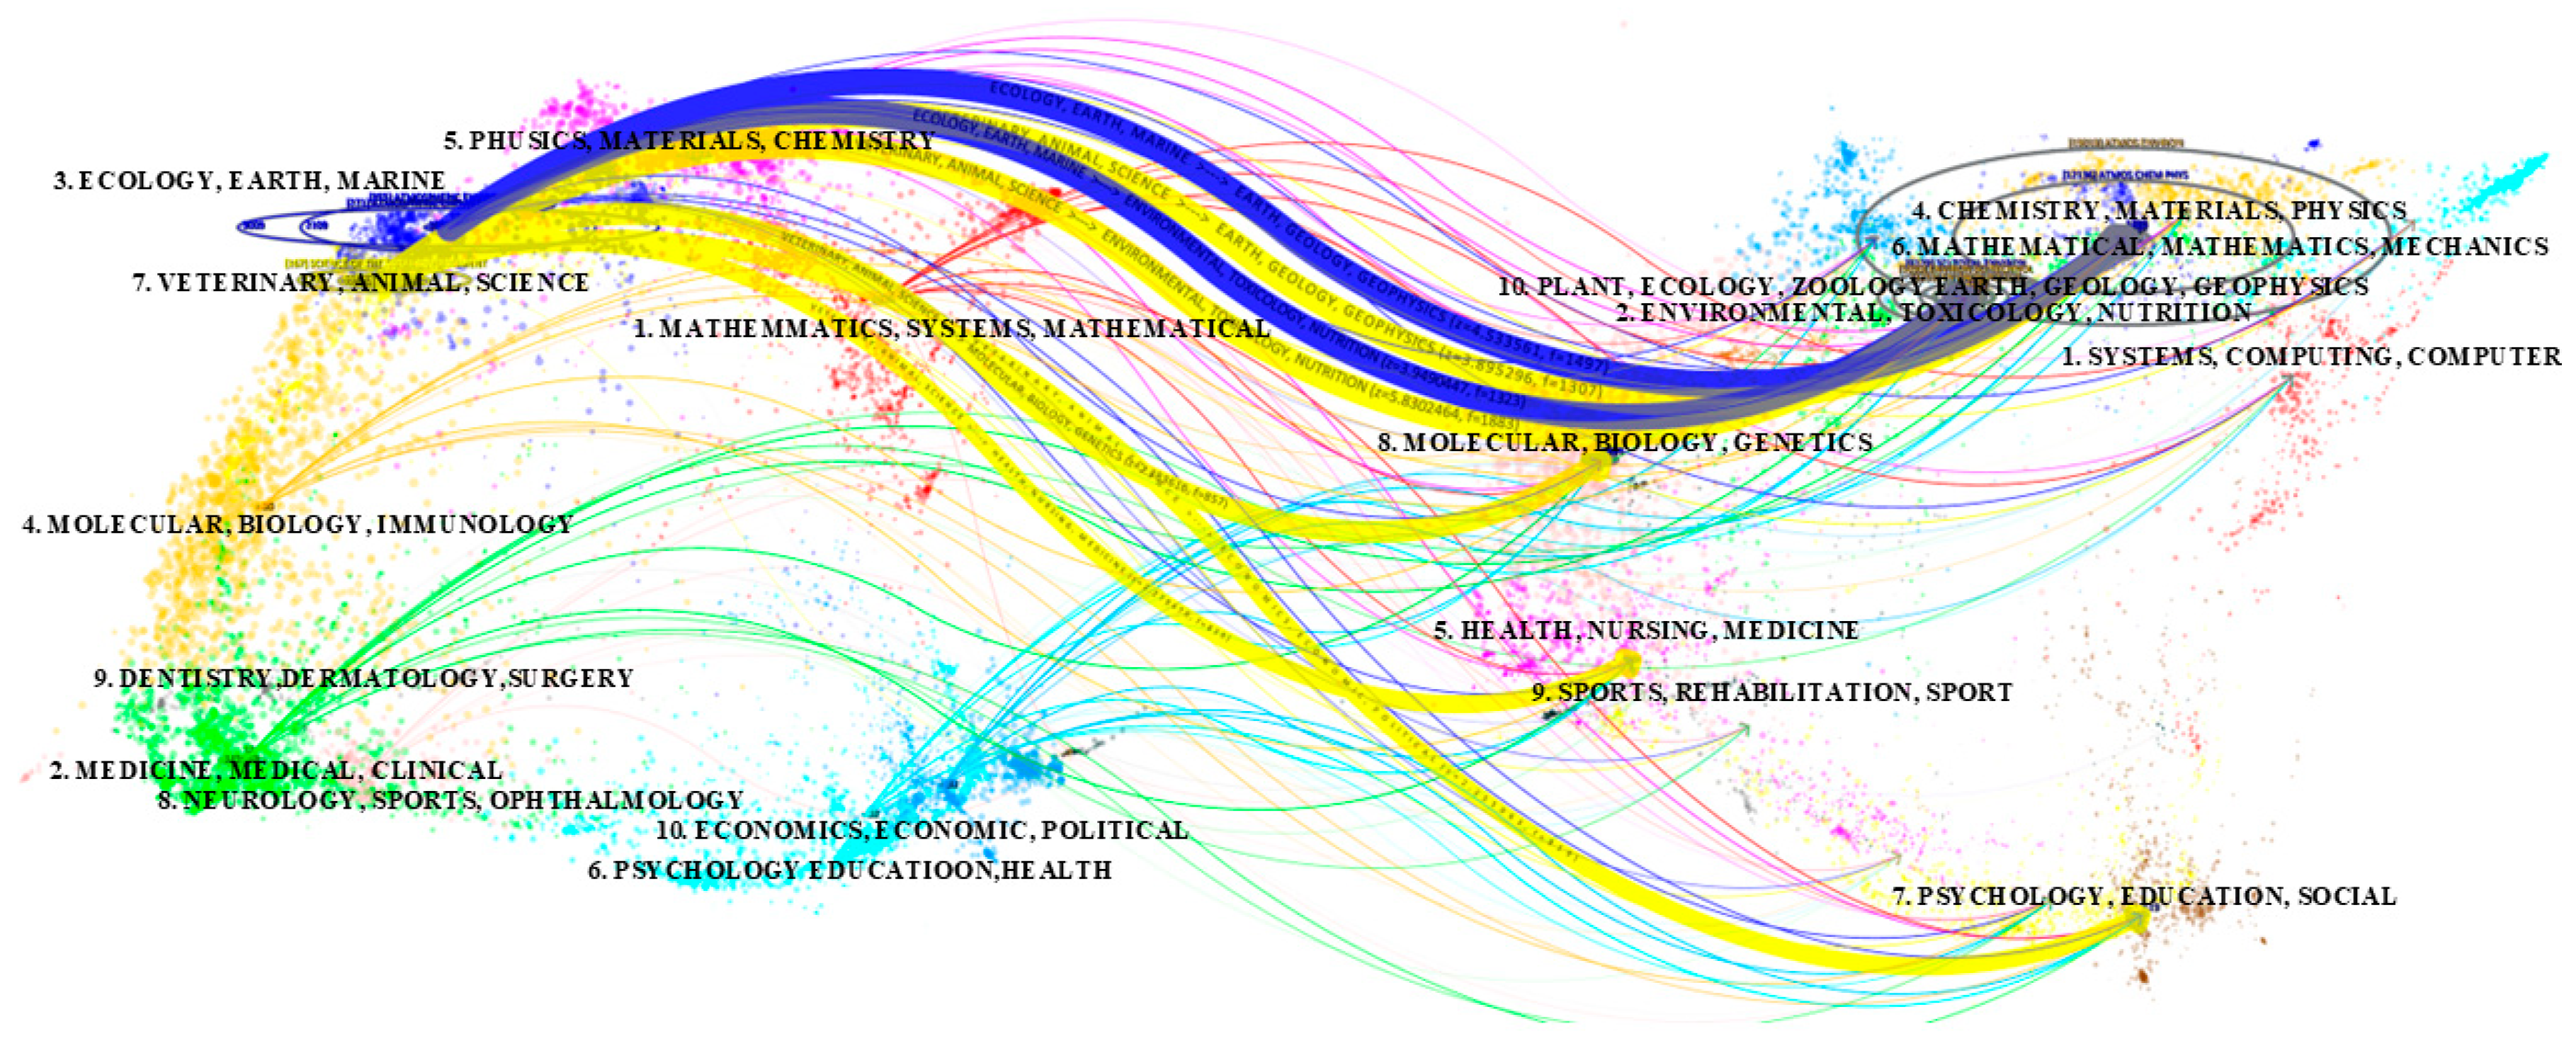
Figure 4, the dual-map overlay in the field of air pollution in large cities is realized through the Citespace software. On the left side is the set of citing journals representing the knowledge frontiers in this field, and on the right side is the knowledge base of this field, presented as the set of cited journals. Different types of disciplines are distinguished by clusters of different colors. The lines represent the interdisciplinary interactions, and the thickness of the paths represents the strength of the literature citation path. The path color is consistent with the discipline clustering on the left side, and the position of the circles in the figure reveals the dominant core disciplines in this field.
Seven main citation lines (two blue lines and five yellow lines) appear in the figure. Most of the cited journals are concentrated in Subject 3 (ecology, earth, marine) and Subject 7 (veterinary, animal, science), while the cited journals are found in Subject 2 (environmental, toxicology, nutrition), Subject 4 (chemistry, materials, physics), Subject 5 (health, nursing, medicine), Subject 7 (psychology, education, social), and Subject 8 (molecular, biology, genetics). Overall, compared with the subject distribution of the citing journals, the subject distribution in the set of cited journals is more extensive, and the map as a whole exhibits obvious convergence characteristics. This indicates that in the research field of air pollution in large cities, the trend of multidisciplinary integration is gradually becoming mainstream, and the interactions and cooperation among these disciplines are likely to be further strengthened in the future.
3.3. Keyword Co-Occurrence Networks Analysis
Keyword co-occurrence analysis has been widely used in research across various fields [
42,
43,
44] and is a commonly employed bibliometric method. By conducting a correlation analysis of the co-occurrence of multiple keywords in the same literature, it is possible to capture the research themes and hot trends within the field. In terms of tool selection, since Citespace focuses on the temporal changes of data and dynamic visualization, and VOSspace focuses on clustering analysis and spatial visualization, this paper uses Citespace and VOSviewer to generate keyword co-occurrence maps for the research on air pollution in large cities respectively to conduct a multidimensional analysis of the current hotspots and future trends in this research field.
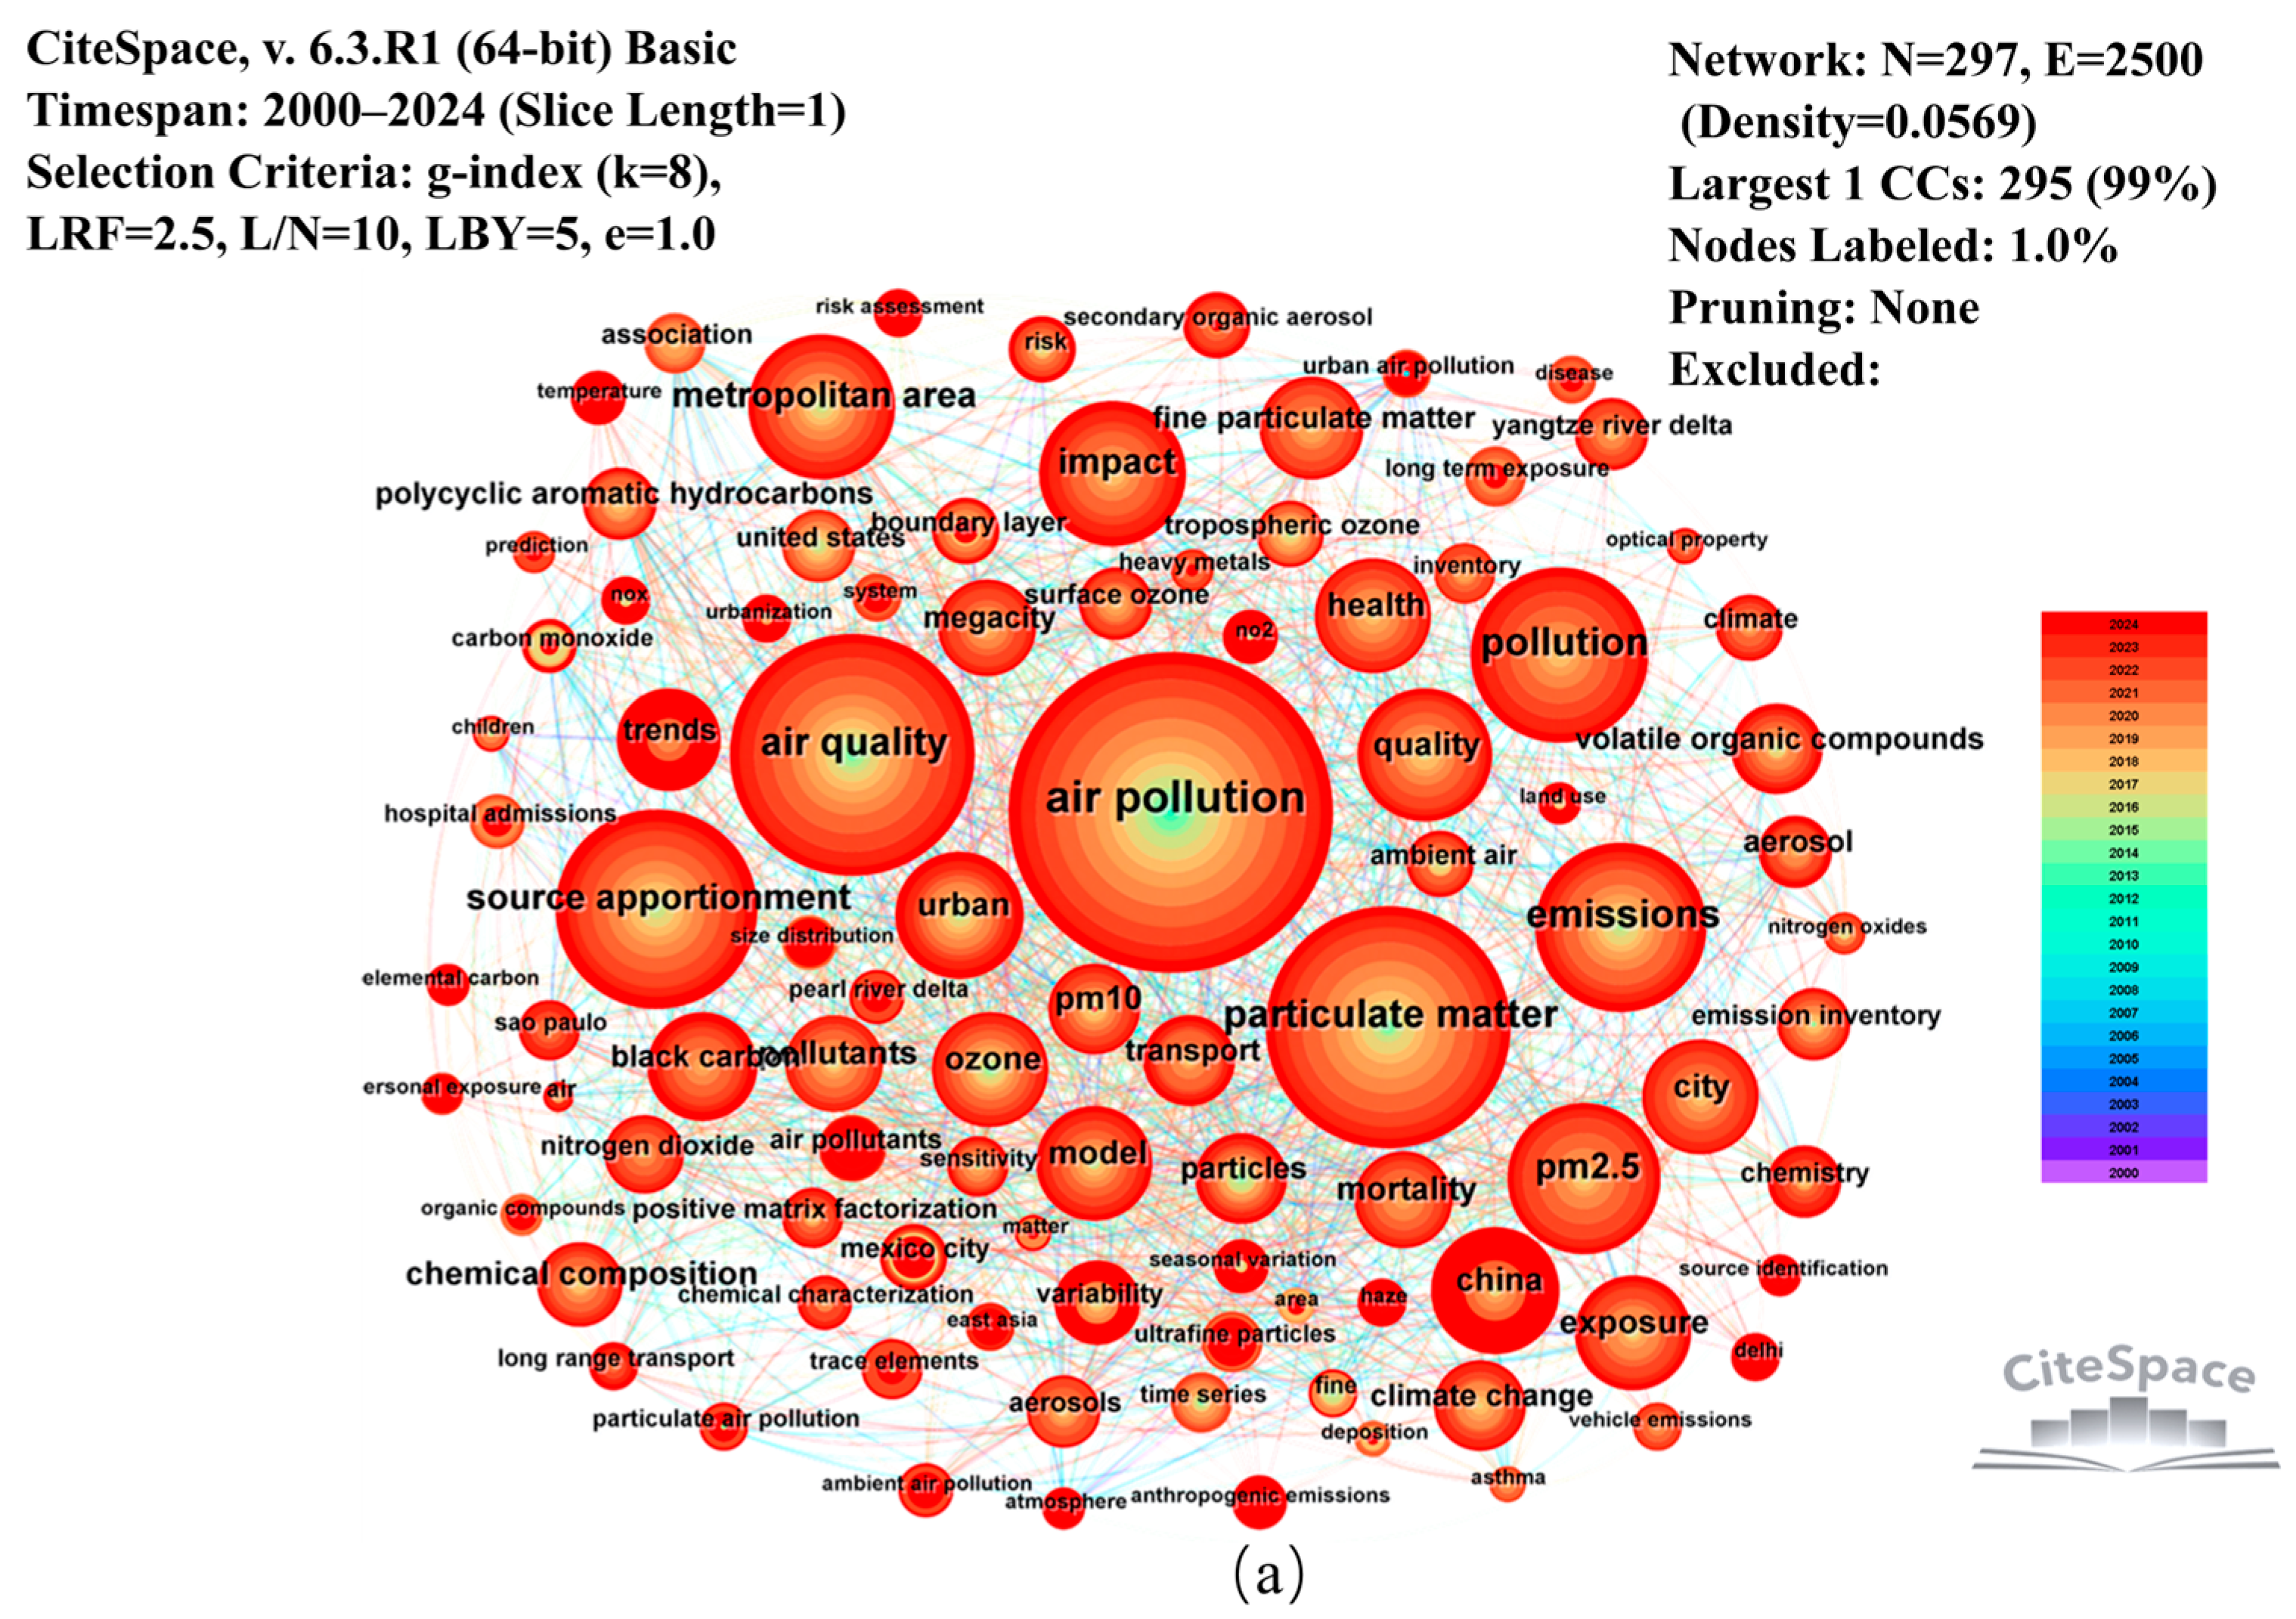
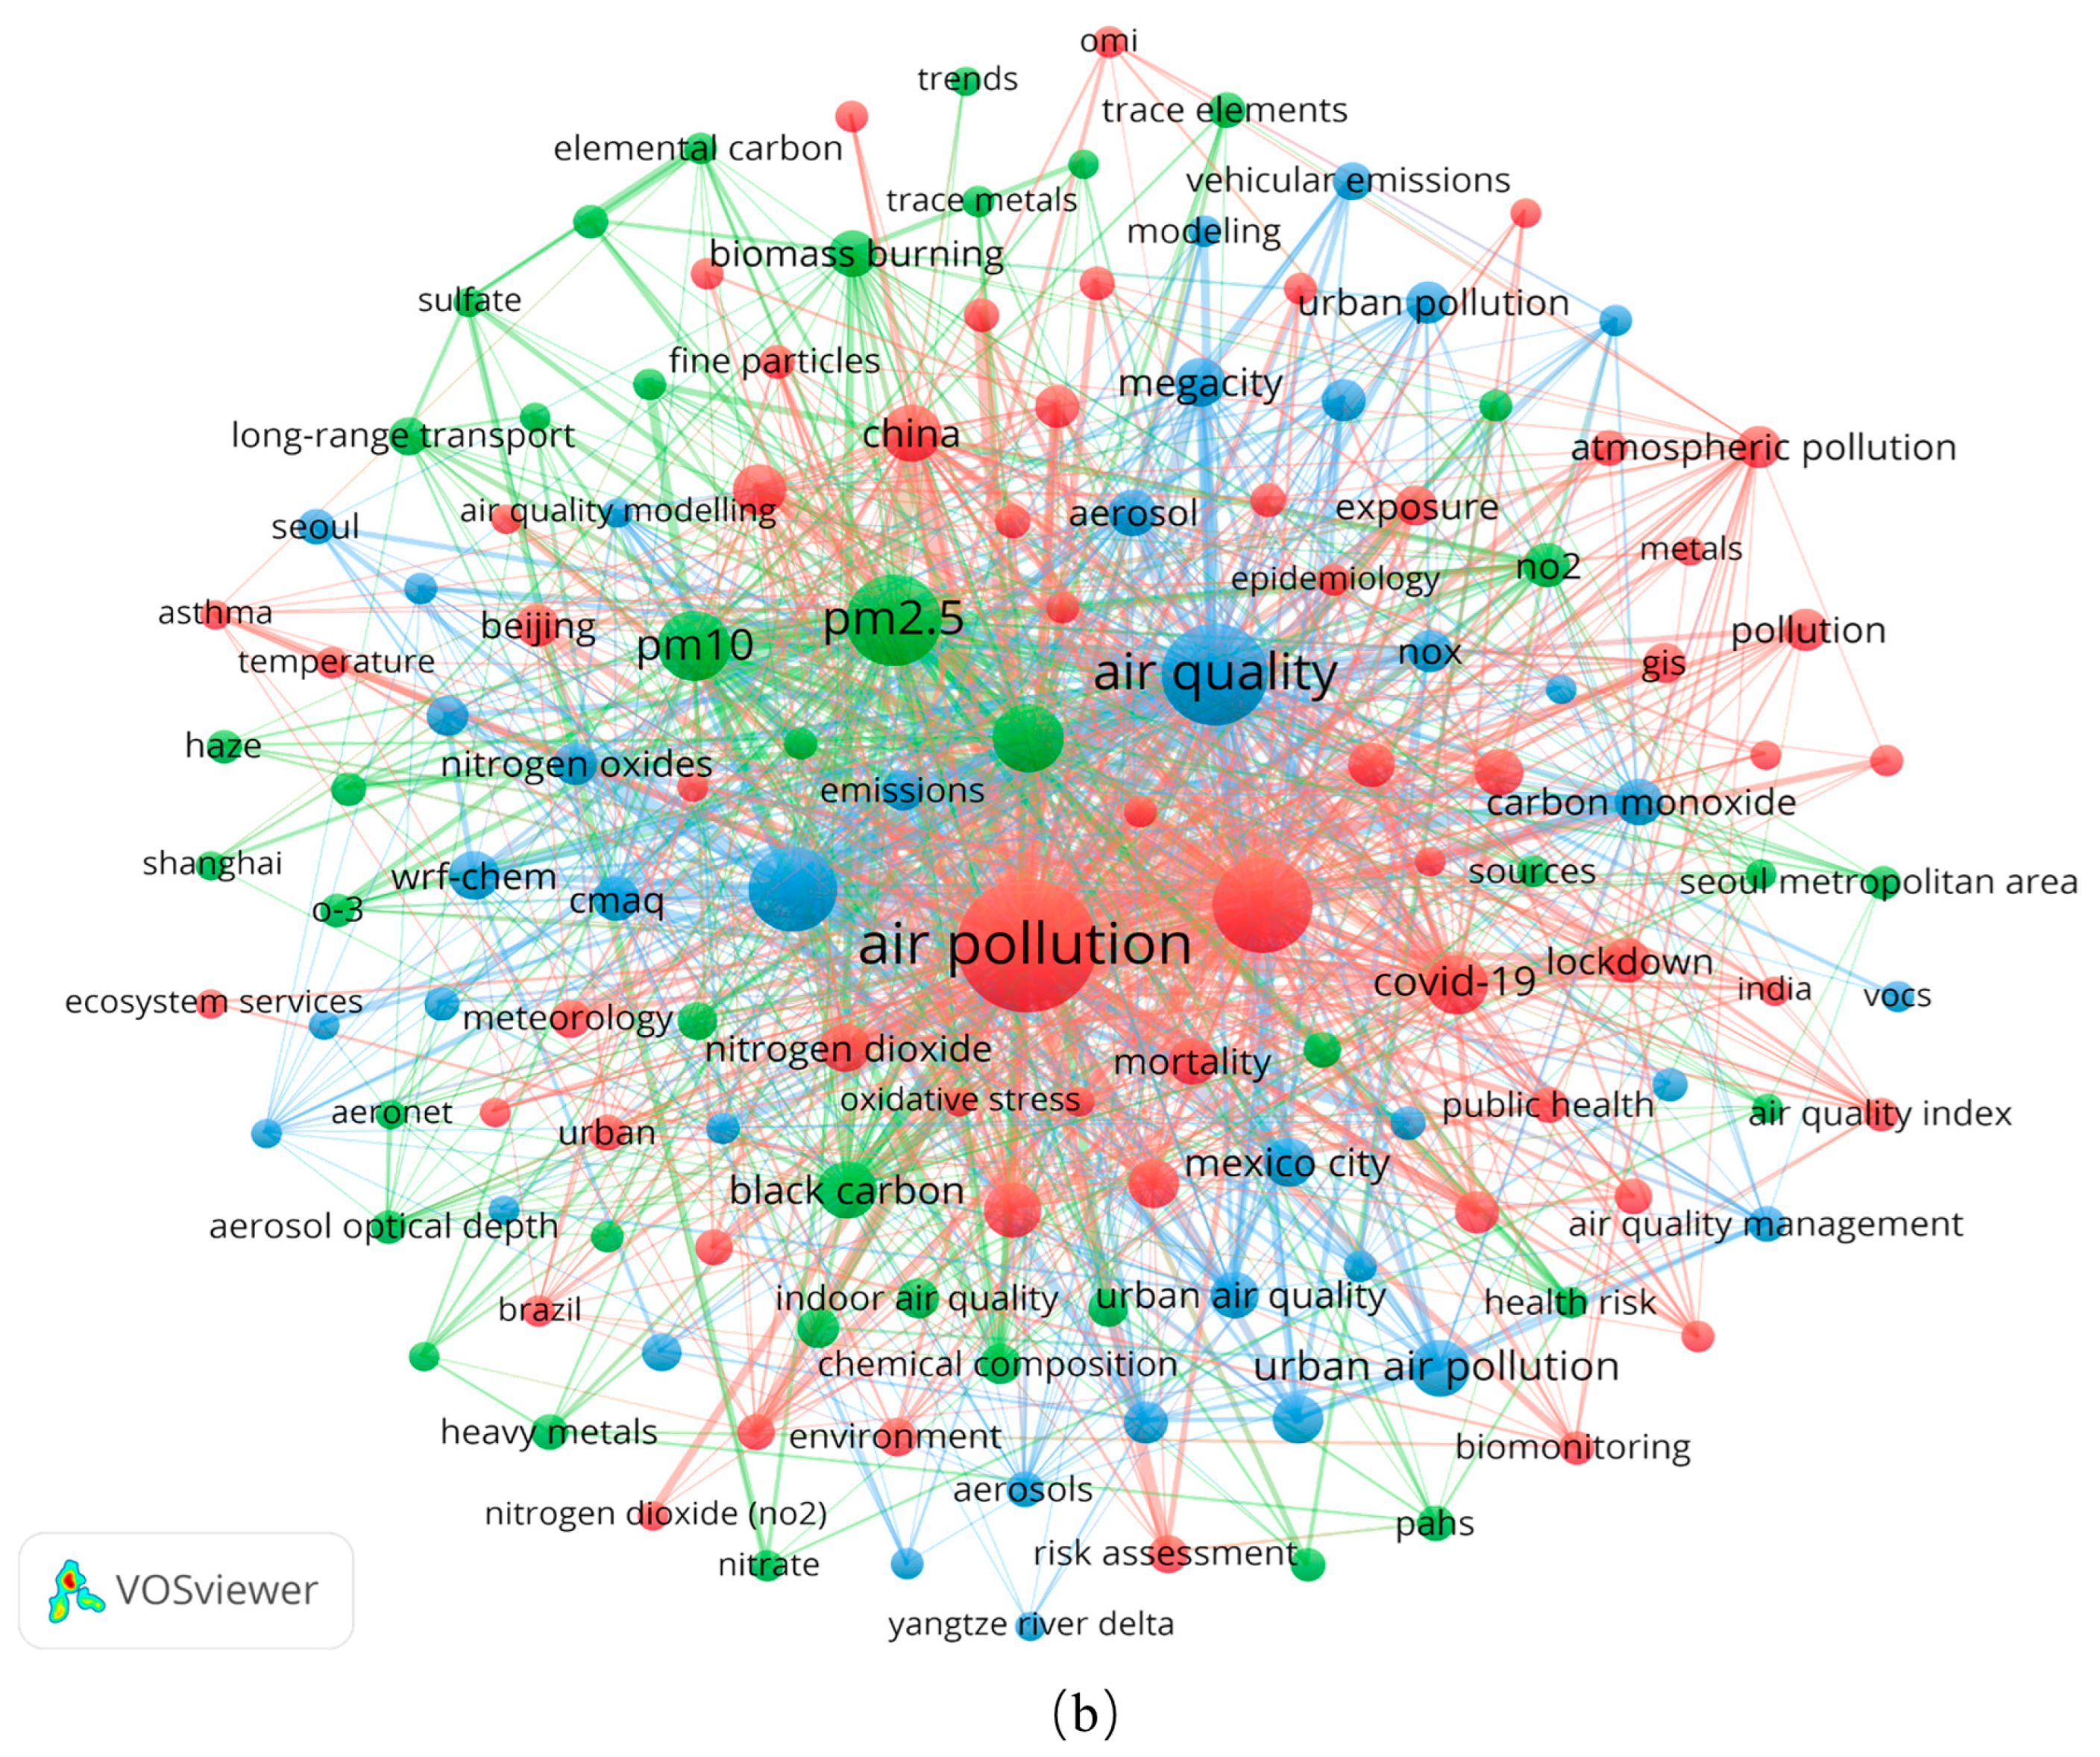
As shown in
Figure 5, each keyword in the figure is represented as a separate node, the connection lines between the nodes reflect the co-occurrence relationship between the keywords, and the area of the node is determined by the frequency of the keyword’s appearance in the literature. In Citespace, by setting the time from 2000 to 2024, the time slice as one year, and the g-index (k) as 8,
Figure 5a is obtained. In the figure, the different colors of the tree-ring-shaped nodes from the center to the periphery represent the temporal changes of the keywords. In VOSviewer, this paper selects “All keywords” for “Co-Occurrence” analysis. By setting the minimum occurrence frequency as 30, 157 high-frequency keywords with an occurrence frequency higher than 30 are screened out from 10,203 keywords, as shown in
Figure 5b, The distinct colors of the keywords in the figure signify their affiliation to different clusters.
Based on the keyword co-occurrence results,
Table 1 lists the top ten keywords with the highest frequencies in the research on air pollution in large cities. As the core theme of this study, the keyword “air pollution” appears 1117 times. Following it are keywords such as “particulate matter”, “air quality”, “emissions”, and “source apportionment”. Centrality can be used to measure the importance of a node in the network.
Table 1 shows that “air pollution” has the highest centrality, reaching 0.13. Next are “air quality” (0.12), “source apportionment” (0.10), and “particulate matter” (0.09). The high frequencies of occurrence and centrality of these keywords reveal the key research areas, including air quality monitoring, source apportionment of pollution sources, and the hazards of particulate matter.
Keyword burst analysis can help grasp the hotspots of a discipline, discover new trends in its development, and predict future research directions by identifying keywords that experience a sharp increase within a specific time period. In this paper, based on Citespace, a statistical analysis of keyword bursts in the field of air quality in large cities was conducted. The time range was set from 2000 to 2024.
Table 2 reports the results of the 10 most important burst keywords: “Air pollution”, “Particles”, “Urban air pollution”, “Mexico City”, “Atmosphere”, “Carbon monoxide”, “Pearl River Delta”, “Risk assessment”, “Personal exposure”, and “Anthropogenic emissions”. The keywords are ordered in accordance with the timing of their sharp increase in the research. The “Strength” metric gauges the degree of significance of the frequency variation of the keywords within a specific period. The keyword burst map on the right side of
Table 2 visually represents this process. The red section indicates that the occurrence frequency of this keyword has risen sharply within a certain period, becoming a research hotspot and garnering substantial attention. The periods before and after this one are differentiated using light blue and dark blue, respectively.
It can be seen that as early as the beginning of the 21st century, the problem of air pollution gradually emerged and began to attract widespread attention from the academic community. Air pollution is closely related to the background of the accelerated development of industrialization and urbanization. Therefore, air pollution in urban areas has gradually become a research hotspot. Compared with developed countries that have completed urbanization and industrial upgrading earlier, developing countries have experienced rapid economic development and urban expansion in the past few decades, resulting in more serious environmental problems and receiving more academic attention. Among them, the most representative areas include Mexico City and the Pearl River Delta, among others. These huge industrial and population agglomeration areas have become typical samples for the study of air pollution problems. With the passage of time, the focus of research has gradually expanded from the material form of air pollution to directions such as risk assessment, personal exposure, and anthropogenic emissions, indicating that the research perspective is expanding and understanding is deepening.
3.4. Co-Citation Network Analysis of References
In bibliometric analysis, co-citation analysis of references can reveal the relationships among literature records by counting the frequency of their simultaneous citation in other studies [
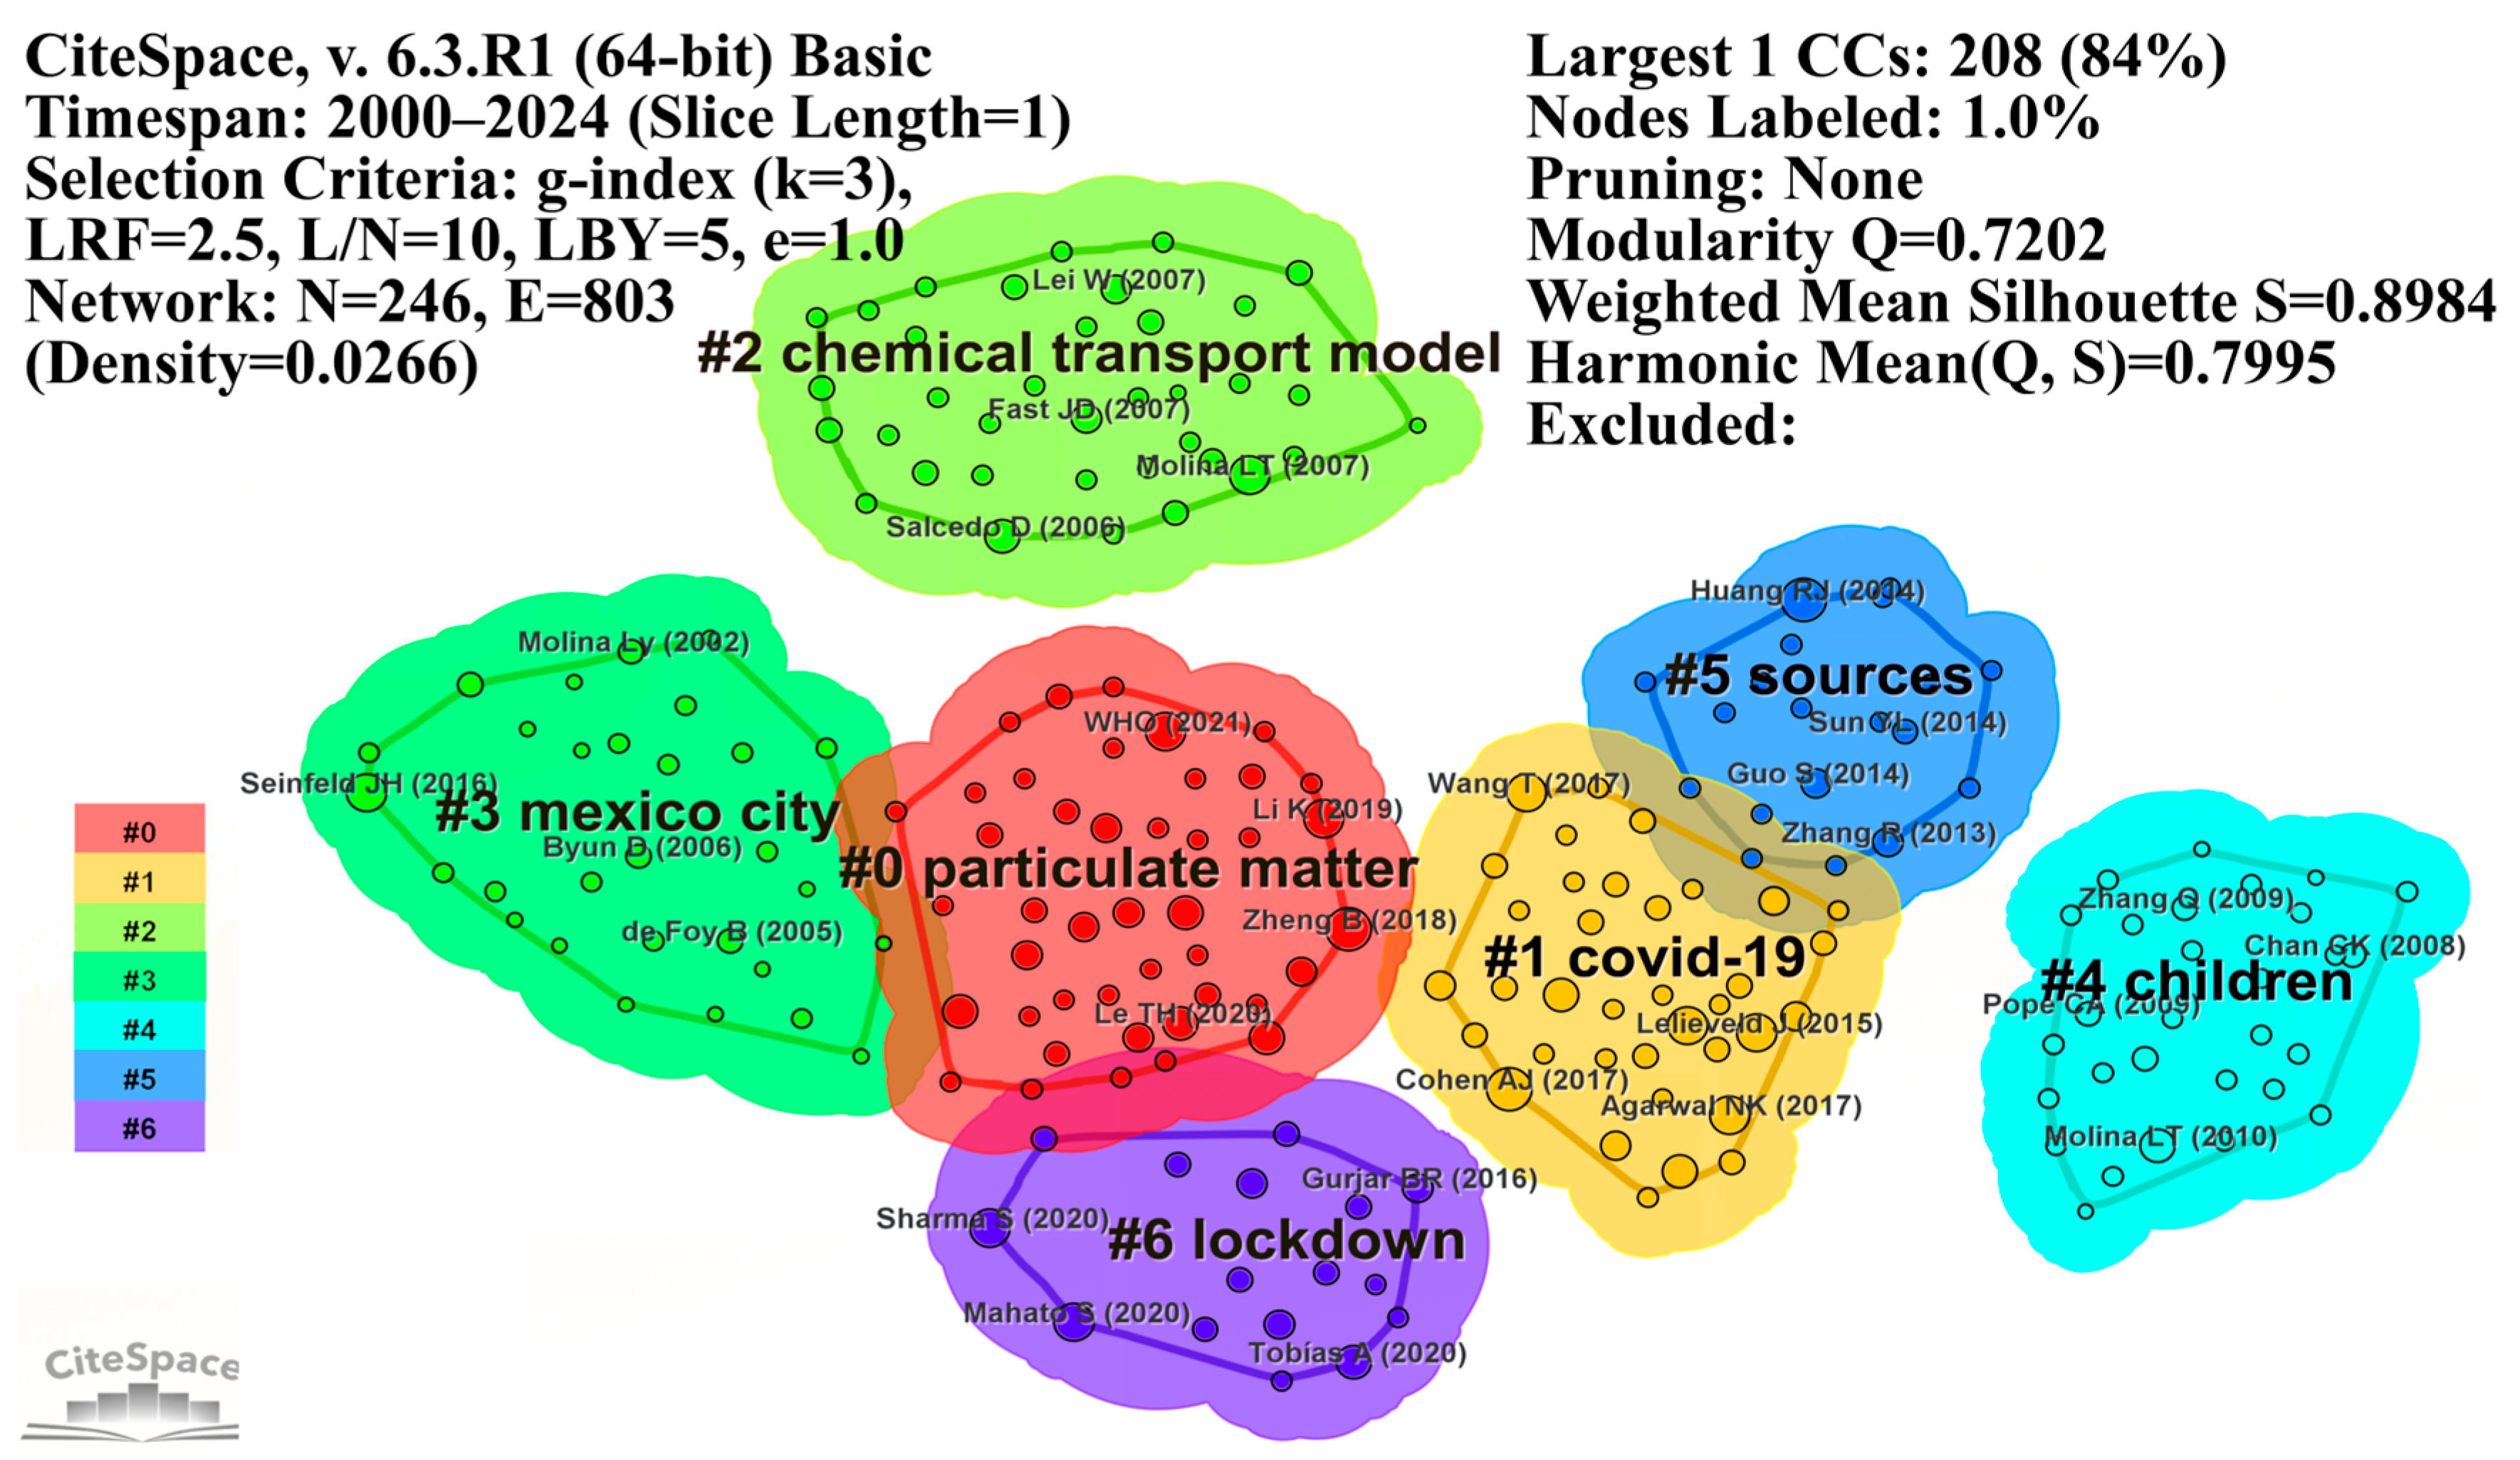
45]. This method helps to identify the core literature, research topics within a disciplinary field, and important connections in the academic network. In Citespace, by setting the node type as “reference”, the time slice as one year, and the k value as 3, we obtain the clustering view based on the Log-Likelihood Ratio (LLR) function shown in
Figure 6. The names of the clustering labels are extracted from the keyword list (k). Based on the fact that the modularity value (0.7202) in
Figure 6 is much larger than the common basic threshold (0.3), it can be concluded that the clustering effect of this graph is good.
The figure shows that the clusters related to air pollution in large cities mainly include “Particulate matter” (#0), “COVID-19” (#1), “Chemical transport model” (#2), “Mexico City” (#3), “Children” (#4), “Sources” (#5), and “Lockdown” (#6). Specifically, the clusters “Sources” and “Chemical transport model” (CTM) mainly focus on the tracing of the sources of air pollution, its monitoring, and the analysis of its mechanisms [
46,
47,
48,
49,
50]. This is helpful for providing a reference basis for the control of air pollution. The clusters “Particulate matter” and “Children” mainly concentrate on the physiological hazards of air pollution and the risk assessment faced by vulnerable groups [
51,
52,
53]. The cluster “COVID-19” exhibits a highly bidirectional causal relationship with the issue of air pollution, which has emerged as a crucial consideration in the study of urban air pollution within a certain period. On one hand, numerous prevention and control measures have been adopted by various regions in response to COVID-19, such as lockdowns, business suspensions, and production cuts. These circumstances have influenced the original industrial production and residents’ consumption in cities, exerting an indirect and complex impact on the urban air conditions. On the other hand, research indicates that air pollution can enhance the infection probability of COVID-19 and exacerbate the degree of damage it causes to human health, demonstrating a distinct positive correlation between the two [
54,
55,
56]. The cluster “Lockdown” also exists during the same period, mainly including studies on the impact of relevant policy measures of lockdowns in various countries during this period on air pollution [
57,
58,
59]. Mexico City is a typical sample in the research of urban air pollution. Therefore, the cluster “Mexico City” represents the research on air pollution with cities as the research objects [
60,
61,
62].
Table 3 reports detailed information on these clusters, including cluster size, average year, and Silhouette value. The Silhouette value ranges from −1 to 1. By measuring the similarity of each sample to its own cluster and its similarity to other clusters, the quality of the clustering results can be evaluated. As can be seen from the table, among all the clusters, the lowest Silhouette value is 0.797, the highest value reaches 0.974, and the average value is 0.914. This indicates that there is significant heterogeneity among the clusters (high Silhouette value), and the samples within each cluster are relatively consistent, achieving excellent clustering results.
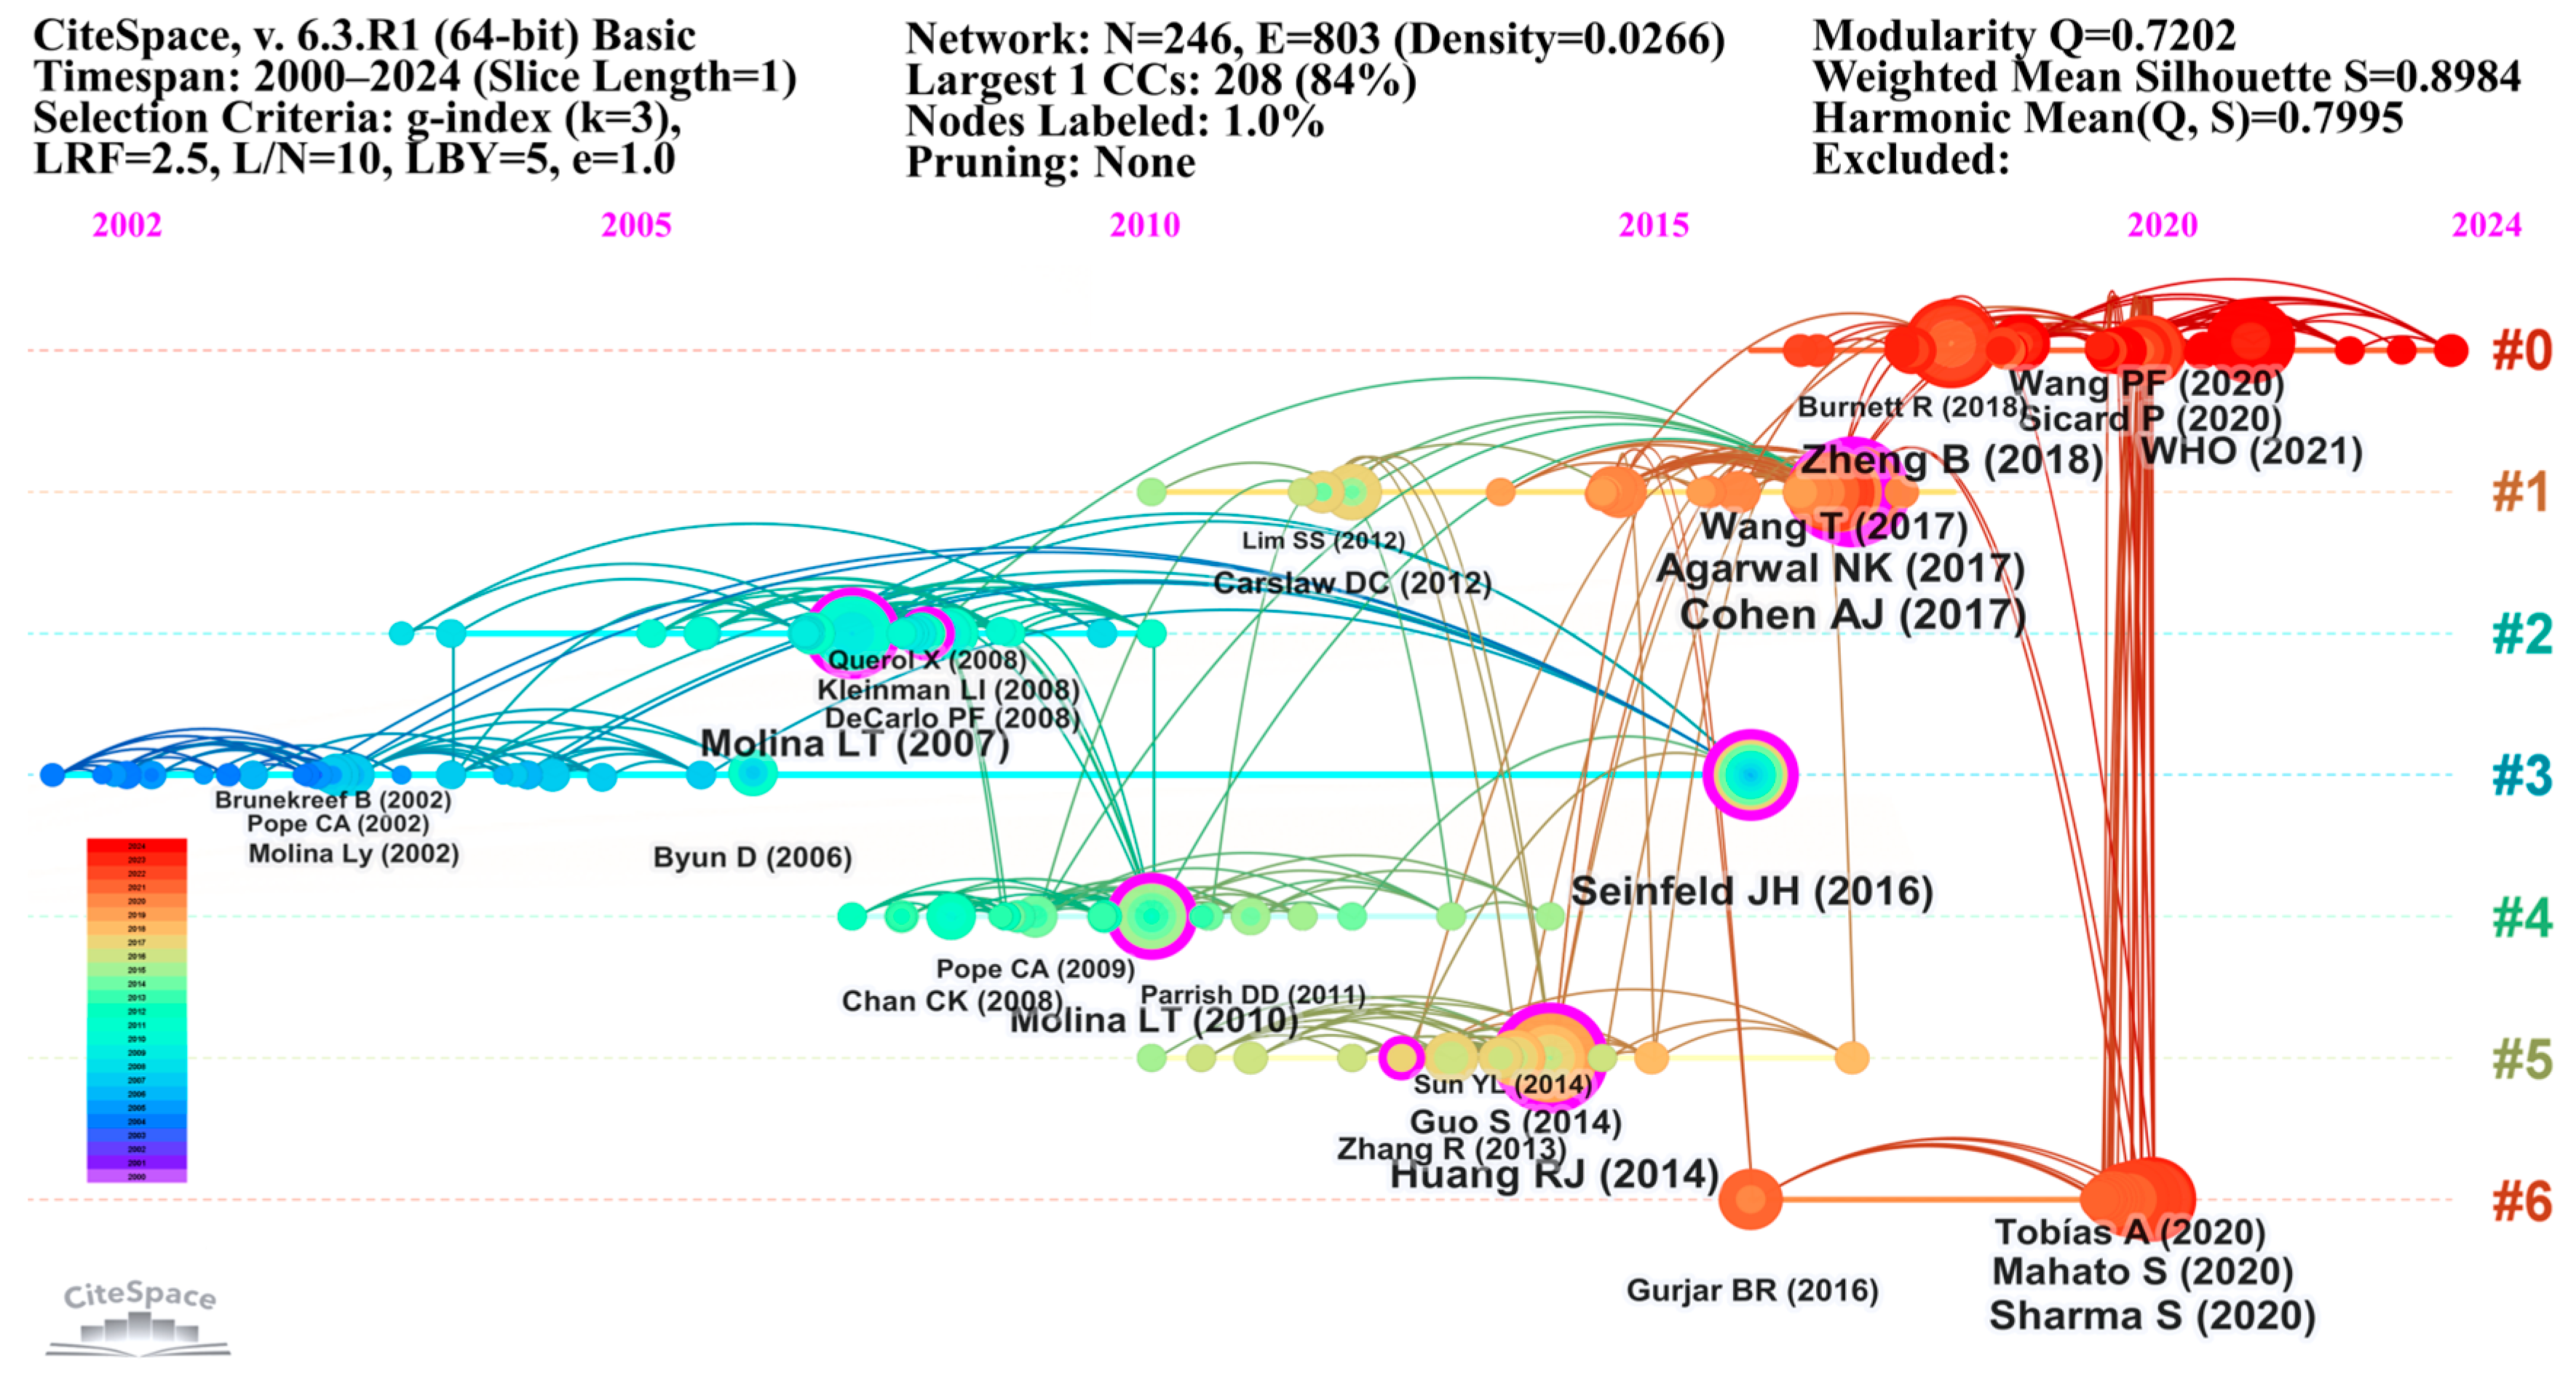
As an important method in bibliometrics, the timeline graph can display information such as the number of records, importance, and citation volume of various topics at different time points in the research of a specific field. It helps to deeply understand the development process and changing trends in this field. Based on the co-citation clustering of references obtained in the above text, the timeline graph generated by Citespace is shown in
Figure 7. The results show that early research mainly focused on air pollution in a single city [
63], the monitoring role of the Chemical Transport Model in air pollution [
47], and the threat of air pollution to children [
64]. Nowadays, research on particulate matter has become the focus of air pollution research in large cities. On the one hand, this is because the acceleration of the urbanization process and the expansion of large cities have led to a continuous increase in the emissions of particulate matter year by year [
65]. On the other hand, with the progress of science and the gradual deepening of research, the academic community’s understanding of the harm of air pollutants is gradually deepening, and dealing with particulate matter pollution has become a major issue that needs to be faced in the air pollution control of large cities [
66].
3.5. Analysis of the Cooperation Network Among Countries or Regions
By analyzing the distribution of publications across different countries, we can assess the contributions and influence of each nation in the field of urban air pollution research. Using the number of publications as the primary metric,
Table 4 presents the top ten most influential countries in this domain. Additionally, the table includes each country’s Centrality value, which measures its position and significance within the global research network. In terms of publication volume, the USA and China are far ahead of other countries, with 957 and 760 articles, respectively. In contrast, the remaining countries have fewer than 250 publications each.
Regarding Centrality values, the USA ranks the highest at 0.26, indicating its dominant role in the global research network of urban air pollution. Other key players in this field include England (0.14), China (0.12), Germany (0.12), Italy (0.11), and Spain (0.10), all of which also hold significant positions in international collaborations. This analysis highlights that while the USA and China lead in publication volume, several European countries also play critical roles in shaping research trends through strong international collaborations. Moving forward, fostering global cooperation may further enhance knowledge exchange and accelerate scientific advancements in urban air pollution mitigation.
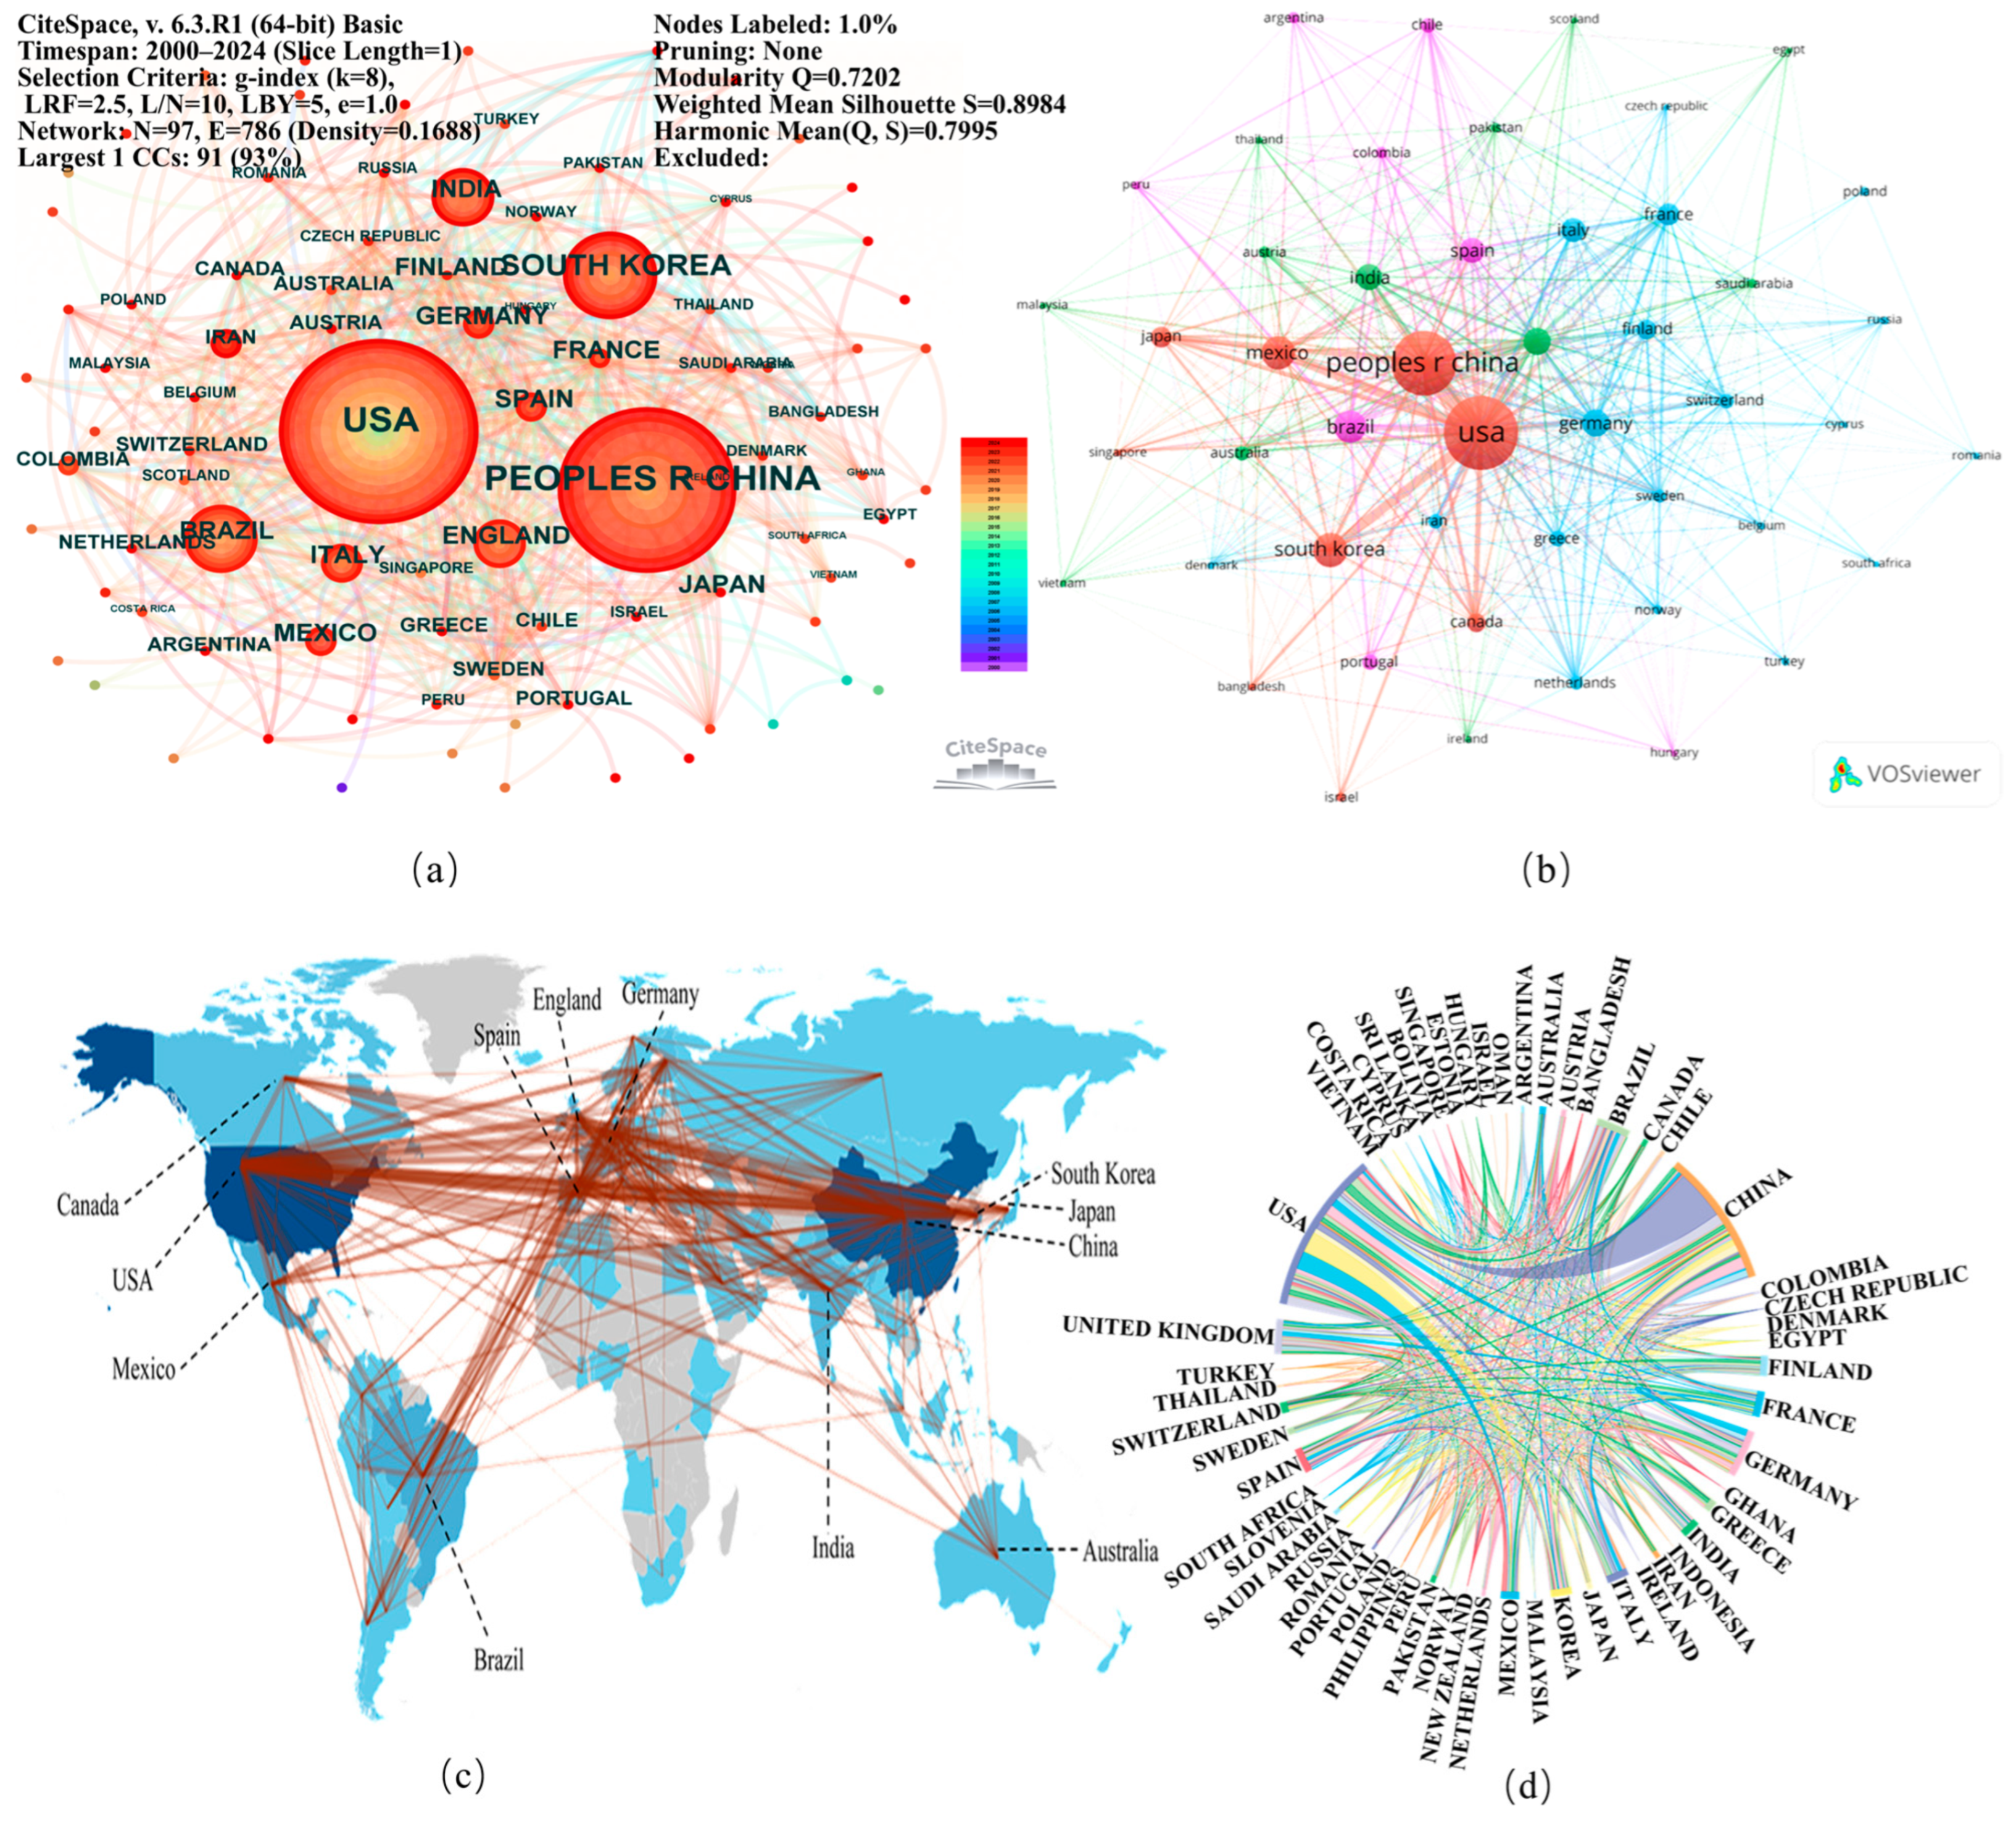
Figure 8 presents the visualization results of international collaboration networks.
Figure 8a,b—generated by CiteSpace and VOSviewer, respectively—reveal the collaborative relationships and contribution levels among nations in metropolitan air pollution research from temporal and clustering dimensions. The analysis demonstrates that China and the United States emerge as the most prominent contributors, occupying central positions in the national collaboration networks.
Figure 8c,d further validate these findings through national collaboration maps and chord diagrams, providing intuitive representations of inter-country cooperation trends. The visualization tools effectively capture three key patterns:
- (1)
Core-periphery structure: 82% of international collaborations originate from US-China partnerships.
- (2)
Temporal evolution: Transnational cooperation increased by 37% during 2015–2024, with joint publications growing at 15% CAGR.
- (3)
Disciplinary integration: Environmental science (48%) and urban planning (32%) show the strongest interdisciplinary linkages in collaboration clusters.
This multidimensional visualization methodology successfully decodes the complex dynamics of global scientific cooperation in urban environmental governance research.
3.6. Co-Authorship Network Analysis
Authors are an essential component of scientific research, and analyzing author collaboration networks helps identify key researchers in a given field and assess the level of cooperation between research teams [
67]. Additionally, examining co-authorship networks provides insights into knowledge dissemination. Generally, closer collaboration among researchers is associated with higher citation rates and greater academic influence. A dense collaboration network often indicates faster knowledge dissemination, while a loose network may suggest that the field is still in its early stages or lacks interdisciplinary cooperation.
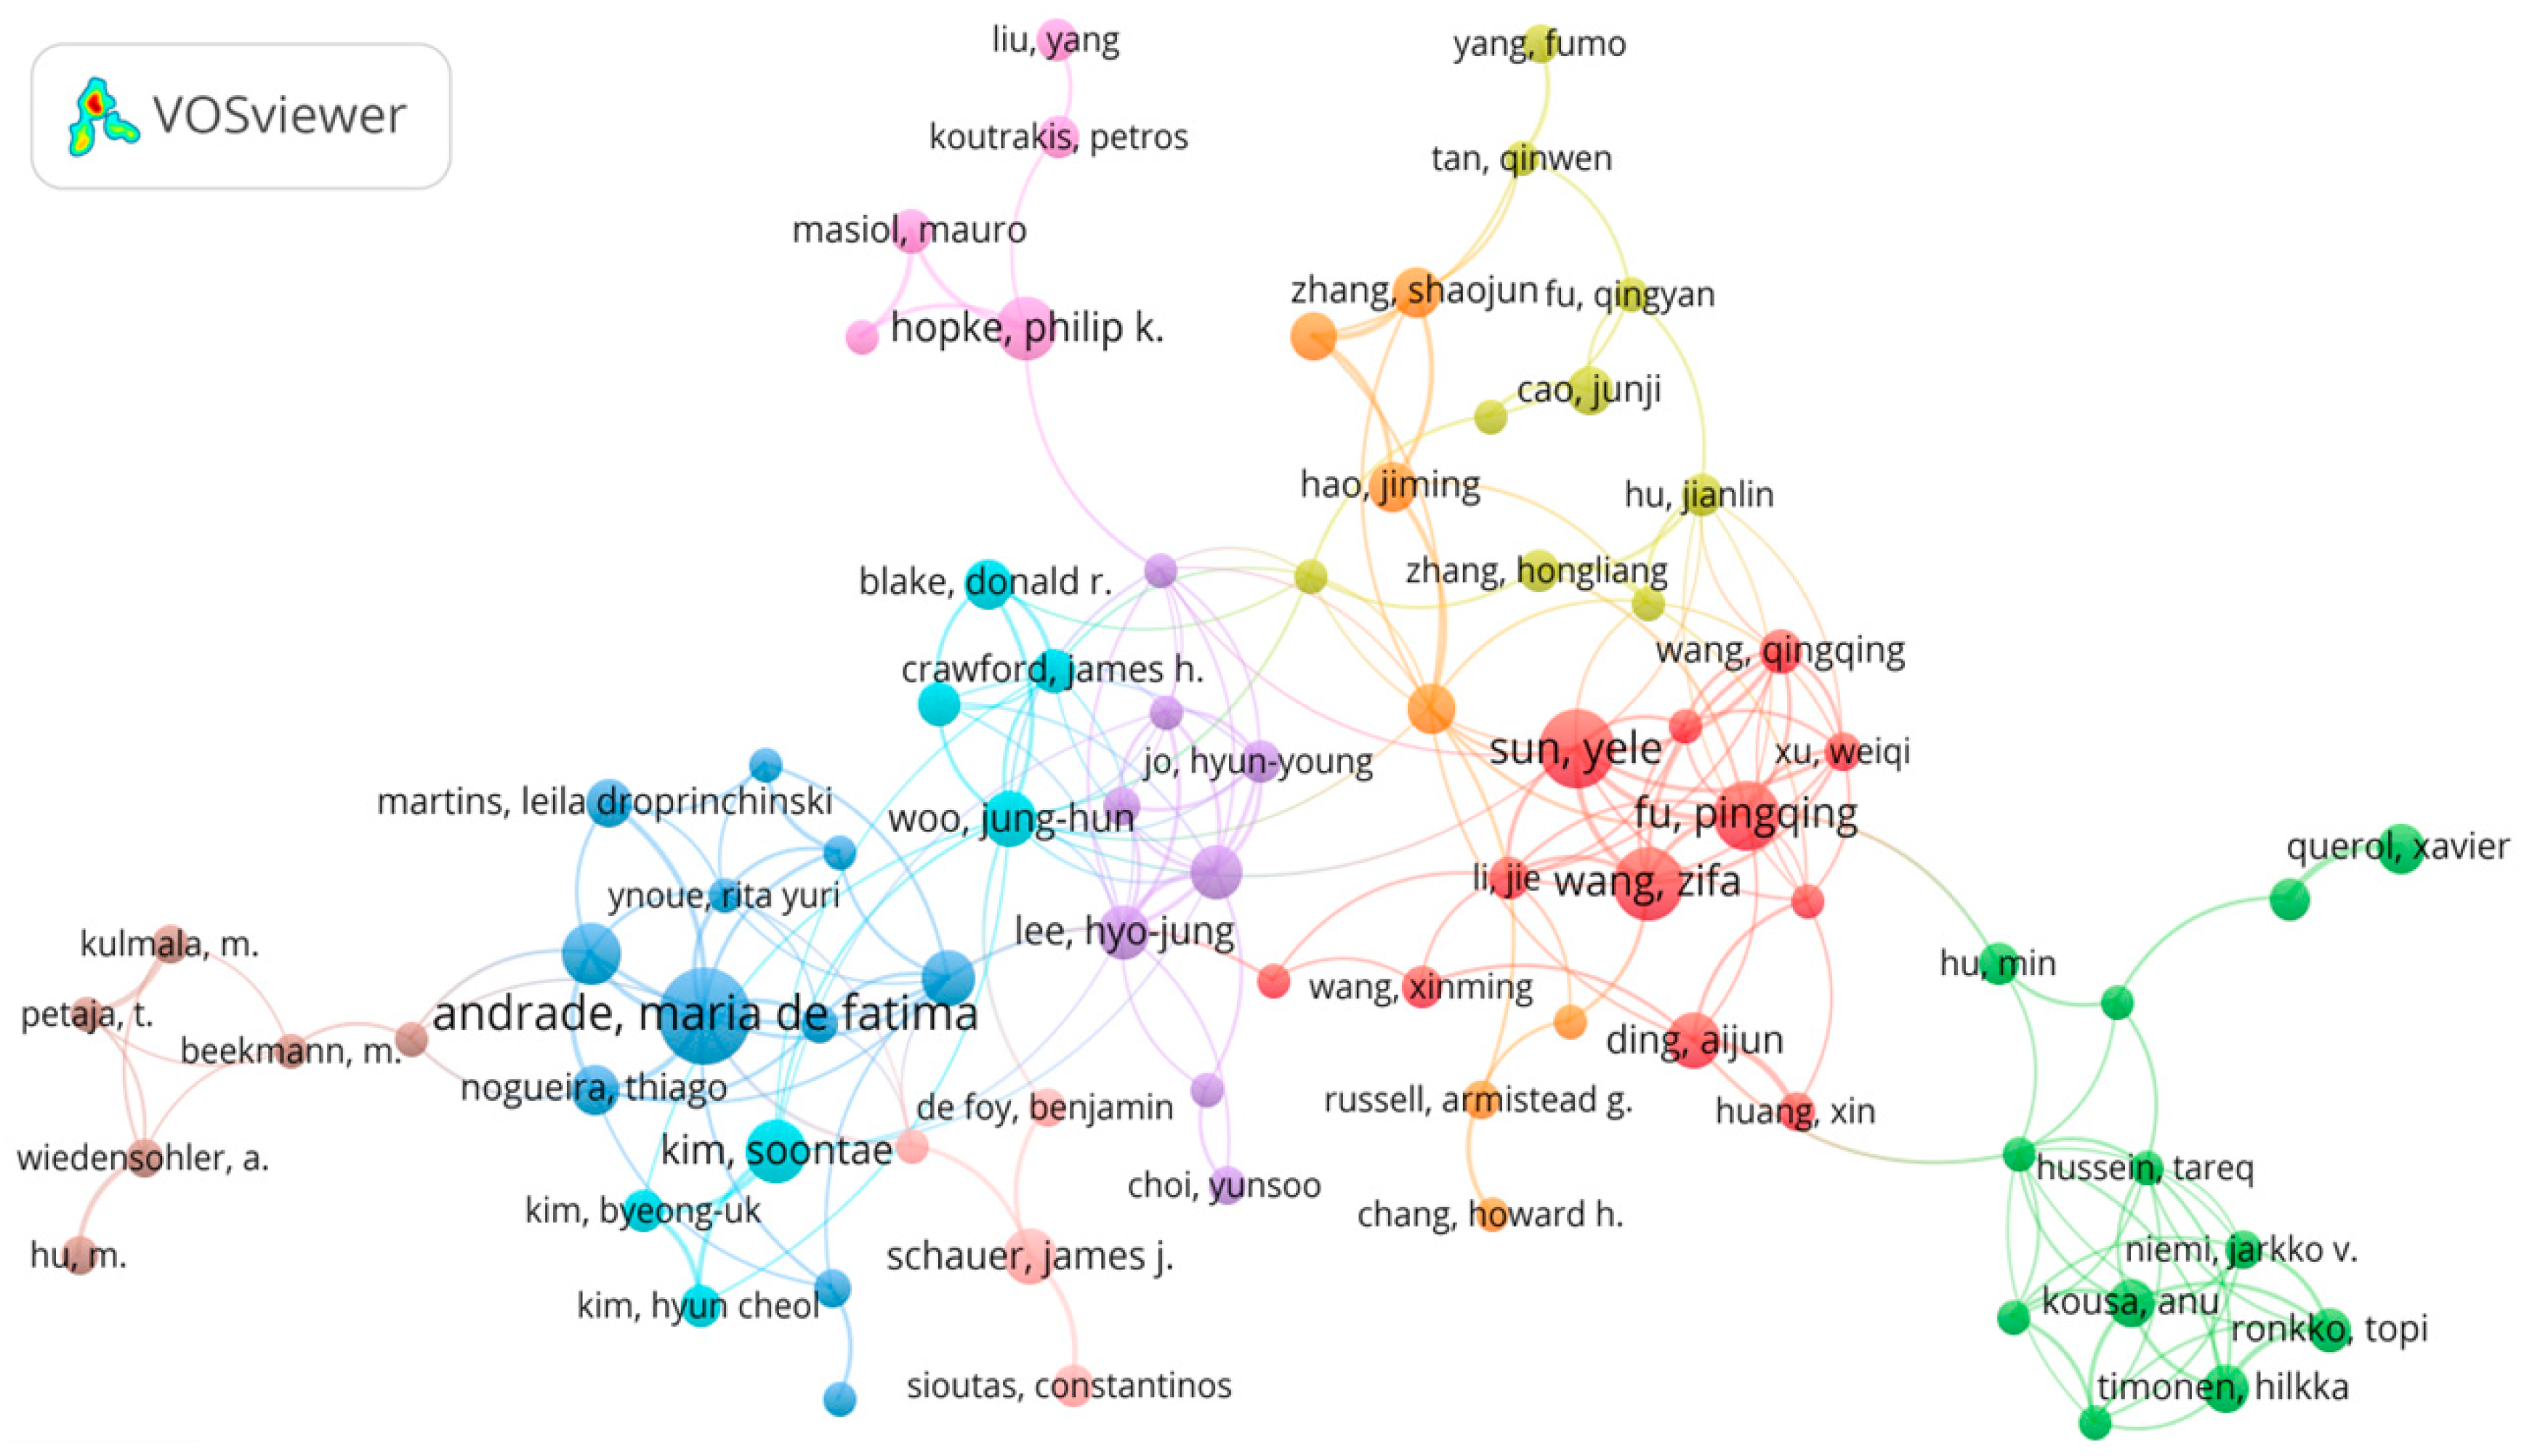
Based on the published literature in urban air pollution research, VOSviewer was used to analyze co-authorship patterns and generate a visualized co-authorship network. By setting a publication threshold of at least 10 papers, the analysis identified 51 highly influential authors, as shown in
Figure 9. Furthermore,
Table 5 presents certain information of the ten authors who have published the largest number of articles and made significant contributions in this field. In the visualization, each author is represented as a node, with node size proportional to the number of citations they have received. The thickness of the connecting lines reflects the strength of collaboration between authors.
The diagram reveals several relatively independent clusters, represented by blue, green, red, and yellow regions, indicating distinct research groups. Within each cluster, researchers tend to collaborate on similar research topics. While there are several significant clusters, the overall network still exhibits a pattern of large-scale divergence and small-scale aggregation. This suggests that although some authors have notable academic influence, they often have few collaborators and maintain independent or minimally cooperative research efforts. This phenomenon points to the existence of “academic islands” in urban air pollution research, where author collaborations and interdisciplinary integration remain insufficient. In the future, as the field continues to develop, interdisciplinary cooperation is expected to increase, leading to a more tightly connected co-authorship network. This enhanced collaboration could accelerate knowledge exchange and drive further advancements in urban air pollution research.
3.7. Analysis of Journal
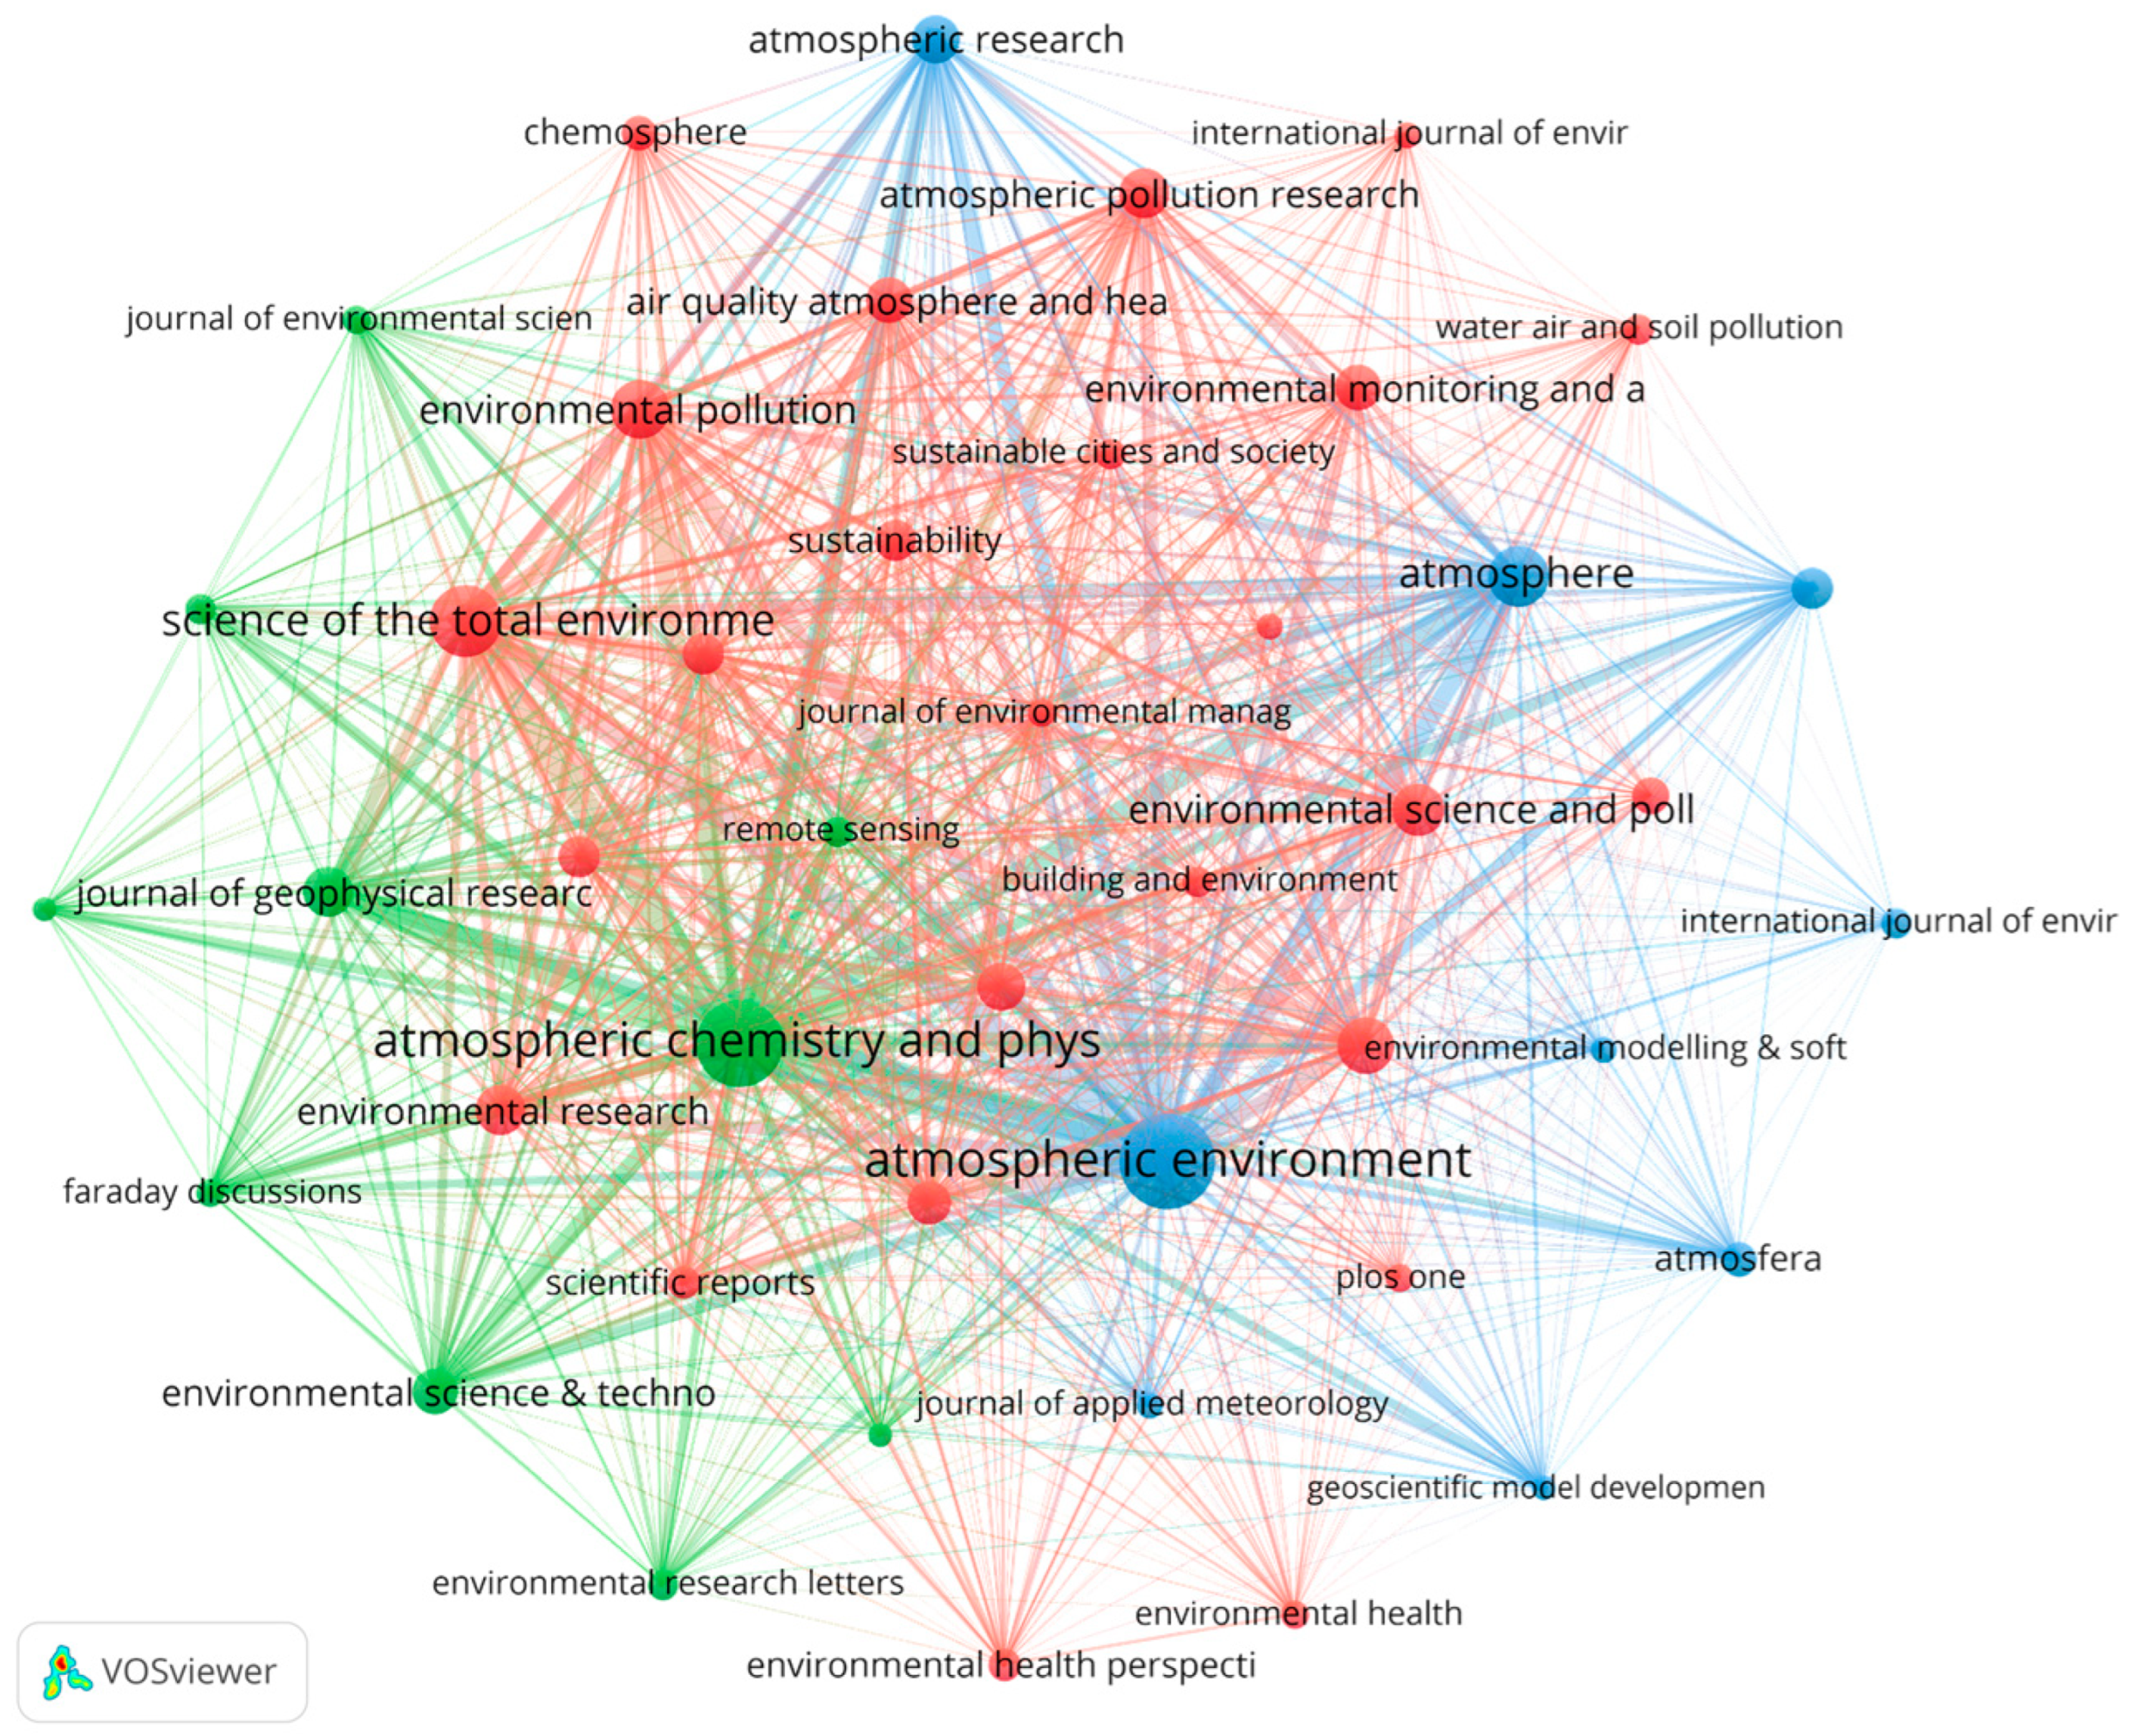
As depicted in VOSviewer for journal network analysis, a co-occurrence mapping of journals was generated based on key indicators such as publication volume and citation counts, as shown in
Figure 10. To further highlight the leading publication platforms in this field,
Table 6 presents the top ten journals with the highest number of publications on urban air pollution.
Among these, Atmospheric Environment has emerged as the most influential journal, publishing 355 papers, which accounts for 11.418% of the total literature analyzed. It is followed by Atmospheric Chemistry and Physics and Science of the Total Environment, with 271 and 167 publications, respectively. Overall, the journals listed in
Table 6 contribute 43.129% of the total publications in this research domain. Their substantial presence underscores their pivotal role in shaping the field, serving as key platforms for disseminating cutting-edge research and reflecting the evolving trends and priorities in urban air pollution studies.
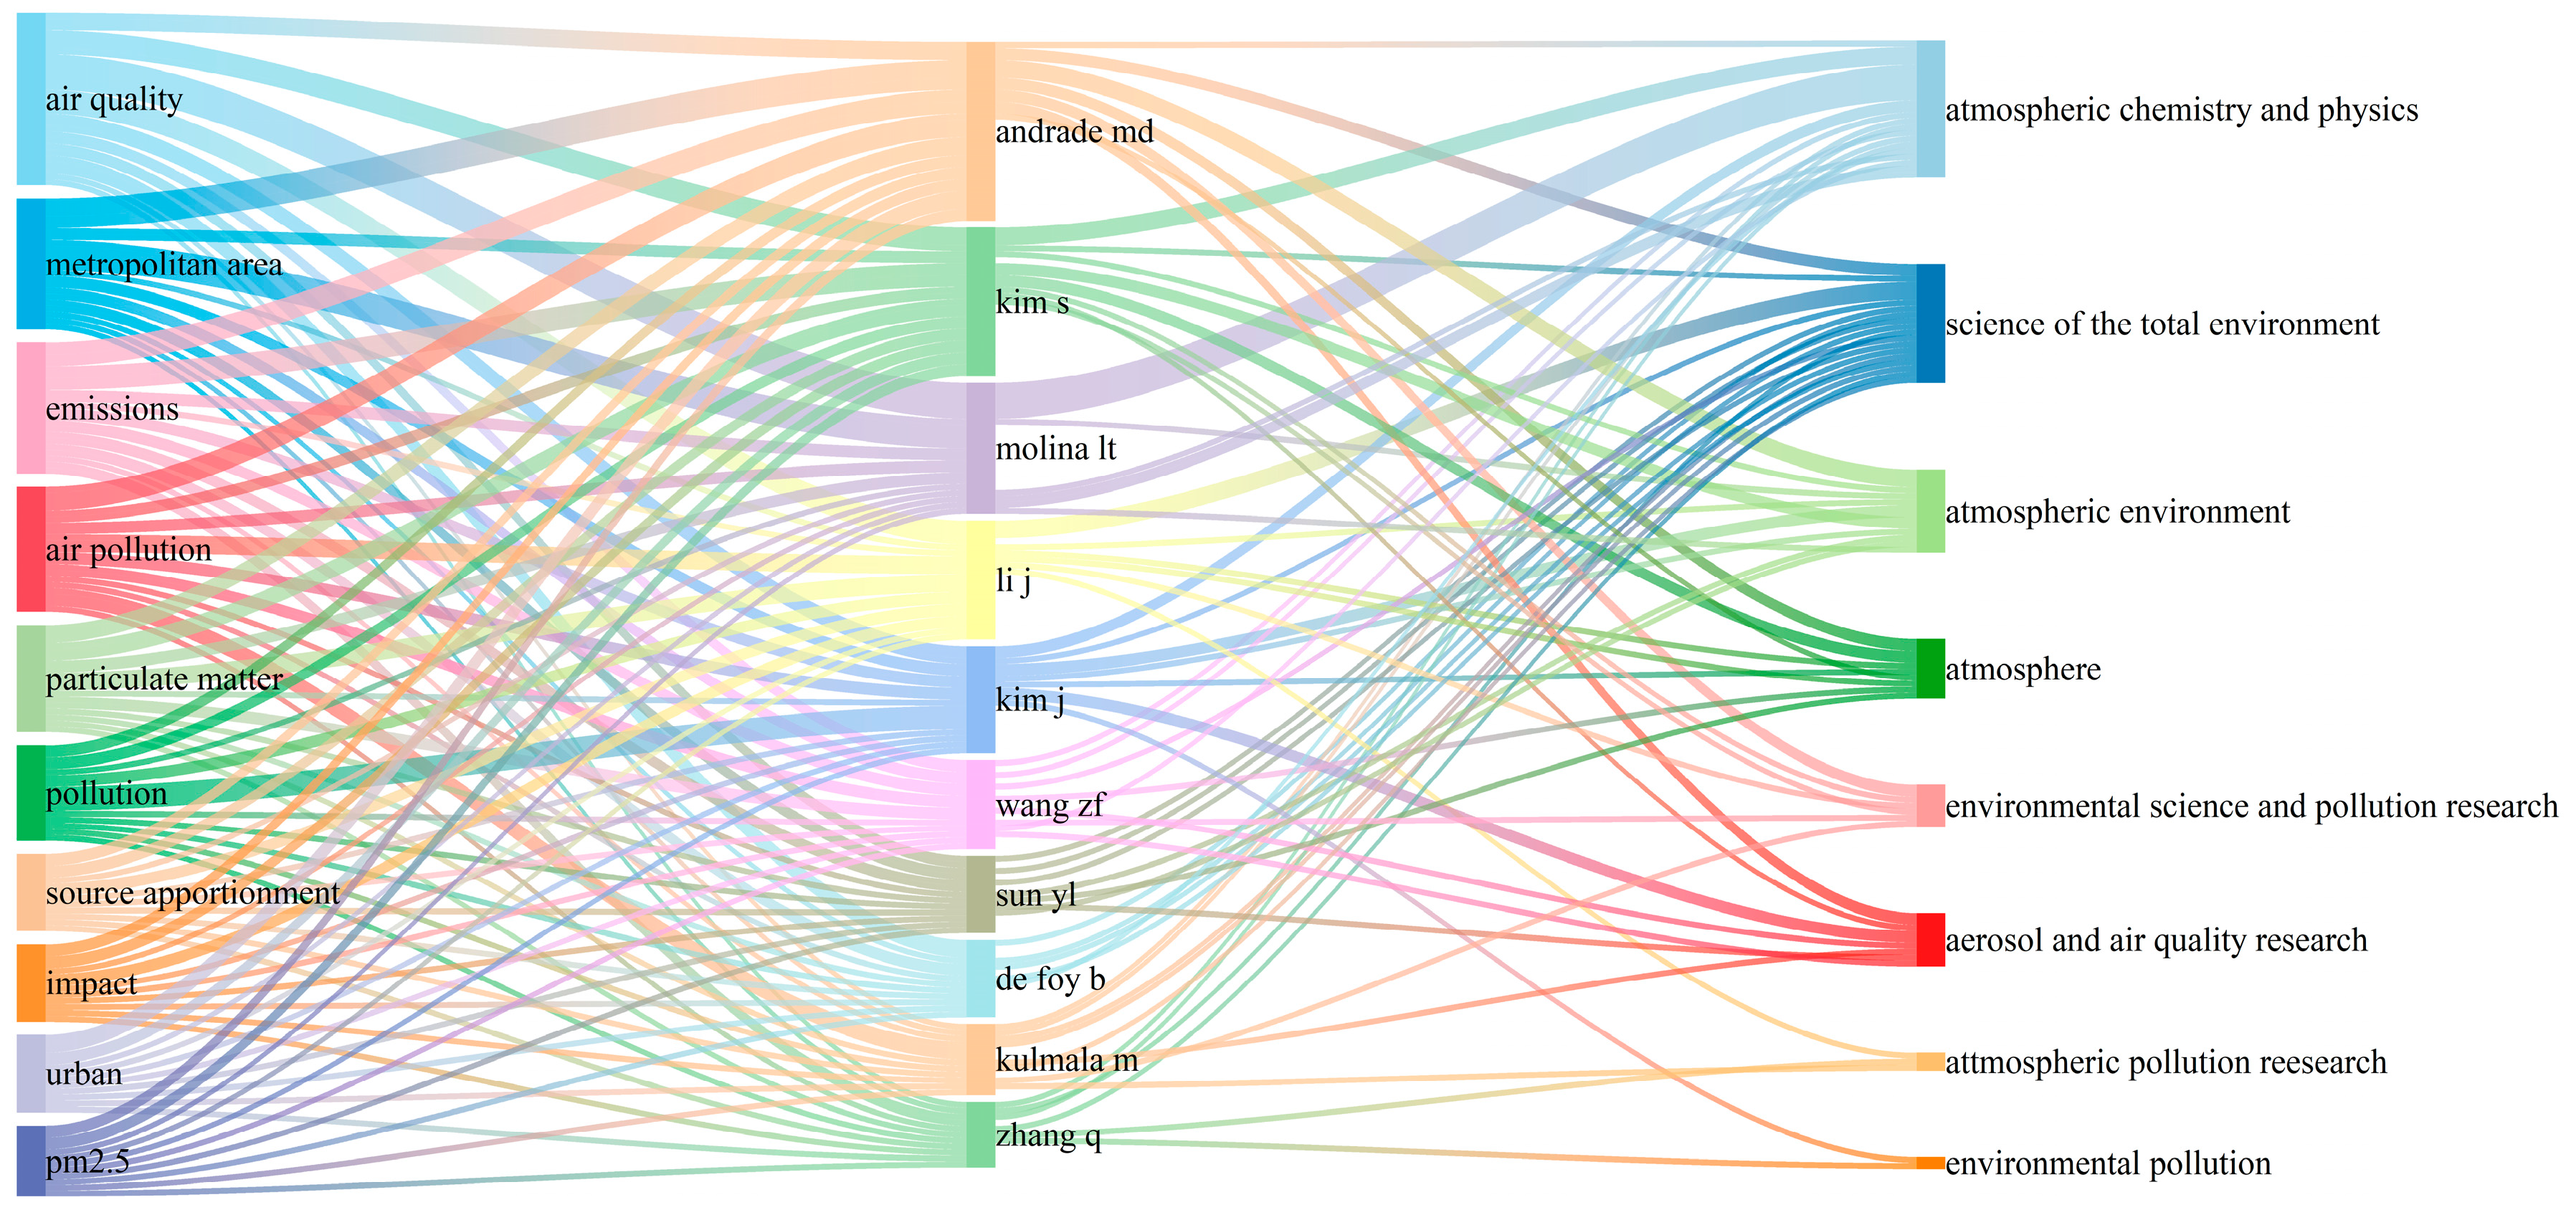
The Sankey diagram in
Figure 11 visually represents the intricate relationships between keywords (ID), authors (AU), and journals (SO) in air pollution research. It effectively illustrates how different research topics, scholars, and publication platforms are interconnected, providing insights into the structure and focus areas within this field. On the left side of the diagram, the keywords (ID) highlight the core themes of air pollution research. Terms such as air quality, metropolitan area, emissions, air pollution, particulate matter, source apportionment, and PM2.5 indicate the primary areas of investigation. These keywords reflect the broad scope of research, ranging from pollutant sources and composition to their environmental and health impacts.
In the center, the authors (AU) represent key contributors to this research domain. Scholars such as Andrade MD, Kim S, Molina LT, Li J, Wang ZF, Sun YL, and Zhang Q are shown as central figures in advancing the field. The connections between these authors and specific keywords suggest their expertise in particular subfields, such as atmospheric chemistry, urban air quality assessment, and emission analysis. On the right side, the journals (SO) indicate where these studies have been published. Leading journals such as Atmospheric Chemistry and Physics, Science of the Total Environment, Atmospheric Environment, and Environmental Science and Pollution Research serve as major platforms for disseminating findings in this field. The strong linkages between authors and journals highlight the preferred publication venues for air pollution research, reflecting both the disciplinary focus and the impact of these outlets.
The gray lines connecting these three columns reveal the flow of knowledge within the academic community, illustrating how specific research topics are explored by different scholars and disseminated through various scientific journals. This visualization provides a comprehensive overview of the field’s development, key contributors, and influential publication channels, offering valuable insights for researchers looking to navigate the landscape of air pollution studies. This Sankey diagram effectively illustrates the flow and connections between research topics, authors, and the journals in which their findings are published. By visualizing these relationships, the diagram highlights the diversity of scientific inquiry in air pollution research and reveals the intricate nature of interdisciplinary collaboration. This visualization not only exhibits the concentration of research efforts on key topics such as air quality, particulate matter, and emissions but also identifies influential scholars who drive progress in the field. The strong linkages between authors and specific journals further emphasize the preferred publication platforms for disseminating high-impact research.
Moreover, the interconnected structure captured in the diagram underscores the multidisciplinary nature of air pollution studies, where insights from atmospheric science, environmental chemistry, public health, and policy research converge. By mapping these complex relationships, the Sankey diagram serves as a valuable tool for understanding how knowledge flows across different domains, ultimately contributing to more effective scientific collaboration and policy development.
4. Conclusions and Discussion
4.1. Conclusions
Employing bibliometric tools such as CiteSpace, VOSviewer, and Bibliometrix, this study conducted a comprehensive multidimensional analysis of research on air pollution in megacities. The findings provide a systematic evaluation of the current research landscape and yield the following three key insights:
Firstly, interdisciplinary expansion: The study of air pollution in megacities has evolved into an increasingly interdisciplinary field, integrating knowledge from environmental science, atmospheric chemistry, public health, urban planning, and data analytics. This trend is expected to strengthen further, fostering cross-disciplinary collaboration to address complex pollution challenges more holistically.
Secondly, thematic evolution and research priorities: Keyword co-occurrence and co-citation cluster analyses reveal that research on megacity air pollution encompasses a broad range of topics, including pollution source apportionment, particulate matter exposure, health risks (particularly for vulnerable populations such as children), and advanced chemical transport models. Based on these themes, the majority of research focuses in this domain can be classified into three types: identification and traceability of sources, risk assessment, and governance measures. (1) The aspect of source identification and traceability mainly refers to analyzing the sources of air pollutants through qualitative and quantitative methods and conducting evaluations via chemical models or statistical models, among others. (2) Concerning risk assessment, the research emphasis mainly lies in the detrimental effects of air pollution on both the natural environment and residents’ health, with greater attention being given to health hazards. (3) Regarding the governance and improvement in air pollution, the majority of the literature centers on analyzing the potential improvement effects of the existing or future possible environmental policies of the government on air pollution. This is in alignment with the government’s dominant position in dealing with air pollution issues, indicating that scientifically rational environmental regulations are generally regarded by the academic circle as an effective approach to managing air pollution. Besides, other measures proposed in other studies mainly comprise technological advancement, industrial optimization, and the enhancement of residents’ environmental consciousness, among others.
Finally, global research contributions and collaboration: The bibliometric network analysis highlights that the United States and China dominate this research field in terms of publication volume and international collaboration networks. Among them, the United States exhibits the highest centrality, indicating its critical influence on shaping the global discourse on air pollution mitigation. This leadership role may be attributed to its strong research infrastructure, substantial funding allocations, and long-standing policy commitments toward air quality improvement.
4.2. Further Discussion
This study employed bibliometric methods to systematically analyze the research dynamics, development trends, and internal connections in the field of air quality from a macro perspective. By constructing a macroscopic knowledge network, this research revealed the knowledge evolution patterns in this field. Based on this, the findings of this study may have significant application value in the following dimensions:
Firstly, at the environmental decision-making level, through statistical analysis of a large number of documents and the construction of a knowledge map, this paper presents the main research directions and hot issues in the field of air quality at the macro level, providing a comprehensive knowledge background and research trend analysis for relevant decision-making institutions when formulating environmental policies. Decision-makers can optimize resource allocation and policy guidance based on this macro information, thereby enhancing the efficiency of environmental governance and monitoring as a whole. For instance, the analysis shows that there is a close connection between air quality and urbanization, with urban air pollution becoming a research focus. This helps decision-makers pay attention to environmental friendliness when formulating long-term urban development strategies and incorporate overall considerations of air quality protection.
Secondly, at the urban planning level, the knowledge map constructed through bibliometric analysis provides a bridge for collaboration among different departments. By revealing the technical paths and research focuses of international academic circles on urban environmental governance, this outcome can guide planning departments to systematically incorporate atmospheric environmental elements into urban development planning models. Especially when formulating smart city and low-carbon development strategies, the trend analysis results of this study can be used to establish a multidisciplinary collaborative environmental monitoring and early warning system, promote the integrated application of green infrastructure and clean energy technologies, and achieve a dynamic balance between economic development and ecological protection.
Thirdly, at the public health level, the research results reveal the research focus on the impact of air pollution on human health, especially on vulnerable groups such as children. These data can help public health decision-makers more accurately identify high-risk groups and regions for air pollution, thereby formulating targeted health intervention measures in advance and reducing the potential threat of air pollution to public health. On the other hand, by analyzing the relevant literature globally and regionally, this study identifies the leading countries in this field, helping decision-makers refer to the policies and measures taken by different countries and regions in response to air pollution and their effects. The integration of macro data provides a basis for cross-regional comparison and experience sharing for public health departments, making resource allocation and intervention strategies more scientific, especially in areas with severe environmental pollution, to strengthen health protection.
Finally, this study provides valuable insights for improving air quality management, urban planning, and public health strategies, particularly in protecting vulnerable populations. The findings highlight key pollution trends, enabling policymakers to implement targeted regulations, such as stricter emission controls in high-risk areas, and enhance air quality forecasting for timely pollution alerts. In urban planning, the results can guide the placement of residential areas, schools, and infrastructure while promoting buffer zones around pollution hotspots and integrating green spaces and low-emission materials for healthier cities. Furthermore, by identifying high-pollution areas, this study supports targeted public health interventions, including promoting protective behaviors, allocating healthcare resources to high-risk regions, and designing awareness campaigns to reduce exposure.
This study systematically reviewed the research hotspots and evolution trends in the field of air quality from a macro perspective. Against the backdrop of global climate change and climate cooperation, future research should focus on how low-carbon transformation strategies re-influence the theory and practice of environmental issues and explore the possible heterogeneity in air quality improvement research among different countries and regions due to differences in political systems, industrial structures, and cultural backgrounds. While identifying common problems in environmental governance and low-carbon development among countries, it is also necessary to reveal the unique experiences of each country in terms of governance strategies, technological innovation, and social participation. In summary, future research needs to maintain a macro perspective while further integrating the latest developments in climate and low-carbon agendas to build a more comprehensive and dynamic analytical framework, providing more scientific and precise decision support for the optimization of global environmental management and public health strategies.
5. Outlook
The global focus on urban air pollution has entered a new phase, with megacities becoming key areas for environmental governance and scientific inquiry. As revealed through bibliometric analysis, research in this domain has grown exponentially in recent years, exhibiting three defining characteristics: the deepening of interdisciplinary integration, advancements in pollution source attribution mechanisms, and a paradigm shift in governance models. These trends highlight the increasing complexity of air pollution challenges in megacities and underscore the need for more comprehensive, collaborative, and technology-driven approaches to air quality management.
Interdisciplinary research has played a crucial role in advancing our understanding of urban air pollution. Traditional studies focused on atmospheric chemistry and environmental science have now expanded to incorporate insights from public health, urban planning, climate science, and artificial intelligence. This shift has led to significant progress in key areas such as pollution source fingerprinting, health risk assessment modeling, and the standardization of air quality monitoring technologies. By integrating multiple fields of expertise, researchers can develop more accurate predictive models, improve pollution mitigation strategies, and create data-driven policies that better reflect the complex interactions between human activities and atmospheric processes. Future research should continue to strengthen this interdisciplinary approach, fostering closer collaboration between environmental scientists, epidemiologists, urban planners, and data analysts.
Another major trend in megacity air pollution research is the increasing emphasis on international collaboration. The bibliometric analysis indicates that the United States and China collectively contribute more than half of the total research output in this field, positioning them as global leaders in air pollution studies. However, this geographical concentration of research efforts may present challenges in adapting pollution control technologies to different socioeconomic and environmental contexts. To enhance the applicability and scalability of air quality management strategies, it is essential to establish stronger international partnerships. Existing frameworks, such as those provided by the World Health Organization (WHO), the United Nations Environment Programme (UNEP), and the Intergovernmental Panel on Climate Change (IPCC), can serve as platforms for global cooperation. Future efforts should focus on harmonizing technical standards, developing cross-border data-sharing agreements, and implementing coordinated air quality monitoring initiatives. Strengthening collaboration between developed and developing nations will be critical in addressing transboundary air pollution and ensuring that scientific advancements benefit a broader range of urban populations.
In addition to advancements in research and collaboration, the governance of air pollution in megacities is also undergoing a significant transformation. Traditional end-of-pipe control strategies, which primarily focus on reducing emissions at the source, are becoming increasingly inadequate in managing the complexities of urban air quality. A more proactive and systems-based approach is needed, integrating real-time monitoring, predictive analytics, and policy interventions that account for environmental justice considerations. Emerging technologies, such as artificial intelligence and remote sensing, offer promising solutions for real-time pollution tracking and dynamic emission source attribution. Additionally, climate-adaptive air pollution early-warning systems, which leverage meteorological data and machine learning algorithms, can help cities anticipate and mitigate pollution episodes before they reach critical levels. Furthermore, policy frameworks should incorporate principles of environmental justice to ensure that pollution mitigation efforts are equitably distributed, particularly in communities that are disproportionately affected by poor air quality.
This study provides a comprehensive synthesis of global megacity air pollution research, outlining key developmental trajectories and interdisciplinary synergies. Examining the interactions between scientific disciplines, pollution formation mechanisms, and governance structures highlights pathways for advancing both research and policy effectiveness. Moving forward, scholars and policymakers should adopt a more holistic perspective that considers the interplay between urbanization, climate change, and socioeconomic factors. Additionally, region-specific adaptation strategies should be prioritized to reflect the unique environmental and regulatory challenges faced by different megacities.
Ultimately, the goal of future research should be to bridge the gap between scientific discovery and practical policy implementation. It is imperative that laboratory-based findings translate into real-world applications that drive tangible improvements in air quality. By fostering stronger international collaboration, embracing emerging technologies, and prioritizing equitable governance approaches, the field of megacity air pollution research can make meaningful contributions to global sustainability goals. For this reason, it will pave the way for healthier, more resilient urban environments and improve public well-being on a global scale.
