Article

Study of Thermodynamic Horizontal Structure of the Middle and Upper Atmosphere Based on Atmospheric Detection Lidar Networks

1
Innovation Academy of Precision Measurement Science and Technology, Chinese Academy of Sciences, Wuhan 430071, China
2
University of Chinese Academy of Sciences, Beijing 100049, China
3
School of Electronic Engineering, Nanjing Xiaozhuang University, Nanjing 211171, China
*
Author to whom correspondence should be addressed.
Atmosphere 2025, 16(4), 401; https://doi.org/10.3390/atmos16040401
Submission received: 28 February 2025 / Revised: 19 March 2025 / Accepted: 28 March 2025 / Published: 30 March 2025
(This article belongs to the Special Issue Observations and Analysis of Upper Atmosphere)

Abstract

:
Understanding the thermodynamic horizontal structure of the mesopause is essential for studying atmospheric wave dynamics and energy transport. However, conventional models like MSISE-00 exhibit some discrepancies from lidar observations in the mesopause. To obtain a more reliable horizontal temperature structure, this study integrates coordinated lidar observations from Urumqi, Yuzhong, and Yangbajing with models using a three-dimensional variational (3DVAR) data assimilation method to construct a high-resolution temperature field over northwestern China. The assimilated temperature profiles closely match lidar observations, with the RMSE (root mean square error) of residual reductions of 67.35% at Urumqi, 60.69% at Yuzhong, and 34.80% at Yangbajing. Independent validation at Korla showed a RMSE of residual reductions of 40.14%, confirming the model’s effectiveness. The thermodynamical horizontal structures of the mesopause obtained from this model were also analyzed. The lidar-based model for the mesopause extends the observation results from disparate lidar stations to the area between lidar stations and will contribute to a deeper understanding of upper atmospheric dynamics.

1. Introduction

The middle and upper atmosphere plays a crucial role in atmospheric energy transport and wave dynamics, influencing climate patterns [1,2,3,4]. Located in the mesopause region, precise measurement of atmospheric parameters is essential for understanding its dynamic processes and climate impact [5,6,7]. Sodium lidar (light detection and range), a key tool for mesopause research, enables high-precision atmospheric measurements at specific temporal and spatial resolutions [8,9,10,11]. It provides critical data on atmospheric waves, energy transfer, and composition changes, making it indispensable for studying mesopause dynamics [11,12,13,14,15].
Ground-based single-site lidar systems enable detailed investigations of the vertical structure and temporal evolution of the mesopause but are limited in their ability to capture horizontal structural evolution. To address this, Gardner employed airborne lidar to conduct detection campaigns covering distances of 750 km and 1500 km, successfully identifying episodic sodium layer phenomena [16]. However, airborne observations are limited in spatial coverage and temporal resolution, and it is difficult to separate spatial and temporal variations. In contrast, ground-based fixed stations offer long-term, high-resolution observations, effectively overcoming these limitations.
Multi-station atmospheric observation networks have been established worldwide to enhance data consistency and spatial coverage. The SIMONe radar network [17], for example, employs multiple-input multiple-output (MIMO) technology to improve detection capabilities, reducing noise and enabling direct measurements of horizontal divergence and vorticity. Additionally, lidar networks such as CIS-LiNe [18], the East Asian dual-wavelength lidar network [19], and the Northwest China aerosol observation network [20] have been developed to monitor aerosols and atmospheric pollutants. While these networks significantly contribute to lower and middle atmospheric studies, their application to horizontal structure evolution in the middle and upper atmosphere remains limited.
To bridge this gap, the “Meridian Project” in China has established multi-lidar stations, including Urumqi, Yuzhong, and Yangbajing et al., facilitating long-term observations of middle and upper atmospheric dynamics [21,22]. And a lidar network based on the “Meridian Project” was constructed to investigate large-scale atmospheric processes [23]. The mesopause could be limitedly investigated over these stations with thousands of kilometers of horizontal distances. However, the area between these stations could not be detected directly.
Lots of atmosphere models are able to predict atmospheric parameters globally. For example, the MSISE-00 model demonstrates good consistency with lidar observations in the lower and middle atmosphere; however, significant discrepancies arise in the mesopause. The numerical model WACCM (Whole Atmosphere Community Climate Model) shows generally good agreement with lidar observational results; however, there is pronounced disagreement between the lidar results and WACCM above 90km [24]. NASA’s MERRA-2 (Modern-Era Retrospective Analysis for Research and Applications, Version 2) reanalysis focuses on energy and water cycle processes by integrating ground-based observations, satellite remote sensing, and radiosonde data [25], providing global lower and middle atmospheric parameters with high resolution.
The three-dimensional variational (3DVAR) method is a data assimilation technique based on variational assimilation, and its theoretical framework was proposed by Lorenc in 1986 [26]. 3DVAR has been applied to numerical weather forecasting [27,28], atmosphere chemistry, and ocean modeling [29], primarily focusing on the troposphere and stratosphere [30,31]. In this paper, with the benefits of the sodium lidar network, the 3DVAR data assimilation approach was employed to extend the observation results from disparate lidar stations to the area between lidar stations for mesopause investigation. MSISE-00 is affordable and widely used in upper atmosphere research and applications; thus, this paper selects this model as the source of background data. A lidar-based model for mesopause with extensive spatial coverage was developed by assimilating lidar network data into the MSISE-00 empirical model results. Then, independent observational results were used to verify the lidar-based atmospheric data model. The thermodynamical horizontal structures of the mesopause obtained from a lidar-based model for the mesopause are analyzed. This approach enables a comprehensive investigation of the thermodynamic horizontal structure of the middle and upper atmosphere. This study is expected to enhance the applicability of lidar networks and contribute to a deeper understanding of upper atmospheric dynamics.

2. Methods

To address the challenge of limited observational coverage from single-station lidar systems, the Meridian Project II has established a lidar network. This section introduces the lidar system at first, followed by the distribution of the lidar network stations, and finally the 3DVAR for assimilating lidar network data with the MSISE-00 empirical model results, which generates atmospheric fields with high spatial resolution, integrating data from disparate lidar stations with atmospheric model data and performing data assimilation in three-dimensional space.

2.1. Lidar System

A lidar system consists of a laser emission unit, a telescope reception unit, and a signal detection unit. A schematic diagram of the lidar structure is shown in Figure 1.
The laser emission unit is composed of a seeder laser, an amplifier, a frequency stabilization unit based on sodium atomic saturation absorption, and a frequency-switching module. The seeder laser is a tunable external-cavity semiconductor laser that operates at a wavelength of 1178 nm and is capable of generating single-mode continuous light. The output beam from the seeder laser is then divided into two beams. One beam is directed towards a second harmonic generation crystal before entering the sodium atomic saturation absorption frequency stabilization unit. In this unit, the seeder laser’s output wavelength is stabilized using a frequency-locking feedback control system. This process ensures the long-term stability of the laser wavelength.
The second beam enters an acousto-optic modulator (AOM) for frequency switching, which generates a three-frequency laser. Controlled by an optical fiber switch, the laser sequentially enters three different channels. Two of these channels undergo frequency modulation via acousto-optic modulators, while the third channel remains as a free optical path, producing three laser frequencies: ν 0 and ν 0 ± 630   M H z . ν 0 represents the central frequency of the sodium D2a line. The resulting three-frequency laser is then amplified through a fiber Raman amplifier and further processed by a second harmonic generation module, producing the seed light for the pulse dye amplifier.
The system is also equipped with a high-power 1064 nm laser. Following frequency doubling, the beam is split into two beams: one transmits vertically for Rayleigh scattering in the atmosphere, and the other pumps the pulse dye amplifier, thereby generating a 589 nm pulsed laser. This 589 nm pause laser is split into three beams to excite sodium echoes in the mesopause from vertically overhead, 30° north of vertical, and 30° west of vertical, respectively. The echoes are collected by three telescopes.
To mitigate the risk of signal saturation in the photodetectors caused by the strong echoes from lower-altitude atmospheric layers, the laser is emitted in an off-axis configuration. This configuration serves to mitigate the impact of undesired returns from lower altitudes. Additionally, to mitigate the interference from background light and to ensure precise field-of-view alignment, the telescopes receiving field-of-view is strictly confined to a maximum of 0.5 mrad. The received echo signals are then transmitted via optical fibers to the signal detection unit, where they undergo collection and further processing for atmospheric parameter inversion and analysis.
The signal detection unit incorporates a sodium atomic filter, a photomultiplier tube (PMT), and a multi-channel photon counter. During diurnal observations, the 589 nm sodium layer fluorescence channel employs a sodium atomic Faraday filter to block out the solar background light, thereby enhancing the signal-to-noise ratio.
These signals are subsequently subjected to photon counting by the data acquisition card. The collected raw data have a time resolution of one minute and a vertical resolution of 30.7 m. These data are then utilized to invert the temperature and wind of the mesopause following the equations [8,9,32].
R T z = N n o r m ν + , z , t + N n o r m ν , z , t 2 N n o r m ν 0 , z , t
R w z = N n o r m ν + , z , t N n o r m ν , z , t N n o r m ν 0 , z , t
where ν 0 , ν + , a n d ν represent the center frequency and the two side frequencies of ν 0 ± 630   M H z , N n o r m ν , z , t is the normalized sodium layer echo signal, and the ratios R T and R w are sensitive to temperature and wind, respectively.

2.2. Lidar Network

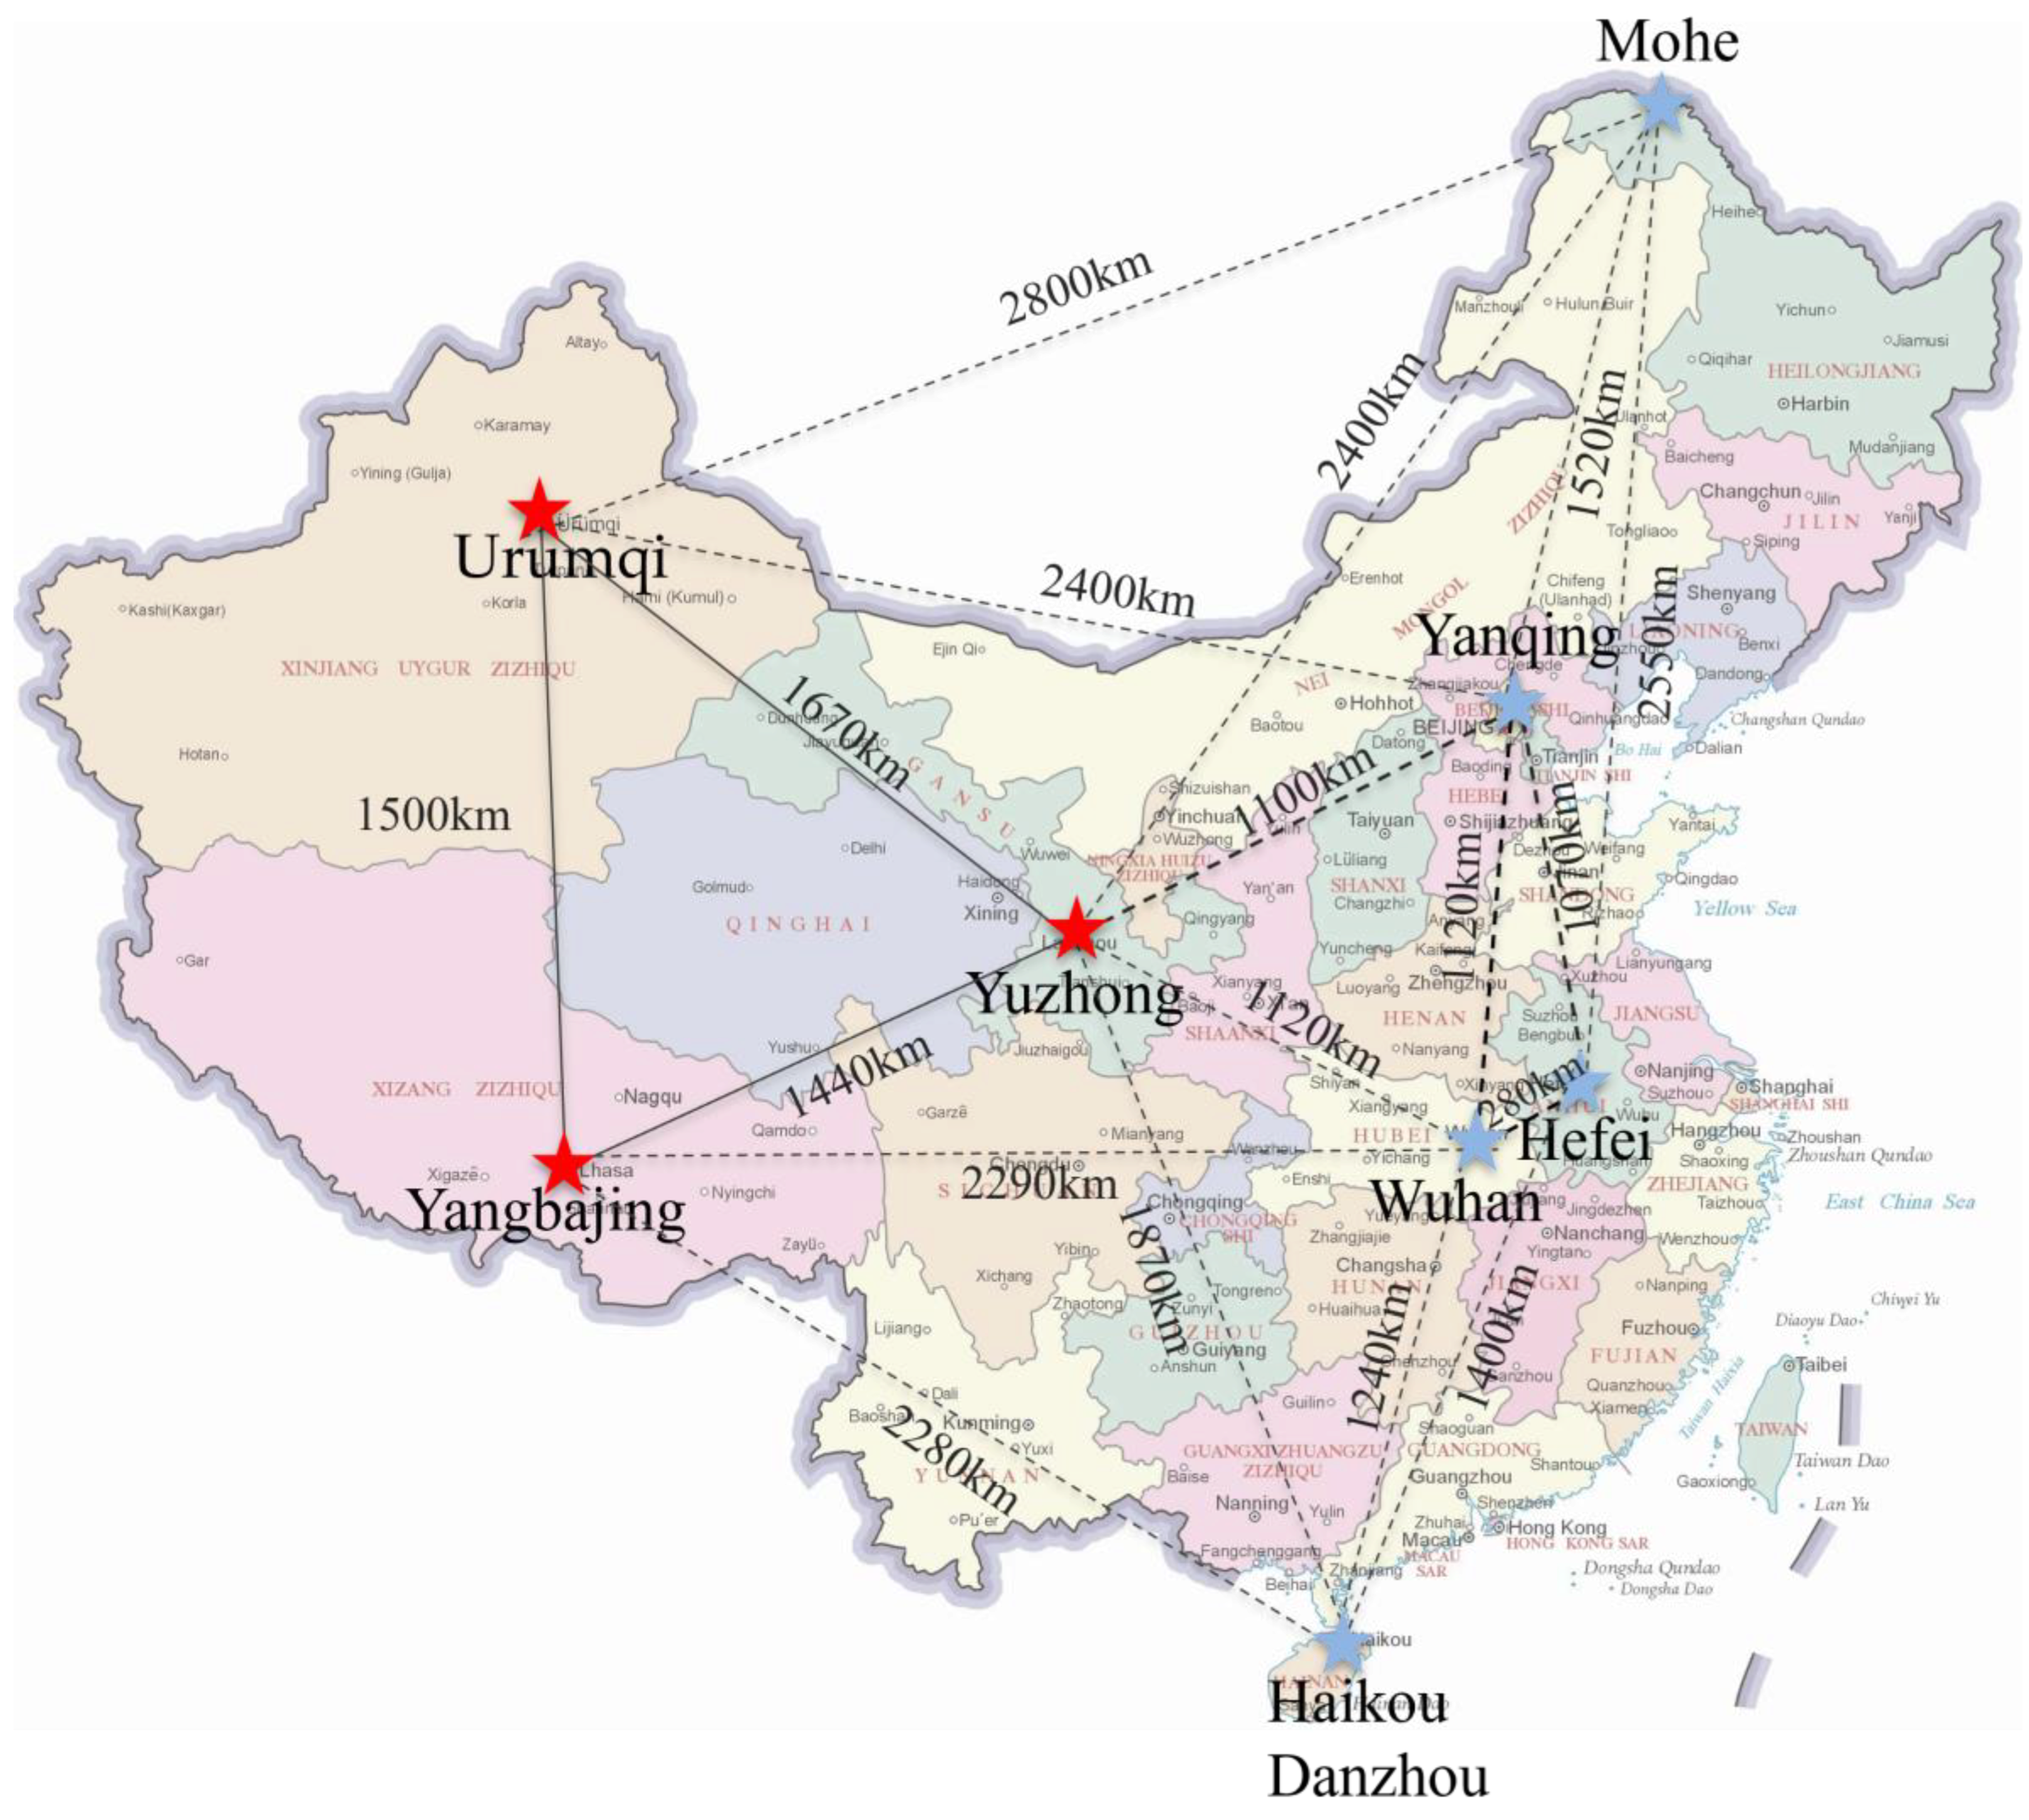
The “Meridian Project” has established eight sodium lidar stations, as illustrated in Figure 2. The sodium lidars of phase I of the Chinese Meridian project in Wuhan, Yanqing, Hefei, and Haikou station are broadband systems that measure sodium density. The others are narrowband systems that can measure mesopause temperature. The station information is shown in Table 1. The temperature data have been collected in these stations since 2024. Ensuring the spatiotemporal comparability of the collected data necessitates the implementation of rigorous criteria during the selection of existing stations. These criteria should encompass considerations such as detection mechanisms, detection capabilities, data formats, and spatiotemporal coordinate consistency. Furthermore, given the potential impact of distance on data correlation analysis and the effectiveness of cooperative observation, selecting geographically proximate stations is also a key consideration. According to the above criteria, this study selected mesopause temperature profiles of Urumqi Station (87.1° E, 43.3° N), Yangbajing Station (90.5° E, 30.1° N), and Yuzhong Station (104.2° E, 36.0° N) as the observation stations of the lidar network. In the future, we aim to incorporate additional lidar stations into the network to enhance its spatial coverage and improve the comprehensiveness of middle and upper atmospheric observations.
The three selected lidar stations have been positioned across key regions of northwestern China and the Tibetan Plateau, with an average inter-station distance of approximately 1500 km. The hardware and observation mechanisms at these stations are highly consistent, thereby ensuring that the impact of equipment differences on the quality of the collaborative observation data is minimized. This, in turn, ensures that the network produces unified, high-quality measurements. In addition, all stations employ a standardized spatiotemporal coordinate system, with strict adherence to resolution and format standards for both temporal and spatial measurements.
The employment of this standardized spatiotemporal calibration method enables the performance of synchronized collaborative observations by lidar stations when weather conditions permit or when specific meteorological phenomena arise. This synchronization facilitates the collection of coherent and aligned data across disparate sites, thereby enhancing the comparability of measurements. The joint observation data are derived from the intersection of valid data collected by each station, which maximizes the overall utility and effectiveness of the data.

2.3. Lidar Network Data Processing—3DVAR Method

In order to facilitate the detection and analysis of the atmospheric horizontal temperature structure through the implementation of a lidar network, the employment of suitable data processing methodologies is imperative. In order to achieve a more comprehensive and precise analysis of the atmospheric thermodynamic horizontal structure, this study incorporates the three-dimensional variational (3DVAR) data assimilation method [33] into the data processing pipeline. This method integrates observational data from individual stations with numerical models, yielding the derivation of a three-dimensional (longitude from 85° E to 104° E, latitude from 25° N to 44° N, altitude from 80 to 100 km) structure of atmospheric temperature. Therefore, this process yields an initial empirical lidar-based data model to provide mesopause temperature profiles for the area between lidar stations.
This method assimilates temperature data at specified altitudes one by one, as follows. The atmospheric temperature variables are denoted by x which is a 20 × 20 matrix representing temperature at grid node 1° × 1° for specific altitude z , the lidar network observed value y k at specific altitude, k = 1,2,3 represents Urumqi, Yuzhong, and Yangbajing stations, respectively; and the observation operator, denoted by H , projects the model space into the observation space. The objective of 3DVAR is to minimize the following cost function [33,34]:
J x = 1 2 x x 0 T B 1 x x 0 + 1 2 y k H x T R 1 y k H x
x 0 represents the initial background field temperature from MSISE-00 at a specific altitude. The spatial resolution of the assimilated data is set as 1° × 1° × 1 km. B is a 400 × 400 background error covariance matrix, which quantifies the uncertainty associated with the initial state. R is a 3 × 3 observation error covariance matrix, which represents the uncertainty in the observational data. The process of minimizing the cost function involves adjusting the initial state x , optimizing the model’s forecast, and reducing the errors between the model predictions and the observed data within the specified time window. The error covariance matrices B and R provide critical information about the uncertainties in the background field and the observations, respectively. The value of x obtained by minimizing the cost function J x represents the temperature distribution within the assimilated lidar network region.
The covariance matrix of the assimilation error is given by the following equation [34]:
P = B B H T H B H T + R 1 H B
P is the assimilation error covariance matrix, representing the uncertainty of temperature after the data assimilation process.
By computing the assimilation results at 21 altitudes (from 80 km to 100 km), a three-dimensional temperature assimilation result and its uncertainty are obtained.

3. Results and Discussion

3.1. Assimilation Data

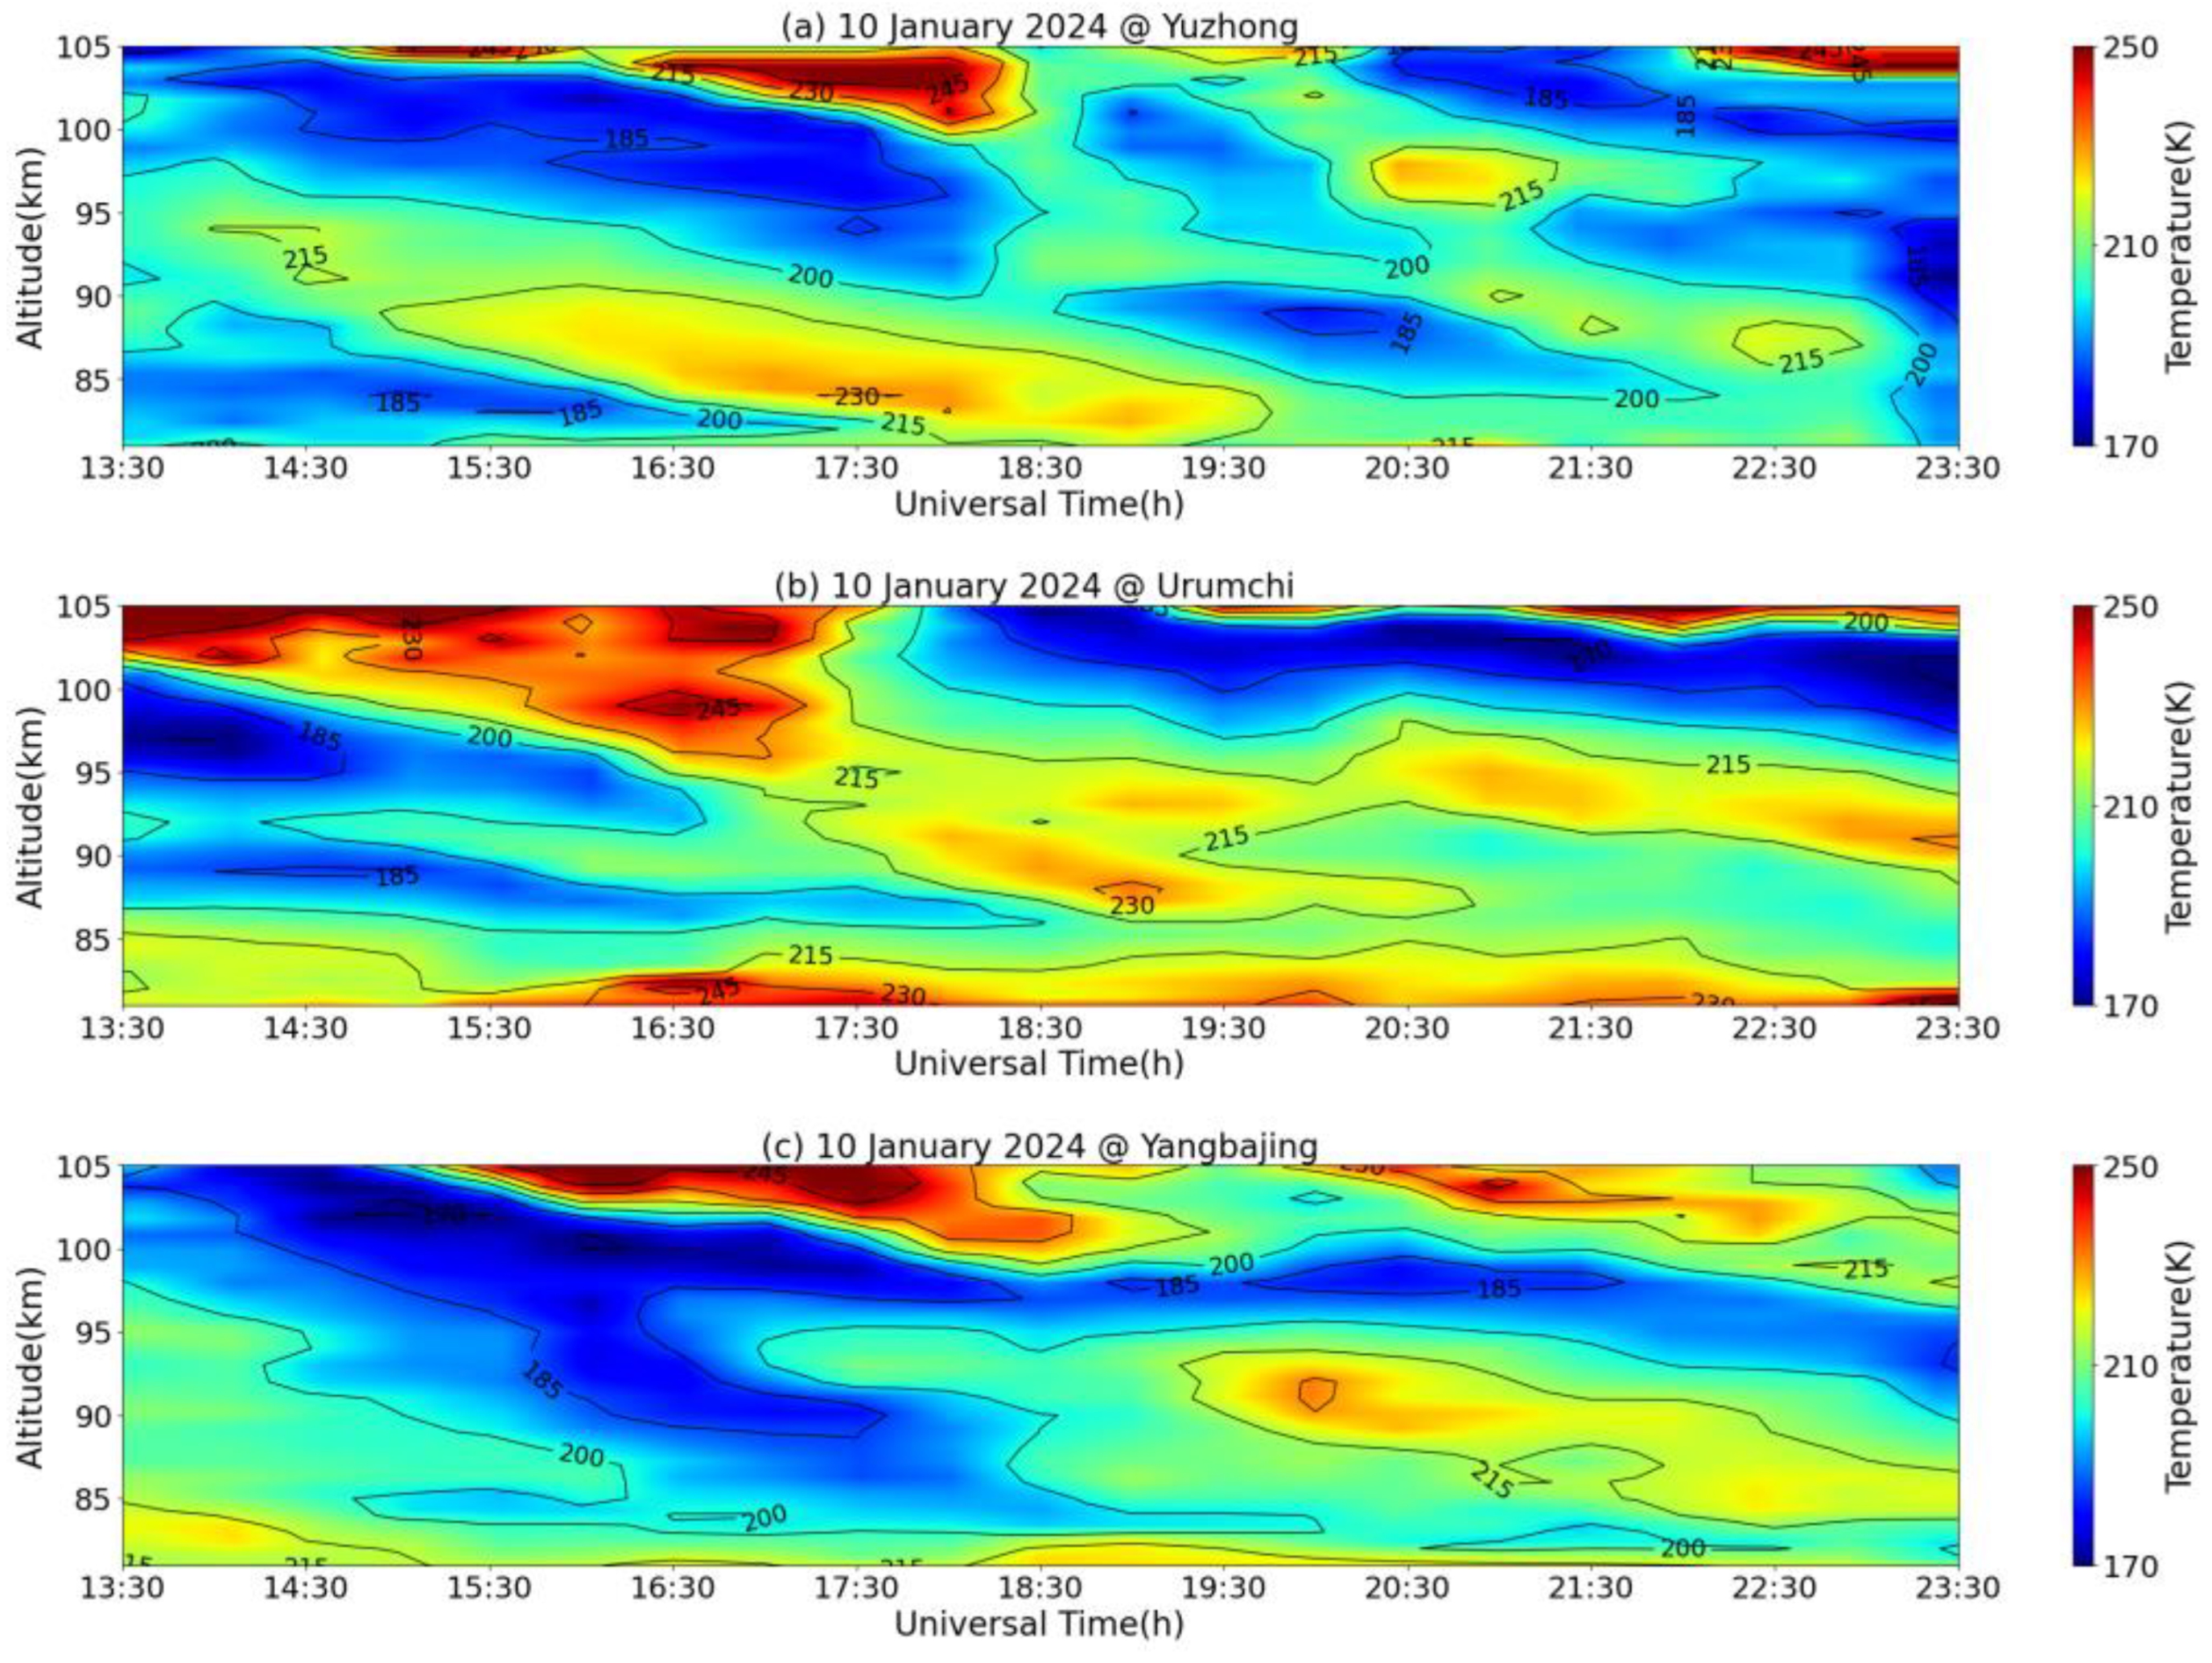
In this study, the time period between 13:30 and 23:30 UT on 10 January 2024 is used as a representative example for three-dimensional data assimilation processing. During this period, the weather was clear over all three lidar stations, with no obvious cloud cover.
As illustrated in Figure 3, the temporal evolution of middle and upper temperatures at Urumqi, Yangbajing, and Yuzhong stations on 10 January 2024. The temperature profiles span an altitude range of 80 to 105 km, with a vertical resolution of 1 km and a temporal resolution of 60-min intervals. These data clearly capture the dynamical and thermodynamical variations in mesopause during the nighttime period from 13:30 (UTC) to 23:30 (UTC). Since all three stations are located in the UTC+8 zone, the corresponding local observation period is from 21:30 on 10 January to 07:30 on 11 January.
As illustrated in Figure 3, the vertical fluctuation structure in temperature distribution with time is observed for three stations within the altitude range of 80–105 km. The vertical temperature structures of the mesopause can be extracted from Figure 3 for investigation of tide, gravity waves, and so on [6,35,36].
The present study employs the 3DVAR data assimilation method (see Section 2.3) and utilizes temperature data from the MSISE-00 model as the background field x 0 to investigate the horizontal thermal structures. Observational data from the Urumqi, Yuzhong, and Yangbajing stations are assimilated as observations y k using the assimilation computation described in Equation (3), yielding a three-dimensional temperature field.
To obtain the background error covariance matrix B , the NMC (National Meteorological Center) method is initially employed to derive an estimate B 0 . However, in the MSISE-00 model, directly applying the covariance matrix derived from the NMC method results in certain values approaching zero, which significantly affects the accuracy of the assimilation results. To mitigate this issue, an initialization correction is applied to the background error covariance matrix using the formulation B = λ ( B 0 + k ) , where k = 1 and λ is a coefficient optimized to achieve the most accurate error estimation for B . The observation error covariance matrix R is constructed based on the uncertainties in lidar temperature observations, with its diagonal elements set as the square of the lidar observation temperature errors. The assimilated temperature profiles at the three observational stations are presented in Figure 4.
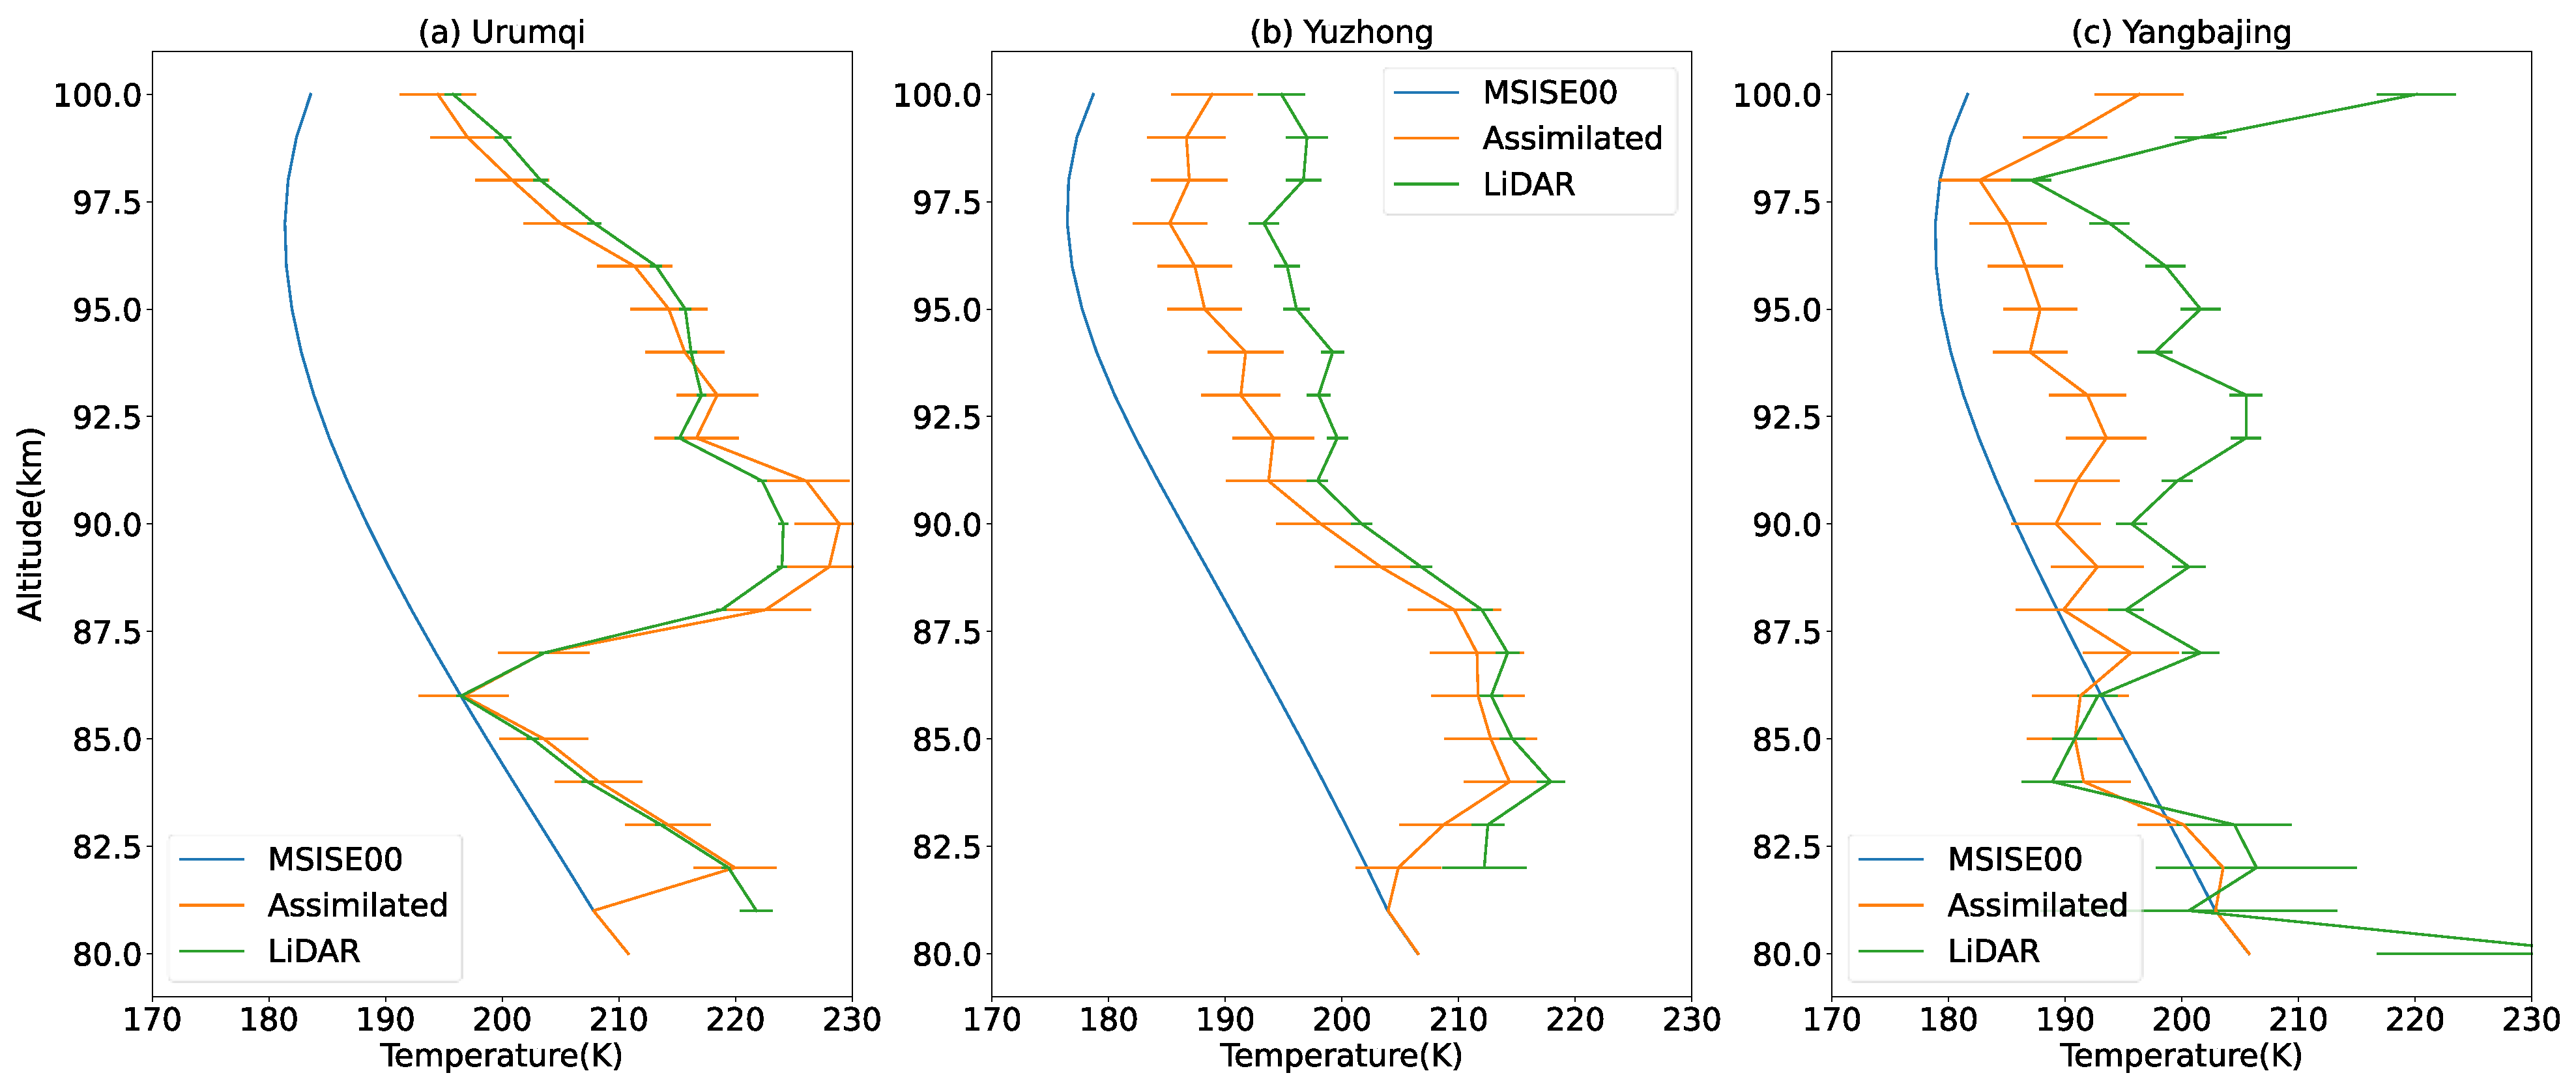
Figure 4 presents a comparison of temperature profiles at the Urumqi, Yangbajing, and Yuzhong stations at 18:00–19:00 UTC on 10 January 2024. The assimilated temperature profiles (orange solid lines) exhibit a high degree of consistency with the lidar observations (green solid lines), whereas the pre-assimilation (MSISE-00) profiles derived from the model (blue solid lines) show noticeable discrepancies. The RMSE (root-mean-square errors) of the residual of lidar and 3DVAR at 18:00–19:00 UTC at Urumqi is 3.88 K, which is much lower than the RMSE of the residual of lidar and MSISE-00, as shown in Table 2. This indicates that the assimilation process brings the temperature profiles closer to the observations, enhancing the reliability of the data.
Similar results are available for other time. The corresponding RMSE of residuals between MSISE-00, the lidar-based model (3DVAR) for mesopause, and lidar observational results at different hours are summarized in Table 2.
Table 2 shows the RMSE variation over time. This variation is primarily due to the differences in data characteristics. MSISE-00, being an empirical model, provides stable and averaged results over time, which leads to relatively consistent temperature profiles. In contrast, lidar measurements are real-time observations that can be more variable. When the lidar measurements are closer to the MSISE-00 model predictions, the RMSE is smaller. However, as atmospheric temperatures fluctuate throughout the observation period, the differences between lidar and model data increase, resulting in larger RMSE values. The results also indicate that the RMSE of residuals between the lidar-based model and the lidar observations is reduced compared to the RMSE of residuals between the MSISE-00 model and the lidar observations. At Urumqi, the average RMSE of residuals decreased 17.33 K (from 25.73 K to 8.40 K), a reduction of 67.35%. At Yuzhong, the average RMSE of residuals decreased 11.47 K (from 18.90K to 7.43 K), a reduction of 60.69%. At Yangbajing, the average RMSE of residuals decreased 6.46 K (from 18.56 K to 12.10 K), a reduction of 34.80%. Table 2 shows that the lidar-based model for mesopause using the 3DVAR method effectively reduces the discrepancy between the model and lidar observations.

3.2. Validation of the 3DVAR Data Assimilation Method

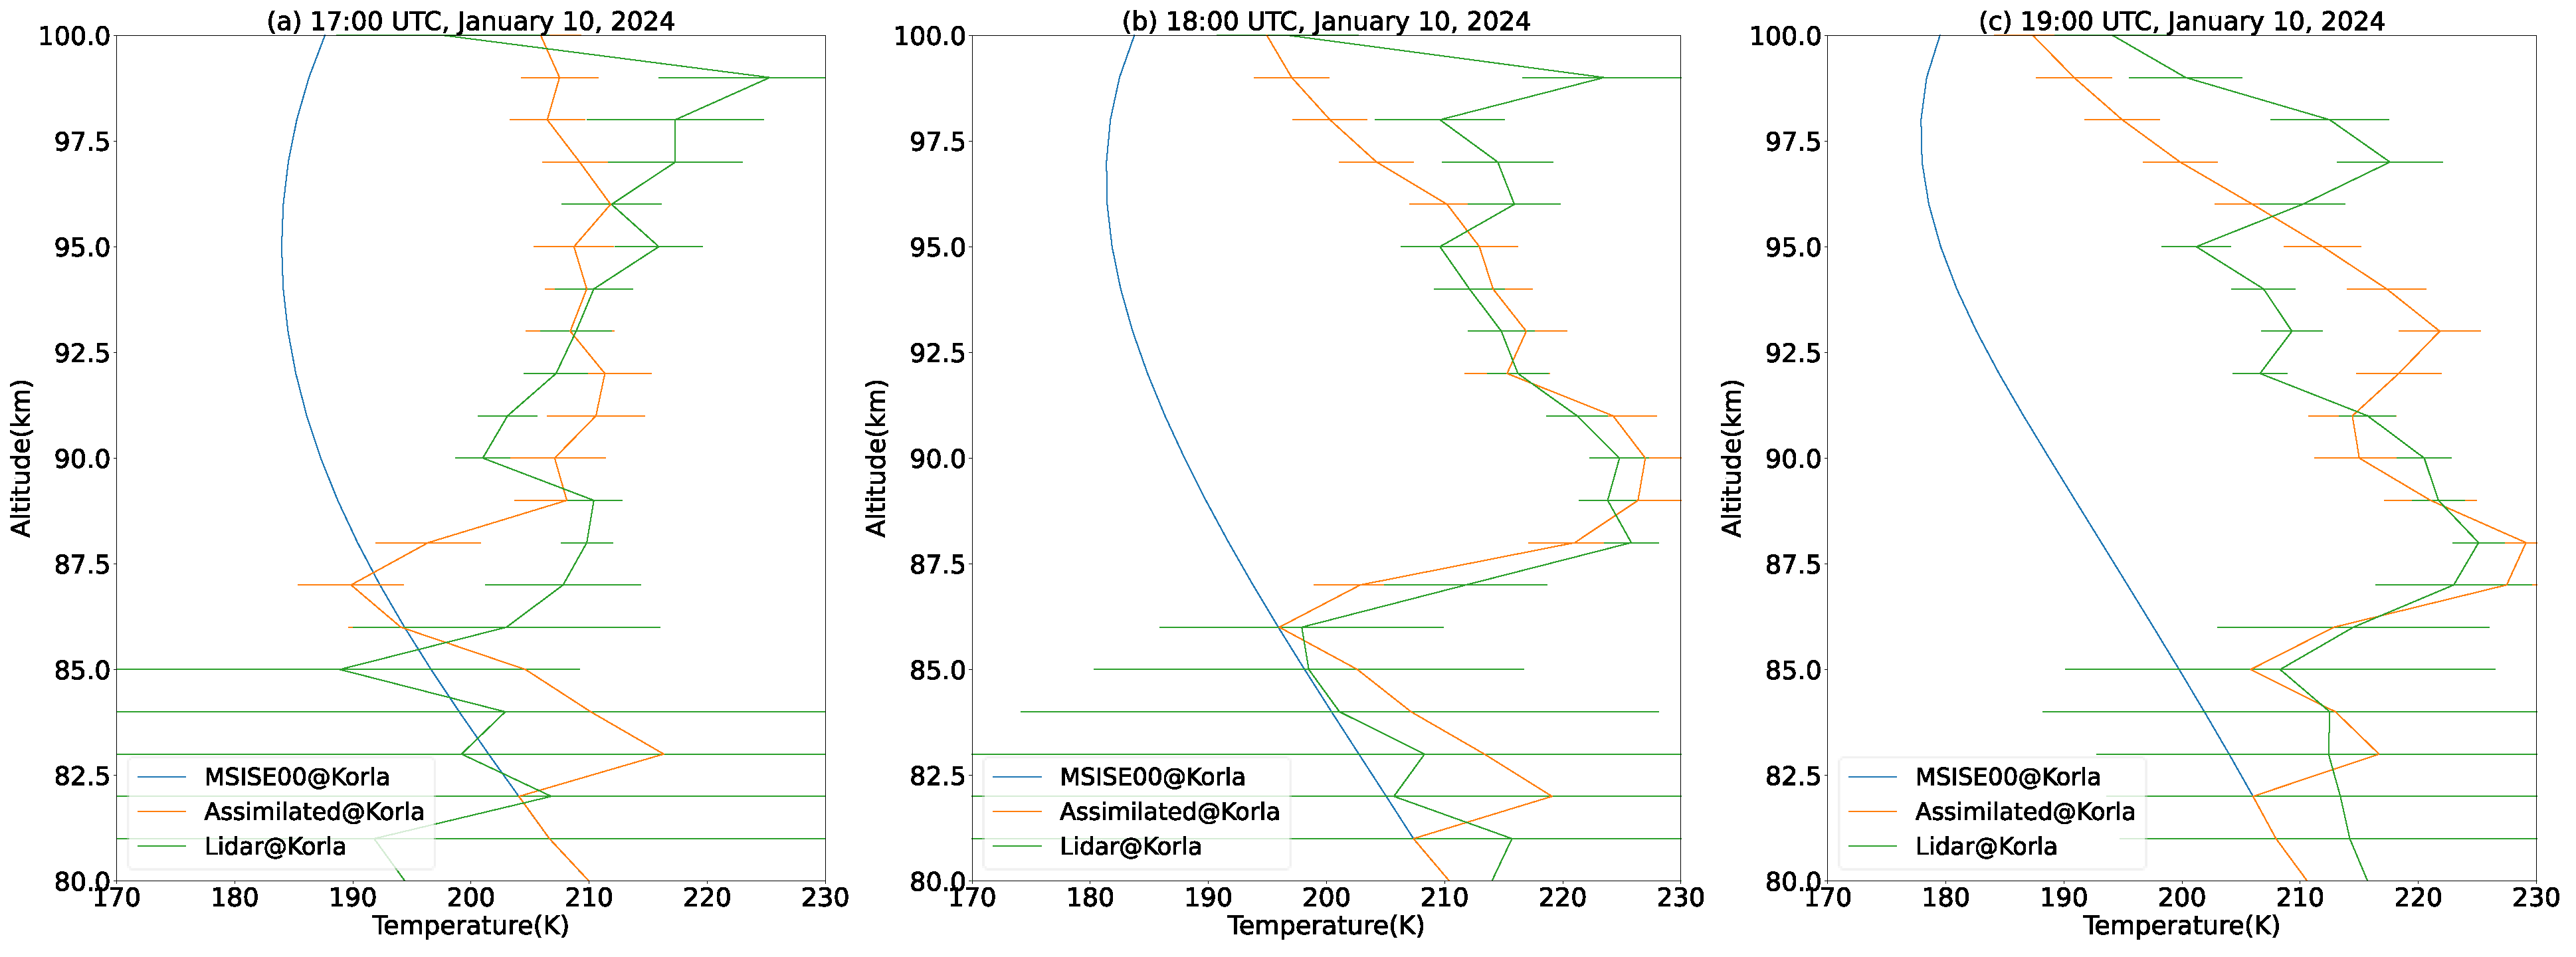
To assess the reliability of the lidar-based model’s results, the independent observational data within the lidar network region are used for comparison. We searched for simultaneous observations of mesopause atmospheric temperatures within the triangular region formed by three stations of the lidar network. However, unfortunately, the data available for independent validation came from a single mesopause temperature lidar located in Korla (86° E, 42° N). Since the spatial resolution of the assimilated data are 1° × 1°, the assimilated temperature profiles at the grid node (86° E, 42° N) at 17:00–18:00 UTC, 18:00–19:00 UTC, and 19:00–20:00 UTC on 10 January 2024 were compared with the lidar observations from Korla. The results are shown in Figure 5.
Figure 5 shows that the lidar-based model results at Korla, which were assimilated by lidar network observation results, are in better agreement with the local lidar observation temperature profiles. The RMSE of the residual between the lidar-based model and MSISE-00 with the Korla observational data were calculated. The results show that the RMSE decreased 41.84% (from 20.96 K to 12.40 K) at 17:00 to 18:00 UTC, 42.21% (from 24.83 K to 14.35 K) at 18:00 to 19:00 UTC, and 36.38% (from 22.95 K to 14.60 K) at 19:00 to 20:00 UTC. The results indicate that the assimilated temperature profiles exhibit improved agreement with the observed data, confirming the reliability and spatial applicability of the assimilation method. This validation demonstrates that the assimilation model effectively captures the evolution of the actual atmospheric temperature field. More lidar stations would be useful in verifying the horizontal temperature structure.

3.3. Thermodynamic Horizontal Structure

Based on this foundation, we further analyze the horizontal temperature distribution at 85 km, 90 km, and 95 km at different times between 16:00 and 21:00 UTC on 10 January 2024 to investigate the spatiotemporal variations in the thermodynamic structure of the middle and upper atmosphere.
At an altitude of 85 km, the temperature distribution remains relatively uniform throughout the observation period, ranging from 180 K to 200 K, with minimal temperature gradients. However, a localized temperature increase is observed around 17:00 UTC in the eastern region (95° E to 105° E, 30° N to 40° N), where the peak temperature exceeds 220 K (Figure 6b). This warming event is transient, as the temperature distribution gradually becomes more uniform afterward. By 20:00 UTC, a new high-temperature region emerges in the northwestern area (Figure 6e), although its peak temperature is relatively lower. The mechanisms responsible for these localized temperature increases require further investigation. One possible explanation is the influence of gravity waves, as their breaking can lead to localized temperature variations [3]. However, gravity wave breaking is typically more significant at altitudes above 90 km, and the dissipation process occurs over a longer timescale rather than within a short period [37]. Therefore, a more reliable understanding requires the support of more observational results.
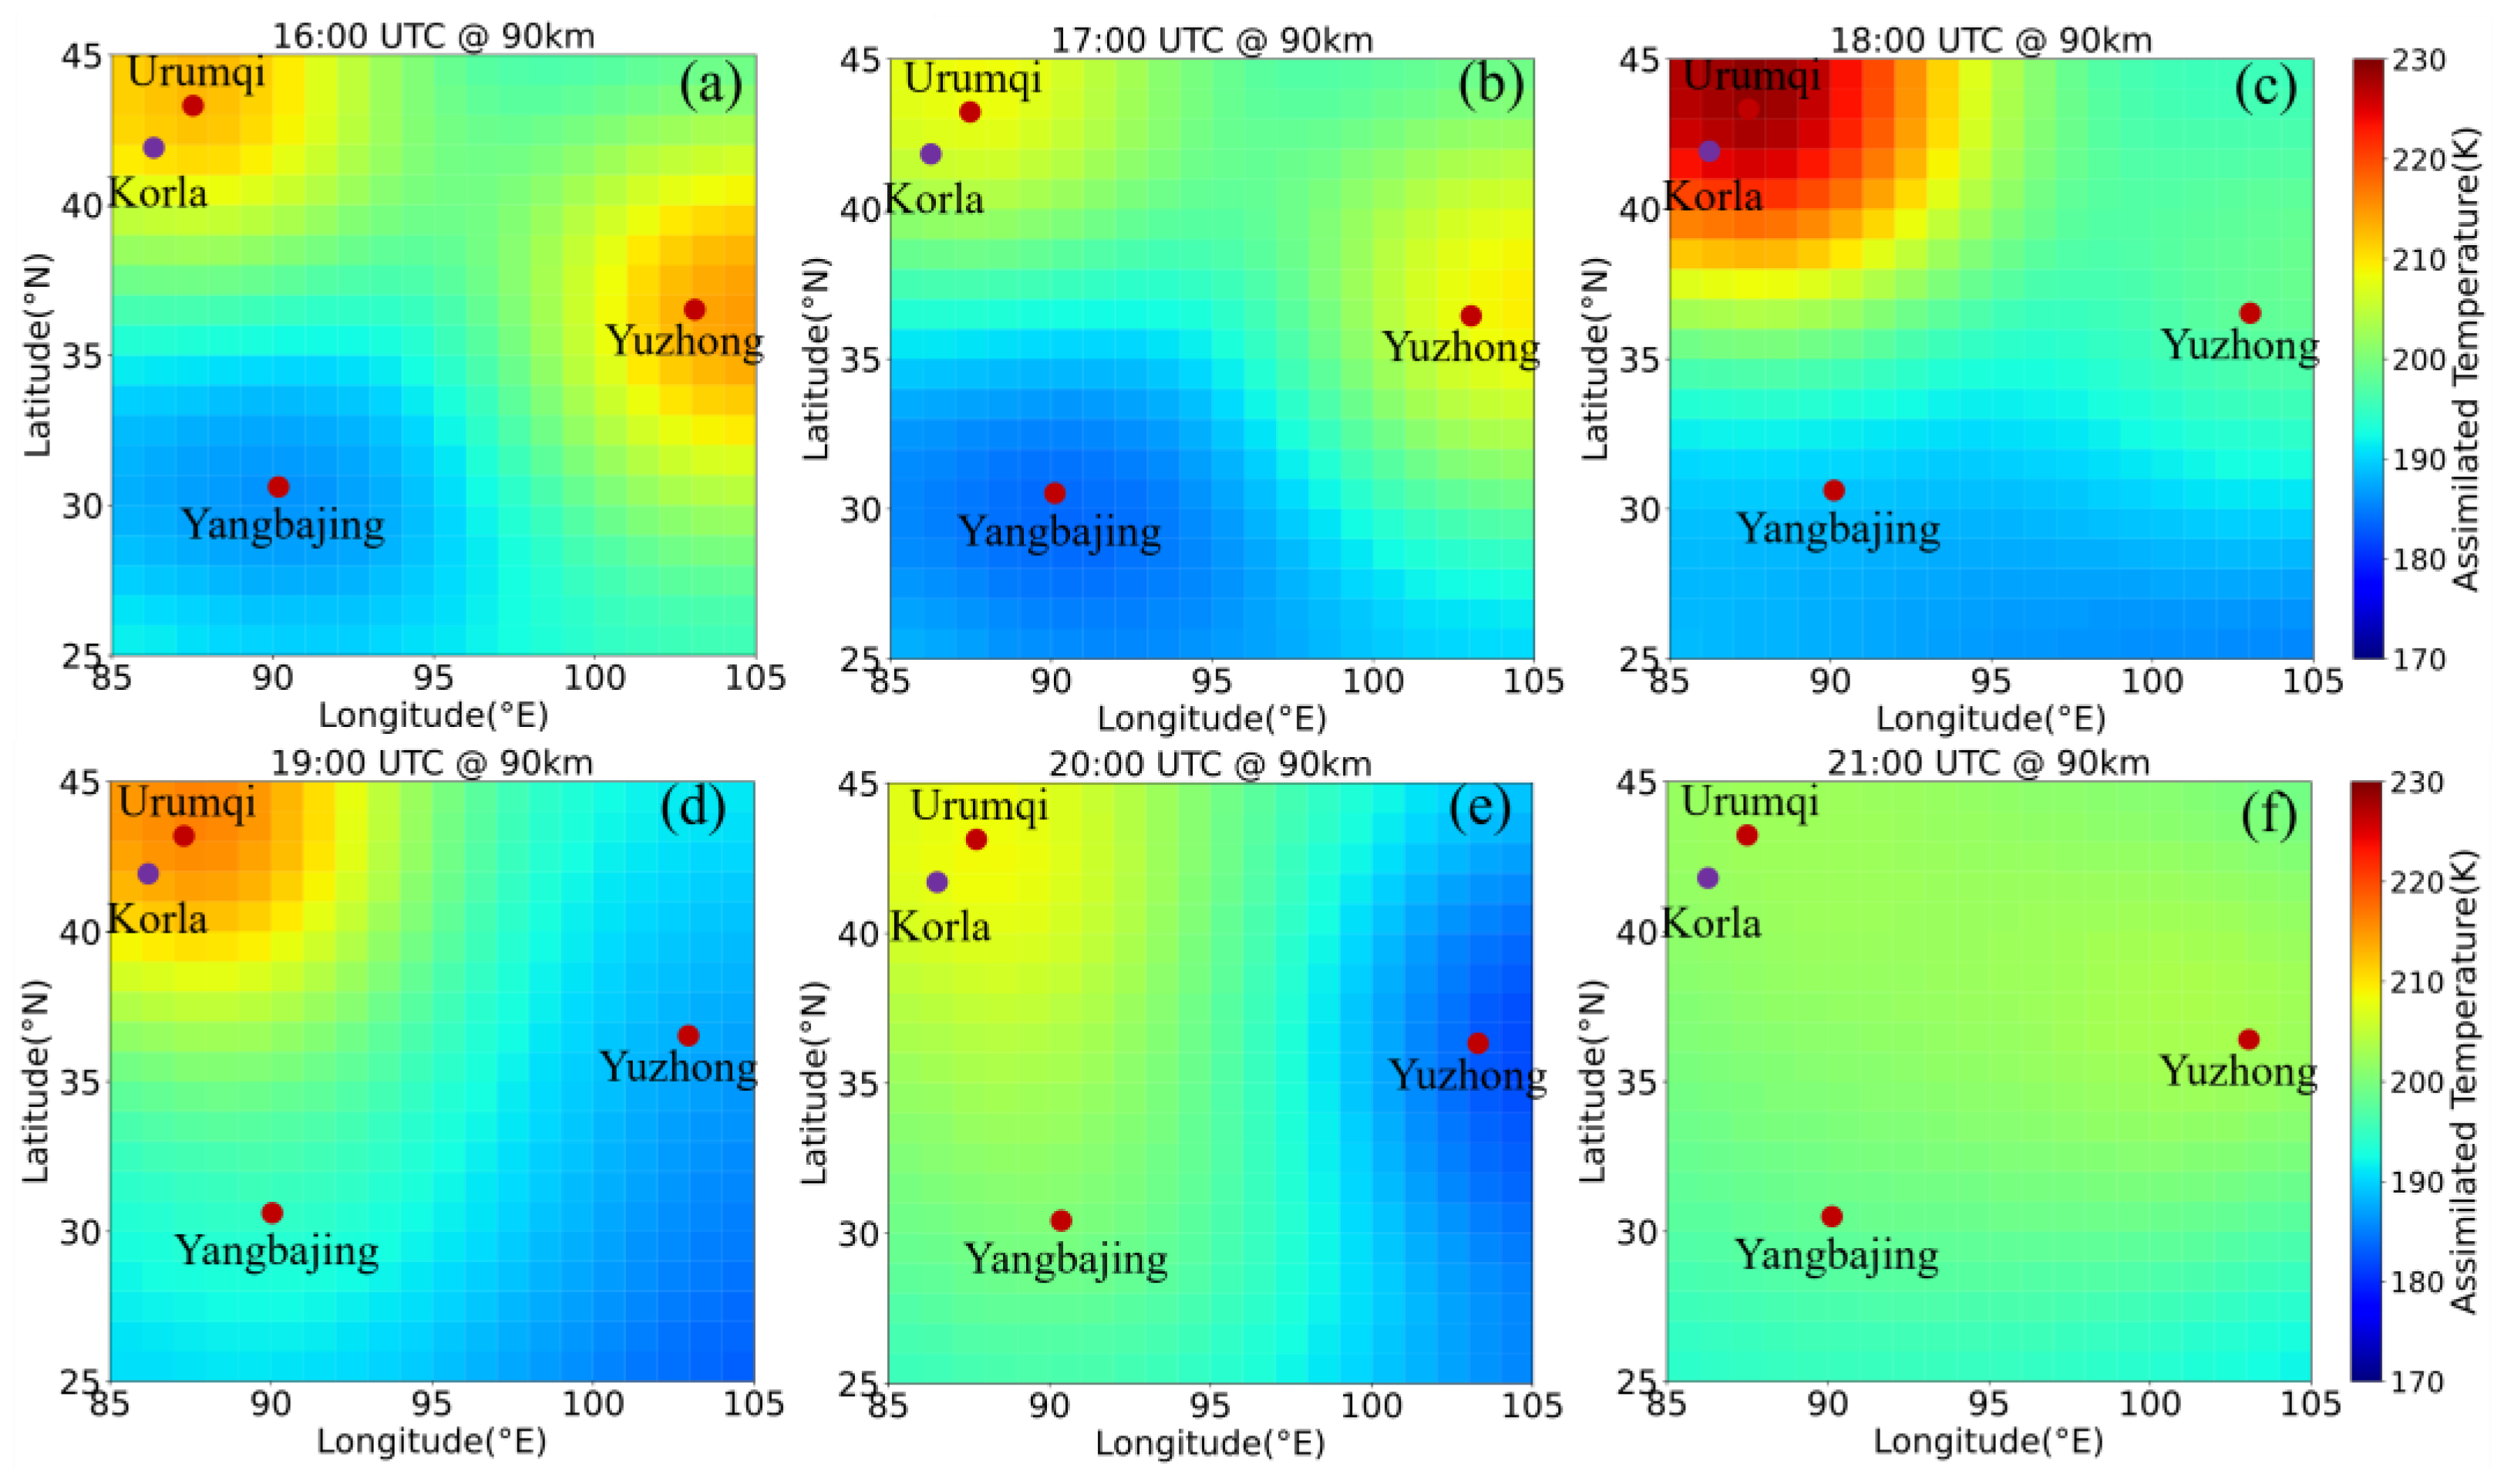
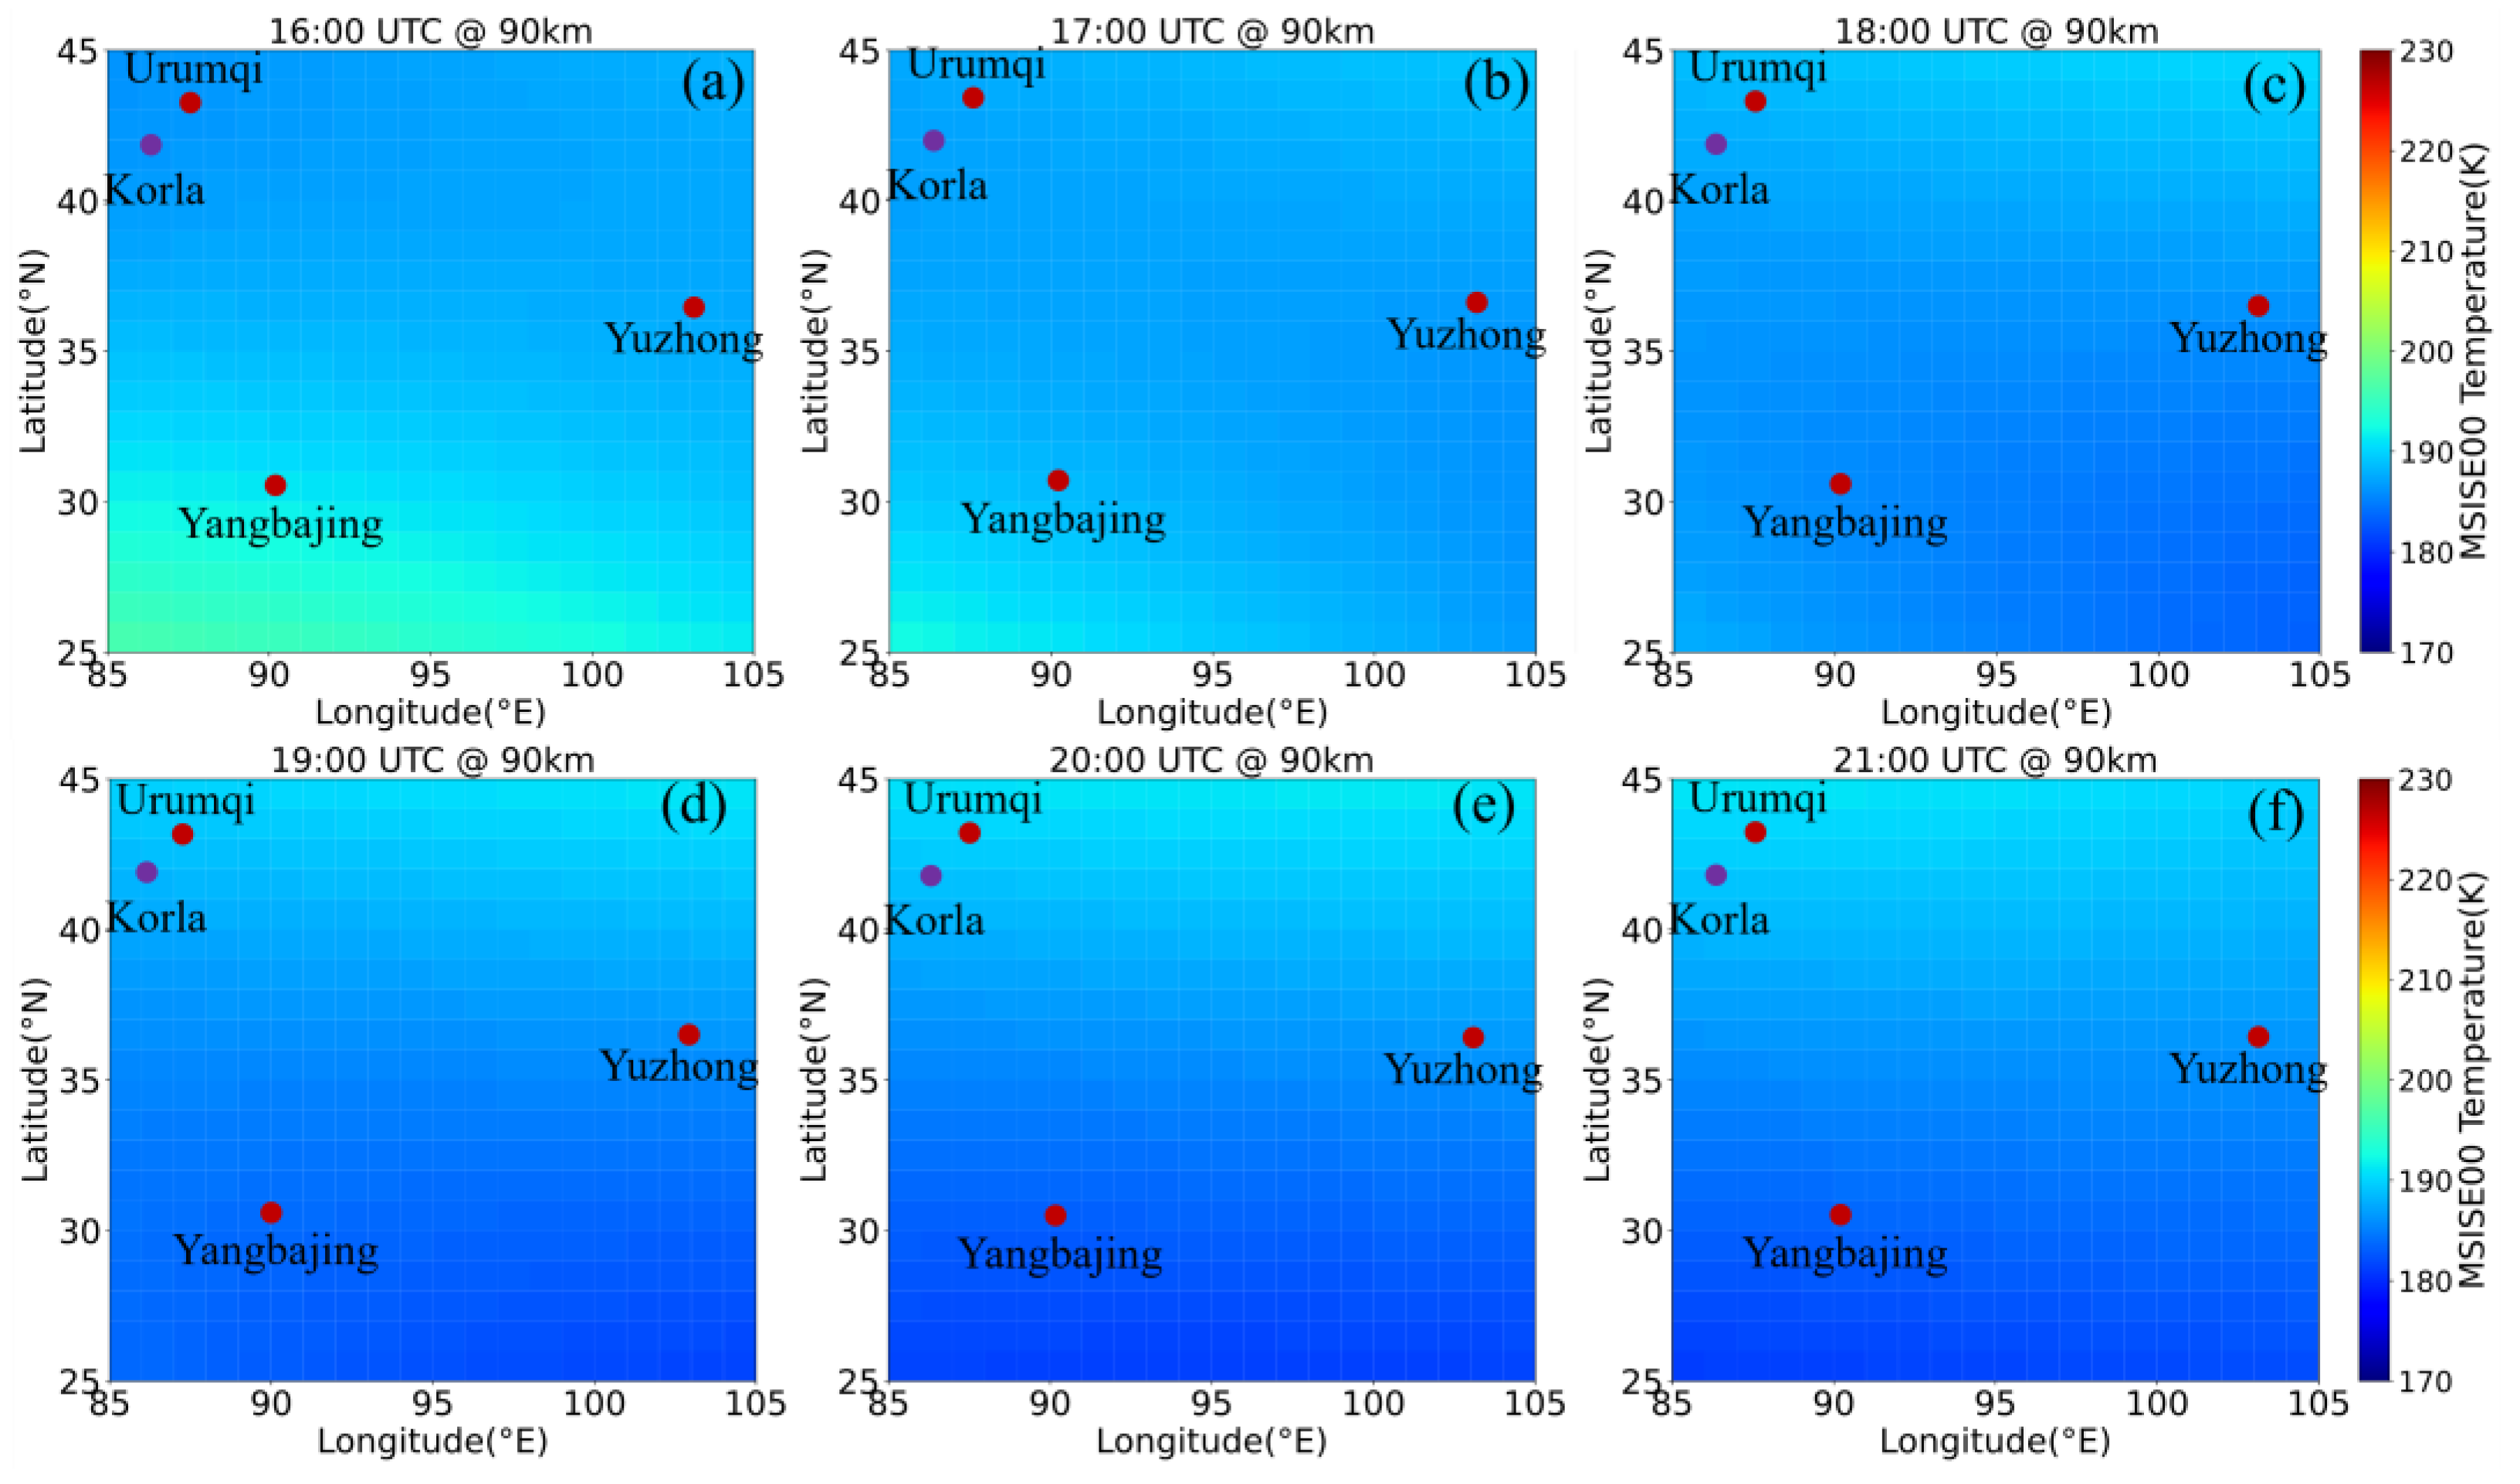
At an altitude of 90 km, the temperature gradient is more pronounced compared to 85 km. A significant temperature increase is observed at 18:00 UTC (Figure 7c), with a localized high-temperature region emerging in the northwestern area (85° E to 95° E, 38° N to 45° N), where the peak temperature reaches 230 K. As the peak temperature gradually decreases (Figure 7d). By 21:00 UTC (Figure 7f), the temperature distribution becomes more uniform, ranging from 180 K to 200 K. This phenomenon may be attributed to the advection effect of the background meridional wind or the horizontal phase propagation of atmospheric tides. Furthermore, the results obtained in this study reveal significant differences in horizontal temperature structures, which are more pronounced than those depicted by the MSISE-00 model (Figure 8). The horizontal temperature gradient in the MSISE-00 model is relatively small and exhibits gradual changes over time. In contrast, the lidar-based model demonstrates a larger horizontal gradient with more rapid variations. Similar differences are also observed at other altitudes.
At 95 km altitude, the temperature gradually increased over the northwestern region (85° E–95° E, 35° N–45° N), accompanied by a gradual intensification of the horizontal temperature gradient (Figure 9a–e). By 21:00 UTC (Figure 9f), the temperature peak in this region reached 220 K, with the overall temperature range expanding to 170–220 K. Notably, the spatial extent of the warming area at 95 km partially overlapped with the high-temperature region observed at 90 km (Figure 7c–e). However, the peak temperature at 95 km (220 K) exhibited a 3-h lag compared to the 230 K maximum recorded at 90 km at 18:00 UTC. This delayed response coincided with a progressive enhancement of the temperature gradient at 95 km throughout the observation window. This is consistent with the upward propagation characteristics of the semidiurnal tide (S2) mode, which may be attributed to the vertical phase lag of temperature perturbations [38].

4. Conclusions

This study constructs a lidar-based model for mesopause temperature over northwestern China using a three-dimensional variational (3DVAR) data assimilation method, based on observations from a lidar network consisting of the Urumqi, Yuzhong, and Yangbajing stations. A comparative analysis of MSISE-00 and lidar-based model data demonstrates that the assimilated temperature profiles show improved agreement with lidar observations at all stations compared to the MSISE-00 model. Independent validation results demonstrate that the observation residuals of the new observational model are smaller than those of the MSISE-00 model.
The lidar-based model for mesopause extends the observation results from disparate lidar stations to the area between lidar stations, and enables a comprehensive investigation of the thermodynamic horizontal structure of mesopause. The thermodynamical horizontal structures of mesopause obtained from this model were also analyzed. This study will enhance the applicability of mesopause lidar networks and contribute to a deeper understanding of upper atmospheric dynamics.

Supplementary Materials

The base map of Figure 2 (lidar station distribution), excluding station markers and inter-station distances, is available at: http://bzdt.ch.mnr.gov.cn/ (accessed on 24 May 2024).

Author Contributions

Conceptualization, L.R. and Y.Y.; methodology, L.R. and F.L.; software, L.R.; validation, L.R., Y.Y. and X.C.; formal analysis, L.R., Y.Y. and X.L.; investigation, L.R. and X.L.; resources, Y.Y., L.L., J.Z., W.W., J.L., Y.X., J.W., K.J. and X.C.; data curation, L.R. and Y.X.; writing—original draft, L.R. and K.J.; writing—review and editing, L.R., Y.Y., X.L., W.W., J.L., Y.X., J.W., Z.C., Y.Z., X.C. and F.L.; visualization, L.R., J.L., Z.C. and X.C.; supervision, Y.Y. and F.L.; project administration, L.L. and F.L.; funding acquisition, Y.Y. and F.L.; All authors have read and agreed to the published version of the manuscript.

Funding

This study was funded by the B-type Strategic Priority Program of CAS (XDB0780000), the National Key Research and Development Program of China (2022YFC2807201), and the National Natural Science Foundation of China (42305152, 41827801).

Institutional Review Board Statement

Not applicable.

Informed Consent Statement

Not applicable.

Data Availability Statement

The original contributions presented in this study are included in the article/Supplementary Material. Further inquiries can be directed to the corresponding author(s).

Acknowledgments

This work was supported by the Chinese Meridian Project (CMP). The authors acknowledge the use of lidar data from the CMP. We also appreciate the technical and logistical support from the project team, which has been invaluable in facilitating our data collection and analysis.

Conflicts of Interest

The authors declare no conflicts of interest.

References

  1. Daren, L.; Fan, Y.; Jiyao, X. Advances in studies of the middle and upper atmosphere and their coupling with the lower atmosphere. Adv. Atmos. Sci. 2004, 21, 361–368. [Google Scholar] [CrossRef]
  2. Smith, A.K. Global Dynamics of the MLT. Surv. Geophys. 2012, 33, 1177–1230. [Google Scholar] [CrossRef]
  3. Fritts, D.C.; Alexander, M.J. Gravity wave dynamics and effects in the middle atmosphere. Rev. Geophys. 2003, 41. [Google Scholar] [CrossRef]
  4. Vincent, R.A. The dynamics of the mesosphere and lower thermosphere: A brief review. Prog. Earth Planet. Sci. 2015, 2, 4. [Google Scholar] [CrossRef]
  5. Yi, W.; Xue, X.; Reid, I.M.; Murphy, D.J.; Hall, C.M.; Tsutsumi, M.; Ning, B.; Li, G.; Vincent, R.A.; Chen, J.; et al. Climatology of the mesopause relative density using a global distribution of meteor radars. Atmos. Chem. Phys. 2019, 19, 7567–7581. [Google Scholar] [CrossRef]
  6. Xu, J.; Liu, H.L.; Yuan, W.; Smith, A.K.; Roble, R.G.; Mertens, C.J.; Russell, J.M.; Mlynczak, M.G. Mesopause structure from Thermosphere, Ionosphere, Mesosphere, Energetics, and Dynamics (TIMED)/Sounding of the Atmosphere Using Broadband Emission Radiometry (SABER) observations. J. Geophys. Res. Atmos. 2007, 112, D09102. [Google Scholar] [CrossRef]
  7. Gardner, C.S. Sodium resonance fluorescence lidar applications in atmospheric science and astronomy. Proc. IEEE 1989, 77, 408–418. [Google Scholar] [CrossRef]
  8. Alpers, M.; Eixmann, R.; Fricke-Begemann, C.; Gerding, M.; Hoeffner, J. Temperature lidar measurements from 1 to 105 km altitude using resonance, Rayleigh, and Rotational Raman scattering. Atmos. Chem. Phys. 2004, 4, 793. [Google Scholar]
  9. Arnold, K.S.; She, C.Y. Metal fluorescence lidar (light detection and ranging) and the middle atmosphere. Contemp. Phys. 2003, 44, 35–49. [Google Scholar] [CrossRef]
  10. Cheng, X.; Gong, S.; Li, F.; Dai, Y.; Song, J.; Wang, J.; Li, F. 24 h continuous observation of sodium layer over Wuhan by lidar. Sci. China Ser. G Phys. Mech. Astron. 2007, 50, 287–293. [Google Scholar] [CrossRef]
  11. She, C.Y.; Sherman, J.; Yuan, T.; Williams, B.P.; Arnold, K.; Kawahara, T.D.; Li, T.; Xu, L.F.; Vance, J.D.; Acott, P.; et al. The first 80-hour continuous lidar campaign for simultaneous observation of mesopause region temperature and wind. Geophys. Res. Lett. 2003, 30. [Google Scholar] [CrossRef]
  12. Chane-Ming, F.; Molinaro, F.; Leveau, J.; Keckhut, P.; Hauchecorne, A. Analysis of gravity waves in the tropical middle atmosphere over La Reunion Island (21°S, 55°E) with lidar using wavelet techniques. Ann. Geophys. 2000, 18, 485–498. [Google Scholar] [CrossRef]
  13. Chanin, M.L.; Hauchecorne, A. Lidar observation of gravity and tidal waves in the stratosphere and mesosphere. J. Geophys. Res. Ocean. 1981, 86, 9715–9721. [Google Scholar] [CrossRef]
  14. Collins, R.L.; Senft, D.C.; Gardner, C.S. Lidar measurements of the middle atmosphere at South Pole. Rev. Can. Phys. 1991, 69, 1076–1086. [Google Scholar] [CrossRef]
  15. Gardner, C.S.; Voelz, D.G.; Sechrist, C.F.; Segal, A.C. Lidar studies of the nighttime sodium layer over Urbana, Illinois: 1. Seasonal and nocturnal variations. J. Geophys. Res. Space Phys. 1986, 91, 13659–13673. [Google Scholar] [CrossRef]
  16. Gardner, C.S.; Kane, T.J.; Hecht, J.H.; Walterscheid, R.L.; Yee, J.H.; Niciejewski, R.J.; Lowe, R.P.; Turnbull, D.N. Formation characteristics of sporadic Na layers observed simultaneously by lidar and airglow instruments during ALOHA-90. Geophys. Res. Lett. 1991, 18, 1369–1372. [Google Scholar] [CrossRef]
  17. Chau, J.L.; Urco, J.M.; Vierinen, J.P.; Volz, R.A.; Clahsen, M.; Pfeffer, N.; Trautner, J. Novel specular meteor radar systems using coherent MIMO techniques to study the mesosphere and lower thermosphere. Atmos. Meas. Tech. 2019, 12, 2113–2127. [Google Scholar] [CrossRef]
  18. Zherebtsov, G.A.; Chaikovsky, A.; Ivanov, A.; Balin, Y.; Elnikov, A.; Tulinov, G.; Plusnin, I.; Bukin, O.; Chen, B.; Matvienko, G.G. Lidar network CIS-LiNet for monitoring aerosol and ozone in CIS regions. In Proceedings of the Twelfth Joint International Symposium on Atmospheric and Ocean Optics/Atmospheric Physics, Tomsk, Russia, 27–30 June 2005; pp. 833–841. [Google Scholar]
  19. Sugimoto, N.; Matsui, I.; Shimizu, A.; Nishizawa, T. Lidar Network for Monitoring Asian Dust and Air Pollution Aerosols. In Proceedings of the IGARSS 2008, Boston, MA, USA, 7–11 July 2008; Volume 2, p. II-573. [Google Scholar] [CrossRef]
  20. Huang, Z.; Dong, Q.; Chen, B.; Wang, T.; Bi, J.; Zhou, T.; Alam, K.; Shi, J.; Zhang, S. Method for retrieving range-resolved aerosol microphysical properties from polarization lidar measurements. Opt. Express 2023, 31, 7599–7616. [Google Scholar] [CrossRef]
  21. Wang, C. Development of the Chinese Meridian Project. Chin. J. Space Sci. 2010, 30, 382–384. [Google Scholar] [CrossRef]
  22. Wang, C.; Chen, Z.; Xu, J. Introduction to Chinese Meridian Project-Phase II. Chin. J. Space Sci. 2020, 40, 718–722. [Google Scholar] [CrossRef]
  23. Yang, Y.; Li, F.; Cheng, X.; Yang, G.; Lyu, D.; Lin, X.; Liu, L.; Fang, X.; Zheng, J.; Du, L.; et al. Lidar Network for Temperature and Wind Measurements in the Mesosphere and Lower Thermosphere Region. Space Weather 2024, 22, e2024SW003981. [Google Scholar] [CrossRef]
  24. Li, T.; Ban, C.; Fang, X.; Li, J.; Wu, Z.; Feng, W.; Plane, J.M.C.; Xiong, J.; Marsh, D.R.; Mills, M.J.; et al. Climatology of mesopause region nocturnal temperature, zonal wind and sodium density observed by sodium lidar over Hefei, China (32° N, 117° E). Atmos. Chem. Phys. 2018, 18, 11683–11695. [Google Scholar] [CrossRef]
  25. Gelaro, R.; McCarty, W.; Suarez, M.J.; Todling, R.; Molod, A.; Takacs, L.; Randles, C.; Darmenov, A.; Bosilovich, M.G.; Reichle, R.; et al. The Modern-Era Retrospective Analysis for Research and Applications, Version 2 (MERRA-2). J. Clim. 2017, 30, 5419–5454. [Google Scholar] [CrossRef] [PubMed]
  26. Lorenc, A.C. Analysis methods for numerical weather prediction. Q. J. R. Meteorol. Soc. 1986, 112, 1177–1194. [Google Scholar] [CrossRef]
  27. Courtier, P.; Thépaut, J.N.; Hollingsworth, A. A strategy for operational implementation of 4D-Var, using an incremental approach. Q. J. R. Meteorol. Soc. 1994, 120, 1367–1387. [Google Scholar] [CrossRef]
  28. Parrish, D.F.; Derber, J.C. The National Meteorological Center’s Spectral Statistical-Interpolation Analysis System. Mon. Weather Rev. 1992, 120, 1747–1763. [Google Scholar] [CrossRef]
  29. Chao, Y.; Li, Z.; McWilliams, J.C.; Ide, K. A Three-Dimensional Variational Data Assimilation Scheme for the Regional Ocean Modeling System. J. Atmos. Ocean. Technol. 2008, 25, 2074–2090. [Google Scholar] [CrossRef]
  30. Wang, D.; You, W.; Zang, Z.; Pan, X.; He, H.; Liang, Y. A three-dimensional variational data assimilation system for a size-resolved aerosol model: Implementation and application for particulate matter and gaseous pollutant forecasts across China. Sci. China Earth Sci. 2020, 63, 1366–1380. [Google Scholar] [CrossRef]
  31. Lahoz, W.A.; Errera, Q.; Swinbank, R.; Fonteyn, D. Data assimilation of stratospheric constituents: A review. Atmos. Chem. Phys. 2007, 7, 5745–5773. [Google Scholar] [CrossRef]
  32. Pfrommer, T.; Hickson, P.; She, C.Y. A large-aperture sodium fluorescence lidar with very high resolution for mesopause dynamics and adaptive optics studies. Geophys. Res. Lett. 2009, 36, L15831. [Google Scholar] [CrossRef]
  33. Cheng, X.; Liu, Y.; Xu, X.; You, W.; Zang, Z.; Gao, L.; Chen, Y.; Su, D.; Yan, P. Lidar data assimilation method based on CRTM and WRF-Chem models and its application in PM2.5 forecasts in Beijing. Sci. Total Environ. 2019, 682, 541–552. [Google Scholar] [CrossRef] [PubMed]
  34. Talagrand, O. Assimilation of Observations, an Introduction. J. Meteorol. Soc. Jpn. 1997, 75, 191–209. [Google Scholar] [CrossRef]
  35. Vadas, S.L.; Fritts, D.C. Thermospheric responses to gravity waves: Influences of increasing viscosity and thermal diffusivity. J. Geophys. Res. Atmos. 2005, 110, D15103. [Google Scholar] [CrossRef]
  36. Clemesha, B.; Simonich, D.; Batista, P. Mesopause region temperature structure observed by sodium resonance lidar. J. Atmos. Sol. Terr. Phys. 2010, 72, 740–744. [Google Scholar] [CrossRef]
  37. Becker, E. Dynamical Control of the Middle Atmosphere. Space Sci. Rev. 2011, 168, 283–314. [Google Scholar] [CrossRef]
  38. Forbes, J.M. Tidal and Planetary Waves. In The Upper Mesosphere and Lower Thermosphere: A Review of Experiment and Theory; Geophysical Monograph Series; American Geophysical Union: Washington, DC, USA, 1995; pp. 67–87. [Google Scholar] [CrossRef]
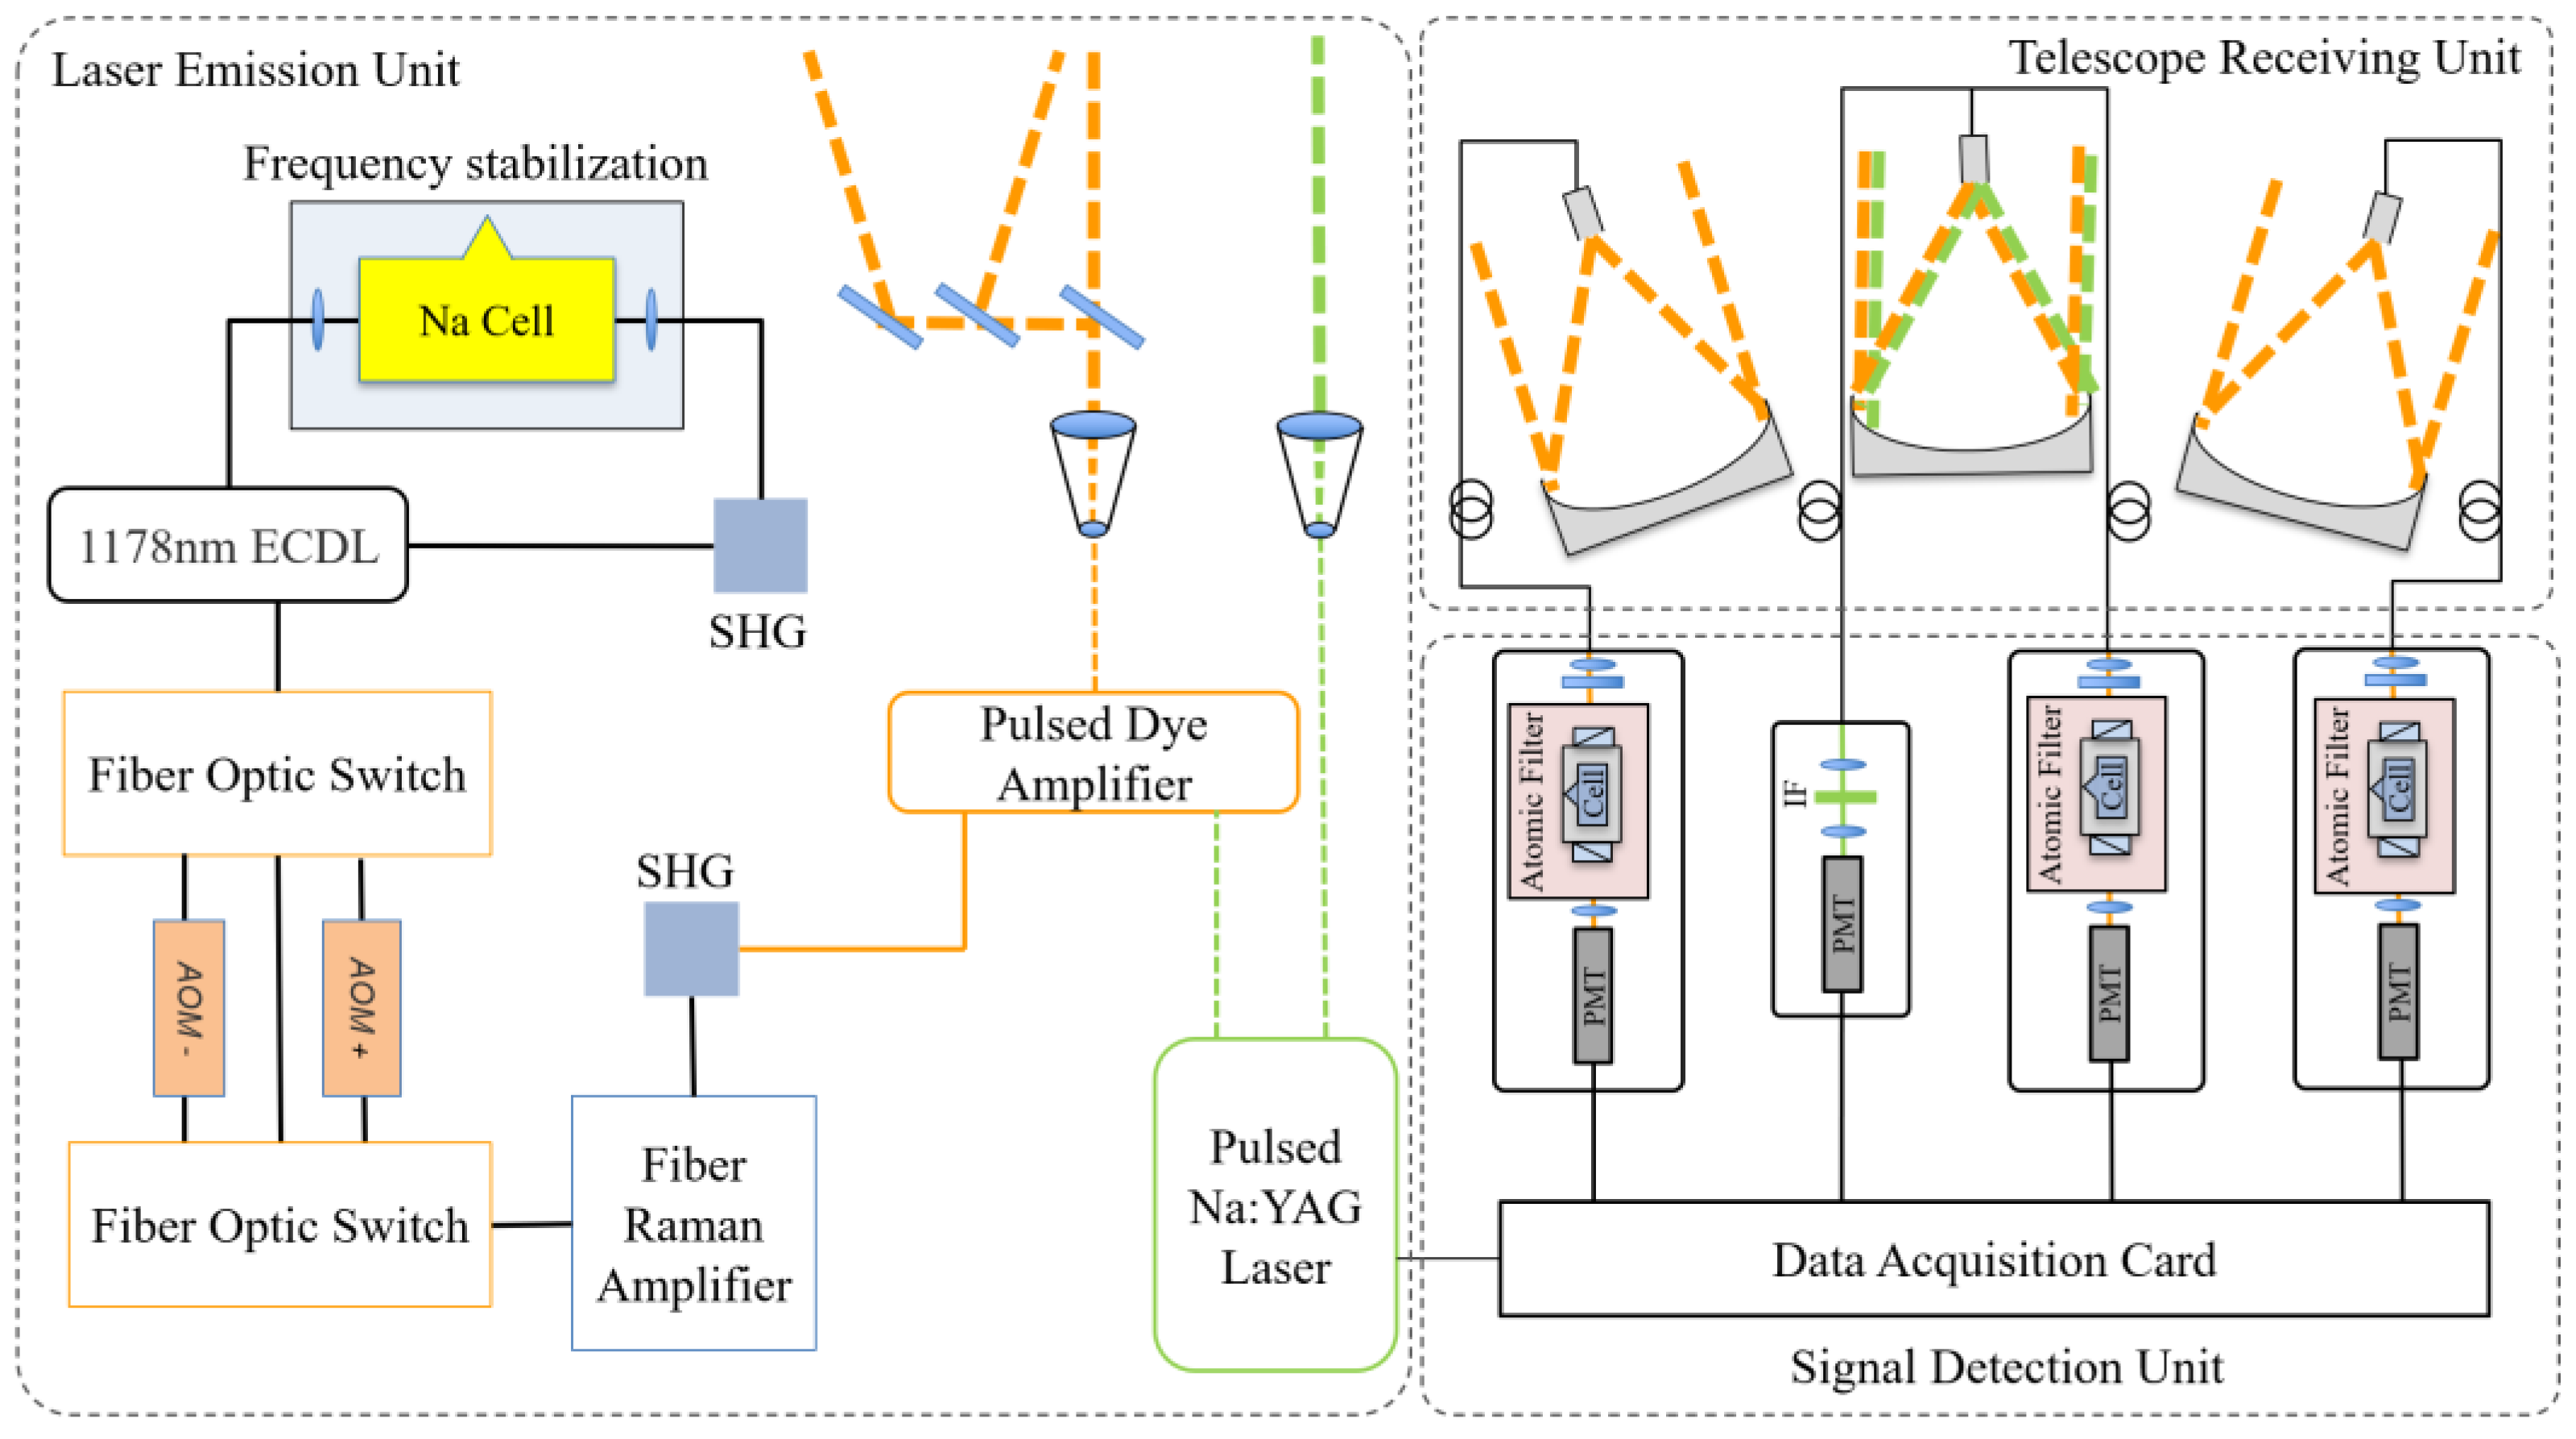
Figure 1. Schematic diagram of the lidar system.
Atmosphere 16 00401 g001
Figure 2. Lidar station distribution map.
Atmosphere 16 00401 g002
Figure 3. Temporal evolution of atmospheric parameters from 13:30 to 23:30 (UTC) on 10 January 2024, at (a) Urumqi, (b) Yuzhong, and (c) Yangbajing stations.
Atmosphere 16 00401 g003
Figure 4. Comparison of observational data before and after data assimilation at 18:00–19:00 UTC on 10 January 2024: (a) Urumqi; (b) Yuzhong; (c) Yangbajing.
Atmosphere 16 00401 g004
Figure 5. Validation of assimilated data using lidar observations at the Korla station at (a) 17:00 UTC, (b) 18:00 UTC, and (c) 19:00 UTC.
Atmosphere 16 00401 g005
Figure 6. Lidar-based model temperature evolution at 85 km. Subfigures (af) show temperature maps at 16:00, 17:00, 18:00, 19:00, 20:00, and 21:00 respectively.
Atmosphere 16 00401 g006
Figure 7. Lidar-based model temperature evolution at 90 km. Subfigures (af) show temperature maps at 16:00, 17:00, 18:00, 19:00, 20:00, and 21:00 respectively.
Atmosphere 16 00401 g007
Figure 8. MSISE-00 temperature evolution at 90 km. Subfigures (af) show temperature maps at 16:00, 17:00, 18:00, 19:00, 20:00, and 21:00 respectively.
Atmosphere 16 00401 g008
Figure 9. Lidar-based model temperature evolution at 95 km. Subfigures (af) show temperature maps at 16:00, 17:00, 18:00, 19:00, 20:00, and 21:00 respectively.
Atmosphere 16 00401 g009
Table 1. Station information.
UrumqiYuzhongYangbajing
Longitude87.10° E104.15° E90.50° E
Latitude43.28° N35.95° N30.10° N
Altitude2080 m1965 m4287 m
Wavelength589 nm, 532 nm589 nm, 532 nm589 nm, 532 nm
Temporal Resolution1 min1 min1 min
Spatial Resolution30.72 m30.72 m30.72 m
Table 2. RMSE of residuals between MSISE-00, the lidar-based model (3DVAR) for the mesopause, and lidar observational results.
16:00–17:0017:00–18:0018:00–19:0019:00–20:0020:00–21:0021:00–22:00Average
UrumqiMSISE-Lidar(K)26.1226.5524.4125.1224.8527.3025.73
3DVAR-Lidar(K)12.0013.823.885.076.838.828.40
YuzhongMSISE-Lidar(K)18.1817.1917.8116.4020.9722.8618.90
3DVAR-Lidar(K)5.722.576.067.1911.9211.127.43
YangbajingMSISE-Lidar(K)3.819.4317.3023.6430.2426.9318.56
3DVAR-Lidar(K)3.775.6111.5714.3319.8217.5112.10
Disclaimer/Publisher’s Note: The statements, opinions and data contained in all publications are solely those of the individual author(s) and contributor(s) and not of MDPI and/or the editor(s). MDPI and/or the editor(s) disclaim responsibility for any injury to people or property resulting from any ideas, methods, instructions or products referred to in the content.