


Refining Drought Assessment: A Multi-Dimensional Analysis of Condition Monitoring Observer Reports in Missouri (2018–2024)


Abstract
1. Introduction
2. Materials and Methods
2.1. Data
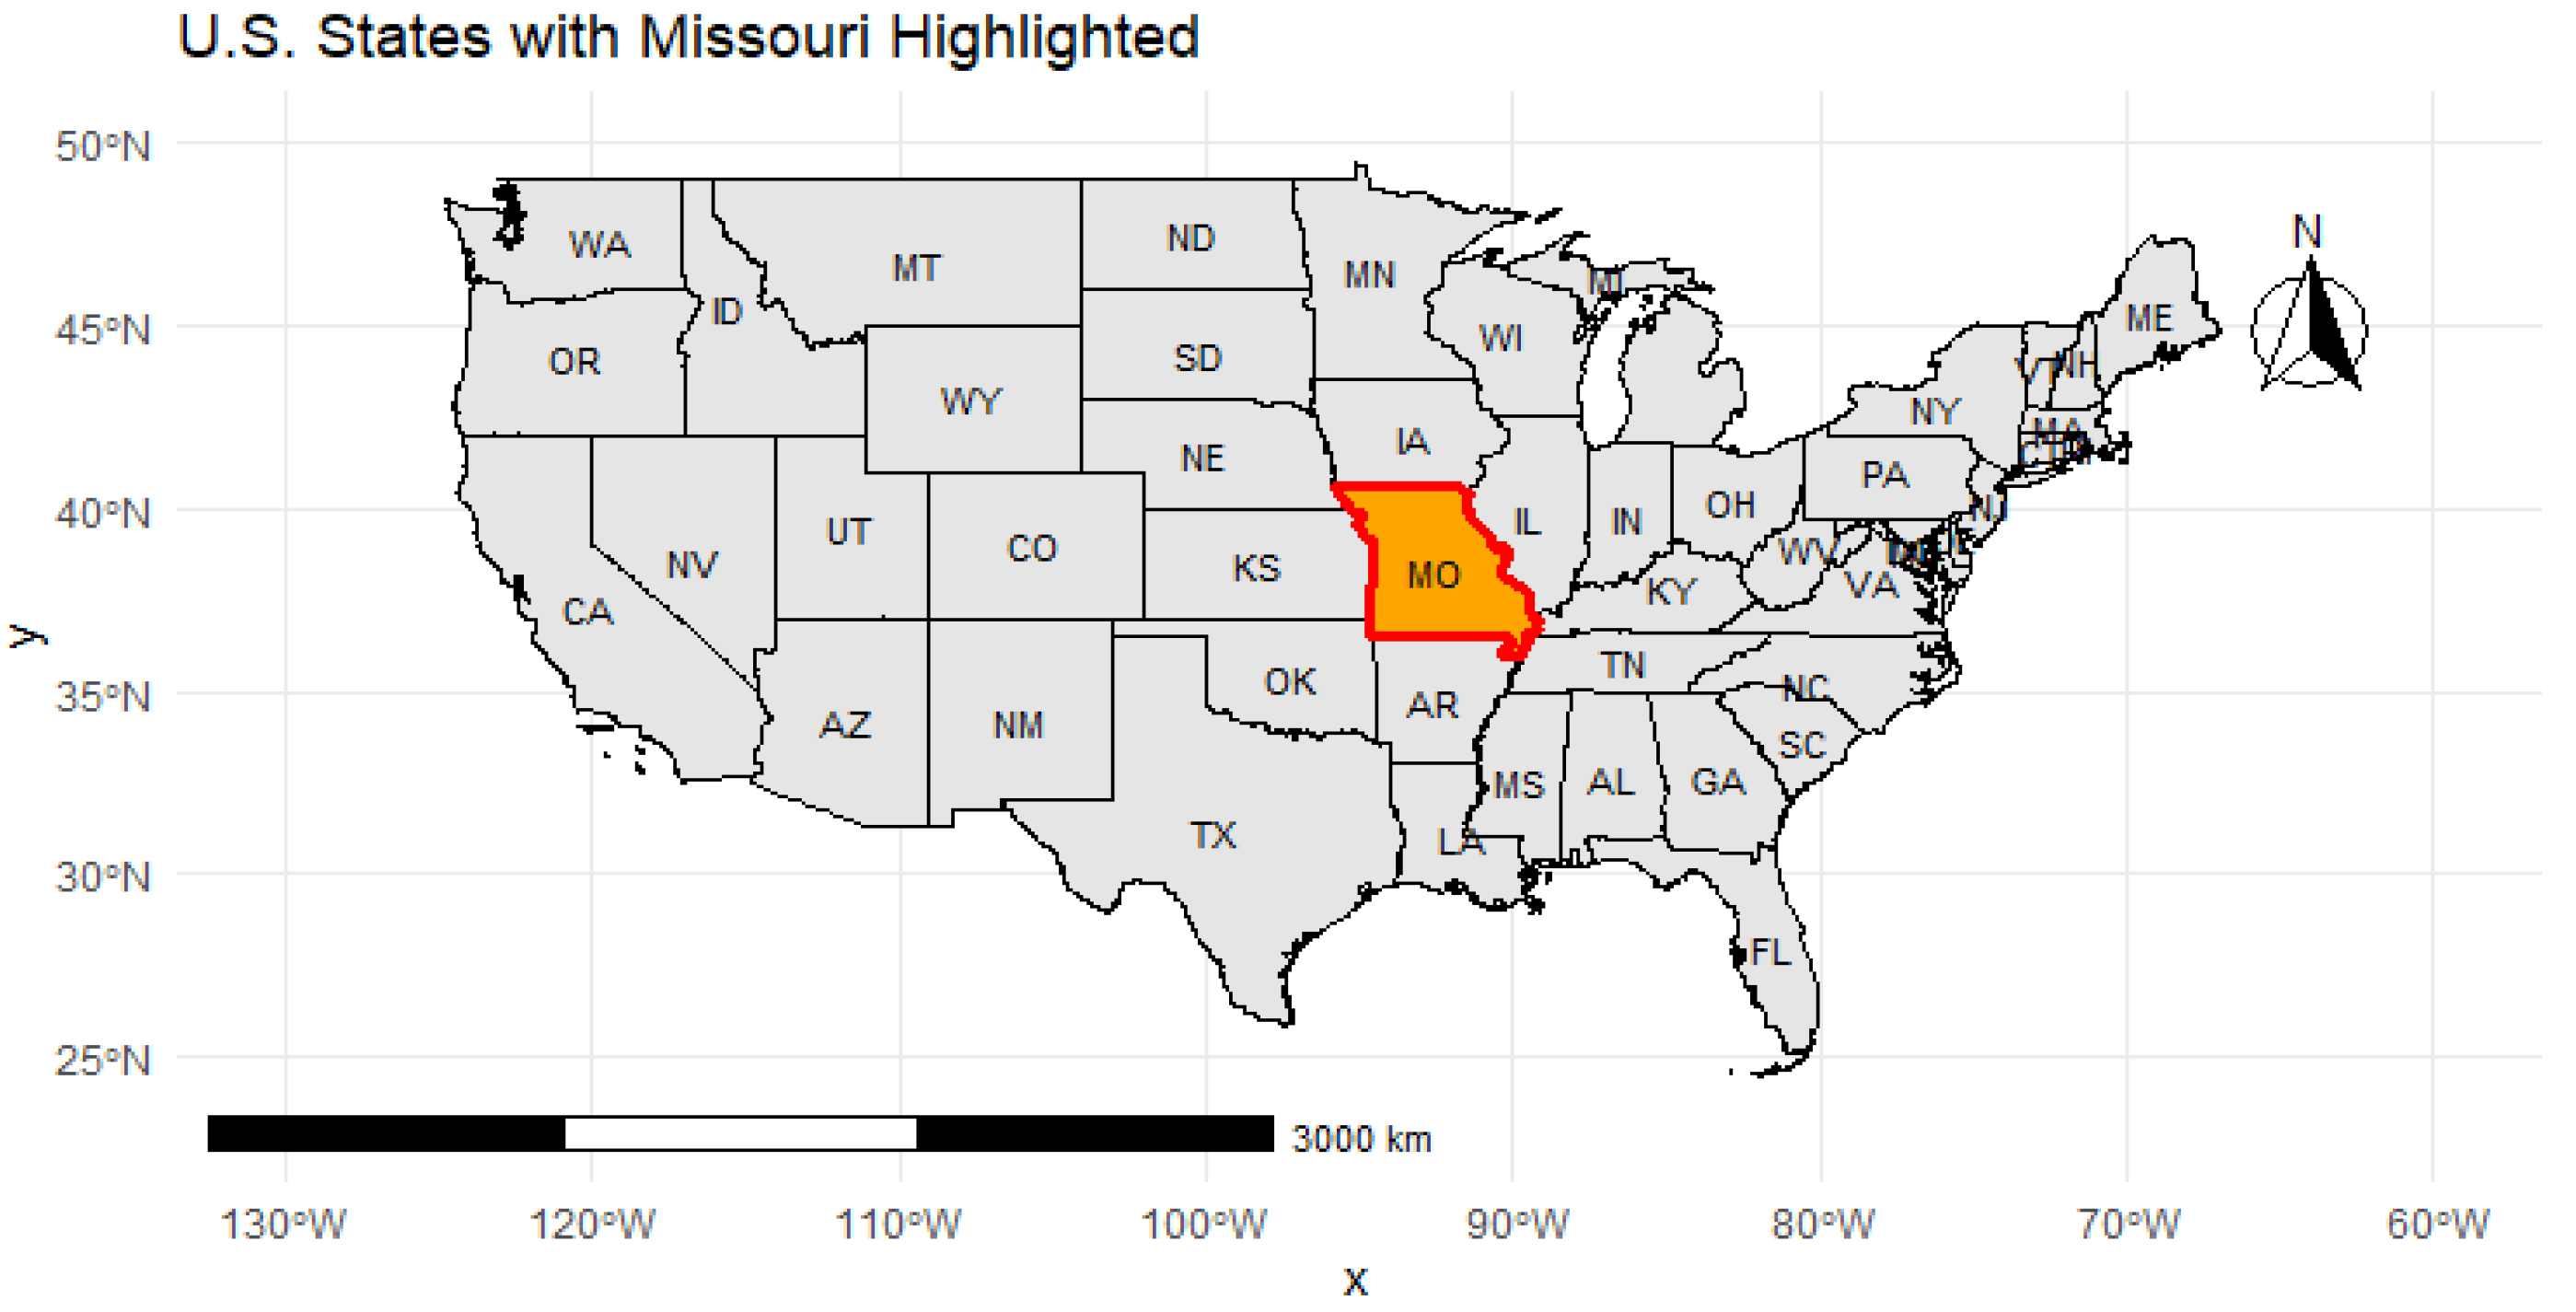
2.2. Study Region
2.3. Methodology
2.3.1. Data Preprocessing
- a.
- Data Cleaning: The preliminary stage focused on data sanitization. Our preprocessing commenced with a meticulous data cleaning phase, essential for ensuring data quality and reliability. The process involved the elimination of duplicate entries, standardization of reporting formats, and remediation of missing values. For instance, missing values were handled using multiple imputations, leveraging patterns within the data to infer plausible values, which enhanced the robustness of subsequent analyses. We established stringent criteria for identifying duplicates, such as identical timestamps and observer reports, which were then purged from the dataset to maintain data integrity.
- b.
- Data Transformation: To facilitate seamless analysis, raw data were transformed using a series of procedures. This included scaling normalization to unify measurement units, data type conversions for compatibility with analysis tools, and restructuring datasets to optimize computational efficiency. For example, narrative text in CMORs was encoded into numerical scales to quantify drought severity levels, enabling statistical analysis.
- c.
- Feature Selection and Engineering: Relevant features were curated based on their significance to drought characteristics and potential for insight. Selection was informed by both statistical measures, like variance inflation factors to detect multicollinearity, and domain expertise to ensure ecological validity. Additionally, new features were engineered, such as drought duration and onset metrics, to capture the temporal aspects of drought phenomena more.
- d.
- Geospatial Data Handling: Integrating geospatial data was pivotal for spatial analysis. We aligned various spatial data sources concerning Missouri’s climate divisions and county boundaries, accounting for discrepancies in projections and coordinate systems. The ‘sf’ package in R was instrumental for this task, enabling the manipulation and transformation of spatial data for congruent overlay onto base maps.
- e.
- Temporal Alignment: Temporal alignment was vital, given the time-series nature of the datasets. We reconciled differing temporal granularities, such as aggregating daily meteorological data into monthly intervals to align with the periodicity of CMORs. This allowed for a harmonized temporal framework, facilitating longitudinal analysis.
- f.
- Quality Assurance Checks: Post-processing, we instituted a regimen of quality assurance checks. These procedures, which included validations against external climatological datasets and spot-checks of processed data, served to confirm the fidelity of the preprocessing steps. Additionally, we employed anomaly detection algorithms to flag and review any irregular data points.
- g.
- Data Integration: The culmination of preprocessing was the integration of disparate datasets into a unified analytical framework. This process entailed merging datasets on common identifiers such as geographic location and time stamps, ensuring a coherent and comprehensive data matrix. Rigorous testing was conducted post-integration to ensure that the merging process did not introduce any distortions or errors.
- h.
- New Integration (Preprocessing and NDI-Blocking Context): A series of preprocessing steps were also undertaken to align CMOR-derived drought types with the NDI-derived severity metrics. The NDI provided essential insights by identifying temporal and spatial anomalies, enriching the overall assessment of drought impacts. Blocking events, known atmospheric precursors to drought, were analyzed by overlaying atmospheric circulation data with NDI-derived drought trends. This integration revealed temporal and spatial correlations between blocking patterns and observed drought severity, providing a critical context for understanding drought formation. These patterns were subsequently incorporated into the categorization framework, adding an atmospheric dimension to the analysis.
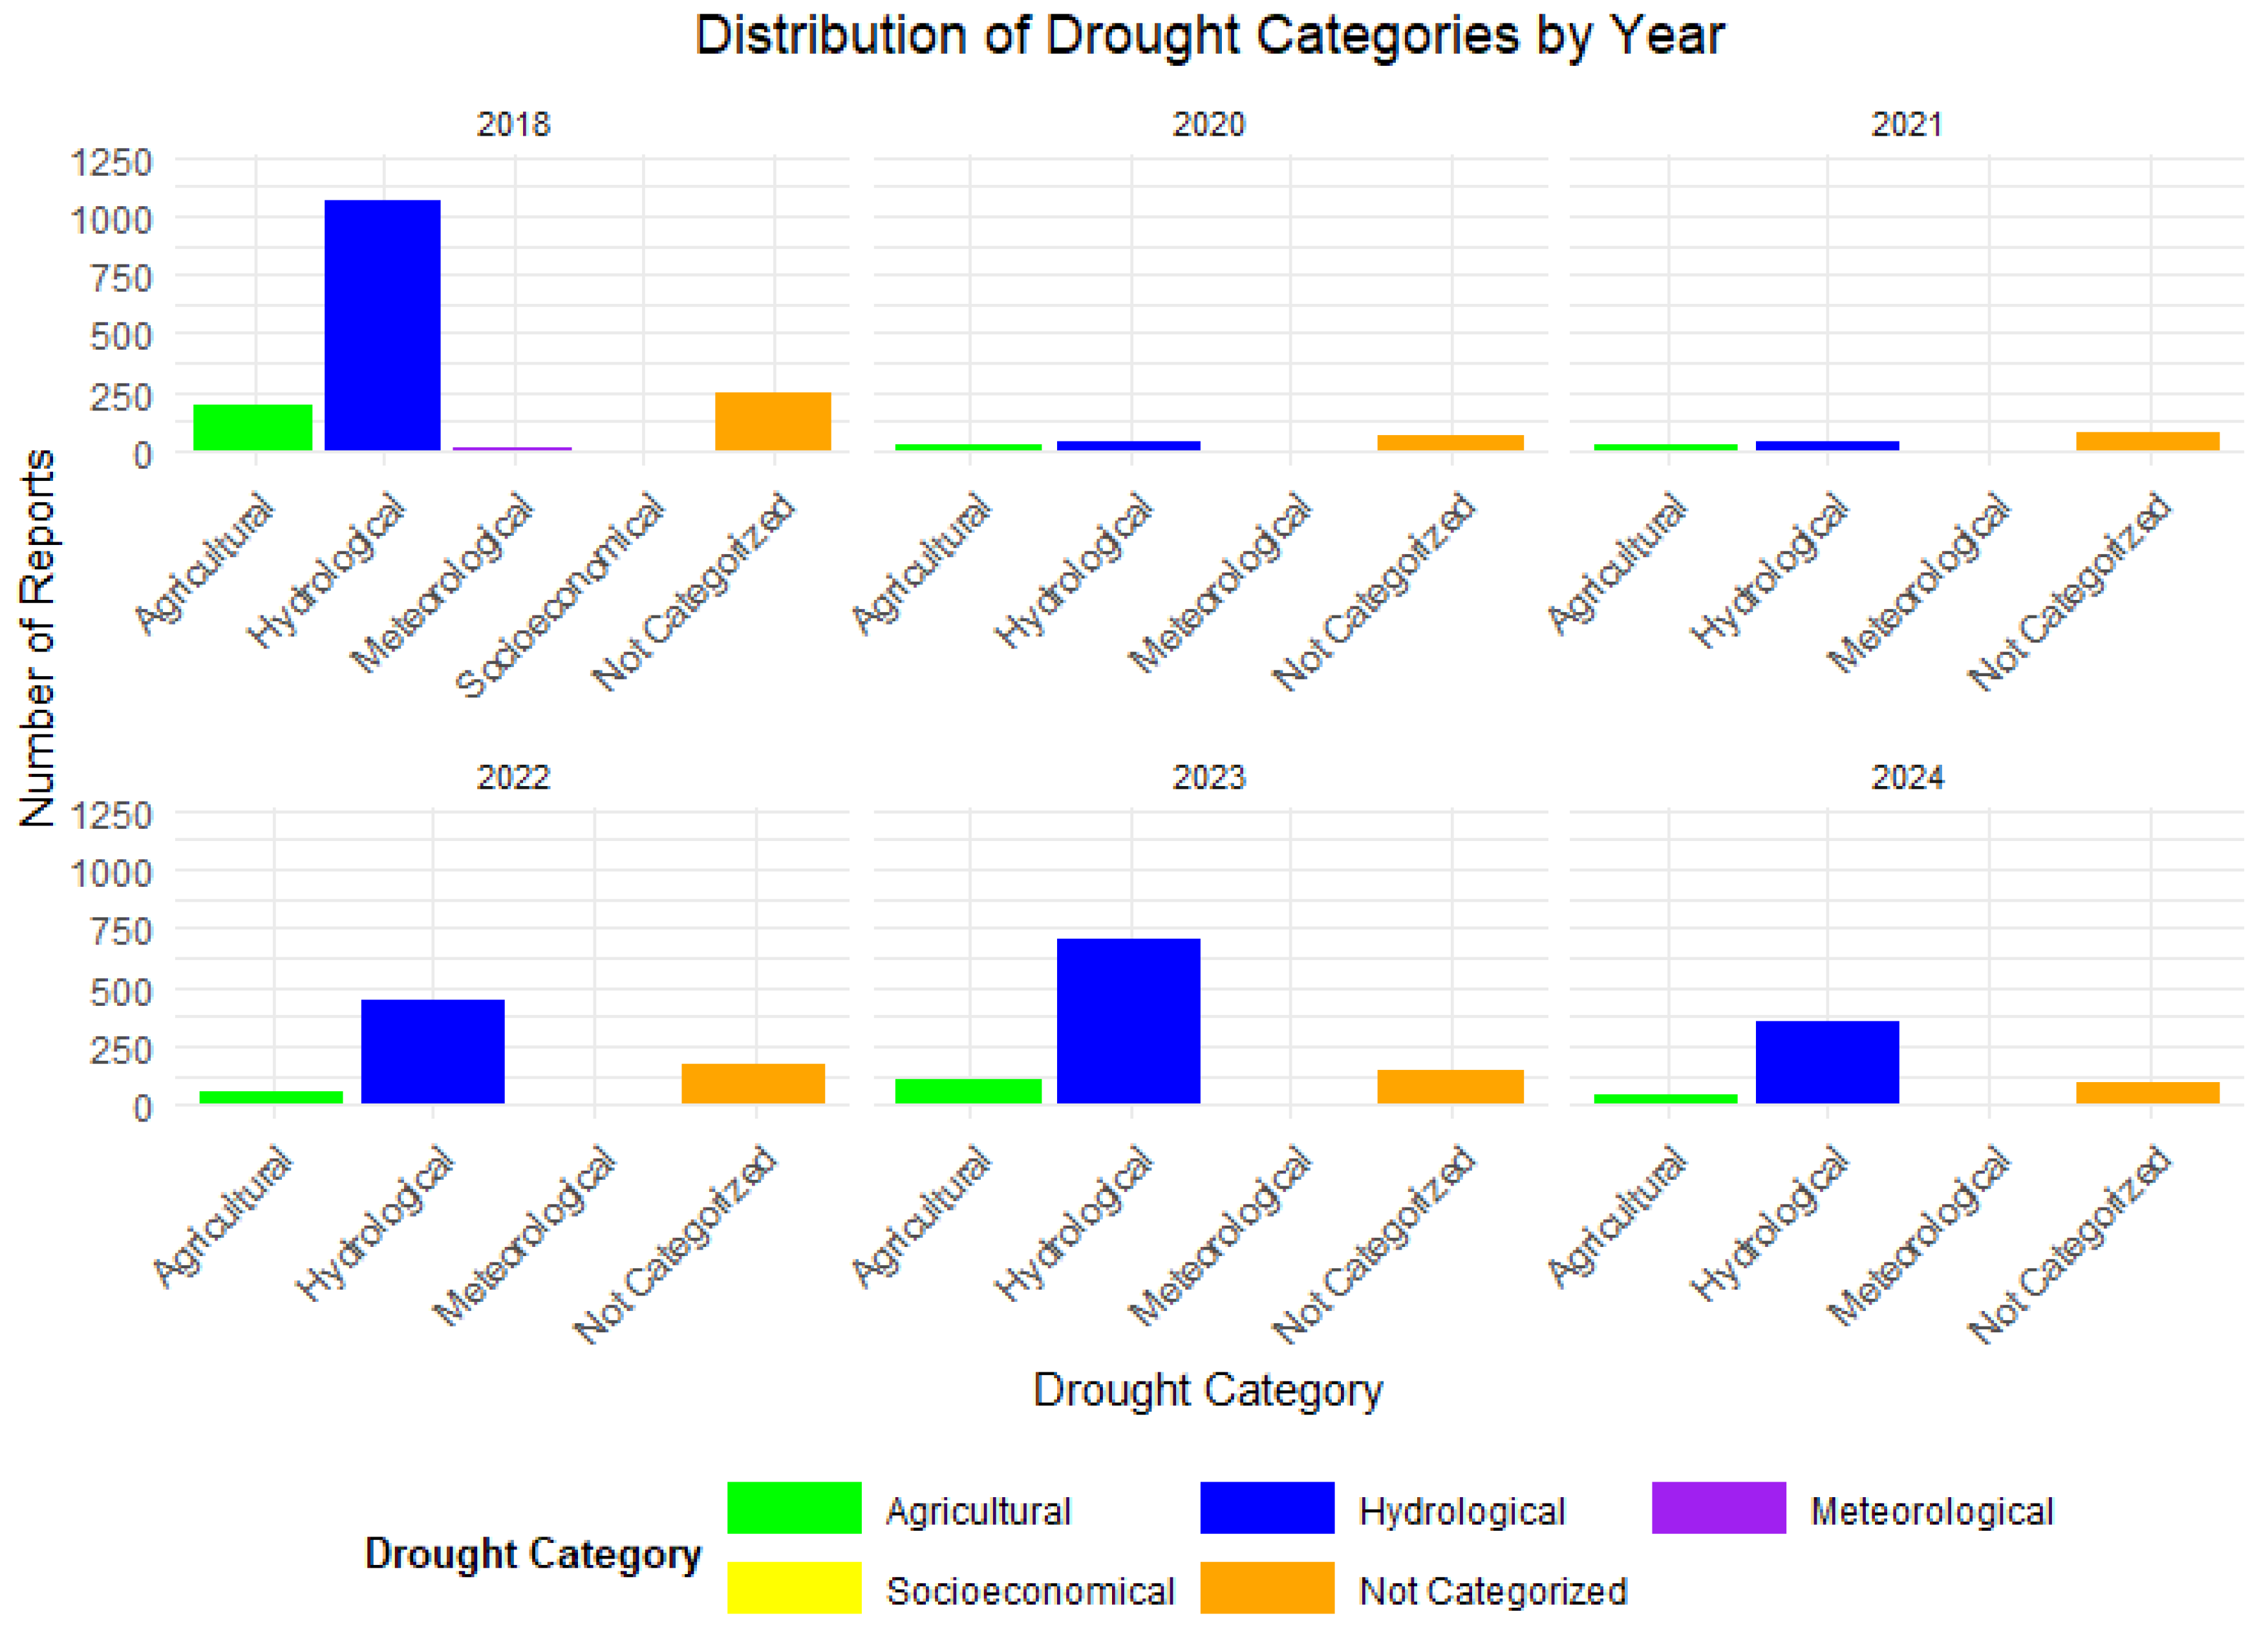
2.3.2. Categorization of Drought Types and Severity
- a.
- Categorization of Drought Type
- Meteorological Drought: low rainfall, dry weather, prolonged dry spells, high temperatures, record low rainfall, drought indices, weather pattern;
- Hydrological Drought: low river, pond, stream, low reservoir levels, decreased water table, dry creek beds, reduced lake capacity, streamflow reduction;
- Agricultural Drought: crop failure, irrigation needed, hay, grass, reduced crop yields, stunted growth, pasture degradation, plant stress, poor soil moisture;
- Economical Drought: economic loss, financial strain, loss of agricultural revenue, higher water costs, business closures, decreased farm profitability, economic downturn;
- Socioeconomical Drought: water restrictions, rationing, community impact, impact on livelihoods, reduced recreational activities, public health concerns, resource rationing.
- b.
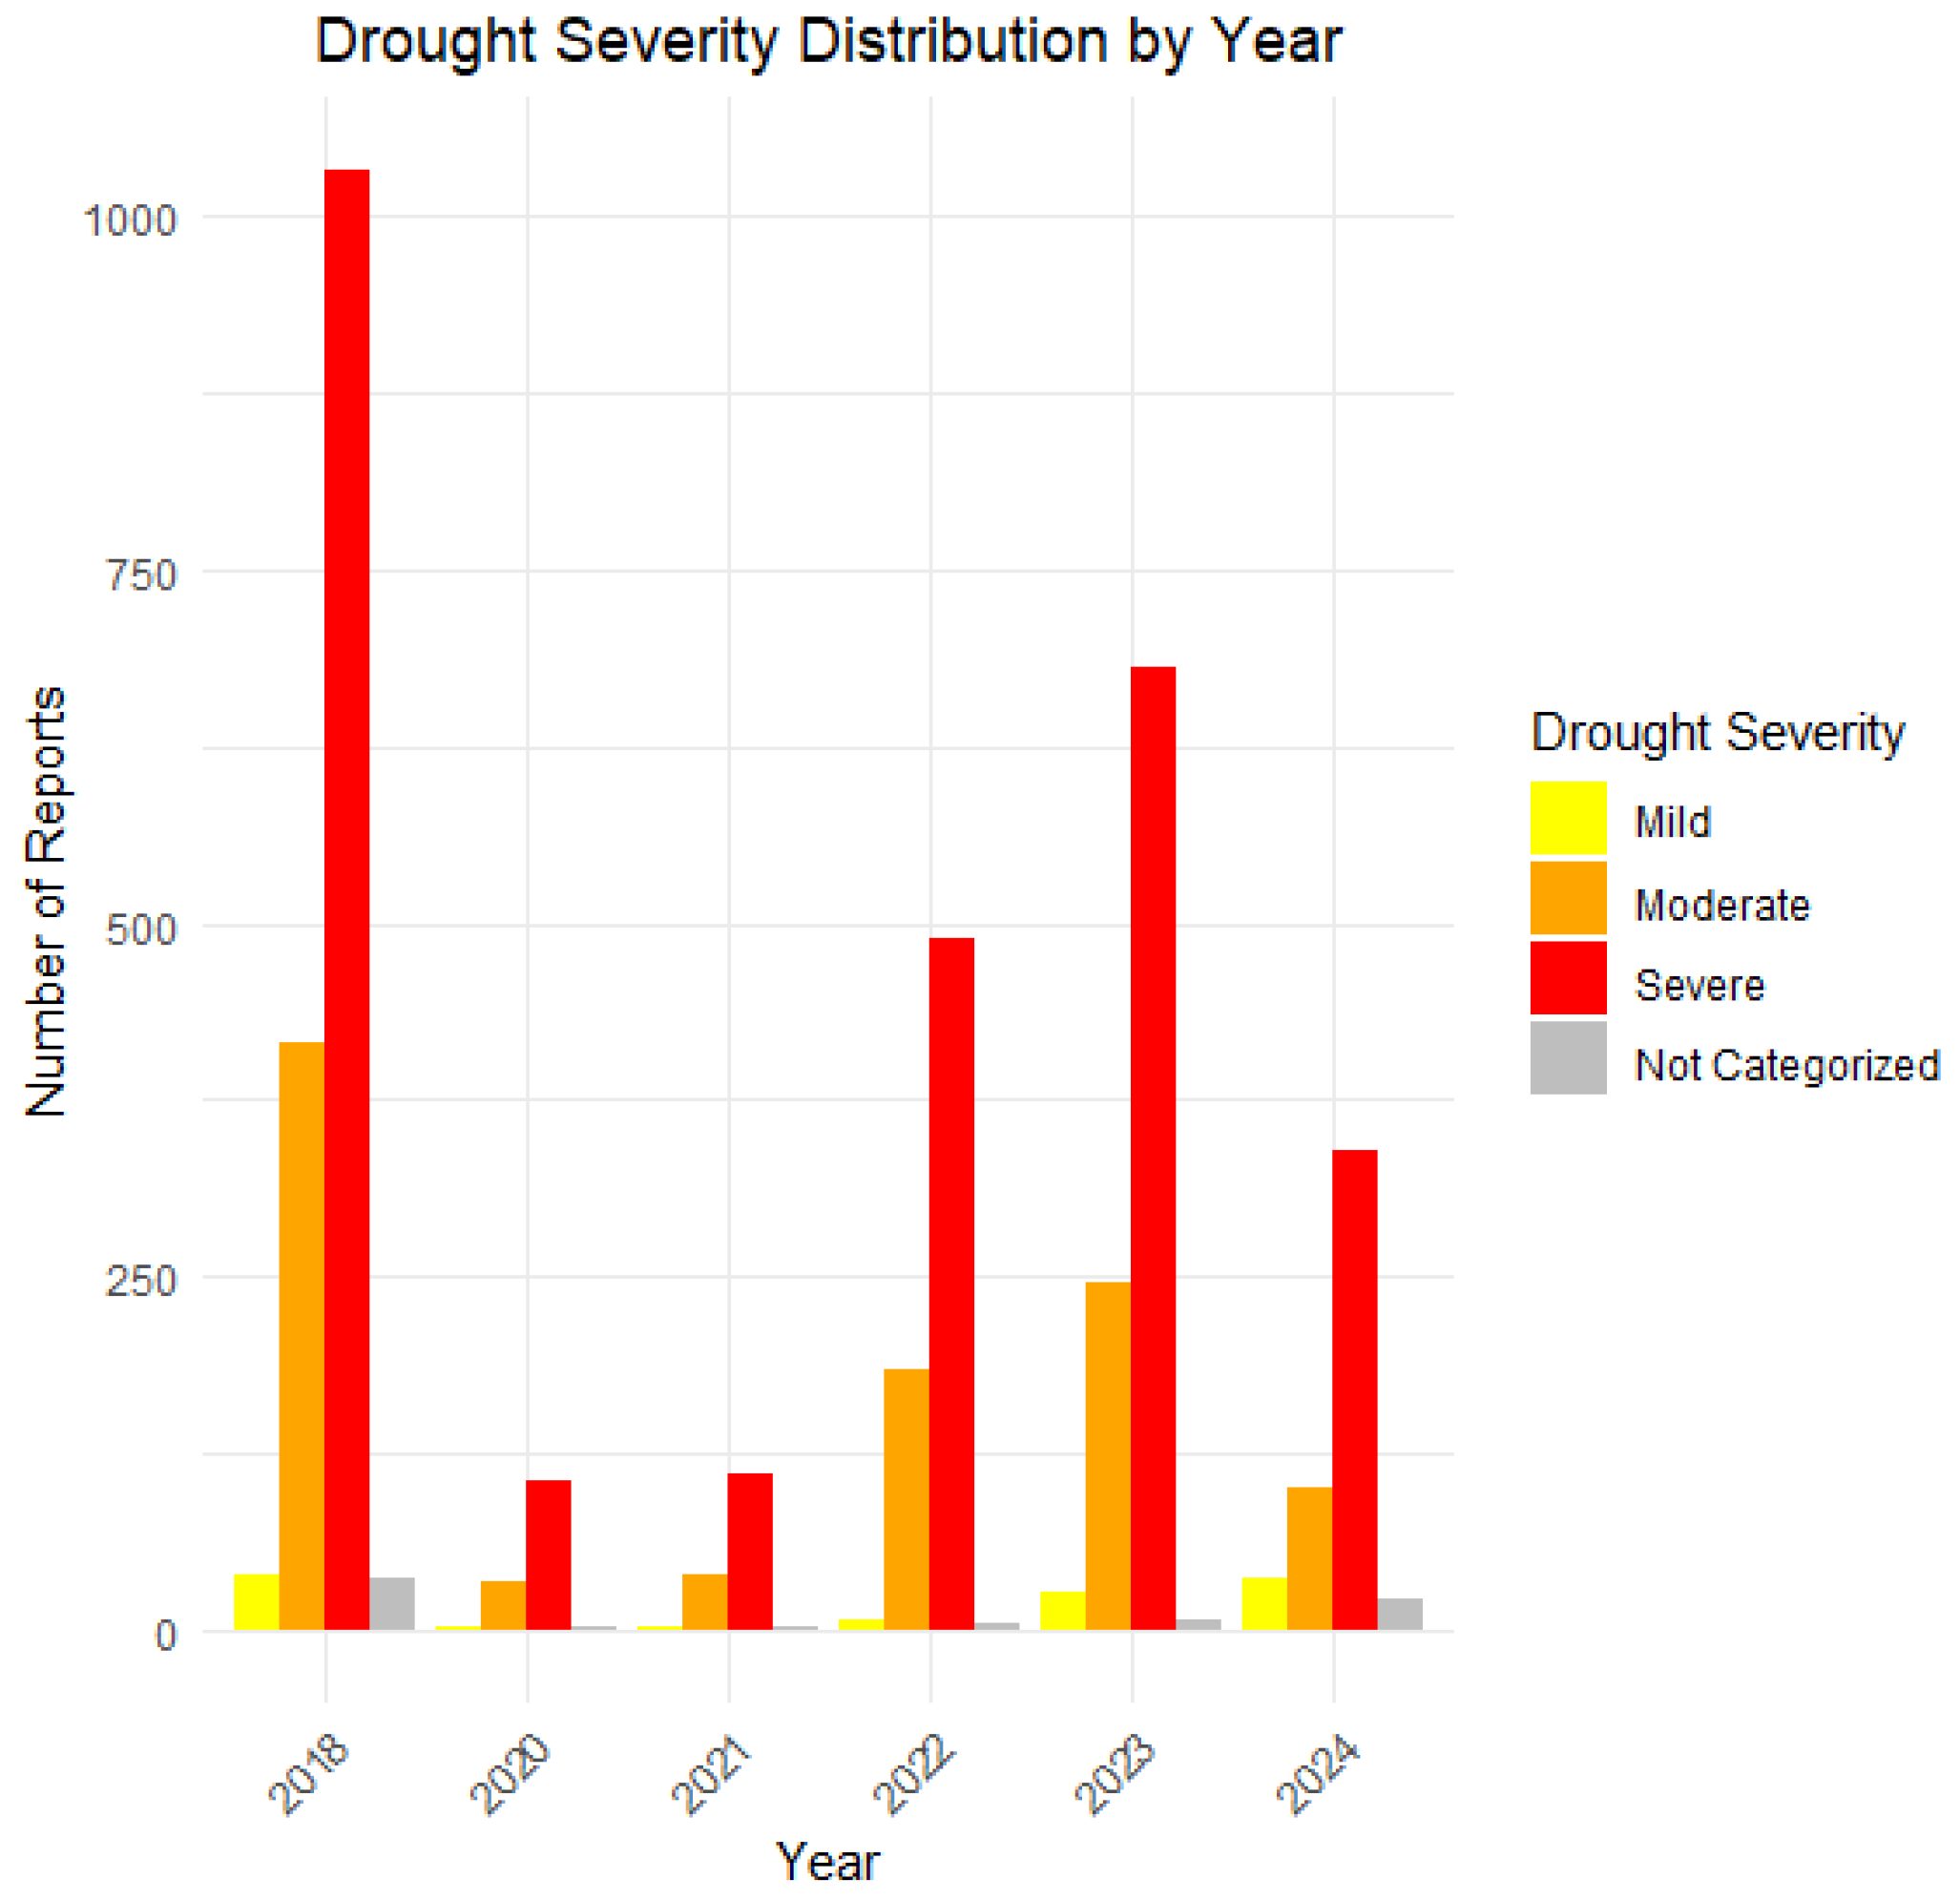
- Categorization of Drought Severity: This study further endeavored to contextualize the severity of drought events within frameworks like the NDI and the United States Drought Monitor (USDM) [8]. Observer-provided descriptions were parsed for specific indicators that aligned with predefined criteria for mild, moderate, and severe drought conditions:
- Mild Drought: dust, plants suffer, outdoor livelihood changes, ecosystem changes, animal migration, early leaf drop, wilting annual crops, slight soil cracking, reduced recreational water use, decreased pollinator activity;
- Moderate Drought: less water, water quality change, vegetation change, habitat change, wildlife near people, reduced stream flow, declining pasture quality, increased invasive plants, heat stress livestock, disruption of fish spawning, increased algae growth;
- Severe Drought: loss of wetlands, fish kills, tree mortality, wildlife mortality, complete dry-up ponds, massive tree mortality, livestock deaths, severe erosion, economic crisis farming, local extinction aquatic species.
2.3.3. Data Analysis
- 1.
- Text Processing: Utilization of R for the advanced text processing required for categorizing observer reports based on predefined keywords. This step was crucial for sorting the vast amounts of textual data into coherent categories of drought types and severity.
- 2.
- Statistical Analysis: Application of R’s statistical tools to identify trends and patterns within the data, providing insights into the temporal dynamics of drought conditions across Missouri. The analysis aimed to uncover patterns in drought reports over the years 2018 to 2024, facilitating an understanding of how drought impacts have evolved over time.
- 3.
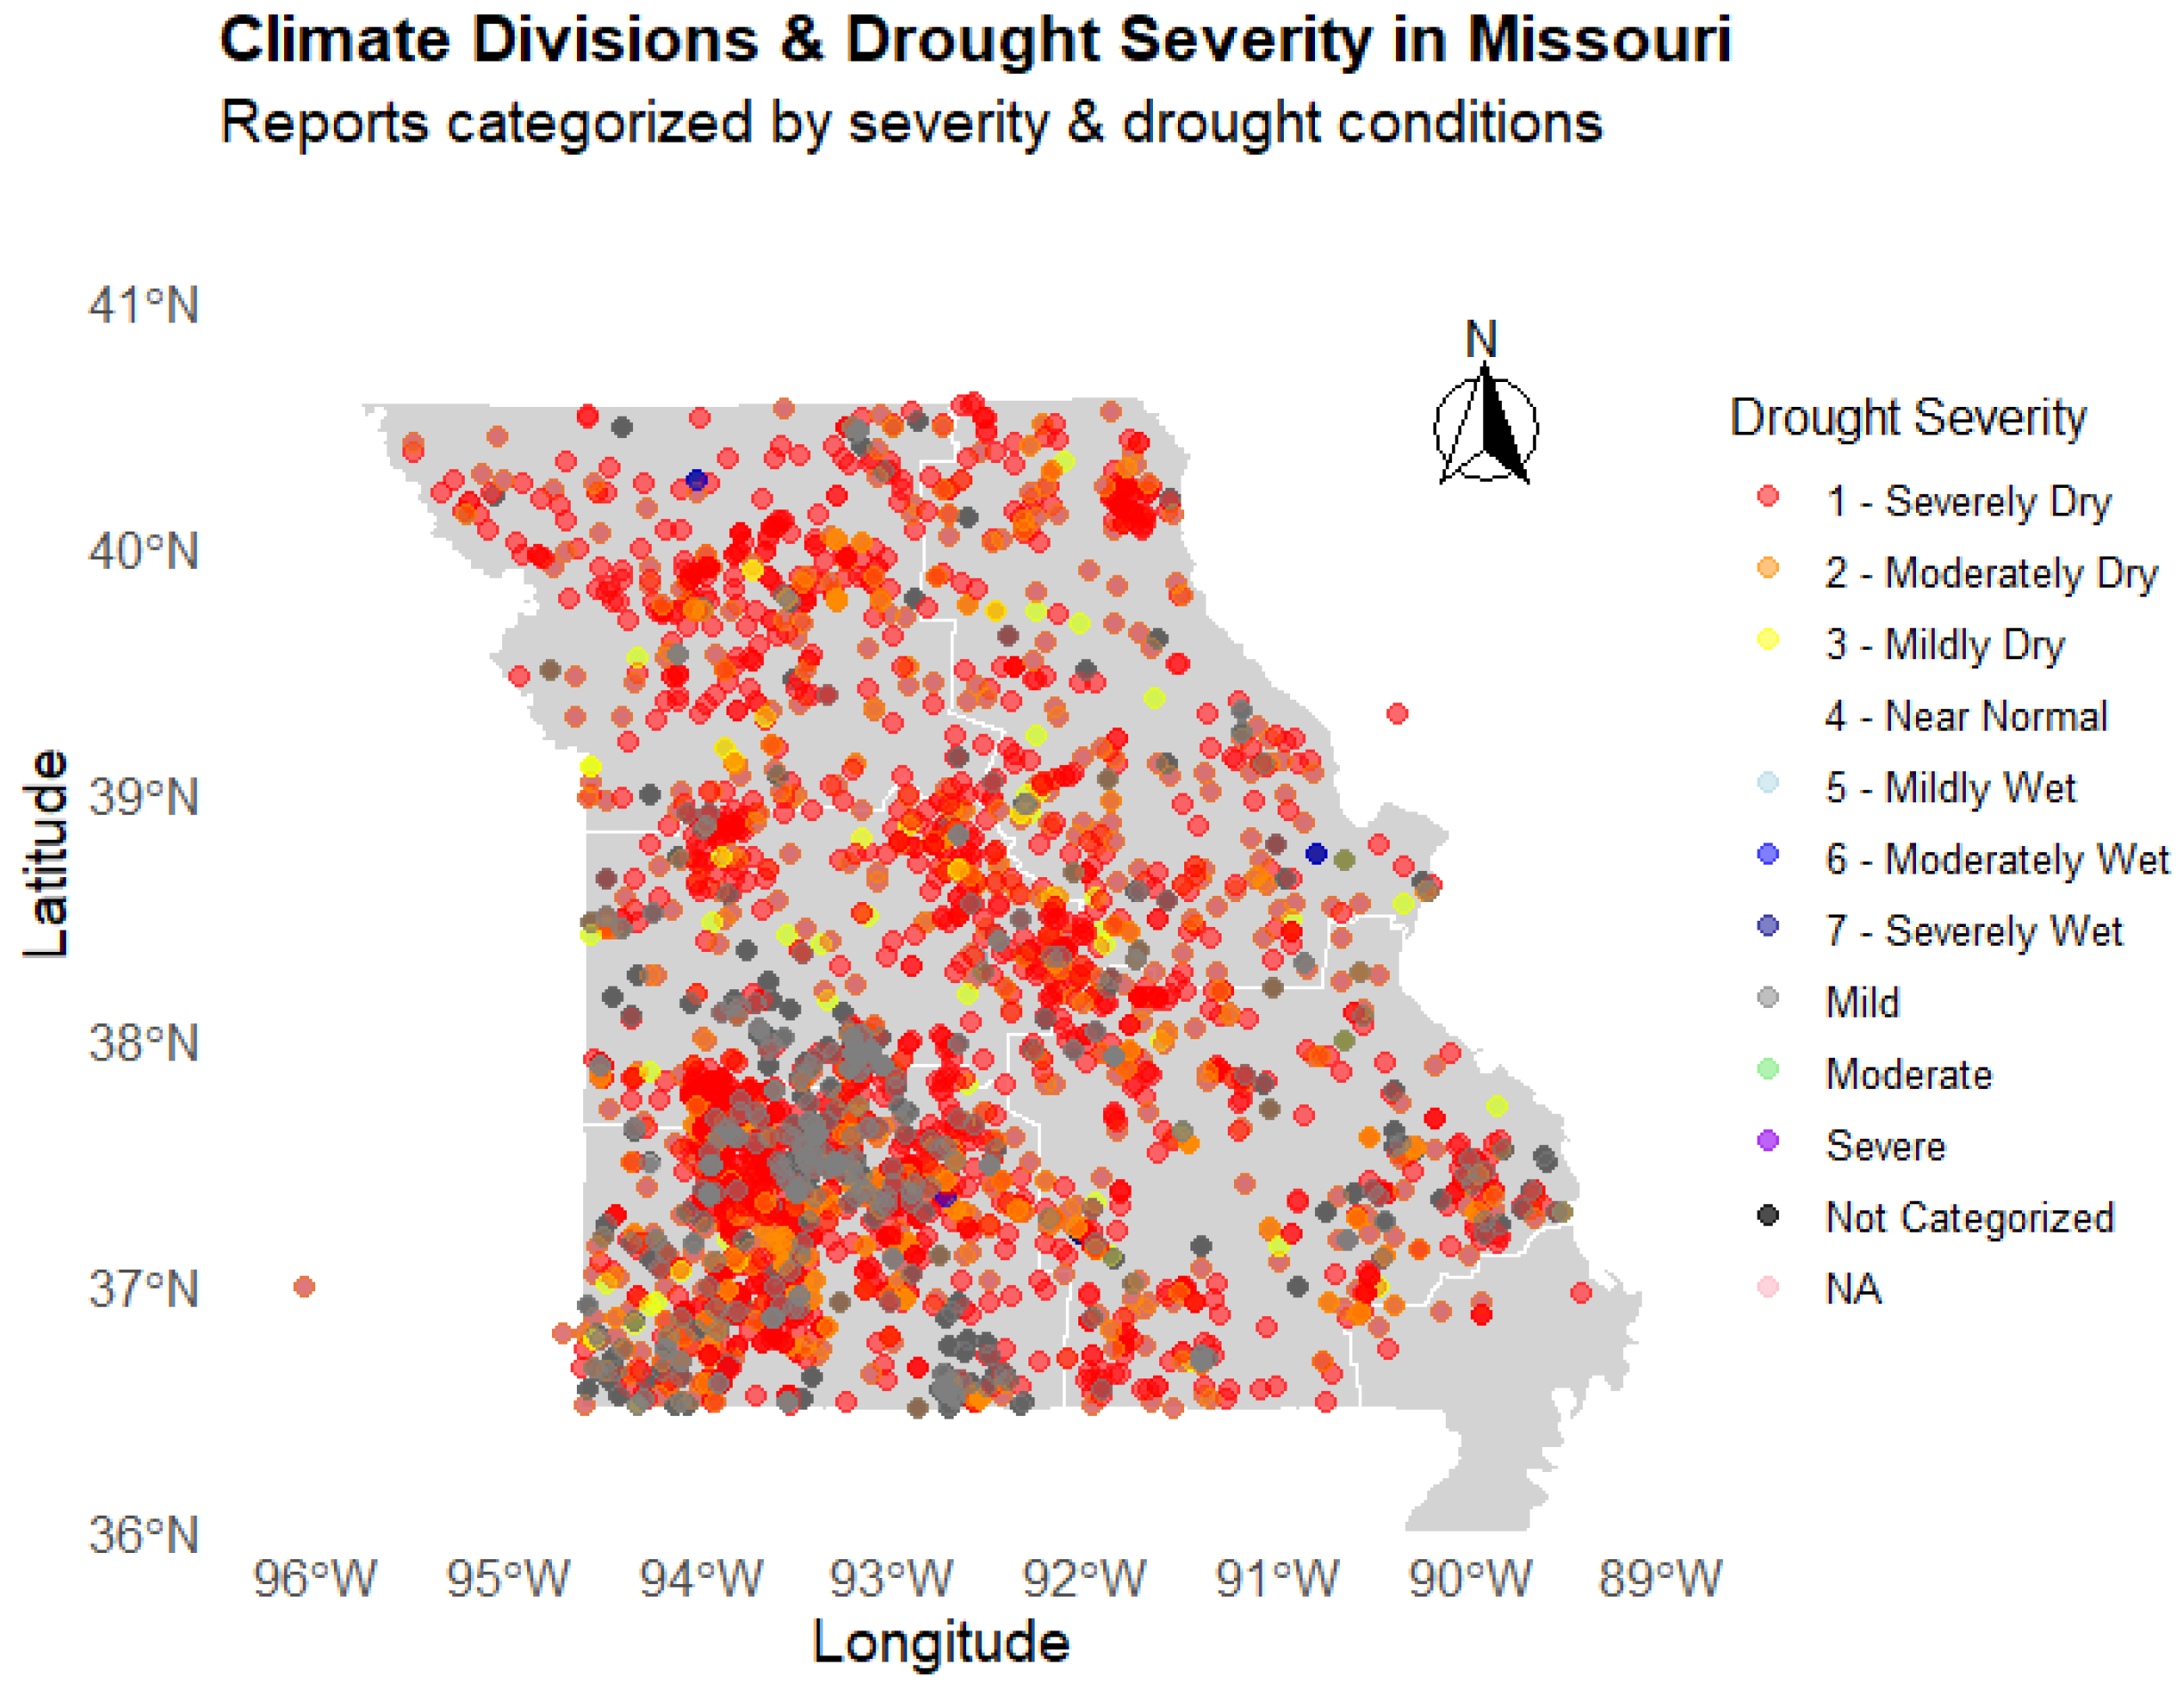
- Geospatial Analysis: Employing R’s geospatial capabilities, specifically the sf package [28], to map and analyze the spatial distribution of drought impacts. This allowed for the examination of drought severity across Missouri’s diverse landscape. By overlaying NDI-derived metrics onto Missouri’s climate divisions, this analysis captured both quantitative drought metrics and observer-reported impacts.
2.3.4. Geospatial Analysis and Climate Divisions
2.3.5. New Drought Index Calculation
3. Results
3.1. Drought 2022 in Context: United States Statewide Ranks
3.2. Severity Analysis Through a Temporal Lens
3.3. Spatial Representation of Drought Impact with Geographical Significance
3.4. Blocking Events and NDI Analysis
4. Discussion
4.1. Utility of CMOR Reports
4.2. Importance of Atmospheric Blocking Events
4.3. Predictive Power of the New Drought Index (NDI)
5. Summary and Conclusions
Author Contributions
Funding
Institutional Review Board Statement
Informed Consent Statement
Data Availability Statement
Acknowledgments
Conflicts of Interest
References
- National Weather Service—National Oceanic and Atmospheric Administration, 2006. What Is Meant by the Term Drought? Available online: https://gml.noaa.gov/obop/mlo/educationcenter/students/brochures%20and%20diagrams/noaa%20publications/Drought%20Fact%20Sheet.pdf (accessed on 20 December 2022).
- Weaver, S.M.; Guinan, P.E.; Semenova, I.G.; Aloysius, N.; Lupo, A.R.; Hunt, S. A Case Study of Drought during Summer 2022: A Large-Scale Analyzed Comparison of Dry and Moist Summers in the Midwest USA. Atmosphere 2023, 14, 1448. [Google Scholar] [CrossRef]
- Bonacci, O.; Bonacci, D.; Bonacci, T.R.; Vrsalovic, A. Proposal of a new method for drought analysis. J. Hydrol. Hydromech. 2023, 71, 100–110. [Google Scholar] [CrossRef]
- Athar, H.; Lupo, A.R. Scale and stability analysis of blocking events from 2002–2004: A case study of an unusually persistent blocking event leading to a heat wave in the Gulf of Alaska during August 2004. Adv. Meteor. 2010, 2010, 610263. [Google Scholar]
- Condition Monitoring Observer Reports (CMOR). U.S. Drought Impact Reporter Map Series. Available online: https://unldroughtcenter.maps.arcgis.com/apps/MapSeries/index.html?appid=c95262d1b63646bcae8286e5f7fbf171 (accessed on 8 February 2024).
- National Integrated Drought Information System (NIDIS). Gridded U.S. Drought Monitor (USDM). Available online: https://www.drought.gov/data-maps-tools/gridded-us-drought-monitor-usdm (accessed on 9 March 2024).
- R Core Team. About R. Available online: https://www.r-project.org/about.html (accessed on 14 March 2024).
- National Centers for Environmental Information (NCEI). Drought Recovery Tools. Available online: https://www.ncei.noaa.gov/access/monitoring/drought-recovery/tools (accessed on 21 March 2024).
- National Integrated Drought Information System (NIDIS). Drought Relief, Recovery, and Support. Available online: https://www.drought.gov/drought-in-action/drought-relief-recovery-and-support (accessed on 4 February 2024).
- National Centers for Environmental Information (NCEI). Monthly Drought Report—May 2019. Available online: https://www.ncei.noaa.gov/access/monitoring/monthly-report/drought/201905 (accessed on 5 March 2024).
- National Weather Service. Types of Drought. Available online: https://www.weather.gov/safety/drought-types (accessed on 29 January 2024).
- National Integrated Drought Information System (NIDIS). What Is Drought? Ecological Drought. Available online: https://www.drought.gov/what-is-drought/ecological-drought (accessed on 29 January 2024).
- R Core Team. sf: Simple Features for R. Available online: https://cran.r-project.org/web/packages/sf/index.html (accessed on 3 April 2024).
- GIS Geography. Missouri County Map. Available online: https://gisgeography.com/missouri-county-map/ (accessed on 3 February 2024).
- Missouri Climate Center. Missouri Climate Overview. Available online: http://climate.missouri.edu/climate.php (accessed on 17 March 2024).
- U.S. Department of Agriculture Climate Hubs. Climate Change Impacts on Missouri Agriculture. Available online: https://www.climatehubs.usda.gov/content/climate-change-impacts-missouri-agriculture (accessed on 10 December 2024).
- Zipper, S.C.; Qiu, J.; Kucharik, C.J. Drought effects on US maize and soybean production: Spatiotemporal patterns and historical changes. Environ. Res. Lett. 2016, 11, 094021. Available online: https://iopscience.iop.org/article/10.1088/1748-9326/11/9/094021/meta (accessed on 11 February 2024). [CrossRef]
- Zhang, W.; Villarini, G. On the weather types that shape the precipitation patterns across the U.S. Midwest. Clim. Dyn. 2019, 53, 4217–4232. [Google Scholar] [CrossRef]
- Crétat, J.; Richard, Y.; Pohl, B.; Emery, J.; Dudek, J.; Roy, D.; Pergaud, J.; Rega, M.; Poupelin, M.; Joly, D.; et al. Impact of topography and land cover on air temperature space-time variability in an urban environment with contrasted topography (Dijon, France, 2014–2021). Theor. Appl. Climatol. 2024, 155, 1941–1958. [Google Scholar] [CrossRef]
- Henson, C.B.; Lupo, A.R.; Market, P.S.; Guinan, P.E. ENSO and PDO-related climate variability impacts on Midwestern United States crop yields. Int. J. Biometeorol. 2017, 61, 857–867. [Google Scholar] [PubMed]
- U.S. Geological Survey. Publication SIR 2009-5148. Available online: https://pubs.usgs.gov/publication/sir20095148 (accessed on 12 March 2024).
- ABC17 News. Climate Matters: Exploring the Impacts of Multi-Year Drought in Missouri. ABC17 News, 2024. Available online: https://abc17news.com/top-stories/2024/03/07/climate-matters-exploring-the-impacts-of-multi-year-drought-in-missouri/ (accessed on 1 April 2024).
- Lupo, A.R.; Kononova, N.K.; Semenova, I.G.; Lebedeva, M.G. A Comparison of the Characteristics of Drought during the Late 20th and Early 21st Centuries over Eastern Europe, Western Russia and Central North America. Atmosphere 2021, 12, 1033. [Google Scholar] [CrossRef]
- McEvoy, J.; Bathke, D.J.; Burkardt, N.; Cravens, A.E.; Haigh, T.; Hall, K.R.; Hayes, M.J.; Jedd, T.; Poděbradská, M.; Wickham, E. Ecological Drought: Accounting for the Non-Human Impacts of Water Shortage in the Upper Missouri Headwaters Basin, Montana, USA. Resources 2018, 7, 14. Available online: https://www.mdpi.com/2079-9276/7/1/14 (accessed on 25 February 2024). [CrossRef]
- Missouri Department of Natural Resources. Drought Assessment Committee. Available online: https://dnr.mo.gov/about-us/forums-stakeholder-groups/drought-assessment-committee (accessed on 5 February 2024).
- Wilhite, D.A. Chapter 1: The Enigma of Drought. In University of Nebraska-Lincoln, Drought Mitigation Center Faculty Publications; University of Nebraska-Lincoln: Lincoln, NE, USA, 1993; Available online: https://digitalcommons.unl.edu/cgi/viewcontent.cgi?article=1064&context=droughtfacpub (accessed on 7 February 2024).
- R Core Team. R: A Language and Environment for Statistical Computing; R Foundation for Statistical Computing: Vienna, Austria, 2024; Available online: https://www.r-project.org/ (accessed on 1 April 2024).
- Wickham, H. ggplot2: Create Elegant Data Visualisations Using the Grammar of Graphics. ggplot2 Documentation 2024. Available online: https://ggplot2.tidyverse.org/reference/ggsf.html (accessed on 28 March 2024).
- National Centers for Environmental Information (NCEI), NOAA. CONUS Climate Divisions Reference Maps. 2024. Available online: https://www.ncei.noaa.gov/access/monitoring/reference-maps/conus-climate-divisions (accessed on 7 April 2024).
- National Oceanic and Atmospheric Administration (NOAA). 2024. Available online: https://www.noaa.gov/ (accessed on 18 March 2024).
- Lupo, A.R.; Kelsey, E.P.; Weitlich, D.K.; Davis, N.A.; Market, P.S. Using the monthly classification of global SSTs and 500 hPa height anomalies to predict temperature and precipitation regimes one to two seasons in advance for the mid-Mississippi region. Nat. Weather Dig. 2008, 32, 11–33. [Google Scholar]
- Newberry, R.G.; Lupo, A.R.; Jensen, A.D.; Zalipynis, R.A. An analysis of the spring-to-summer transition in the west central plains for application to long range forecasting. Atmos. Clim. Sci. 2016, 6, 375–393. [Google Scholar] [CrossRef]
- Lupo, A.R.; Jensen, A.D.; Mokhov, I.I.; Timazhev, A.V.; Eichler, T.; Efe, B. Changes in global blocking character during the most recent decades. Atmosphere 2019, 10, 92. [Google Scholar]
- Lupo, A.R. Atmospheric Blocking Events: A Review. Ann. N. Y. Acad. Sci. 2020, 1504, 5–24. [Google Scholar] [PubMed]
- Lupo, A.R.; Smith, N.B.; Guinan, P.E.; Chesser, M.D. The climatology of Missouri region dew points and the relationship to ENSO. Nat. Wea. Dig. 2012, 36, 10–20. [Google Scholar]

| Year | Blocking Events | Blocking Days | Block Intensity (BI) |
|---|---|---|---|
| 2012 | 0/0 | 0.0/0.0 | NA/NA |
| 2018 | 1/2 | 9.0/14.0 | 4.24/2.69 |
| 2019 | 4/4 | 51.0/38.0 | 4.08/2.70 |
| 2020 | 6/1 | 47.0/15.5 | 3.80/2.49 |
| 2021 | 4/3 | 34.5/24.5 | 2.78/2.28 |
| 2022 | 6/1 | 52.5/20.5 | 3.00/2.13 |
| 2023 | 4/1 | 54.0/32.5 | 3.08/2.23 |
| 2024 | 5/3 | 38.0/28.5 | 2.68/2.69 |
| Year | NDI Calculation Spring | NDI Calculation Summer |
|---|---|---|
| 2012 | −2.92 | −3.26 |
| 2018 | −1.32 | −2.22 |
| 2019 | −0.70 | 0.41 |
| 2020 | 0.36 | −0.28 |
| 2021 | 0.85 | 0.95 |
| 2022 | 0.36 | −2.04 |
| 2023 | −2.15 | 0.08 |
| 2024 | −1.96 | 1.40 |
Disclaimer/Publisher’s Note: The statements, opinions and data contained in all publications are solely those of the individual author(s) and contributor(s) and not of MDPI and/or the editor(s). MDPI and/or the editor(s) disclaim responsibility for any injury to people or property resulting from any ideas, methods, instructions or products referred to in the content. |
© 2025 by the authors. Licensee MDPI, Basel, Switzerland. This article is an open access article distributed under the terms and conditions of the Creative Commons Attribution (CC BY) license (https://creativecommons.org/licenses/by/4.0/).
Share and Cite
Weaver, S.M.; Lupo, A.R.; Hunt, S.; Aloysius, N. Refining Drought Assessment: A Multi-Dimensional Analysis of Condition Monitoring Observer Reports in Missouri (2018–2024). Atmosphere 2025, 16, 389. https://doi.org/10.3390/atmos16040389
Weaver SM, Lupo AR, Hunt S, Aloysius N. Refining Drought Assessment: A Multi-Dimensional Analysis of Condition Monitoring Observer Reports in Missouri (2018–2024). Atmosphere. 2025; 16(4):389. https://doi.org/10.3390/atmos16040389
Chicago/Turabian StyleWeaver, Sarah M., Anthony R. Lupo, Sherry Hunt, and Noel Aloysius. 2025. "Refining Drought Assessment: A Multi-Dimensional Analysis of Condition Monitoring Observer Reports in Missouri (2018–2024)" Atmosphere 16, no. 4: 389. https://doi.org/10.3390/atmos16040389
APA StyleWeaver, S. M., Lupo, A. R., Hunt, S., & Aloysius, N. (2025). Refining Drought Assessment: A Multi-Dimensional Analysis of Condition Monitoring Observer Reports in Missouri (2018–2024). Atmosphere, 16(4), 389. https://doi.org/10.3390/atmos16040389