Article

Agrochemical Nitrogen Cycles, Photosynthesis Performance of Nitrogen Use Efficiency, and Yield of Maize

1
Department of Geography, Xinzhou Teachers University, Xinzhou 034000, China
2
College of Plant Protection, Shanxi Agricultural University, Jinzhong 030801, China
3
Department of Plant Production, College of Food and Agriculture Sciences, King Saud University, P.O. Box 2460, Riyadh 11451, Saudi Arabia
4
Shanxi Key Laboratory for Modernization of TCVM, College of Veterinary Medicine, Shanxi Agricultural University, Jinzhong 030600, China
*
Author to whom correspondence should be addressed.
Atmosphere 2025, 16(4), 373; https://doi.org/10.3390/atmos16040373
Submission received: 13 January 2025 / Revised: 3 March 2025 / Accepted: 21 March 2025 / Published: 25 March 2025
(This article belongs to the Section Biosphere/Hydrosphere/Land–Atmosphere Interactions)

Abstract

:
Nitrogen (N), as a macro-element, plays a vital role in plant growth and development. N deficiency affects plant productivity by decreasing the photosynthesis, leaf area, and longevity of green leaf. The experimental design was a randomized complete block design with four replicates: N0 (0 kg N ha−1), N90 (90 kg N ha−1), N180 (180 kg N ha−1), and N210 (210 kg N ha−1), respectively, i.e., the effects of different N application levels on photosynthetic physiology, leaf characteristics, yield, and production. The findings of the present study underscore the importance of optimizing nitrogen application to maximize light capture, photosynthetic efficiency, and crop productivity. Under N-treated groups (N90, N180, and N210), the average photosynthetically active radiation (PAR) of panicle leaves at all levels, N210, was determined to be higher than that of other treated groups, as well as the N0 level and the upper, middle, and lower regions of N0, N90, and N180 plants under the same leaf area index (LAI), and it was noted to be higher under N210, respectively. Dry matter accumulation under N180, and N210 increased, respectively, and under N210, the dry matter accumulation of the population was significantly higher than that under N180, respectively. The nitrogen use efficiency (NUE), nitrogen recovery efficiency (NRE), nitrogen internal efficiency (NIE), and partial factor productivity of nitrogen (PFPN) under different nitrogen (N) application rates were significantly higher than N0, where the NIE of N180 was significantly higher than that of N210, the NUE and NRE of N180 and N210 were higher than those of N0, and the difference from PFPN was not significant, respectively.

1. Introduction

Nitrogen is involved in all crop growth and biological process stages. The capable N supply is crucial for high crop yields and its qualities and most essential elements used in commercial agriculture [1]. N fertilizer consumption is crucial for reducing the food crisis and guaranteeing environmental security in order to achieve the synergistic increase in yield per unit area. To increase yield and achieve a high population, increasing planting density is the most common and effective method [1,2]. The covering light environment can be optimized by changing the heterogeneity of the population distribution to improve the photosynthetic capacity [3,4]. Planting can delay the senescence of leaves in the middle and lower parts of the maize, increase the light transmittance, and reduce the extinction coefficient [5]. The change in the vertical distribution of the leaf area coefficient and the propagation time of light decrease exponentially, and the degree of radiation attenuation is mainly determined by the leaf density, the arrangement of leaves, and the irradiation angle of incident light [6]. The light transmittance of different levels of crops was shown to be greater in the upper layer and bottom layer of the compact than in flat, but there was little difference in the light transmittance [7]. The leaves stood upright; more light from the upper layer leaked to the middle layer or even the bottom layer leaves, and the shading degree of the lower leaves of the population was reduced [8]. Planting density is also an important factor affecting population photosynthesis by improving canopy conditions [9]. The N application can effectively delay the senescence of the leaves in the lower layer of crops [10]. A large number of studies have shown that N is unevenly distributed in crop canopy leaves [11]. The N content in the crop canopy gradually decreases from top to bottom, forming a vertical distribution gradient of N [12]. Under the condition of N-saving and denitrification-tolerant varieties, there is a better light and N-matching degree such that the middle and upper have higher photosynthetic N use efficiency (NUE), photosynthetic productivity, photosynthetic N proportion, and accumulation, which is an important physiological internal reason for achieving higher physiological N use efficiency (NUE) and high yield [11,12]. Light plays an important role in regulating N distribution in leaves [13]. N contents of leaves should be distributed in the middle and upper parts to adapt to the high light intensity because the leaf N distribution significantly affects photosynthesis, and the N content of leaves growing in the top part of the canopy receiving more light is higher than that of leaves growing in the shade of the lower part [14,15]. The radiation interception determines the crop dry matter accumulation and crop yield, and photosynthetic efficiency is mainly affected by the photosynthetic capacity of leaves [16]. To synthesize more photosynthesis, more N is required, which forms a kind of “pulling” effect on the N; the lower leaves are transferred upward to the upper leaves [17]. The key objectives for studying the nutrition and entire leaf N content are (1) determining the role of N in improving photosynthetic efficiency in maize; (2) identifying strategies for maximizing NUE, ensuring that maize plants utilize applied N more effectively for growth and development; and (3) correlating N management practices with maize yield, grain quality, and overall crop performance.

2. Materials and Methods

2.1. Description of the Experimental Site

The field experiment conducted in Taigu City, Shanxi Province, China (40°33′ N, 110°31′ E) from 2020 to 2023 was likely meant to explore aspects of agricultural methods, potentially related to nutrient management, soil health, and crop yield. The environmental characteristics of this region include a cold temperate continental monsoon climate and an active cumulative temperature > 10 °C of roughly 2100–2300 °C. The site was under an irrigated maize crop rotation system. The samples were ground in liquid N and maintained at −80 °C, and the cropping systems were designed around optimizing the cultivation of maize under varying climatic, soil, and economic conditions. A cropping system for maize includes the type of crops grown alongside the rotation schedules, the cropping practices, and management strategies.

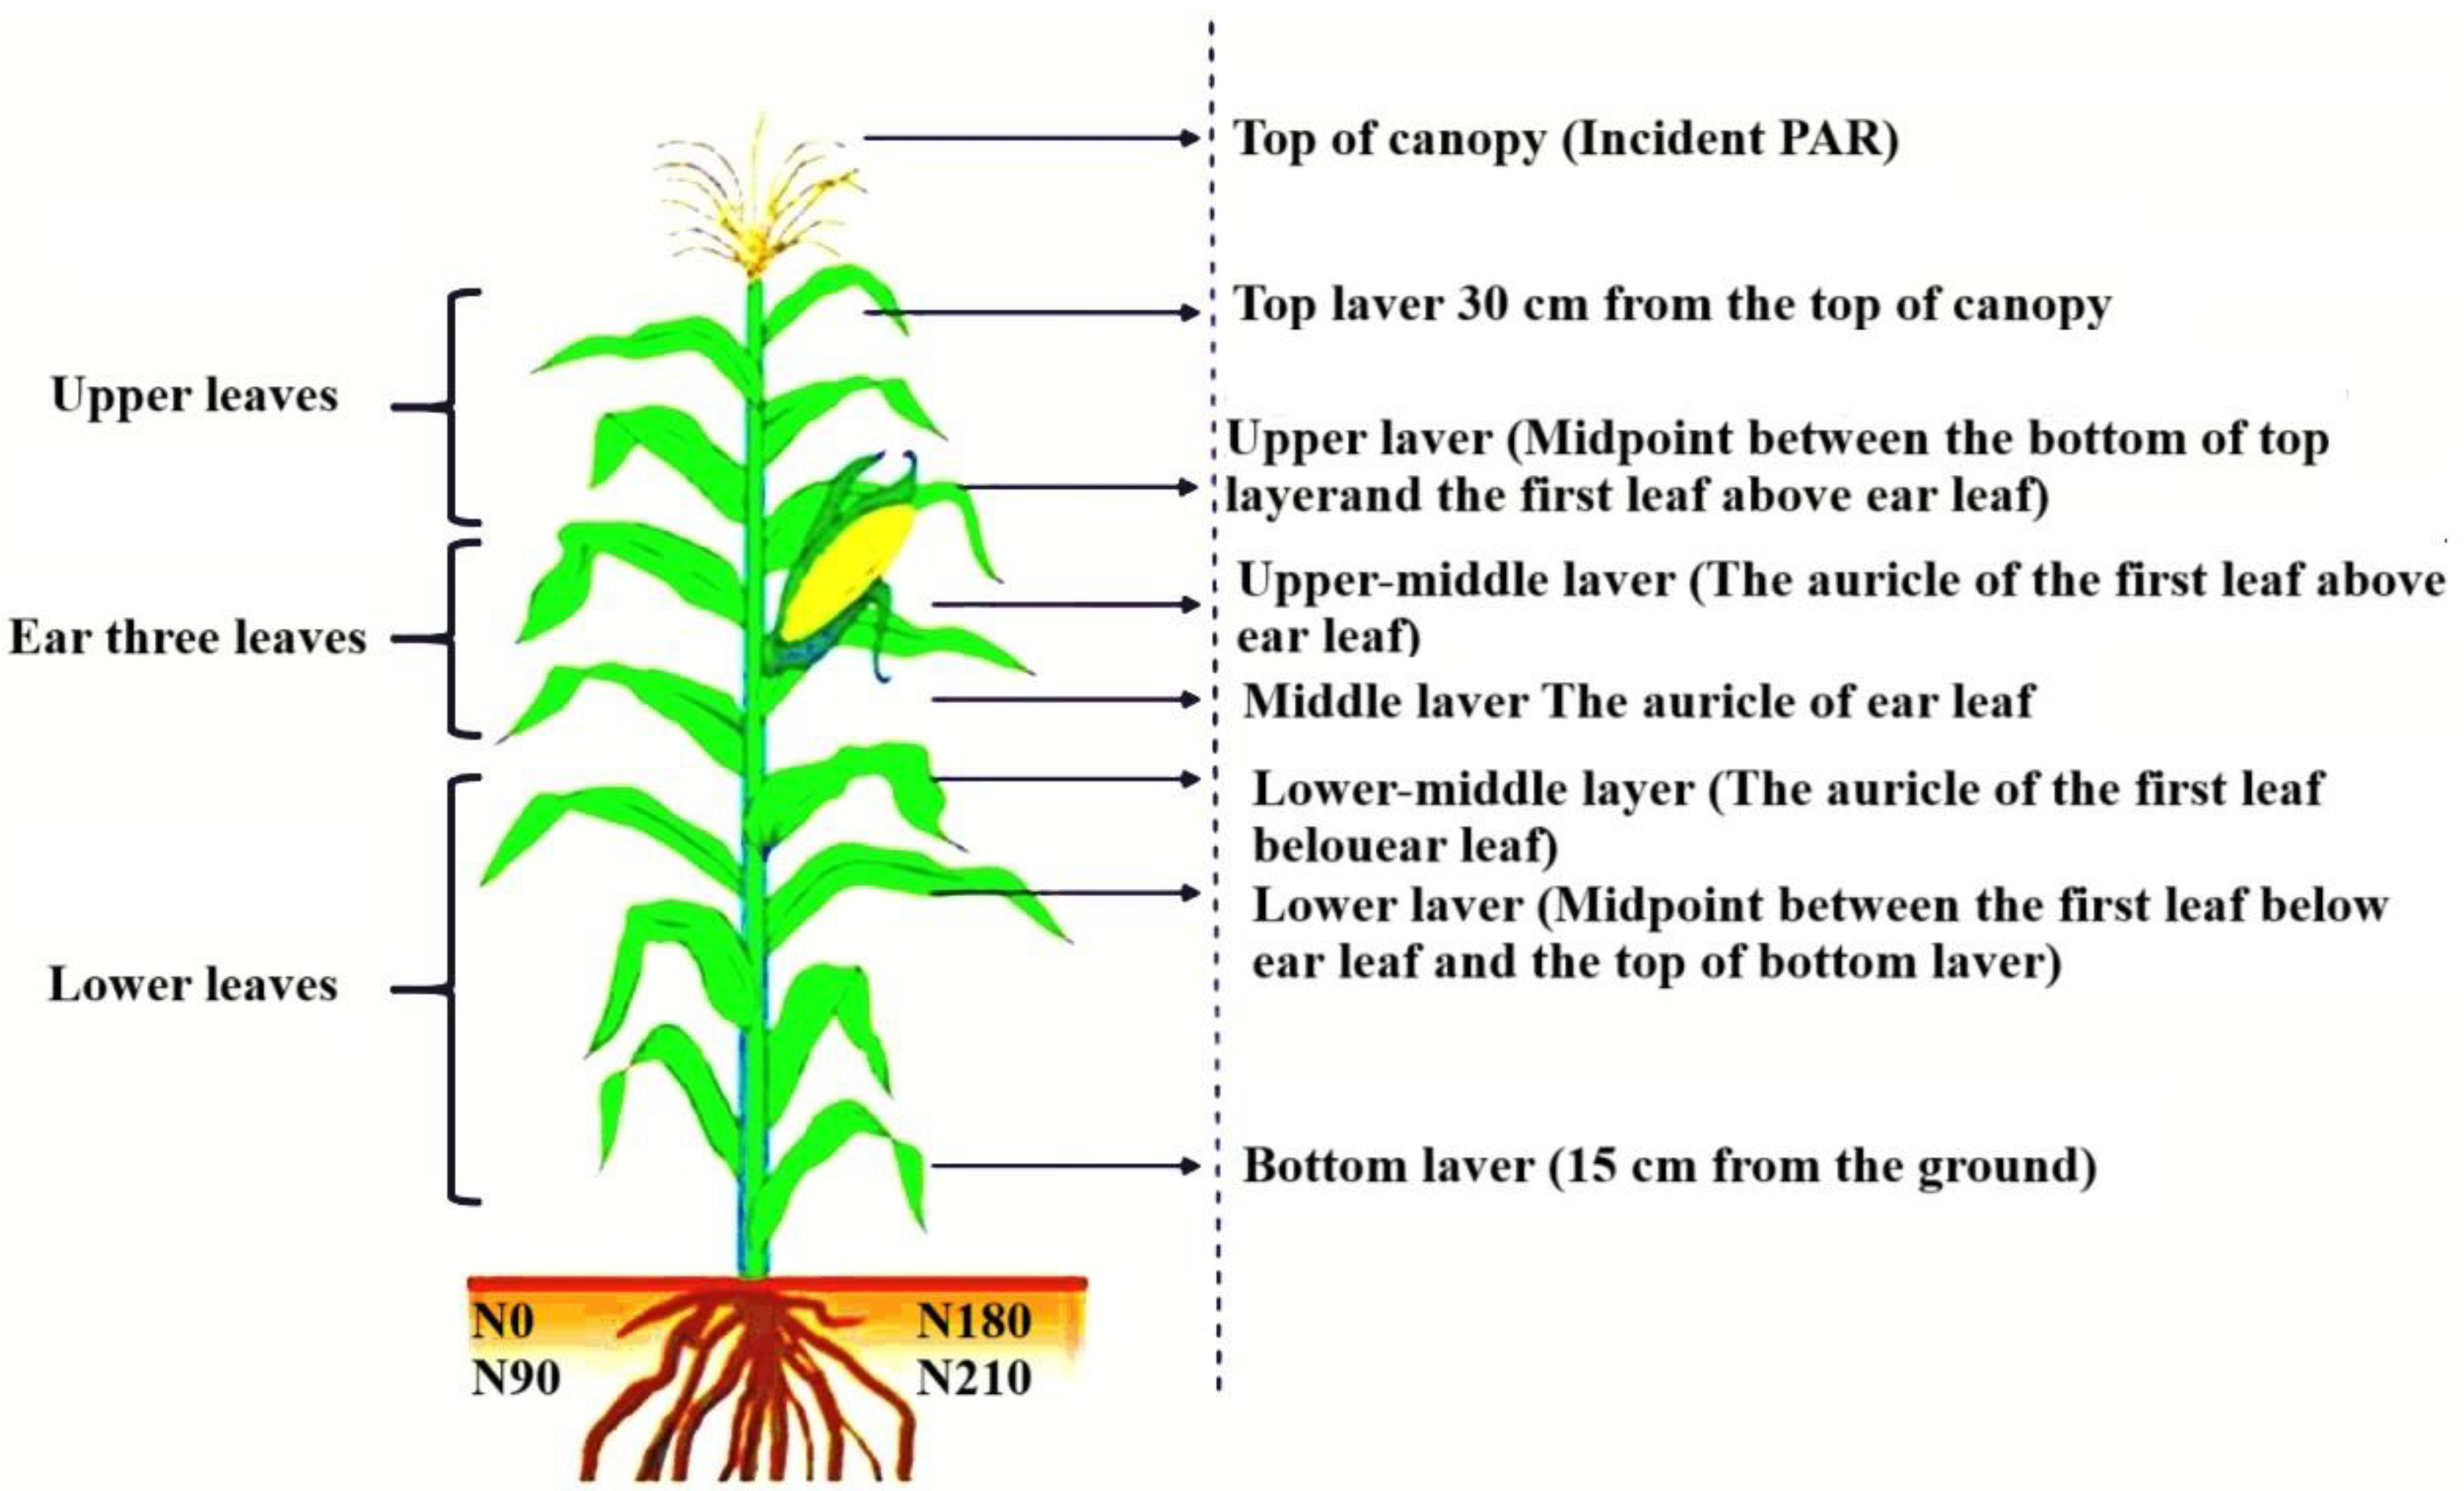
2.2. Experimental Design

The research design was a randomized complete block design with four replicates: N0 (0 kg N ha−1), N90 (90 kg N ha−1), N180 (180 kg N ha−1), and N210 (210 kg N ha−1). The planting densities were 75,000 plants/ha−1. The experimental units were fertilized with the P and K basal dose, such as Phosphorus pentoxide (P2O5) 172.5 kg ha−1 to seed fertilizer from source Diammonium Phosphate (DAP) 375 kg ha−1, Potassium oxide (K2O) 75 kg ha−1, and potassium sulfate (K2SO4) 150 kg ha−1. The pH value was 8.23. The basic fertility of 0–30 cm top soil in 2021 was noted as organic matter 23.25 g/kg−1, total N 1.13 g/kg−1, alkali-hydrolyzed N 73.92 mg/kg−1, phosphorus 8.13 mg/kg−1, potassium 88.74 mg/kg−1, and N contained pH 8.27. In seed fertilizer, residual N (urea 505.4 kg ha−1) was applied once at the jointing stage. The soil was sandy loam; the basic fertility of 0–30 cm topsoil in 2020 was 20.90 g/kg−1 organic matter, 1.51 g/kg−1 total N, 73.90 mg/kg−1 alkali-hydrolyzed N, 13.92 mg/kg−1 available phosphorus, and 95.41 mg/kg−1 available potassium. The experiment consisted of four treatment combinations with the planting mode as the main area and density as a secondary area. Planting was carried out on 27 April 2020–2023, and the harvest was on 8 October 2020–2023.

2.3. Biomass and Leaf Area

Representative plants were selected at the silk-spinning stage (R1) and physiological maturity stage (R6), in which two, three, and five plants were planted in sections and two, three, and five consecutive plants were planted in each plot, and the plants were divided according to organ sampling and silking stage leaves (leaves were divided into three layers (Figure 1). The plant was divided into leaves (including stem, bract, cob, sheath) and seeds. After the leaf area was measured by the “length and width coefficient method”, the plants were cut into sample sections, bagged, put into the oven at 105 °C for 30 min, dried at 80 °C to a constant weight, and weighed, and the dry weight was recorded and the biomass was calculated [18].

2.4. Photosynthetic Characteristics of Leaves

Plants with uniform growth were selected; two plants in a row were selected from each plot. The photosynthetic characteristics of upper (middle leaves of upper leaves of rod triloba), middle (ear leaves), and lower (middle leaves of lower leaves) leaves were measured by the L—6400XT photosynthesis system (Li—CorInc, Lincoln, NE, USA) from 10:00 a.m. to 12:00 a.m. The conditions were a natural light source, a leaf chamber temperature of 25 °C, and a CO2 flow rate of 400 μmol/s [18,19].

2.5. Photosynthetically Active Radiation and Light Quality

Photosynthetically active radiation (PAR) was measured by the Sunscan analysis system at R1; each layer was measured by three points in a diagonal way, and its average value was taken. The incident PAR at the top was measured horizontally upward, and the reflection PAR at the top was measured horizontally downward(Figure 2). At R1, the US Spectrum 3412 red/far red radiometer was used to measure the light quality in the upper, middle, and lower layers [19].

2.6. Test Yield and Seed

After examining the true densities of each treatment, the 10 m double row with no seedling, ridge, or neat growth was chosen for the physiological maturity stage. Following harvesting, 20 ears were chosen at random from the harvested ears, and measurements were made of each ear individually to determine the length, thickness, and quantity of grains per ear. Following threshing, the yield was computed by weighing each harvested ear, measuring the grain weight, and determining the water content.

2.7. Parameter Calculation

The partial fertilizer productivity of N (PFPN, kg·kg−1) = yield/amount of N applied area;
N ( % ) = T r e a t . B l a n k × 0.005 × 0.014 × 100 w.t   o f   s a m p l e ( g ) × v o l .   m a d e ( m l )
The nitrogen use efficiency (NUE, kg·kg−1) = (grain yield treated with N—grain yield treated without N)
NUE   % = N   uptake   kg   ha 1   from   treated   plots     N   uptake   kg   ha 1   in   control   plot applied   rate   of   N   kg   ha 1
N—physiological efficiency (NPE, kg·kg−1) = (grain yield in N treated zone grain yield in no N-treated zone) (above-ground N accumulation in N-treated zone; above-ground N accumulation in no N-treated zone);
N absorption efficiency (NAE, kg·kg−1) = (above-ground N accumulation in N application zone; above-ground N accumulation in non-N application zone)/N application amount; N transfer capacity (NT, kg·ha−1) = nutrient N accumulation at spinning stage; nutrient N accumulation at maturity stage;
The contribution rate of N transfer to grain N accumulation (CTN, %) = N transfer rate/grain N accumulation at maturity × 100%;
Specific leaf nitrogen (SLN, g·m−1) = leaf N accumulation/leaf area;
Light transmittance (%) = photosynthetically active radiation of the measurement layer/Photosynthetically active radiation of the top canopy × 100%;
Photosynthetic productivity (μmol CO2 m−2 s−1) = net photosynthetic rate (Pn, μmol CO2 m−2 s−1) × leaf area index (LAI);
Photosynthetic nitrogen efficiency (PNUE, μCO2 g−2 s−1) = net photosynthetic rate (Pn, μmol CO2 m−2 s−1)/specific leaf nitrogen (SLN, g·m−1)
Light-trapping pigment protein N = 37 mo1 mol−1 Chl content/1000 [20];
N involved in photophosphorylation and electron transport = thylakoid N—light-trapping pigment protein N [21].
The light distribution is based on the Beer–Lambert law: I = I0 exp (−KL × F), where I0 is the photosynthetically active radiation value at the top of the canopy, I0 is the measured photosynthetically active radiation value of the canopy, F is the cumulative leaf area index from the top of the canopy to the measured height, and KL is the extinction coefficient. The N distribution adopts the exponential mode that established that NL = N0 exp (−Kb × F/Ft), where N0 is the canopy top N content, NL is the measured canopy N content, F is the cumulative leaf area coefficient from the canopy top to the measured height, Ft is the total leaf area coefficient, and Kb is the leaf N distribution coefficient (N reduction coefficient).
I = I0 exp(−KL × F)
where I: is the intensity of light after passing through the medium. Units: Typically in watts per square meter (W/m2) or another light intensity unit. I0: The initial intensity of light before it enters the medium. Units: Same as I. K: The extinction coefficient or absorption coefficient of the medium. It represents how strongly the medium absorbs or scatters light. Units: Depends on the context (e.g., m2/mol, m−1). L: The path length or distance the light travels through the medium. Units: Typically in meters (m). F: A factor representing the concentration or density of the absorbing/scattering material in the medium. Units: Depends on the context (e.g., mol/m3, g/m3). Exp: The exponential function, indicating how light intensity decreases exponentially with increasing KL × F.

2.8. Statistical Analysis

Sigmaplot 12.5 and Origin 2021 (Systat Software Inc., Palo Alto, CA, USA) were used for linear regression analysis and mapping, and SPSS 22.0 general linear model (SPSS Statistics, Chicago, DE, USA) was used for variance analysis. The significance test was conducted by the method of least significant difference (LSD), and the significant level was p < 0.05.

3. Results

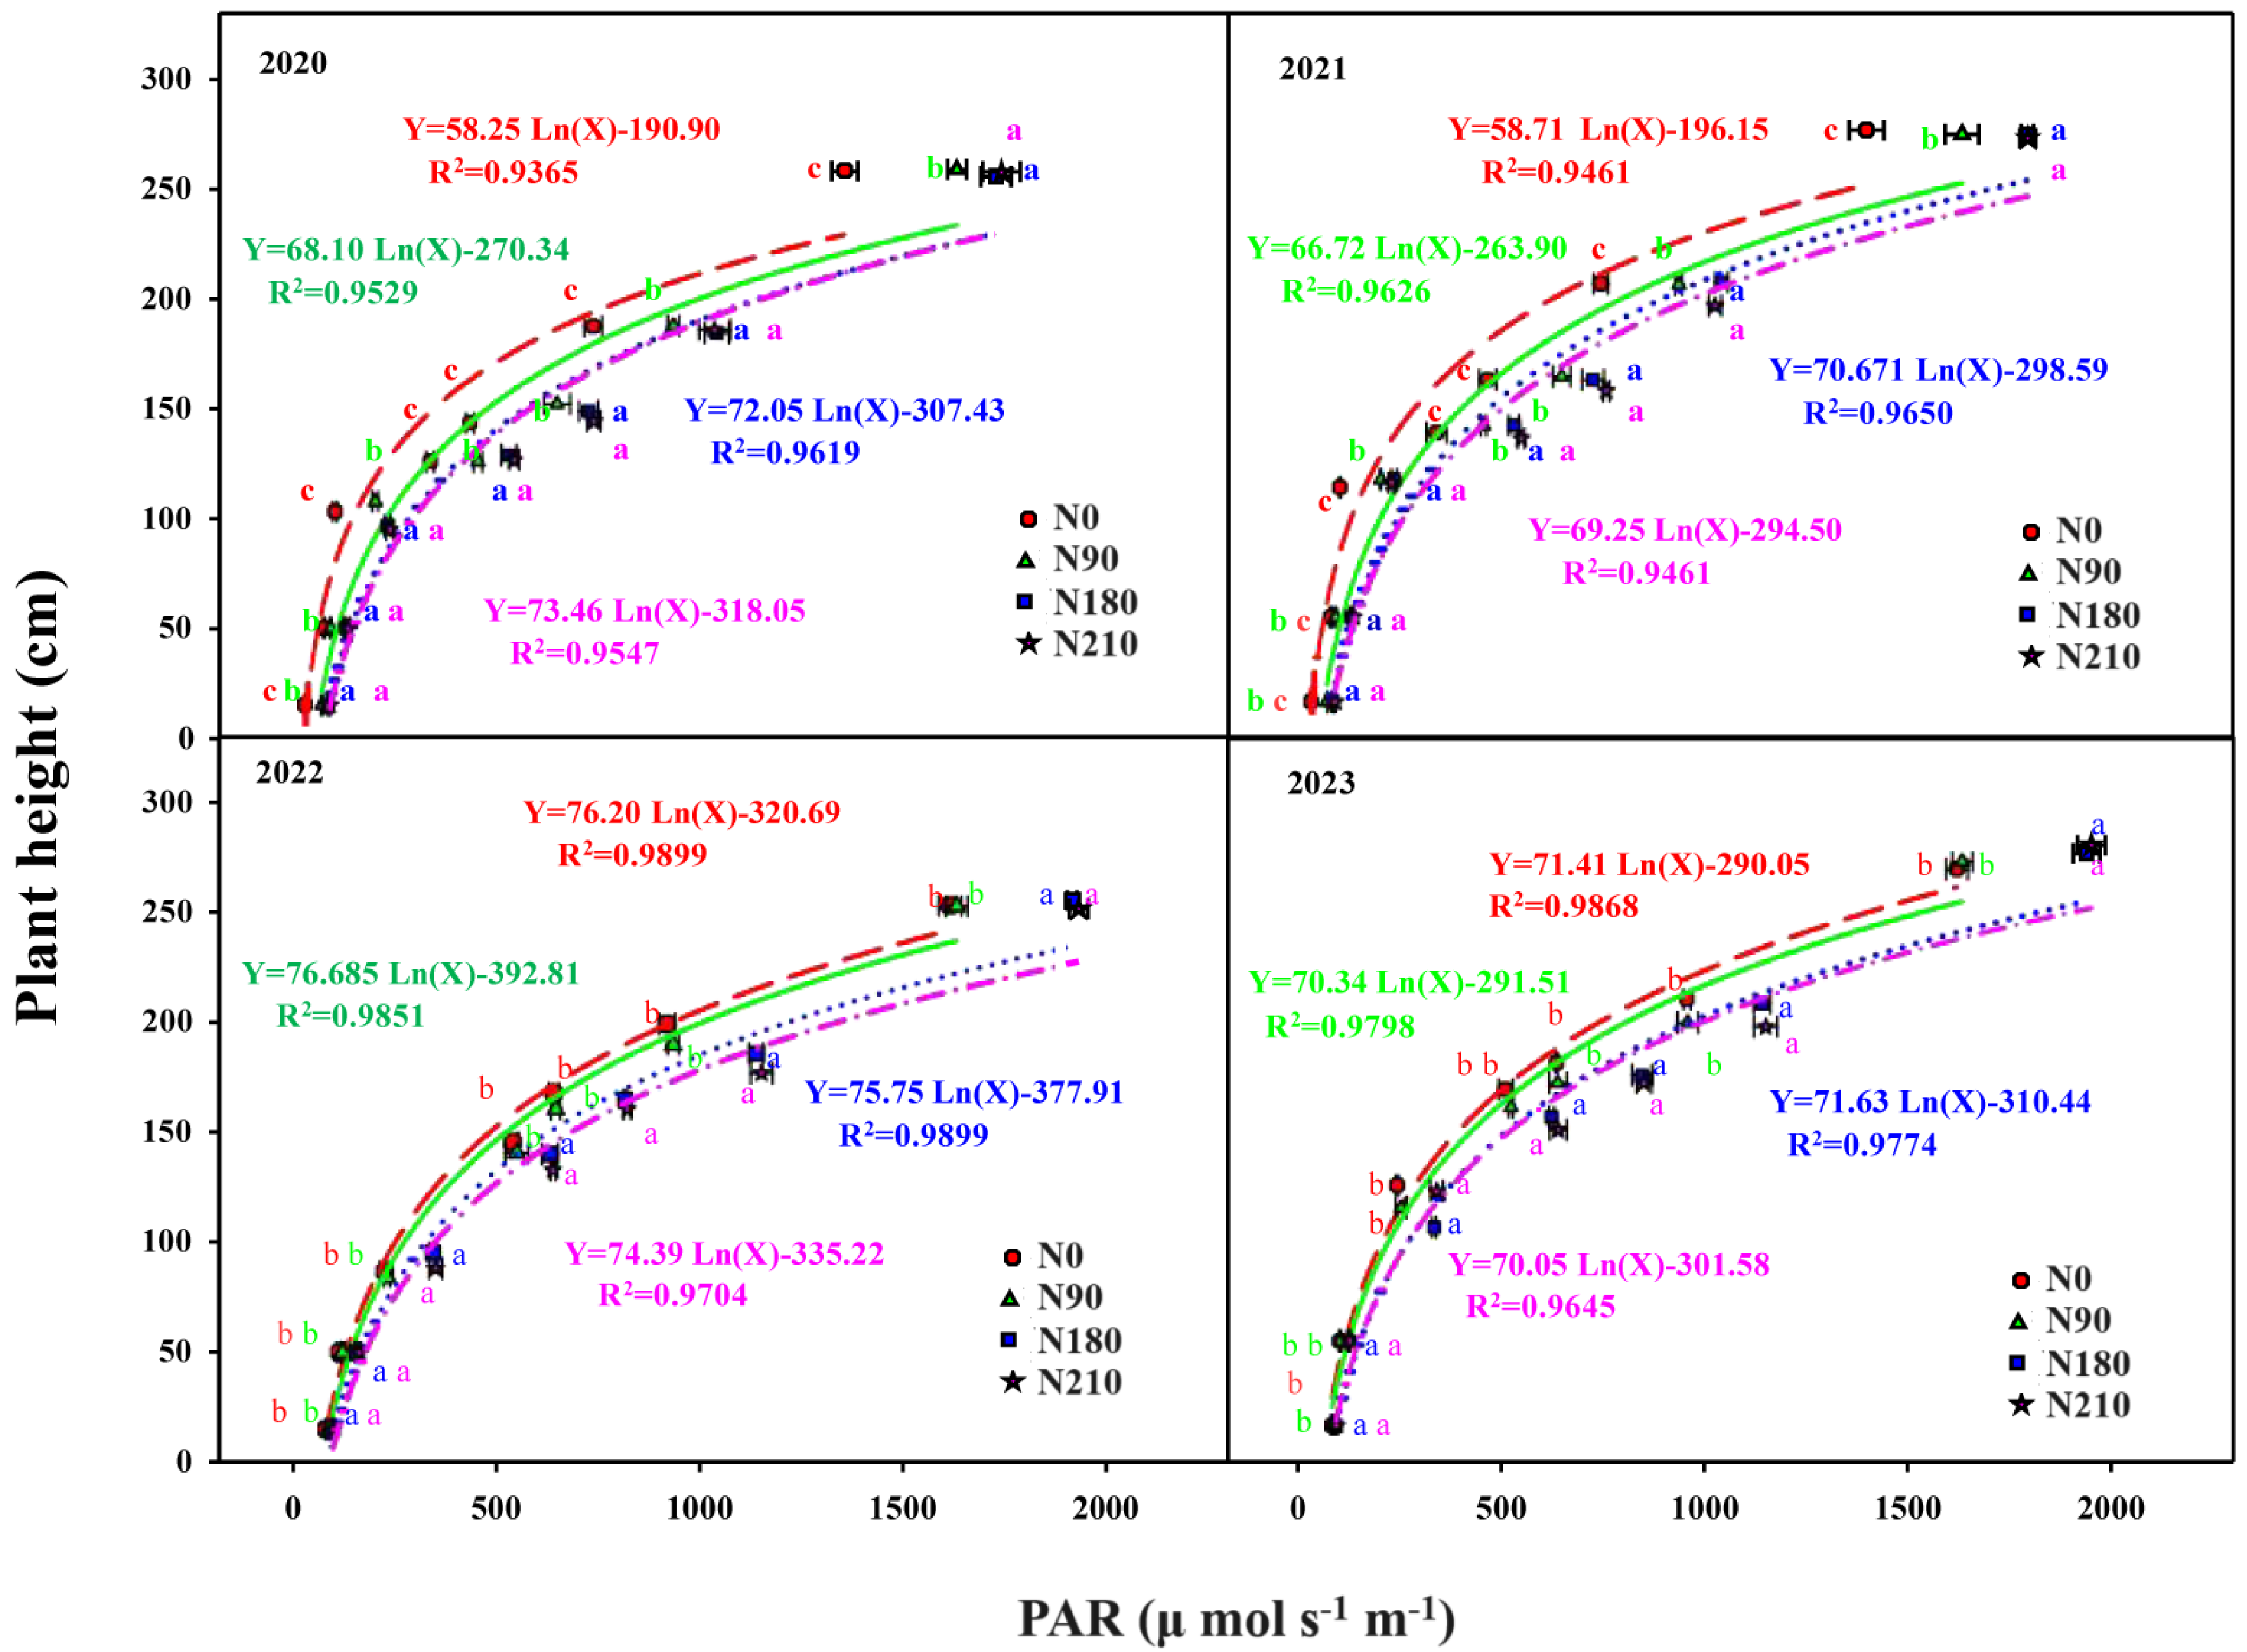
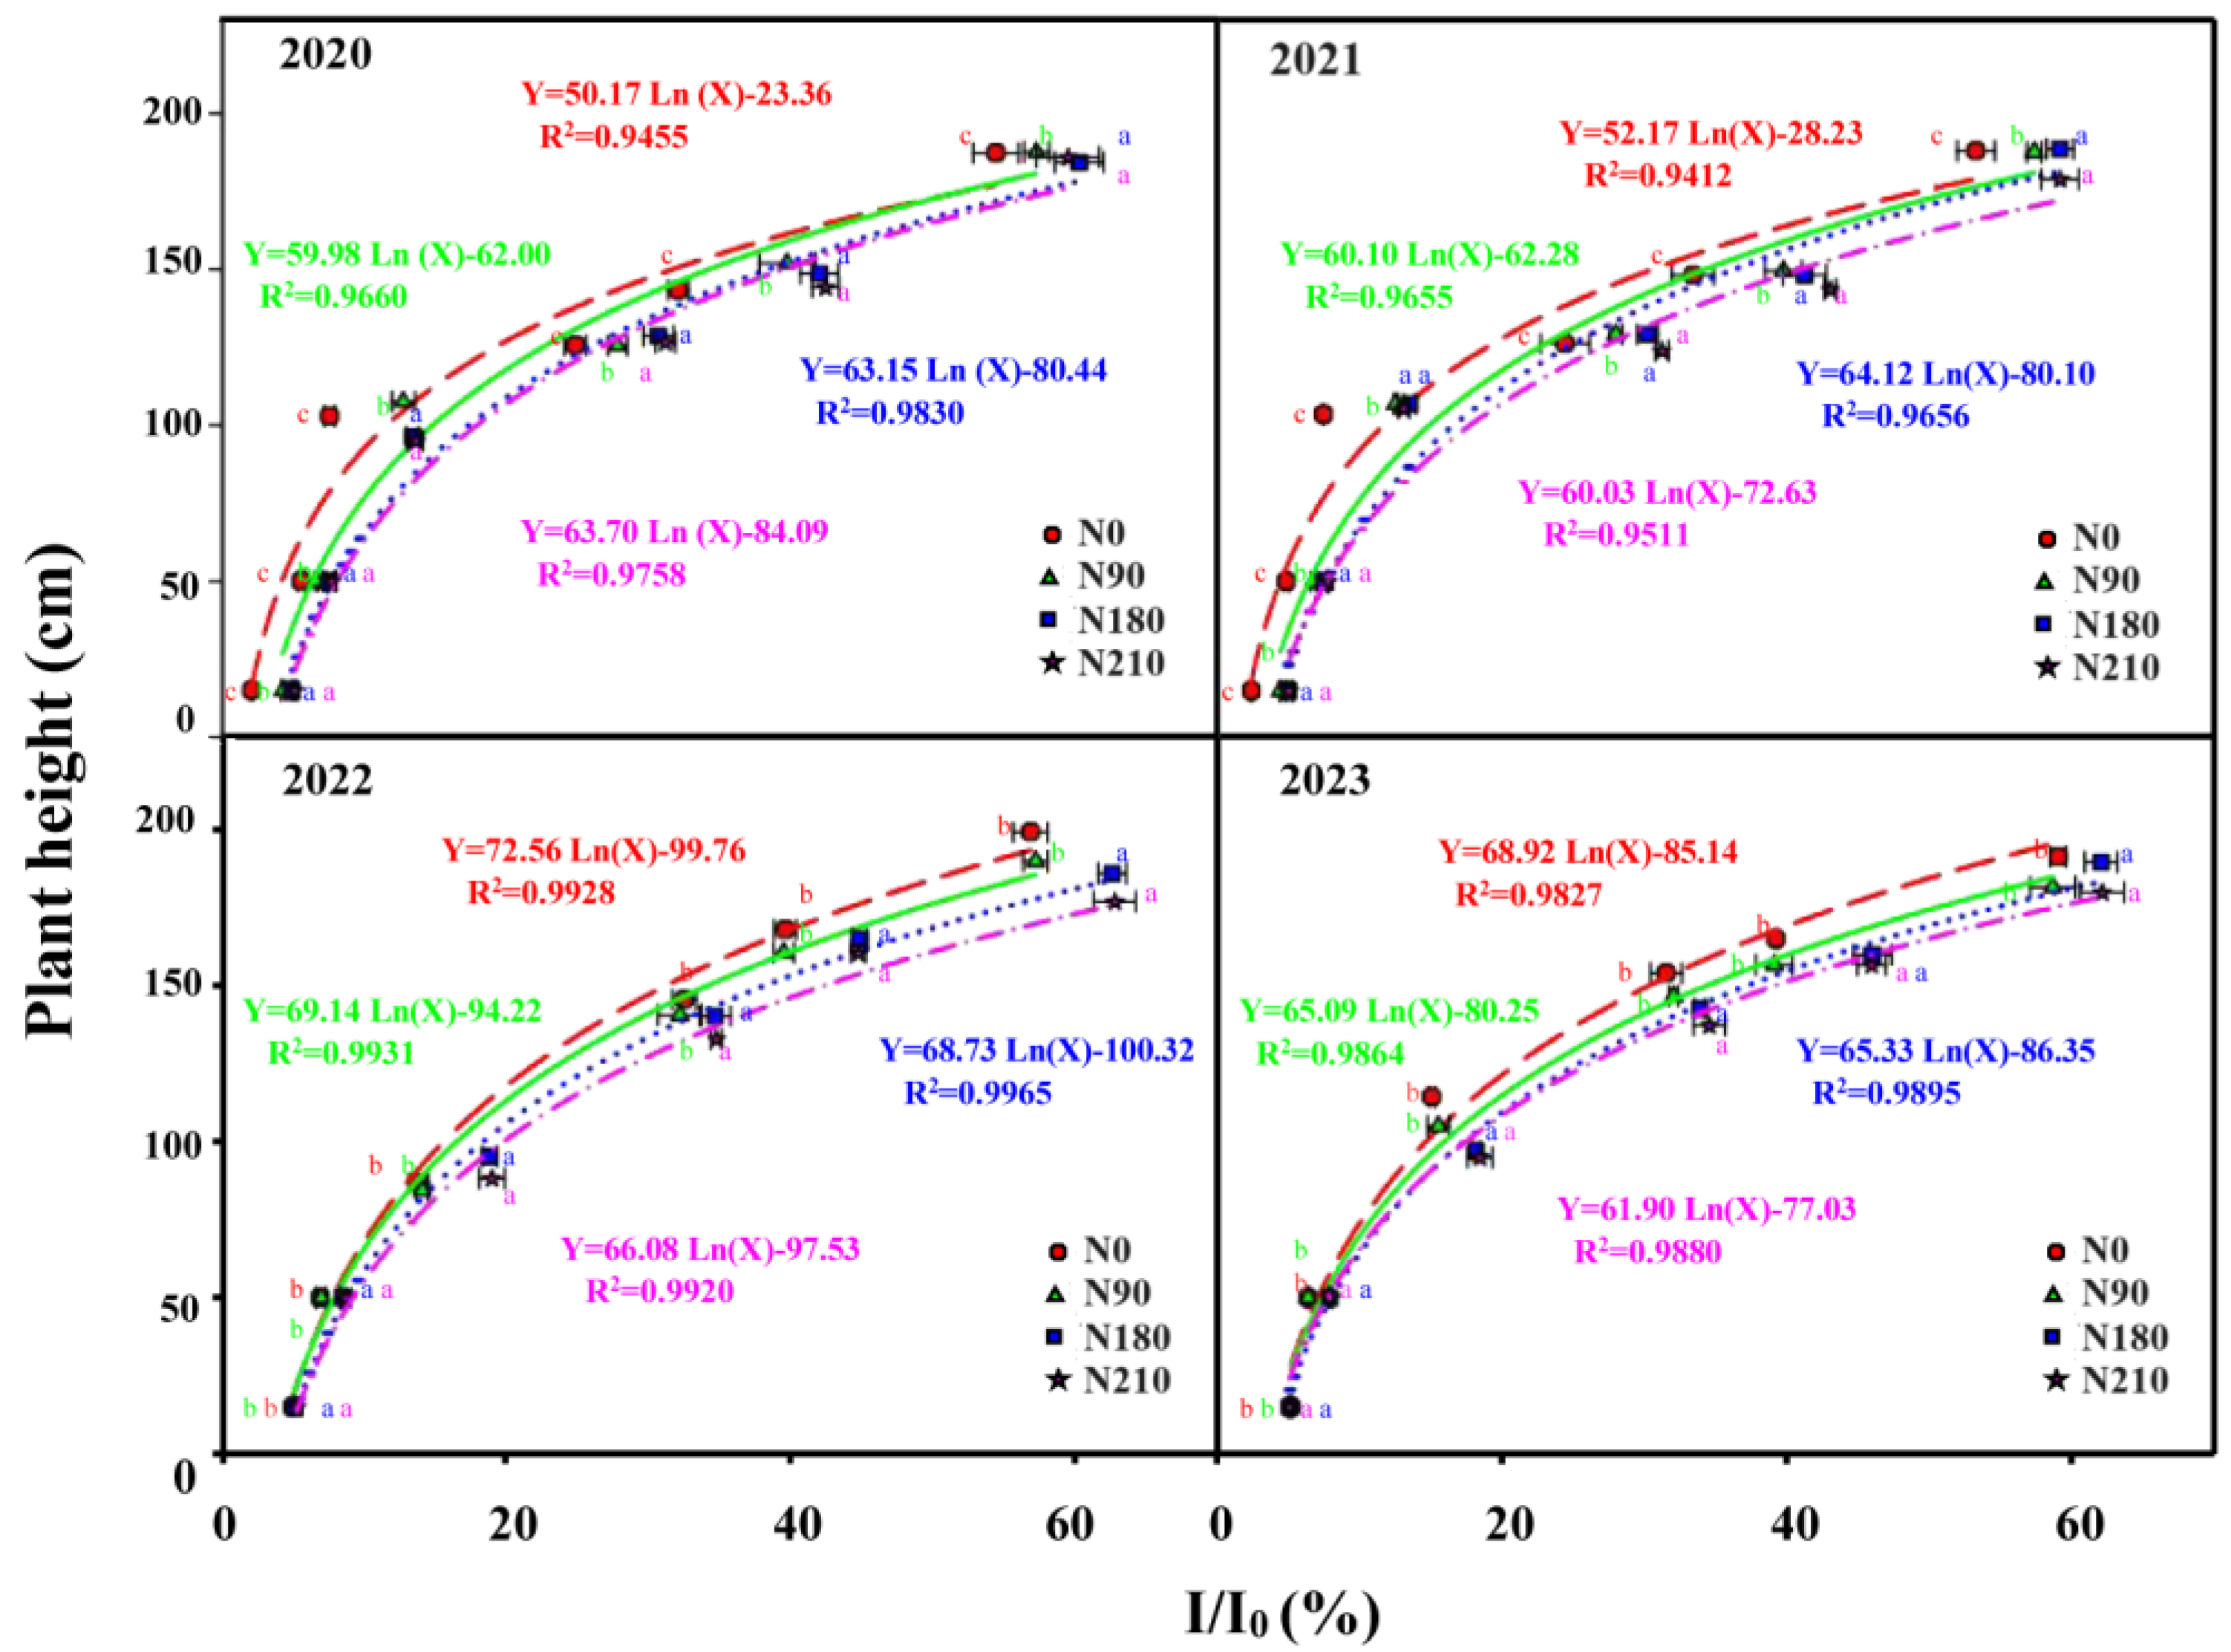
3.1. Effects of N Application on Agronomic Management and Light Distribution

The photosynthetically active radiation (PAR) declined in a logarithmic curve as the vertical height decreased under each N treatment throughout the silking stage (Figure 3). Under N-treated groups (N90, N180, and N210), the average PAR of panicle leaves at all levels was 34.7%, 57.0%, and 61.6%, respectively. At a significant level of p < 0.05, N210 was determined to be higher than the N0 level. There was not much of a difference between N0 and N90, but N0 was noticeably higher than N90. Furthermore, N210 PAR was significantly greater than both N0 and N90, while neither N0 nor N90 nor N180 differed significantly from N0.
In accordance with the Lambert–Beer law: I = I0 exp(−KL × F) (Figure 4), the cumulative leaf area index (LAI) rose during the spinning stage in response to photosynthesized active radiation (PAR). These results show that under N210, the PAR was higher than under conventional planting methods in the upper, middle, and lower areas of N0, N90, and N180 plants under the same LAI. N0, N90, N180, and N210 had average extinction coefficients of 0.530, 11.8%, 17.5%, and 18.8%, respectively. N180 was shown to have a higher extinction coefficient than the other treatments based on these results. The top, middle, and lower PAR were all higher under N210, but there was no appreciable change between N0 and N90. The average extinction of N180 and N210 for four years was 19.0% higher than that of N180 and N210 (0.521 and 0.523), respectively.

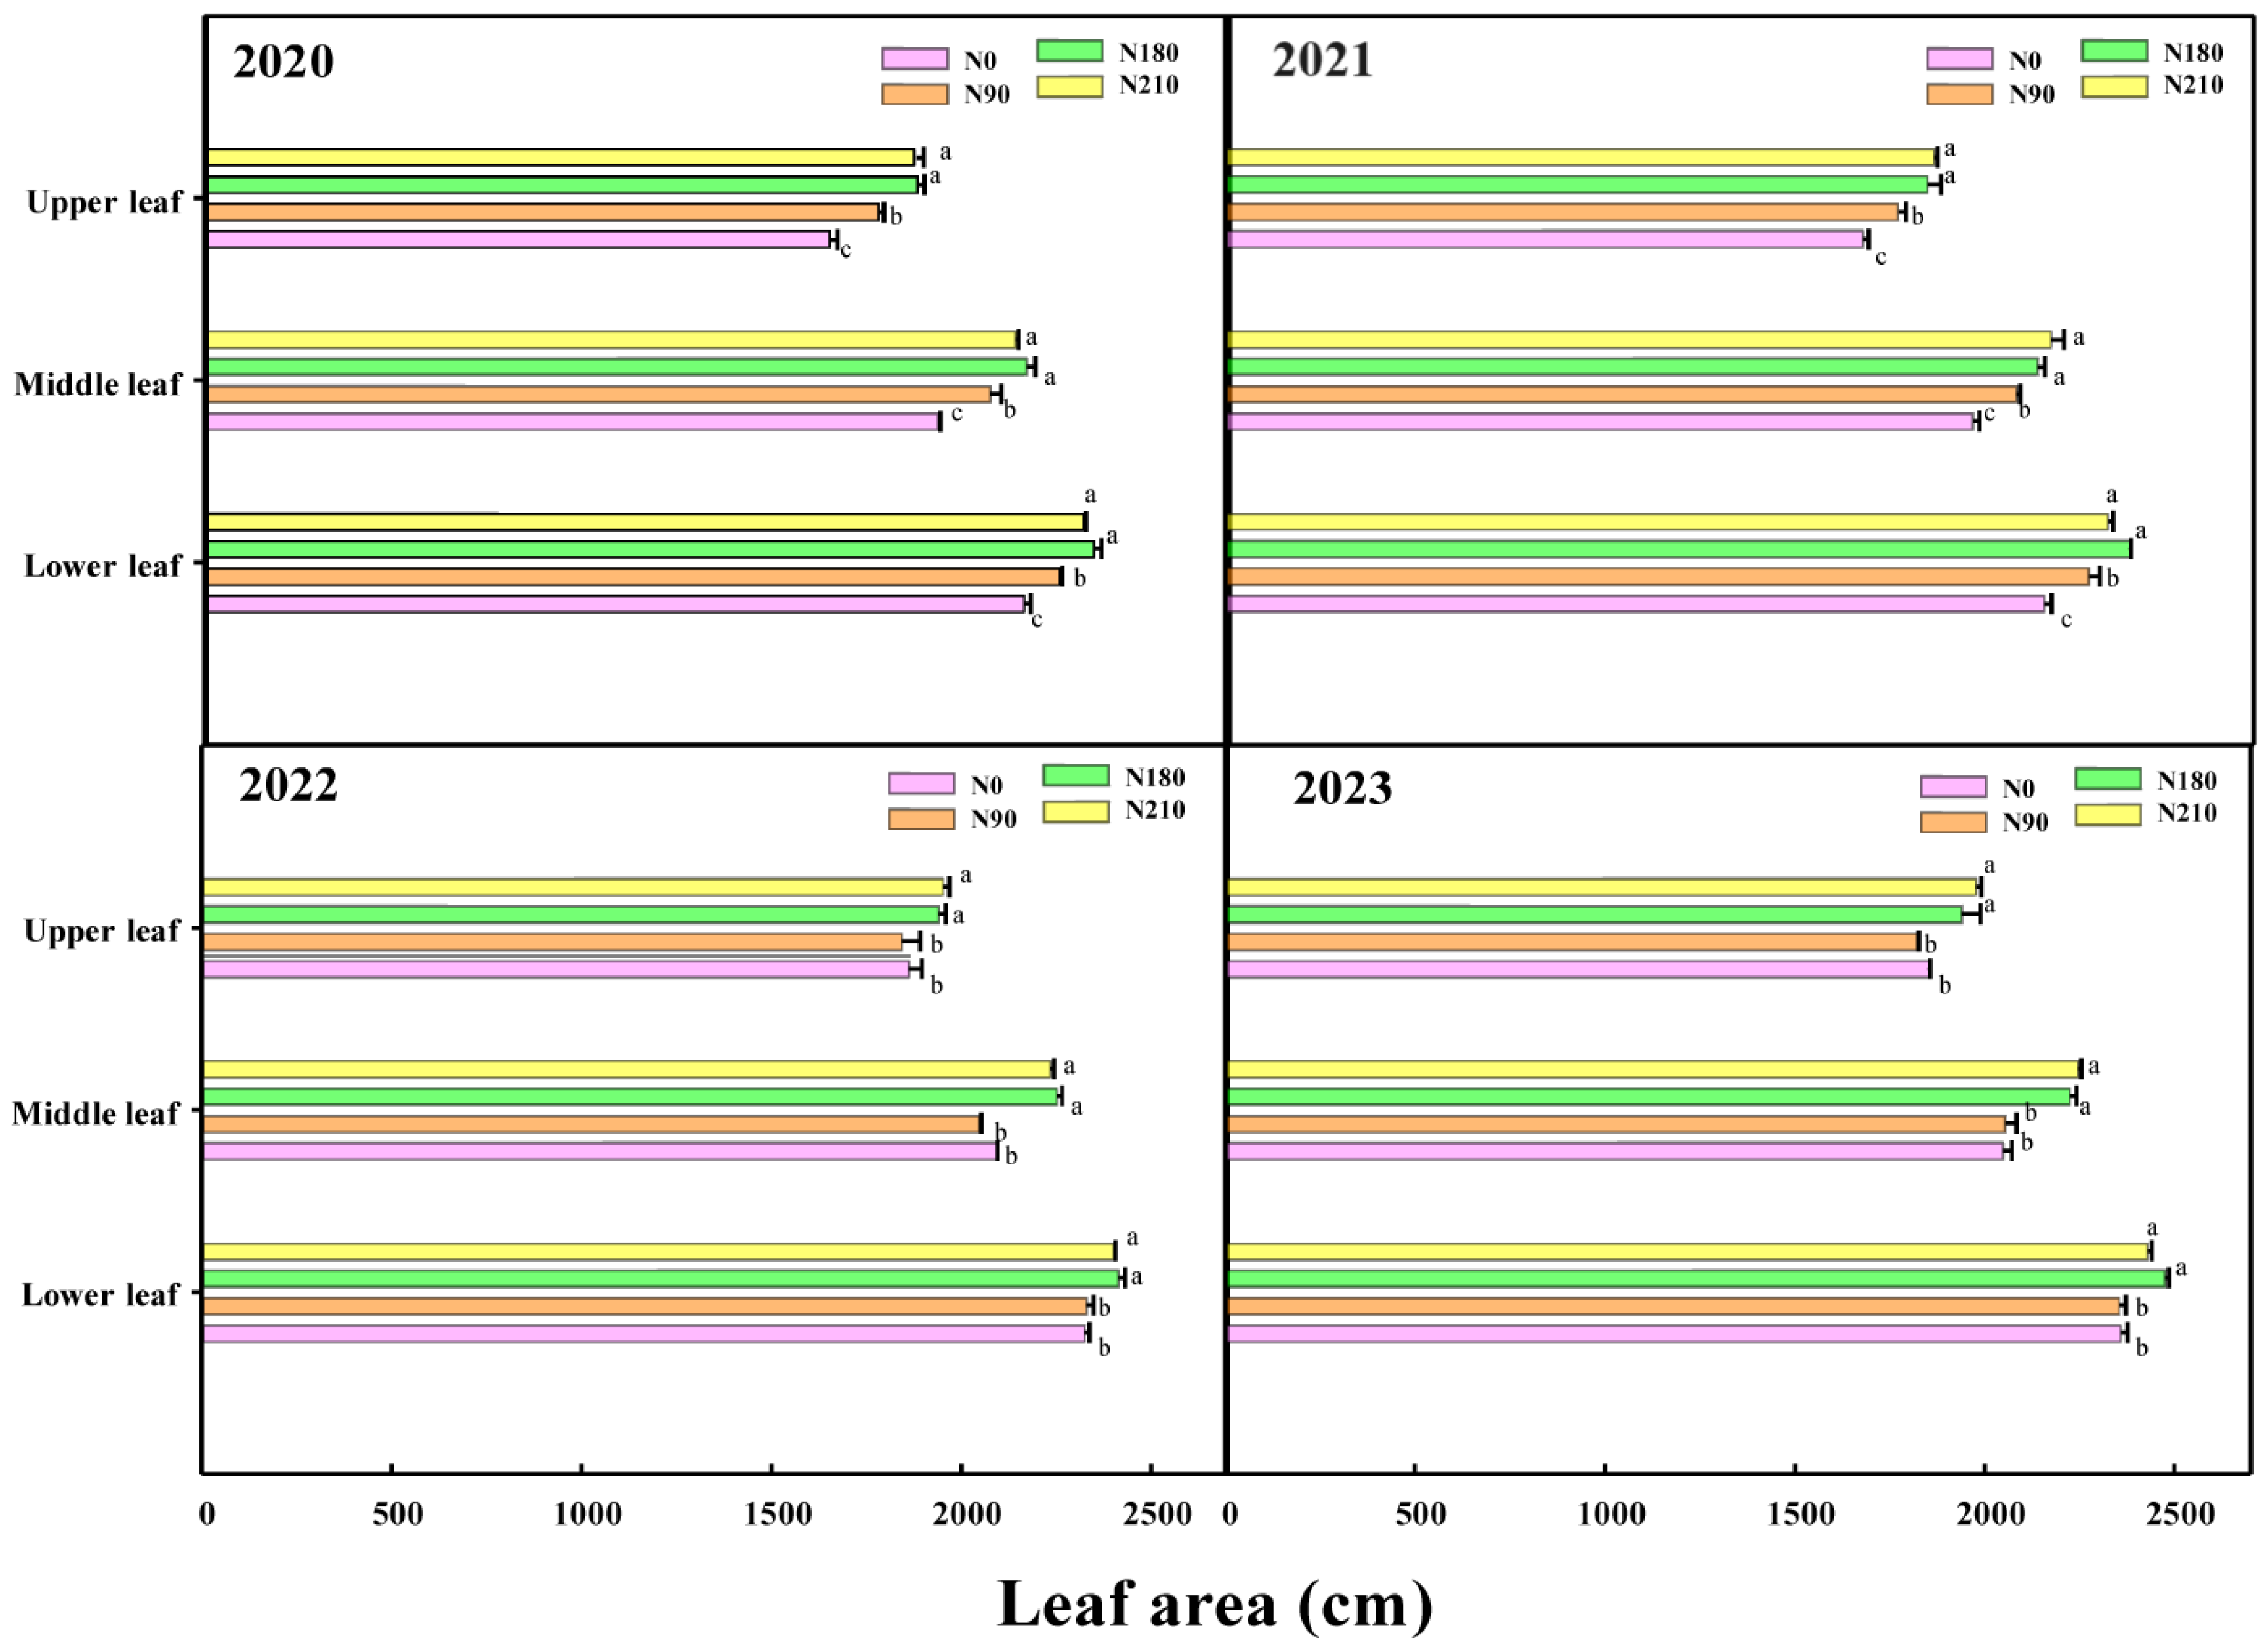
3.2. Effects of Different N Applications on Leaf Area

Each layer under N0 had a smaller leaf area than the other treatment groups throughout the silk-producing stage; the middle layer’s leaf area was smaller than the lower layer’s leaf (Figure 5). In contrast to treatments N90, N180, and N0, the leaf area of each layer rose after N210; however, N0 did not change much. There was no discernible difference in the leaf area of the can’s layers under N180 and N210. Under N180 conditions, the leaf area of each layer was smaller than under N210 conditions.

3.3. Effects of N Application on Photosynthetic Carbon Assimilation

The net photosynthetic rate (Pn), photosynthetic N-use efficiency (PNUE), and photosynthetic production all declined throughout the spinning stage as the leaf position dropped (Figures S1 and S2). Under N90, N180, and N210, the Pn and PNUE of the leaves in each layer considerably increased compared to those under N0. Under N90, N180, and N210, the Pn of the upper, middle, and bottom layers of leaves rose by 29.6%, 32.2%, and 71.6%, respectively, while the PNUE increased by 11.5%, 17.1%, and 36.0%.
The photosynthetic output of each leaf layer dramatically dropped with increasing density (Figure S3). N90, N180, and N210 did not differ significantly from one another, and all were significantly higher than N0. Under the N90, N180, and N210, the top, middle, and lower leaves, the average Pn increased by 47.8%, 44.4%, and 82.8%, and the photosynthetic N use efficiency (PNUE) of the top, middle, and lower leaves increased by 22.0%, 22.1%, and 25.2%, respectively. The results demonstrated that dense planting in N210 significantly increased photosynthetic productivity.

3.4. Effects of Different N Applications on Dry Matter Accumulation

The dry matter accumulation of leaves achieved the maximum under N180 and N210, while that under N90 was not significant compared with that under N0 (Figure 6). The biannual dry matter accumulation of leaves under N180, and N210 were 0.38 and 0.69 kg ha−1, noted to be more than that under N90, respectively. The total dry matter accumulation of leaves treated with N180 and N210 did not differ significantly from that under N0 and N90, respectively. The biannual mean value of the total dry matter accumulation of leaves treated with N210 in the segment was 0.24 kg ha−1 higher than that of other treated groups. Each layer’s leaf weight ratio was noticeably greater after N90, N180, and N210 treatments than under N0 treatment (Figure 7).
The average specific leaf weight of the upper, middle, and lower layers of the N180, and N210 increased by 11.0% and 14.1%, respectively. The dry matter accumulation under N180 and N210 increased by 19.9% and 20.0% respectively. Under N210, the dry matter accumulation of the population was significantly higher.

3.5. Effects of N Application on the Grain Yield and Yield Components in the Growth Period of Maize

Nitrogen usage efficiency (NUE) and nitogen internal efficiency (NIE) exhibit variances from the year 2020 to 2021. The treated group N180 was substantially higher (Table 1). Additionally, the partial factor productivity for nitrogen (PFPN) was higher, but Nitrogen recovery efficiency (NRE) experienced no significant variation between the years. Both the nitrogen use efficiency and yield measures were significantly impacted by the population arrangement. The yield and PFPN of N90, N180, and N210 were 2.8%, 9.5%, and 9.4% higher than that of N0, respectively, and their nitrogen use efficiency and yield were considerably greater than those of N0. There was no discernible difference between N0 and N90 in 2022–2023, although NUE under N90, N180, and N210 treatments was 55.2%, 54.2%, and 16.0% higher than that under N0, and NIE was 39.8%, 38.4%, and 12.0% higher than that under N210, respectively. According to the nitrogen use efficiency (NUE), nitrogen recovery efficiency (NRE), nitrogen internal efficiency (NIE), and partial factor productivity of nitrogen (PFPN) under different nitrogen (N) application rates (N0, N90, N180, N210), the NIE of N180 was significantly higher than that of N210, the NUE and NRE of N180 and N210 were 44.2% and 44.0% higher than those of N0, and the difference from PFPN was not significant.

4. Discussion

A large number of studies about the distribution of light are uneven. The difference in photosynthesis caused by light distribution is far greater than that caused by other factors, and the light intensity is the dominant factor determining the photosynthetic rate [22,23]. The specific leaf N content was as follow: upper leaf > middle leaf > lower leaf, and there was no significant difference between the upper leaf and middle leaf, both of which were significantly higher than the lower leaf [23]. To achieve a yield increase and efficiency through high-density planting under limited N fertilizer input, it is necessary to further explore the light N utilization potential [24]. The N accumulation in leaves increased first and then decreased with the decrease in the leaf position, but there was no significant difference in N accumulation between the ear leaf and upper leaf. The N content decreases rapidly with the increase in the cumulative leaf area, which is consistent with the distribution law in the maize [25]. The distribution of the light population is mainly determined by the canopy structure in which leaves play the most important role, which is closely related to the light distribution and utilization of light energy [26]. The vertical gradient of N content in leaves is one of the important factors determining vegetation productivity [27]. The specific leaf N content was in the order of upper leaf > middle leaf > lower leaf, and the difference between the upper leaf and middle leaf was not significant but significantly higher than that of the lower leaf, which was consistent. The structural characteristics have a great influence on the vertical distribution of light and N, while the function yield is affected by many factors [28]. There was an increase in the N leaf area, photosynthesis, dry matter accumulation, and light interception of the population, but the photosynthesis could not be further improved when the canopy reached the full amount of light interception [29]. When the density is high, the N content decreases rapidly with the increase in the cumulative leaf area, and the vertical gradient of N increases with the increase in the density, which is consistent with the distribution law in the planting density increases [26,27,28,29,30].
The smaller stem and leaf angle can provide better light conditions in the lower part, thus accommodating a larger population [31]. The middle blade is the main functional blade for material production. When the upper blade is compact, the middle blade can receive more light radiation [32]. The population light transmittance of crops at different levels and the upper and bottom light transmittance of compact varieties were higher than that of flat varieties, but there was little difference in the middle layer light transmittance [33]. More light in the upper part of the leaves leaks into the middle or even the bottom leaves such that the shade degree of the lower leaves of the population is weakened [34]. It was found that the light interception rate of the compact population was significantly higher than that of flat varieties of the upper part of the plant, and the lower part is less transparent. The light distribution in compact varieties was deep, uniform, and reasonable, and the light transmittance of most varieties was above 20% at ear position and leaf position [35,36]. The N concentration increased with the increase in the canopy height at the silk-spinning stage, which was consistent with the change in light radiation. Therefore, it was believed that a variety with upright leaves and higher N uptake after flowering could coordinate and optimize the distribution of light radiation and different N canopy levels, thus improving the high-density condition yield and NUE. A reasonable structure under high density was established, the light interception ability and photosynthetic performance were improved, and the yield was ultimately increased [37,38]. The light transmittance and interception in the middle and upper parts were significantly higher. The research showed that the light transmittance of each layer was significantly increased by expanding and shrinking plant pairs, and the increase in the light transmittance of the panicle layer was smaller than that of the bottom layer [38,39]. The light transmission of the ear layer and bottom in the middle growth period under N210 was higher than that of the one-hole single plant, and the NUE was significantly increased [39,40].
The distribution of N in plant leaves will directly affect the photosynthetic rate and thus the photosynthetic NUE. The photosynthetic rate of different leaves in the canopy will depend on the incident photon flux density and the N content per unit area [41], so the distribution of light and N in the canopy will affect the photosynthesis. There was a positive correlation between the N content of leaves and the photosynthetic efficiency [40]. All factors that affect photosynthesis will affect photosynthetic N use efficiency (PNUE), and photosynthesis is affected by the leaf morphological structure and N allocation in leaves, which are closely related to the N supply level [42]. The net photosynthetic rate and photosynthetic nitrogen use efficiency of leaves showed an increasing trend with the increase in PAR and SLN, and the linear regression coefficient of SLN, Pn, and PNUE was greater than that of PAR, Pn, and PNUE, so the canopy N distribution had a greater impact on photosynthesis and photosynthetic N efficiency [43]. The quality of plant N will directly affect the photosynthetic rate, growth, and development and ultimately affect the yield and N use efficiency [44,45].
Post-flowering N assimilation and pre-flowering N redistribution are important factors affecting grain yield and NUE, and N accumulation depends on plant N assimilation [46]. There is significantly increased N accumulation in the upper part of the flowering and maturity stages and post-flowering N accumulation [47]. The N utilization rate was higher than that under N210, and the phosphorus and potassium fertilizer was also significantly improved [48]. Dense planting not only increases the N accumulation of plants but also increases the N transfer of leaves. Higher N accumulation and transfer can enhance the NUE and yield under dense planting conditions. The grain N comes from post-anthesis N absorption and the part comes from pre-anthesis N transfer. Therefore, improving photosynthetic efficiency per unit PNUE is an effective way to improve the crop yield and NUE [49]. PNUE was significantly affected by the light N matching degree in the canopy. The light N matching coefficient was significantly correlated with Pn, leaf N accumulation, dry matter accumulation, pre-anthesis N accumulation, post-anthesis N accumulation, total N accumulation, grain, and leaf N transfer capacity. The better combination of light and N matching, the higher photosynthetic NUE and N physiological efficiency, and the higher NUE are mainly determined by N physiological efficiency [41]. N210 significantly changed the degree of light N under both densities, making the light N coefficient closer to the ideal value, thereby improving the PNUE and N physiological efficiency. The N degree of light and N were positively correlated with photosynthetic NUE and N physiological efficiency. The increase in the yield under dense planting conditions was due to the higher nitrogen accumulation and N transfer in leaves, better light N, and higher photosynthetic NUE and physiological NUE.
N will affect the structure of the population and thus affect the distribution and utilization of light [50]. The light energy interception rate and leaf N concentration were displayed as upper layer > middle layer > lower layer. With the increase in density, the light energy interception rate and leaf N concentration in the upper layer continuously increased, while the light energy interception rate and leaf N concentration in the middle layer and lower layer continuously decreased [51]. Among them plants can significantly affect the dry matter accumulation and photosynthetic characteristics of summer, significantly increase the net photosynthetic rate, key photosynthetic enzyme activity, and chlorophyll content of summer leaves, and increase the dry matter transfer to grain, thus significantly increasing the yield and providing a new method for the high-yield cultivation of maize [41,50]. At the same time, increasing broadband width can make full use of the marginal effects of side rows, expand the photosynthetic area, increase the photo-synthetically active radiation of the ear leaf layer, increase the population photosynthetic rate, and reduce the population respiratory consumption, thus increasing the grain yield [51,52]. The changing N would make the light transmission of each layer higher than that of the conventional acquiesced case and significantly increase each layer, thus making the distribution of light quality more reasonable [53]. NUE significantly improved the N harvest index and total N accumulation in the N transfer in leaves and NUE, thus promoting the improvement in the grain yield [41,49,50,51,52,53]. Therefore, the physiological mechanism of dense planting driving light and N to boost yield and NUE is based on the findings of this study as well as the advancement of past research. This study shows that the light transmittal, SLN, and NIE in the upper, middle, and lower layers rose most under two densities. The higher PAR distribution of the leaves in each layer of the plant drove higher at the same time after the planting mode was changed. The N optimized the structure N210, making the light-to-N distribution more acceptable and improved. Consequently, in N, the lower leaves will be transported to the upper leaves in order to maintain the overall high photosynthetic rate. These findings demonstrated that the increased SLN content, which was noticeably higher than that in lower canopy leaves, was driven by the higher PAR distribution in upper and intermediate canopy leaves. The light transmittance and PAR above the spike of the high-density N180 were much higher than those of the N210. Furthermore, N210 had a higher potential for light energy efficiency and better light dispersion because of its bigger lower leaf area, which also resulted in a larger overall light intercept rate. Based on this investigation, it was discovered that, under high-density and N210 conditions, the light transmissibility of the ear leaf of N210 was as high as 24.7%, indicating that N210 could coordinate the light N distribution at each layer, there by improving the light NUE under high-density conditions.

5. Conclusions

From the present investigation, it is obvious that nitrogen fertilizer greatly changes canopy light distribution and photosynthetic efficiency. Under the same leaf area index (LAI), N210 displayed greater photo synthetically active radiation (PAR) distribution over the upper, middle, and lower canopy regions compared to conventional planting methods, boosting overall light utilization. Furthermore, N180 showed a higher extinction coefficient, suggesting that the top canopy layers were better at capturing light. The impacts were particularly noticeable under N210, where a significant improvement in photosynthetic efficiency over N0 was caused by an enhanced PAR distribution. These results emphasize how crucial it is to improve light interception, canopy photosynthesis, and total crop output by optimizing N application rates (such as N180 and N210). Some suggestions for future work could build on this study and further advance the understanding of nitrogen fertilization, canopy light distribution, and photosynthetic efficiency. Field trials should be conducted to determine the economic and environmental optimal N rate for different crops and environments. This would involve testing a wider range of N levels (e.g., N150, N200, N250) to identify the point at which additional N no longer provides significant yield or efficiency gains.

Supplementary Materials

The following supporting information can be downloaded at: https://www.mdpi.com/article/10.3390/atmos16040373/s1, Figure S1: Effects of N application on net photosynthetic rate of maize.; Figure S2: Effects of N application on photosynthetic nitrogen use efficiency of maize: Figure S3: Effects of N application on photosynthetic productivity of maize.

Author Contributions

Conceptualization, M.F.S. and H.N.; methodology, H.N.; software, F.N.; validation, C.L., Y.F. and M.F.S.; formal analysis, Z.L.; investigation, Y.H.; resources, H.N.; data curation, H.N.; writing—original draft preparation, H.N. and M.F.S.; writing—review and editing, H.Z.; visualization, F.N.; supervision, Y.F.; project administration, H.N. and M.F.S.; funding acquisition, H.N. All authors have read and agreed to the published version of the manuscript.

Funding

The authors are thankful to Researchers Supporting Project number (RSPD2025R751), King Saud University, Riyadh, Saudi Arabia for the financial support of this study.

Institutional Review Board Statement

Not applicable.

Informed Consent Statement

Not applicable.

Data Availability Statement

Data is contained within the article or Supplementary Material.

Conflicts of Interest

The authors declare no conflicts of interest.

References

  1. Noor, H. Morphological and physiological root traits and expression of the gene relationship with nitrogen uptake in Wheat (Triticum aestivum L.). Turk. J. Agric. For. 2024, 48, 1034–1051. [Google Scholar] [CrossRef]
  2. Bertheiloot, J.; Martre, P.; Andriue, B. Dynamics of light and nitrogen distribution during grain filling within wheat canopy. Plant Physiol. 2008, 148, 1707–1720. [Google Scholar] [CrossRef] [PubMed]
  3. Gu, J.; Chen, Y.; Zhang, H. Canopy light and nitrogen distributions are related to grain yield and nitrogen use efficiency in rice. Field Crops Res. 2017, 206, 74–85. [Google Scholar]
  4. Li, H.L.; Zhao, C.J.; Huang, W.J. Non-uniform vertical nitrogen distribution within plant canopy and its estimation by remote sensing: A review. Field Crops Res. 2013, 142, 75–84. [Google Scholar] [CrossRef]
  5. Zhao, J.; Yang, X.; Lin, X. Radiation Interception and Use Efficiency Contributes to Higher Yields of Newer Maize Hybrids in Northeast China. Agron. J. 2015, 107, 1473–1480. [Google Scholar] [CrossRef]
  6. Wu, A.; Hammer, G.L.; Doherty, A. Quantifying impacts of enhancing photosynthesis on crop yield. Nat. Plants 2019, 5, 380–388. [Google Scholar] [CrossRef]
  7. Dreccer, M.F.; van Oijen, M.; Schapendonk, A.H.; Pot, C.S.; Rabbinge, R. Dynamics of Vertical Leaf Nitrogen Distribution in a Vegetative Wheat Canopy. Impact on Canopy Photosynthesis. Ann. Bot. 2000, 86, 23. [Google Scholar] [CrossRef]
  8. Drouet, J.-L.; Bonhomme, R. Effect of 3D Nitrogen, Dry Mass per Area and Local Irradiance on Canopy Photosynthesis Within Leaves of Contrasted Heterogeneous Maize Crops. Ann. Bot. 2004, 93, 699–710. [Google Scholar] [CrossRef]
  9. Tatsuhiko, S.; Sinclair, T.R. Distribution of Nitrogen among Leaves in Soybean Canopies. Crop Sci. 1993, 33, 804–808. [Google Scholar]
  10. Hirose, T.; Werger, M.J.A.; Pons, T.L.; van Rheenen, J.W.A. Canopy Structure and Leaf Nitrogen Distribution in a Stand of Lysimachia vulgaris L. as Influenced by Stand Density. Oecologia 1988, 77, 145–150. [Google Scholar] [CrossRef]
  11. Sadras, V.O.; Hall, A.J.; Connor, D.J. Light-associated nitrogen distribution profile in flowering canopies of sunflower. Oecologia 1993, 95, 488–494. [Google Scholar] [CrossRef] [PubMed]
  12. Mu, X.; Chen, Q.; Chen, F. Dynamic remobilization of leaf nitrogen components in relation to photosynthetic rate during grain filling in maize. Plant Physiol. Biochem. 2018, 129, 874–882. [Google Scholar] [CrossRef]
  13. Huber, D.J.; Nevins, D.J. Autolysis of the cell wall β-D-glucan in corn coleoptiles. Plant Cell Physiol. 1979, 20, 201–212. [Google Scholar]
  14. Peng, L.; Ma, J.; Chi, W. Low PSII accumulation is involved in efficient assembly of photosystem II in arabidopsis thaliana. Plant Cell Online 2006, 18, 955–969. [Google Scholar]
  15. Zhang, L.; Paakkarinen, V.; Wijk, K.J.V. Co-Translational Assembly of the D1 Protein into Photosystem II. J. Biol. Chem. 1999, 274, 16062–16067. [Google Scholar]
  16. Duvick, D.N. Genetic progress in yield of United States maize (Zea mays L.). Maydica 2005, 50, 193–202. [Google Scholar]
  17. Li, C.; Li, Y.; Shi, Y. Genetic Control of the Leaf Angle and Leaf Orientation Value as Revealed by Ultra-High Density Maps in Three Connected Maize Populations. PLoS ONE 2015, 10, e0121624. [Google Scholar]
  18. Zhu, L.; Li, M.; Yang, W.; Zhang, J.; Yang, X.; Zhang, Q.; Wang, H. Effects of Different Drying Methods on Drying Characteristics and Quality of Glycyrrhiza uralensis (Licorice). Foods 2023, 12, 1652. [Google Scholar] [CrossRef]
  19. Li, W.; Fang, H.; Wei, S.; Weiss, M.; Baret, F. Critical analysis of methods to estimate the fraction of absorbed or intercepted photosynthetically active radiation from ground measurements: Application to rice crops. Agric. For. Meteorol. 2021, 297, 108273. [Google Scholar]
  20. Vazin, F.; Madani, A.; Hassanzadeh, M. Modeling Light Interception and Distribution in Mixed Canopy of Redroot Pigweed (Amaranthus retroflexus) in Competition with Corn (Zea mays L.). Planta Daninha 2010, 28, 455–462. [Google Scholar]
  21. Austin, R.B. Genetic variation in photosynthesis. J. Agric. Sci. 1989, 112, 287–294. [Google Scholar]
  22. Ghannoum, O.; Evans, J.R.; Chow, W.S.; Andrews, T.J.; Conroy, J.P.; von Caemmerer, S. Faster Rubisco is the key to superior nitrogen-use efficiency in NADP-malic enzyme relative to NAD-malic enzyme C4 grasses. Plant Physiol. 2005, 137, 638–650. [Google Scholar]
  23. Moll, R.H.; Kamprath, E.J.; Jackson, W.A. Analysis and Interpretation of Factors Which Contribute to Efficiency of Nitrogen Utilization1. Agron. J. 1982, 74, 562–564. [Google Scholar]
  24. Hirel, B.; Le Gouis, J.; Ney, B. The challenge of improving nitrogen use efficiency in crop plants: Towards a more central role for genetic variability and quantitative genetics within integrated approaches. Exp. Bot. 2007, 58, 2369–2387. [Google Scholar]
  25. Mu, X.; Chen, Q.; Chen, F.; Yuan, L.; Mi, G. Within-Leaf nitrogen allocation in adaptation to low nitrogen supply in maize during grain-filling stage. Front. Plant Sci. 2016, 7, 699. [Google Scholar]
  26. Sinclair, T.R.; Horie, T. Leaf Nitrogen, Photosynthesis, and Crop Radiation Use Efficiency: A Review. Crop Sci. 1989, 29, 90–98. [Google Scholar] [CrossRef]
  27. Vos, J.; Putten, P.E.L.V.D.; Birch, C.J. Effect of nitrogen supply on leaf appearance, leaf growth, leaf nitrogen economy and photosynthetic capacity in maize (Zea mays L.). Field Crops Res. 2005, 93, 64–73. [Google Scholar] [CrossRef]
  28. Boomsma, C.R. Resource availabilty and intra-specific competition in maize: A per-plant and canopy-level morpho- and eco-physiological analysis. Diss. Theses Gradworks 2009, 7, 38–40. [Google Scholar]
  29. Wu, W.-M.; Chen, H.-J.; Wang, S.-J.; Wei, F.-Z.; Li, J.-C. Effects of Nitrogen Fertilization Application Regime on Dry Matter, Nitrogen Accumulation and Transportation in Summer Maize under Waterlogging at the Seedling Stage. Acta Agron. Sin. 2015, 41, 1246. [Google Scholar]
  30. Fageria, N.K.; Baligar, V.C. Enhancing Nitrogen Use Efficiency in Crop Plants. Adv. Agron. 2005, 88, 97–185. [Google Scholar]
  31. Yang, X.; Dong, G.; Palaniappan, K.; Mi, G.; Baskin, T.I. Temperature-compensated cell production rate and elongation zone length in the root of Arabidopsis thaliana. Plant Cell Environ. 2017, 40, 264–276. [Google Scholar] [PubMed]
  32. Ali, A.A.; Xu, C.; Rogers, A. A global scale mechanistic model of photosynthetic capacity (LUNA V1.0). Geosci. Model Dev. 2016, 9, 587. [Google Scholar]
  33. Zhu, X.G.; Long, S. Optimizing the Distribution of Resources between Enzymes of Carbon Metabolism Can Dramatically Increase Photosynthetic Rate: A Numerical Simulation Using an Evolutionary Algorithm. Plant Physiol. 2007, 145, 513–526. [Google Scholar] [PubMed]
  34. Makino, A.; Sakuma, H.; Sudo, E. Differences between maize and rice in N-use efficiency for photosynthesis and protein allocation. Plant Cell Physiol. 2003, 44, 952–956. [Google Scholar]
  35. Echarte, L.; Rothstein, S.; Tollenaar, M. The Response of Leaf Photosynthesis and Dry Matter Accumulation to Nitrogen Supply in an Older and a Newer Maize Hybrid. Crop Sci. 2008, 48, 656–665. [Google Scholar]
  36. Paponov, I.A.; Engels, C. Effect of nitrogen supply on leaf traits related to photosynthesis during grain filling in two maize genotypes with different N efficienc. J. Plant Nutr. Soil Sci. 2003, 166, 756–763. [Google Scholar]
  37. Ding, L.; Wang, K.; Jiang, G. Effects of Nitrogen Deficiency on Photosynthetic Traits of Maize Hybrids Released in Different Years. Ann. Bot. 2005, 96, 925–930. [Google Scholar]
  38. Tester, M.; Langridge, P. Breeding Technologies to Increase Crop Production in a Changing World. Science 2010, 327, 818–822. [Google Scholar]
  39. Liang, S.; Yoshihira, T.; Sato, C. Grain yield responses to planting density in twin and narrow row cultivation of early cultivars in maize. Grassl. Sci. 2019, 66, 183–193. [Google Scholar]
  40. Chen, X.P.; Cui, Z.L.; Vitousek, P.M.; Cassman, K.G.; Matson, P.A.; Bai, J.S.; Meng, Q.F.; Hou, P.; Yue, S.C.; Römheld, V.; et al. Integrated soil-crop system management for food security. Proc. Natl. Acad. Sci. USA 2011, 108, 6399–6404. [Google Scholar]
  41. Grindlay, D.J.C. Towards an explanation of crop nitrogen demand based on the optimization of leaf nitrogen per unit leaf area. J. Agric. Sci. Camb. 1997, 128, 377–396. [Google Scholar] [CrossRef]
  42. Noor, H. Responses of Photosynthetic Characteristics, and Agronomic Attributes to Sowing Methods of Winter Wheat. Russ. J. Plant Physiol. 2024, 71, 147. [Google Scholar] [CrossRef]
  43. Chen, Y.; Xiao, C.; Chen, X. Characterization of the plant traits contributed to high grain yield and high grain nitrogen concentration in maize. Field Crops Res. 2014, 159, 1–9. [Google Scholar] [CrossRef]
  44. Baki, A.E.; Siefritz, F.; Man, H.M. Nitrate reductase in (Zea mays L.) under salinity. Plant Cell Environ. 2000, 23, 515–521. [Google Scholar] [CrossRef]
  45. Peng, S.; Garcia, F.V.; Laza, R.C.; Cassman, K.G. Adjustment for Specific Leaf Weight Improves Chlorophyll Meter’s Estimate of Rice Leaf Nitrogen Concentration. Agron. J. 1993, 85, 85–90. [Google Scholar] [CrossRef]
  46. Markus, L.; Katharina, S.; Hans, S. Vertical leaf nitrogen distribution in relation to nitrogen status in grassland plants. Ann. Bot. 2003, 92, 679–688. [Google Scholar]
  47. Noor, H.; Min, S.; Yu, S.; Lin, W. Different sowing methods increase the yield and quality of soil water consumption of dryland Winter wheat on the loess plateau China. Appl. Ecol. Environ. Res. 2020, 18, 8285–8308. [Google Scholar] [CrossRef]
  48. Noor, H.; Shah, A.A.; Ding, P.; Ren, A.; Sun, M.; Gao, Z. Long-Term Nutrient Cycle in Improved Grain Yield of Dryland Winter Wheat (Triticum aestivum L.) under Hydrological Process of Plant Ecosystem Distribution in the Loess Plateau of China. Plants 2023, 12, 2369. [Google Scholar] [CrossRef]
  49. Noor, H.; Wang, Q.; Fida, N. Effects of sowing methods and nitrogen rates on photosynthetic characteristics, yield and quality of winter wheat. Photosynthetica 2021, 59, 277–285. [Google Scholar] [CrossRef]
  50. Anten, N.; Schieving, F.; Werger, M. Patterns of light and nitrogen distribution in relation to whole canopy carbon gain in C3 and C4 monoand dicotyledonous species. Oecologia 1995, 101, 504–513. [Google Scholar] [CrossRef]
  51. Noor, H.; Ding, P.; Li, L.; Ren, A.; Sun, M.; Gao, Z. Effects of Nitrogen on Photosynthetic Productivity and Yield Quality of Wheat (Triticum aestivum L.). Agronomy 2023, 13, 1448. [Google Scholar] [CrossRef]
  52. Chen, Y.; Wu, D.; Mu, X.; Xiao, C.; Chen, F.; Yuan, L.; Mi, G. Vertical Distribution of Photosynthetic Nitrogen Use Efficiency and Its Response to Nitrogen in Field-Grown Maize. Crop Sci. 2016, 56, 397–399. [Google Scholar] [CrossRef]
  53. Noor, H.; Sun, M.; Algwaiz, H.I.M.; Sher, A.; Fiaz, S.; Attia, K.A.; Wani, S.H.; AlKahtani, M.D.F.; Al Husnain, L.; Lin, W.; et al. Chlorophyll fluorescence and grain filling characteristic of wheat (Triticum aestivum L.) in response to nitrogen application level. Mol. Biol. Rep. 2022, 49, 7157–7172. [Google Scholar] [CrossRef] [PubMed]
Figure 1. Schematic Diagram of Population Layout in Maize in Shanxi Taigu. High-Density Zone: Central area with closely spaced maize plants. Medium-Density Zone: Surrounding areas with moderate plant spacing. Low-Density Zone: Edges of the field with sparse plant distribution. Resource Indicators: Arrows showing N application points or sunlight direction.
Atmosphere 16 00373 g001
Figure 2. Example of identification and validation of a candidate gene involved in the control of NUE and yield in maize. Stratification during biomass sampling: Top of canopy (Incident PAR), Top laver (30 cm from the top of canopy), Upper laver (Midpoint between the bottom of the top layer and the first leaf above the ear leaf), Upper-middle leaf (The auricle of the first leaf above the ear leaf), Upper-middle layer (The auricle of the first leaf above the ear leaf), Middle layer of the auricle of the ear leaf, Lower-middle layer (The auricle of the first leaf below the ear leaf), Lower layer (Midpoint between the first leaf below the ear leaf and the top of the bottom laver), and Bottom laver (15 cm from the ground).
Atmosphere 16 00373 g002
Figure 3. Effects of N application on plant height photosynthetically active radiation (PAR) distribution. N0 (Control), N90 (Low), N180 (middle), and N210 (high) of kg N ha−1 application, respectively. Values with different letters on the same sampling day indicate significant differences at p < 0.05. Values followed different letters are significantly different (p < 0.05) between different nitrogen treatments on a given date.
Atmosphere 16 00373 g003
Figure 4. Effects of N application on light transmittance. N0 (Control), N90 (Low), N180 (middle), and N210 (high) of kg N ha−1 application, respectively. Values with different letters on the same sampling day indicate significant differences at p < 0.05. Values followed by different letters are significantly different (p < 0.05) between different nitrogen treatments on a given date.
Atmosphere 16 00373 g004
Figure 5. Effects of different N applications on leaf area. N0 (Control), N90 (Low), N180 (middle), and N210 (high) of kg N ha−1 application, respectively. Values with different letters on the same sampling day indicate significant differences at p < 0.05. Values followed by different letters are significantly different (p < 0.05) between different nitrogen treatments on a given date.
Atmosphere 16 00373 g005
Figure 6. Effects of N application on leaf dry matter accumulation. N0 (Control), N90 (Low), N180 (middle), and N210 (high) of kg N ha−1 application, respectively. Values with different letters on the same sampling day indicate significant differences at p < 0.05. Values followed by different letters are significantly different (p < 0.05) between different nitrogen treatments on a given date.
Atmosphere 16 00373 g006
Figure 7. Effects of N application on the specific leaf weight at silking. N0 (Control), N90 (Low), N180 (middle), and N210 (high) of kg N ha−1 application, respectively. Values with different letters on the same sampling day indicate significant differences at p < 0.05. Values followed by different letters are significantly different (p < 0.05) between different nitrogen treatments on a given date.
Atmosphere 16 00373 g007
Table 1. Effects of the N application on the grain yield and yield components in the growth period of maize.
TreatmentGrain Yield (kg ha−1)PFPN (kg kg−1)NUE (kg kg−1)NIE (kg kg−1)NRE (kg kg−1)
2020N013.01 b43.37 b6.49 b29.98 b0.22 a
N9013.15 b43.83 b6.59 b31.96 b0.22 a
N18013.85 a46.32 a9.44 a38.83 a0.24 a
N21013.85 a46.16 a9.28 a38.48 a0.24 a
2021N012.34 c41.44 c7.87 c22.99 c0.34 a
N9013.05 b43.48 b9.92 b27.96 b0.35 a
N18014.17 a47.25 a13.68 a36.51 a0.37 a
N21014.26 a47.54 a13.98 a37.61 a0.37 a
2022N014.71 b49.04 b8.25 b31.22 b0.27 a
N9014.85 b49.50 b8.81 b32.17 b0.27 a
N18015.42 a51.39 a10.70 a36.89 a0.29 a
N21015.45 a51.51 a10.82 a37.31 a0.29 a
2023N014.02 c46.75 c8.37 c24.15 c0.35 a
N9014.62 b48.75 b10.37 b29.03 b0.36 a
N18015.74 a52.48 a14.10 a37.65 a0.37 a
N21015.76 a52.53 a14.15 a37.79 a0.37 a
F-value
Yns**nsnsns
Nns**nsnsns
Y × Nnsnsnsnsns
Note: Year (Y), Nitrogen (N), Partial fertilizer productivity of nitrogen (PFPN), Nitrogen use efficiency (NUE), N—internal efficiency (NIE), N—recovery efficiency (NRE). The means are not significantly different within a given season when followed by the same lowercase letter using LSD at p < 0.05. “ns” and “**” indicate significant differences between the four optimal N rates at 0.01 and 0.05 probability levels, respectively. N0 (Control), N90 (Low), N180 (middle), and N210 (high) of kg N ha−1 application, respectively. Values with different letters on the same sampling day indicate significant differences at p < 0.05. Values followed by different letters are significantly different (p < 0.05) between different nitrogen treatments on a given date.
Disclaimer/Publisher’s Note: The statements, opinions and data contained in all publications are solely those of the individual author(s) and contributor(s) and not of MDPI and/or the editor(s). MDPI and/or the editor(s) disclaim responsibility for any injury to people or property resulting from any ideas, methods, instructions or products referred to in the content.

