Abstract
PM10 emissions have been a significant concern in rock crushing and quarry operations (study site #1) and iron ore mining projects (study site #2) in certain regions of Malaysia, posing fears to the health and well-being of nearby communities with severe air pollution. To address this issue, it is crucial to develop effective mitigation strategies to reduce dust particle emissions like PM10 in the ambient air. The AERMOD model was applied to predict PM10 emissions during quarry operations and iron ore mining projects, both with and without control measures. The results indicated that PM10 emissions were reduced when control measures were implemented. The modeling result shows the mean PM10 concentration with and without control measures in study site #1 is 74.85 µg/m3 and 20,557.69 µg/m3, respectively. In comparison, the average PM10 concentration with and without control measures in study site #2 is 53.95 µg/m3 and 135.69 µg/m3. Therefore, the control measure has successfully reduced the PM10 concentrations by 99.90% and 60.24% in study sites #1 and #2, respectively, and ensures the air quality complies with the Malaysian Ambient Air Quality Guidelines (MAAQG) 24 h threshold limits at 100 µg/m3. In addition, the AERMOD modeling results showed that mitigation measures performed better in rock crushing and quarry operations than in iron ore mining projects in this case study.
Keywords:
air pollution; AERMOD model; air quality; rock crushing; quarry operation; iron ore mining 1. Introduction
Air pollution is a pervasive global issue, significantly impacting human health and environmental sustainability [1]. Exposure to air pollutants can lead to various health consequences, including acute and chronic effects on respiratory and cardiovascular systems [2]. Among the various pollutants, particulate matter, particularly PM10 and PM2.5, poses significant risks to human health due to its ability to penetrate deep into the respiratory system. PM10 particles, being small enough to be inhaled, are associated with severe respiratory conditions, asthma exacerbation, and increased risk of cardiovascular diseases [3]. These risks are particularly pronounced in regions with active industrial activities, such as quarry operations and iron ore mining, where local populations are frequently exposed to elevated levels of airborne particulates.
Quarrying and mining activities, including rock crushing, drilling, blasting, and material handling, are primary sources of dust emissions. These emissions degrade air quality and affect surrounding ecosystems, including soil and water bodies. As Malaysia continues to experience rapid urbanization and industrial growth, the expansion of quarrying and mining activities is expected to exacerbate PM10 emissions. Similar challenges have been documented in coal mining, where poor dust management practices contribute significantly to particulate matter pollution [4]. These emissions threaten public health and environmental quality severely without adequate mitigation measures.
The methods employed in quarrying and mining vary depending on the characteristics of the deposit but often involve processes such as crushing, screening, material handling, and storage operations. These processes can generate substantial dust, mainly if emission control measures are inadequate. Dust suppression strategies, such as water spraying, chemical dust suppressants, and enclosed processing systems, are critical for minimizing emissions. Implementing such measures early in the operational phase can prevent adverse environmental and health impacts from escalating.
In Malaysia, vehicular emissions and industrial activities further compound air quality challenges. These issues are closely intertwined with climate change, as shifting weather patterns and rising temperatures influence air pollutants’ dispersion and chemical transformation [5]. Addressing PM10 emissions is integral to advancing air quality management and mitigating climate change impacts.
Global frameworks such as the United Nations Sustainable Development Goals (SDGs) provide a structured approach to tackling these challenges. Specifically, SDG 3 (Good Health and Well-Being), SDG 11 (Sustainable Cities and Communities), and SDG 13 (Climate Action) emphasize the need to reduce pollution and promote sustainable industrial practices [6]. By aligning research and industrial operations with these goals, stakeholders can achieve long-term environmental sustainability and community well-being.
Atmospheric dispersion models are indispensable tools for evaluating the impact of air pollution and developing mitigation strategies. Among these, the American Meteorological Society–Environmental Protection Agency Regulatory Model (AERMOD), developed by the U.S. Environmental Protection Agency [7], is widely regarded for its robust capabilities in modeling pollutant dispersion under diverse meteorological and topographical conditions [8]. AERMOD has been extensively validated and applied to various industrial contexts, making it a reliable framework for assessing PM10 emissions and evaluating the effectiveness of control measures.
This study utilizes the AERMOD model to assess PM10 emissions from two industrial case studies in Malaysia: a rock quarry operation and an iron ore mining project. The research compares emissions under two scenarios: with and without the implementation of dust control measures. By providing localized and accurate predictions, the study aims to support the development of tailored strategies for managing emissions, ensuring compliance with air quality standards, and safeguarding the health and well-being of nearby communities. Additionally, this study addresses a critical gap in the existing literature on PM10 emissions in Malaysia, offering insights that can serve as a model for similar regions globally.
By integrating air quality modeling techniques, evaluating practical mitigation measures, and aligning with global sustainability goals, this research contributes to the broader objective of reducing industrial activities’ environmental and health impacts. The findings are expected to inform policymakers and industry stakeholders, guiding the development of effective regulatory standards and sustainable practices.
2. Previous and Related Works
2.1. Background of AERMOD Model
For receptors within 50 km of a source, AERMOD, a Gaussian plume, and an atmospheric dispersion model can be used in plain or complicated terrain [9]. The vertical and horizontal concentration distributions are assumed to be Gaussian in the stable boundary layer (SBL). The vertical distribution in the convective boundary layer (CBL) is characterized by a bi-Gaussian probability density function (PDF), whereas the horizontal distribution is likewise assumed to be Gaussian. Furthermore, AERMOD handles “plume lofting” in the CBL, which is the process by which some plume mass is discharged from a buoyant source and climbs to and stays close to the top of the boundary layer before blending into the CBL. To enable it to re-enter the boundary layer when and if necessary, AERMOD also monitors any plume mass that breaks through the higher stable layer. AERMOD treats the augmentation of lateral dispersion due to plume meander for sources in both the CBL and the SBL. AERMOD can incorporate current concepts about flow and dispersion into a complex terrain. Also, AERMOD eliminates the need to define intricate terrain regimes by modeling the plume as impacting or following the terrain when appropriate. In stably stratified conditions, all-terrain is handled constantly and consistently while considering dividing streamlining. Characterizing the PBL through the surface and mixed layer scaling is a significant enhancement that AERMOD offers to Gaussian atmospheric dispersion modeling [10].
Based on measurements and extrapolations of those measurements utilizing similarity (scaling) relationships, AERMOD creates vertical profiles of the necessary meteorological variables. All available meteorological observations are used to estimate vertical profiles of temperature, temperature gradient, turbulence, wind speed, and wind direction. A minimal amount of observed meteorological parameters is required for AERMOD to function. In addition, AERMOD can function with publicly available data from most National Weather Service (NWS) stations, replacing the ISC3 model. All that is needed for AERMOD is a single surface measurement of wind direction, wind speed, and ambient temperature.
Furthermore, AERMOD must monitor cloud cover, just like the ISC3 model. On the other hand, two vertical temperature readings, usually at 2 and 10 m, plus a measurement of solar radiation, can be used in the absence of cloud cover. A full morning upper air sounding is necessary to determine the convective mixing height throughout the day. Surface properties such as albedo, Bowen ratio, and surface roughness are also required to create similarity profiles of the pertinent PBL parameters. In contrast to other regulatory models, AERMOD considers the PBL’s vertical homogeneity when calculating dispersion. This is achieved by “averaging” the parameters of the real PBL into the “effective” parameters of a comparable homogenous PBL.
2.2. Comparison of AERMOD with CALPUFF Model
AERMOD and CALPUFF are the most commonly used air dispersion models worldwide [11]. The advantages of AERMOD include its being developed and maintained by the US EPA and currently designated as the preferred model, which implies that no specific approval is required for most modeling applications [12]. AERMOD also used observational meteorological data from a single weather station. The run times of the AERMOD model are typically much shorter and more computationally efficient [13]. AERMOD is a preferred model over CALPUFF due to its relatively easy-to-use, widespread regulatory acceptance, speed, and accuracy [14]. The disadvantages of AERMOD included the prediction range of only up to 50 km due to being a Gaussian plume model. They considered that the plume would never curve or change directions within a given period. In contrast, the meteorological conditions change rapidly over long distances and time scales, making the results of modeling exceeding 50 km inaccurate.
On the other hand, the advantages of CALPUFF include being a Lagrangian puff model that considers the effects of varying temporal or spatial conditions on pollution transport, transformation, and removal, thus can be used as an alternative model for prediction up to 200 km [15]. The disadvantages of CALPUFF include that it usually requires specific approval by the respective government agencies before it can be applied for modeling. CALPUFF also uses observational meteorological data from multiple weather stations and meteorological grid models, which means that preparing meteorological data for CALPUFF requires more time, expertise, and computational resources than AERMOD [16]. The run time of the CALPUFF model can be very long and computationally intensive.
2.3. Applications of the AERMOD Model
The AERMOD model has been applied successfully in predicting total suspended particulate matter (TSP) from quarry emissions in Turkey [1]. In addition, the AERMOD model predicts TSP better than a similar CALPUFF model from a quarry site located in a complicated terrain [17]. Also, the AERMOD model performed better than WindTrax in determining the PM10 emission rate at a beef cattle feedlot in the USA [18]. The AERMOD dispersion model agreed better with observed concentrations than those collected by the CALPUFF model in TSP and PM10 emissions from a quarry operation site [19].
The AERMOD model is a valuable tool for predicting emissions at a quarry site, and it can also model PM10 and PM2.5 at a poultry facility [20]. Nevertheless, the AERMOD model can model gaseous pollutants, such as the dispersion of nitrogen dioxide (NO2) from a cement complex, which shows the flexibility of the modeling tool [21]. The AERMOD model is also used to simulate the dispersion of air pollutants near a roadside location [22]. The AERMOD model is suitable for the simulation scenario with and without mitigation measures such as building wake effects [23]. Another study successfully modeled the ammonia (NH3) concentration using AERMOD software on a toll road in Indonesia [24]. The AERMOD model has also successfully simulated the increase in hazardous air pollutants (HAP) and analyzed the influence and spatial distribution of various HAP emission sources in a coastal industrial complex and port area of Taiwan [25]. The atmospheric emissions from ocean-going vessels (OGVs) in the port of South Africa were modeled to compare with the national air quality standards to evaluate health impacts [26]. Automotive manufacturing is a source of VOC emissions, leading to odor threats in nearby communities. The AERMOD application results show that VOCs can travel up to 800m from the source, and the increase in physical smokestack height by 5m from existing heights will reduce the VOCs by up to 25% [27].
3. Materials and Methods
3.1. US EPA Guideline
This study assessed the effects of background air quality, demonstrating compliance with background air quality standards. Under the US EPA Guideline on Air Quality Models (GAQM), this work adopts the AERMOD model [28]. The dispersion modeling was performed using Version 21112, December 2021, and one year of hourly meteorological data was generated using the MM5 (Fifth-Generation Penn State/NCAR Mesoscale Model). A one-year data set was processed using AERMET, the meteorological processor for AERMOD, and it complied with the revised guideline of the AERMOD model released by the US EPA.
3.2. Meteorological Data and AERMET
The quality of the meteorological and emission data significantly impacts the accuracy of air quality modeling [29]. To minimize the modeling’s margin for error, the best and most representative data were chosen. A year’s worth of weather data produced by the MM5 model for the location was used. Also, an entire morning of upper air sounding data is necessary to determine the convective mixing height throughout the day and to verify the data representativeness as the modeling data is compared with the observed data for validation. The data needed for AERMOD were processed using the most recent version of the AERMET meteorological pre-processor (Version 2112) [30]. In addition, Albedo, Bowen ratio, and surface roughness are boundary layer parameters that AERMOD uses and that the AERMET processor requires as input [31]. According to current USEPA guidelines, these parameters were established by looking at a 3 km radius around the project site. The AERMET user’s handbook was used to determine the site-specific surface roughness, albedo, and Bowen ratio values for the relevant sectors surrounding the site based on the land use classification. Assigning 00 Greenwich, Mean Time (GMT) to a time close to local dawn is required by the meteorological pre-processor, AERMET, and the upper air data produced by the MM5 Model was processed [32]. Using a USEPA-recommended process that classifies an area by predominant land use, the model’s use necessitates classifying the local (within 3 km) dispersion environment as urban or rural. This land use strategy uses 12 land use types to categorize a region. This plan designates compact residential, commercial, and industrial land use zones as urban. Rural dispersion coefficients will be utilized in the dispersion modeling analysis if more than 50% of an area within a 3 km radius of the proposed facility is designated as rural, per USEPA guidelines. On the other hand, if more than half of the region is urban, urban dispersion coefficients are applied. Since aerial photos and visual inspection revealed that the 3 km radius around the proposed facility is primarily covered by vegetation, the region surrounding the project site was considered rural for this analysis.
3.3. Local Terrain and Dispersion Options
When choosing the correct dispersion model, local topography is crucial. In the past, the available dispersion models were separated into two broad categories: simple terrain, which applied to territory below the stack top, and complex terrain, which applied to terrain above the stack top. This distinction is eliminated by AERMOD, which has been thoroughly tested on various terrain types. This enables a smooth handling of project impacts on above- and below-stack-top elevation terrain. Because the project is inland and the surrounding area is not extremely undulating, the geography’s impact on dispersion was considered in this assessment. The purpose of AERMOD is to facilitate regulatory modeling evaluations. The regulatory modeling options are chosen for the model’s mode of operation. These consist of vertical potential temperature gradients, stack-tip downwash, buoyancy-induced dispersion, final plume rise, wind profile exponent values, and a procedure for processing averages during calm winds.
3.4. Modeling and Source Parameter in Study Site #1
A thorough receptor grid was employed for the modeling. The AERMOD modeling was utilized to determine the maximum ground-level pollutant concentrations for this assessment research using a thorough cartesian receptor grid that extended to a 3 km radius from the location. This receptor grid could resolve the maximal effects and any possible central impact locations. The following receptor spacing and grid parameters make up the utilized Cartesian receptors grid:
- Project boundary to 3 km at 100 m increments
- Grid origin (UTM coordinate): X: 202042.61, Y: 351212.79
In addition to the Cartesian receptor grid, the nearest sensitive receptor, entrance road to Felda Bukit Mendi, site A3, and two discrete receptors, air quality monitoring sites A1 and A2, were selected. A1 is close to the project site, and A2 is at the entrance of the public road. Sensitive and discrete receptors with their coordinates in the UTM coordinate system are shown. Effects from emission sources were predicted at these receptors listed. Table 1 shows the sensitive/discrete receptor coordinates in study site #1.

Table 1.
Coordinates of sensitive/discrete receptors in study site #1.
Input for the AERMOD model includes emission rates of air pollutants from all the components and activities of quarrying and crushing operations. Other source information consists of the emissions’ height and each source’s type and location. Table 2 shows the modeling parameters used in the study site #1. The release height of PM10 pollutants was set at 3 m, and the sources were treated as area sources.
Table 2.
Modeling parameter in study site #1.
3.5. Modeling and Source Parameters in Study Site #2
This study employed a similar detailed Cartesian receptor grid that extended up to a 5 km radius from the site within the AERMOD modeling. This grid was designed to determine the maximum ground-level pollutant concentrations accurately. It effectively captured areas of maximum impact and other potentially significant effects. The specifications of the receptor grid are outlined below:
- 3.
- Project boundary to 5 km at 200 m increments.
- 4.
- Grid origin (UTM coordinate): X: 830455.99 m E, Y: 655028.03 m N.
In addition to the Cartesian receptor grid, four distinct receptors were selected at the following locations:
- A1: An open space in Felda Kemahang 3.
- A2: An open space in Felcra Bukit Tandak.
- A3: An open space in front of SMK Baroh Pial, along the access road leading into the project site.
- A4: An open space within the project site itself.
These discrete receptors are provided with their respective coordinates in the UTM coordinate system, as outlined below. Emission source impacts were forecasted at these specified receptors. Table 3 shows the sensitive/discrete receptor coordinates in study site #2.
Table 3.
Coordinates of sensitive/discrete receptors in study site #2.
Potential air pollution sources from iron ore and other mining activities are fugitive emissions from vehicle movements on unpaved roads, iron ore handling, and open storage piles in the mining area. The source parameters of the fugitive emissions are listed below. Table 4 shows the modeling parameters used in study site #2.
Table 4.
Modeling parameter in study site #2.
3.6. Emission Rate in Study Site #1
In this modeling assessment, the emission rate from the significant sources, the crushers, and fugitive dust from screening, conveying, and handling were computed and used as input in the AERMOD model [32]. PM10 is the only primary pollutant emitted from the quarrying and rock-crushing operation. The PM10 data were collected on site. The generally accepted percentage of dust emitted by a crushing and screening plant without any control measures is shown below. Table 5 shows the dust generation by a crushing and screening plant in study site #1.
Table 5.
Dust generation by a crushing and screening plant in study site #1.
Based on the capacity of 154 tons an hour (t/h) and an emission factor of 0.025% for the primary crusher, the potential amount of dust emitted from the primary crusher without any control measures is. The dust emitted per hour is (0.025 × 154)/100 = 0.0385 metric tons = 38.5 kg. Table 6 shows the emission rate in study site #1 without control measures.
Table 6.
Emission rate without control measures in study site #1.
For a quarry of this capacity, strict dust control measures are mandatory to reduce emissions from the sources significantly. Among the control measures proposed that are reasonable and viable include covered conveyor, covered hoppers and crushers with water sprinklers installed, enclosed screen and transfer points with water sprinklers installed, water browsers for track spraying on the access roads and open areas, and tire cleaning. In the modeling study, dust removal efficiency was set at 99.0% for the crushers and 99.0% for the fugitive sources, while the normally accepted efficiency is from 98.0 to 99.5% if the ground and rock products are kept wet and moist. Based on the above removal efficiencies and capacity of the rock quarry, the potential emission rate of the significant sources when dust control measures are shown below. Table 7 shows the emission rate of different sources with control measures in study site #1. For PM10, a ratio of 0.5 was applied to derive the emission rate of PM10. Table 8 shows the emission rate of PM10 of the sources with and without control measures in study site #1.
Table 7.
Emission rate with control measure in study site #1.
Table 8.
The emission rate of PM10 with and without control measures in study site #1.
3.7. Emission Rate in Study Site #2
The primary sources of air pollution from iron ore mining activities are fugitive emissions from vehicle movements on unpaved roads, iron ore handling, and open storage piles. When a car travels on an unpaved road, particulate emissions are released. In most exposed locations, dust clouds following vehicles on dirt roads are common. The dust emissions from a specific unpaved road segment change the traffic volume. Additionally, field studies have demonstrated that emissions depend on correction parameters that describe (a) the state of a specific road and (b) the traffic volume of the related vehicles. Along with the source activity (number of vehicles passes), other relevant parameters are the vehicle’s characteristics (e.g., weight), the characteristics of the road surface material being disturbed (e.g., moisture content, silt content), and the weather (e.g., precipitation frequency and amounts).
It has been discovered that the percentage of silt (particles smaller than 75 microns in diameter) in the road surface material directly correlates with variations in dust emissions from unpaved roads. A rural dirt road’s silt content should be determined to project emissions because it will vary depending on the location. The silt content of the local parent soil can be utilized as a conservative estimate. Tests, however, reveal that the silt content of roads is typically lower than that of the parent soil nearby because the finer particles are continuously removed by vehicle movement, leaving a more significant proportion of coarse particles. After a rainstorm, unpaved roads firm, and the primarily nonporous surface dries off rapidly. Eliminating emissions on “wet” days (greater than 0.254 mm [mm] [0.01 inches (in.)] of precipitation) may help to explain the short-term decrease in emissions brought on by precipitation. Table 9 shows the emission rate of PM10 with and without control measures in study site #2.
Table 9.
Emission rate of PM10 with and without control measures in study site #2.
The emission rates for each quarry operation activity were calculated using a combination of standard emission factors from established guidelines (e.g., USEPA) and site-specific activity rates (tons/hour). Emission rates were derived using the following formula:
Emission Rate (g/s) = [Emission Factor (kg/ton) × Activity Rate (tons/h)]/3600
A detailed breakdown of emission rates for site #2, both with and without control measures, is presented in Table 9. This clarifies how the overall reduction percentage (60.24%) was derived based on activity-specific emissions.
Dust emissions can be substantially reduced by implementing control measures, such as moistening roads with water trucks and sprinklers and maintaining rigorous housekeeping practices. These measures can achieve up to 95% efficiency in dust removal from unpaved roads. As in vehicle movement, fugitive dust is the main air pollutant of concern from iron ore mining and open storage piles. Factors influencing emissions are meteorological parameters such as wind and rainfall and iron characteristics such as moisture content and proportion of aggregate fines. Iron ore handling and open storage piles for air pollution modeling and impact assessment are considered storage piles.
Storage piles are typically left uncovered because materials must often be moved into and out of storage. The three stages of the storage cycle—material loading onto the pile, load out of the pile, and disturbance by strong wind currents—are when dust emissions from the storage heaps occur. The previous part covered the movement of vehicles in the storage pile area, which is a significant generator of dust. The volume of aggregates going through the storage cycle often affects how much dust is released during storage activities. Age, moisture content, and aggregate fines proportion determine emissions from a specific storage pile. The emission rate of PM10 dust from iron ore handling is then computed based on the above emission factor and the site’s average wind speed. However, the highest wind speed was used instead of the average wind speed to assess the worst possible emission rate. The highest wind speed is 7.02 m/s, which is used to compute the PM10 emission factor from iron ore handling.
Wind erosion of exposed regions and open aggregate storage piles within an industrial plant can produce dust emissions. Non-homogeneous surfaces impregnated with non-erodible components (big particles) are commonly used to describe these sources. Because a surface’s erosion potential is restored each time it is disturbed, emissions from wind erosion are influenced by how frequently the erodible surface is disturbed. An action that exposes new surface material is called a disturbance. This happens every time aggregate material is added to or removed from the old surface of a storage pile. Turning surface material to a depth more than the size of the most significant pieces of material available can also cause an exposed area to be disturbed.
4. Results
The model applied in this work included two simulated scenarios: one when there are control measures in place to mitigate dust particles and one when no dust control was implemented in two study sites, namely the rock quarry site (study site #1) and iron ore mining site (study site #2). For study site #1, the scenarios were simulated for the monthly quarrying and crushing rate of 40,000 tons. For study site #2, the scenarios were modeled for the iron ore mining operation with a monthly production capacity of 30,000 tons.
4.1. With Control Measures
4.1.1. Study Site #1
With a quarrying and crushing rate of 40,000 tons per month using primary, secondary, and tertiary crushers and with dust control measures strictly implemented to reduce dust particles as mentioned above, the forecasted maximum 24 h average PM10 incremental concentration at the receptor grid area was between a low of 2.00 µg/m3 about 3 km away and the highest incremental concentration of 80 µg/m3 at the project site boundary. Figure 1 shows the forecasted maximum 24 h average PM10 incremental concentration contours in study site #1. The existing baseline PM10 concentrations are 59.00 µg/m3, 50.00 µg/m3, 51.00 µg/m3, and the incremental concentrations are 57.68 µg/m3, 4.75 µg/m3,, and 2.12 µg/m3 at monitoring sites A1, A2, and A3, respectively. The ambient PM10 concentration combines the baseline concentration and the highest incremental concentration, measuring 116.68 µg/m3, 54.75 µg/m3, and 53.12 µg/m3, respectively. Therefore, the 24 h mean PM10 concentration is 74.85 µg/m3, which remained under the new MAAQG threshold limit of 100.00 µg/m3.
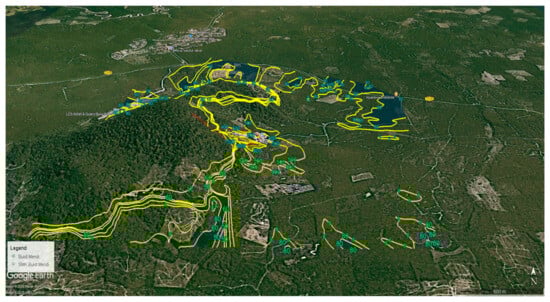
Figure 1.
Dispersion contours of maximum 24 h average PM10 incremental concentration (µg/m3) with control measures in study site #1.
Regarding the yearly mean concentration, the forecasted PM10 incremental concentration in ambient air is under 5.00 µg/m3 outside the project boundary indicated in Figure 2. The yearly mean concentration remained below the new MAAQG limit of 40.00 µg/m3.
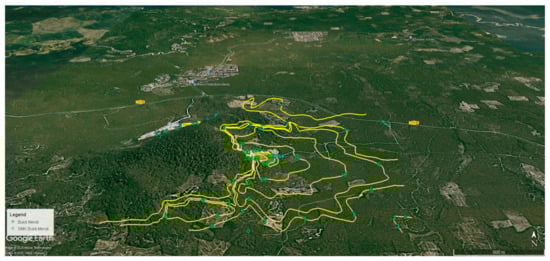
Figure 2.
Dispersion contours of annual average PM10 incremental concentration (µg/m3) with control measure in study site #1.
Table 10 shows the predicted PM10 concentrations in µg/m3 at the discrete and sensitive receptors with control measures in study site #1. PM10 incremental concentrations at the sensitive receptor entrance road to Felda Bukit Mendi are as low as 0.07 µg/m3 when there are control measures to mitigate dust particles.
Table 10.
PM10 concentration at sensitive and discrete receptors (with mitigation strategies) in study site #1.
4.1.2. Study Site #2
For an iron ore mining operation with a monthly capacity of 30,000 tons and consistent dust control measures in place, the anticipated peak 24 h mean PM10 incremental concentration within a 3 km radius receptor grid ranged from a minimum of 1.75 µg/m3 at the grid’s eastern edge to a maximum of 200.00 µg/m3 within the project boundary. Figure 3 illustrates the forecasted 24 h average PM10 incremental concentration contours in study site #2. In the existing baseline PM10 concentration of 32.00 µg/m3 and an incremental concentration of 45.00 µg/m3 at location A4 within the project boundary, the highest projected PM10 ambient air concentration is 77.00 µg/m3. If dust control measures are maintained, this remains comfortably under the 2020 MAAQG threshold of 100.00 µg/m3.
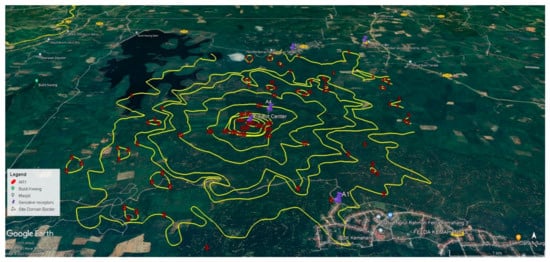
Figure 3.
Maximum 24 h mean PM10 incremental concentration (µg/m3) with control measures in study site #2.
The forecasted PM10 incremental concentration in ambient air remains under 10.00 µg/m3 outside the project boundary for the yearly mean concentration. It is less than 1.00 µg/m3 at the receptor grid edges, as illustrated in Figure 4. This yearly mean concentration is significantly below the MAAQG threshold of 40.00 µg/m3.
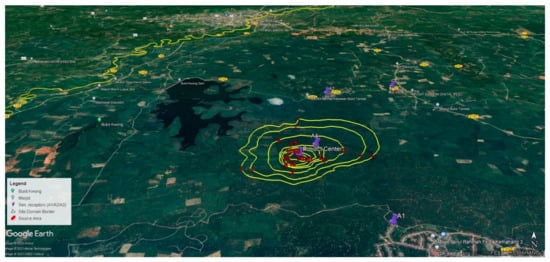
Figure 4.
Annual average PM10 incremental concentration (µg/m3) with control measures in study site #2.
For the scenario implementing control measures, PM10 concentrations (in µg/m3) were forecasted at both discrete and sensitive receptors, and the results are presented in Table 11. Notably, at the sensitive receptors A1, A2, and A3, PM10 incremental concentrations are substantially reduced when dust emission control measures are in place.
Table 11.
PM10 concentration at sensitive and discrete receptors (with mitigation measures) in study site #2.
The existing baseline PM10 concentrations are 52.00 µg/m3, 27.00 µg/m3, 23.00 µg/m3, and 32.00 µg/m3 and the incremental concentrations are 5.34 µg/m3, 3.85 µg/m3, 2.43 µg/m3, and 70.18 µg/m3 at monitoring sites A1, A2, A3, and A4, respectively. The ambient PM10 concentration combines the existing baseline concentration and the highest incremental concentration, measuring 57.34 µg/m3, 30.85 µg/m3, 25.43 µg/m3, and 102.18 µg/m3. Therefore, the 24 h mean PM10 concentration is 53.95 µg/m3, which remains under the new MAAQG threshold limit of 100.00 µg/m3.
4.2. Without Control Measures
4.2.1. Study Site #1
With a monthly quarrying and crushing rate of 40,000 tons using primary, secondary, and tertiary crushers without any dust control measures, dust emissions from activities significantly increase PM10 concentration.
Table 12 presents the existing baseline, incremental, and ambient air concentrations of PM10 without mitigation strategies at the discrete and sensitive receptors in study site #1. The existing baseline concentrations are 59.00 µg/m3, 50.00 µg/m3, and 51.00 µg/m3, and the incremental concentrations are 54,981.27 µg/m3, 4522.28 µg/m3, and 2009.23 µg/m3 at the monitoring sites of A1, A2, and A3, respectively. The ambient air concentrations are 55,050.27 µg/m3, 4572.58 µg/m3, and 2060.23 µg/m3, respectively. When the incremental concentrations are combined with the existing baseline levels, the PM10 concentration becomes hazardous and well above the 24 h MAAQG threshold of 100 µg/m3 throughout the receptor grids within the project site and closer to the project boundary. The 24 h average PM10 concentration is 20,557.69 µg/m3, significantly exceeding the MAAQG threshold limit. Figure 5 presents the forecasted maximum 24 h mean PM10 incremental concentration when no mitigation measures are implemented in study site #1.
Table 12.
PM10 concentration at sensitive and discrete receptors (without mitigation strategies) in study site #1.
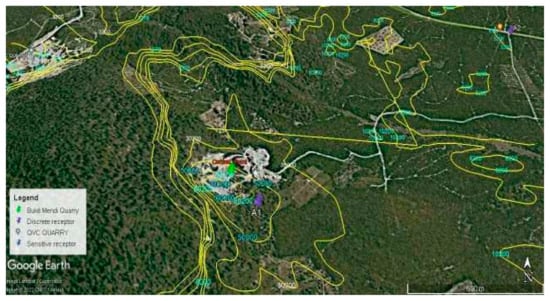
Figure 5.
Maximum 24 h average PM10 incremental concentration (µg/m3) without control measures in study site #1.
Suppose the strict mitigation measures are not implemented over an extensive period. In that case, the forecasted annual mean PM10 incremental concentration is expected to increase at the project site boundary and 3 km away edges of receptor grids. Based on AEDMOD modeling, the values are as high as 64.65 μg/m3 at 3 km away and 4561.91 μg/m3 at the project boundary. The forecasted yearly mean PM10 concentration is well above the MAAQG threshold of 40.00 µg/m3 in areas around the project location. Figure 6 shows the modeling results regarding the annual average PM10 incremental concentration contours in study site #1.
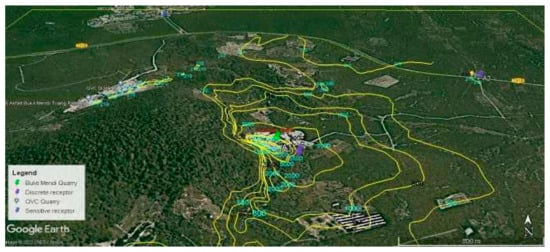
Figure 6.
Annual average PM10 incremental concentration (µg/m3) without control measures in study site #1.
Without mitigation measures to reduce dust particles, the maximum 24 h mean PM10 incremental concentrations at the discrete receptors and around the project boundary are at dangerous levels and well above the MAAQG threshold.
4.2.2. Study Site #2
For an iron ore mining operation with a capacity of 30,000 tons per month and without dust control measures, dust emissions from related activities can lead to a rise in PM10 concentrations. These can range from a minimum of 5.00 µg/m3 approximately 3 km away at the receptor grid boundaries to over 1000.00 µg/m3 at the heart of the site for the maximum 24 h mean concentration. Figure 7 illustrates forecasted peak 24 h mean PM10 incremental concentrations without dust mitigation in study site #2. When these incremental concentrations are combined with existing baseline levels, the ambient PM10 concentrations exceed the MAAQG limit of 100.00 µg/m3, but only at location A4 and areas proximate to the project boundary.
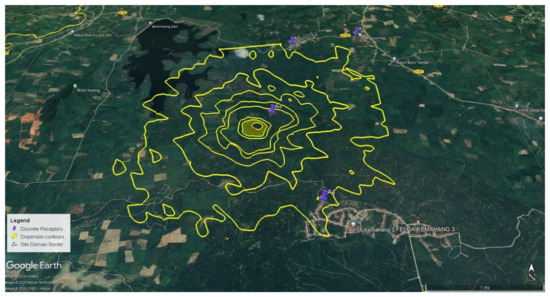
Figure 7.
Maximum 24 h mean PM10 incremental concentration (µg/m3) without control measures in study site #2.
In the unlikely scenario where control measures are neglected for an extended duration, a notable rise in the annual average PM10 incremental concentration is anticipated at the project site boundary and 3 km away at the edges of the receptor grids. AERMOD modeling shows these concentrations are as low as 0.50 μg/m3 at the 3 km mark and as high as 100.00 μg/m3 at the site center. The forecasted yearly mean PM10 concentration remains under the MAAQG limit of 40.00 μg/m3 outside the project site. Figure 8 visually represents these findings, depicting the annual average PM10 incremental concentration contours in study site #2. It is widely acknowledged that local meteorological factors, such as wind intensity and occurrence, solar radiation, and surface characteristics, profoundly influence pollutant dispersion.
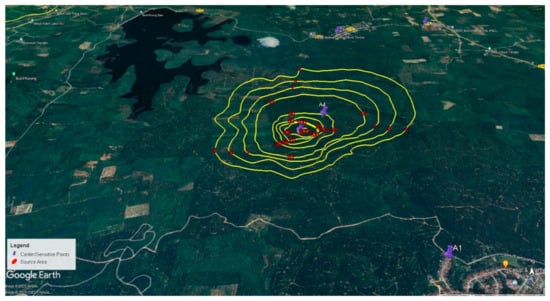
Figure 8.
Yearly mean PM10 incremental concentration (µg/m3) without control measures in study site #2.
Table 13 shows that the PM10 concentrations in µg/m3 at the discrete and sensitive receptors were forecasted without control measures in study site #2. The existing baseline PM10 concentrations are 52.00 µg/m3, 27.00 µg/m3, 23.00 µg/m3, 32.00 µg/m3, and the incremental concentrations are 26.69 µg/m3, 19.24 µg/m3, 12.15 µg/m3, and 350.66 µg/m3 at monitoring sites A1, A2, A3, and A4, respectively. The ambient PM10 concentration combines the existing baseline concentration and the highest incremental concentration, measuring 78.69 µg/m3, 46.24 µg/m3, 35.15 µg/m3, and 382.66 µg/m3, respectively. Therefore, the 24 h mean PM10 concentration is 135.69 µg/m3, which exceeds the new MAAQG threshold limit of 100.00 µg/m3. Without control measures to mitigate dust particles, the peak 24 h mean PM10 incremental concentrations at specific discrete receptors (A4) near the project boundary significantly exceed the MAAQG limit. However, the sensitive receptors A1, A2, and A3 remain within the prescribed limit.
Table 13.
PM10 concentration at sensitive and discrete receptors (without mitigation measures) in study site #2.
The modeling result of this work may provide some suggestions and implications for local government agencies when establishing environmental policies on the quarrying and crushing operations, and iron ore mining projects, especially with the control measure having successfully reduced the PM10 concentrations by 99.90% and 60.24% in study site #1 and #2, respectively, and complies with the Malaysian Ambient Air Quality Guidelines (MAAQG) 24 h threshold limits at 100 µg/m3. In addition, the modeling result shows that the quarrying and crushing operations and iron ore mining projects have an extremely high emission of PM10 concentration without implementing any control measures, which should be brought to the attention of the local authorities.
The lifecycle of quarrying activities is known to cause significant environmental impacts, especially the mechanical extraction and processing of rock products [33]. Previous studies showed that models were applied successfully to assess the health concerns from poor air quality in the quarrying area in Vietnam [34]. Another study shows that AERMOD can accurately predict PM10 concentrations at a coal mining site in Singrauli, India [4]. Also, the AERMOD model successfully simulated the TSP emissions from seven quarry sites in Artvin, Turkey [1]. On top of modeling in a quarry site, the AERMOD model is also effective for simulating PM10 and PM2.5 in poultry pullet facilities and testing if the emission stays within the NAAQS in Ohio, USA [20]. The emission of NO2 from a cement complex may also be evaluated to check if the emissions level exceeds the NAAQS near Bangkok, Thailand [21]. The modeling of TSP and PM10 emissions from stone quarries in two mountainous regions was successful [17,19]. Overall, previous studies showed that AERMOD is a versatile and flexible model that can be applied to different emission sites with varying pollutants in the air. The successful results of earlier studies are also aligned with the findings of this work, which further ensures its robustness and importance.
4.3. Comparison of PM10 Reduction at Site #1 and Site #2 (Effectiveness of Control Measures)
The differences in PM10 reduction between site #1 (99.90%) and site #2 (60.24%) are mainly due to the extent and consistency of the dust control measures applied. At site #1, comprehensive dust suppression measures were implemented, including enclosed conveyors, water spraying systems at all crushers and transfer points, and tire-washing stations for trucks. These measures resulted in an almost total reduction of PM10 emissions from major sources.
In contrast, site #2 experienced only partial implementation. While water sprinklers were installed near crushers, open storage piles and uncovered truck routes remained significant sources of fugitive dust emissions. Moreover, operational limitations in maintaining continuous spraying during peak periods also contributed to the reduced efficacy at site #2. These site-specific differences highlight the critical role of integrated and continuous mitigation practices in achieving substantial reductions in PM10 emissions.
4.4. Model Validation and Assessment
To validate the reliability of AERMOD in simulating PM10 dispersion from quarry operations, modeled concentrations were compared against observed data collected from on-site air quality monitoring stations at receptors A1, A2, and A3. Three standard statistical evaluation metrics were applied: Mean Bias (MB), Root Mean Square Error (RMSE), and Index of Agreement (IOA). The comparison demonstrated a strong agreement, with IOA values above 0.85, indicating the model’s high predictive capacity under the local conditions. The MB and RMSE values also fell within acceptable ranges, as summarized in Table 14. This validation provides confidence that the AERMOD predictions reflect actual field conditions within acceptable uncertainties.
Table 14.
Statistical metrics for AERMOD model validation at key receptors.
Although physical wind tunnel modeling could offer further verification, it was not part of the present study due to technical constraints. Future work should consider coupled validation using wind tunnel studies or Computational Fluid Dynamics (CFD) modeling, especially to simulate complex wind–terrain interactions near quarry sites.
4.5. Meteorological Influences on PM10 Concentrations
Meteorological conditions play a vital role in influencing the dispersion and deposition of PM10 emissions from quarry operations. Table 15 presents the correlation coefficients between PM10 concentrations and key meteorological factors, including wind speed, wind direction, relative humidity, and rainfall.
Table 15.
Correlation between meteorological factors and PM10 concentrations.
The analysis indicates that wind speed has a strong negative correlation with PM10 levels, suggesting that higher wind speeds enhance the dispersion and dilution of particulates, thus reducing ground-level concentrations. Rainfall also shows a significant negative correlation, reflecting its dust suppression effect, particularly during heavy precipitation events.
On the other hand, relative humidity exhibited a moderate negative correlation with PM10, consistent with the role of moisture in limiting particle suspension. Wind direction had a variable impact, depending on the source–receptor alignment. These findings underscore the necessity to account for meteorological variations when modeling and managing quarry emissions. A summary of correlation coefficients is provided in Table 15.
5. Discussion
5.1. Implication of This Work
The implications of the work are multifaceted and have significant environmental, health, regulatory, and industrial impacts. The study enables better prediction of dust dispersion patterns by applying the AERMOD model to simulate PM10 emissions from quarry operations and iron ore mining projects. This leads to more informed and effective mitigation strategies, helping to reduce PM10 concentrations in the air. Quarry operators can use these findings to adjust their operational practices, improving local air quality.
Identifying areas where PM10 concentrations likely exceed safety thresholds allows for early intervention, preventing excessive pollution before it affects nearby communities. The study’s results directly affect the health of residents living near quarry operations. Reducing PM10 levels, mainly through control measures identified in the study, will decrease the risk of respiratory and cardiovascular diseases linked to long-term exposure to PM10.
The work can guide public health policies to minimize health risks associated with quarry operations, leading to improved living conditions for affected populations. This study can support regulatory bodies in strengthening air quality standards and policies. The Malaysian government and other regulatory authorities can use the findings to set stricter emission limits for PM10, enforce control measures in the quarrying industry, and monitor compliance more effectively.
Quarry and iron ore operators can use the insights from this study to implement more efficient dust control measures, such as water sprays, dust collectors, or modified operational processes. These adjustments could reduce emissions while potentially lowering operational costs in the long term by avoiding fines and maintaining environmental licenses. This research promotes sustainable industrial practices, ensuring quarry operations can continue without compromising environmental and community health. It balances industrial growth with the need for pollution reduction.
The successful application of the AERMOD model in Malaysia demonstrates its effectiveness in predicting emissions in local environmental conditions. This sets a precedent for using the model in similar settings across Southeast Asia, where quarrying and other industrial activities are common. The methodologies and findings from this work can be applied to other industries that emit particulate matter, such as cement production, construction, or mining. It provides a framework for predicting and managing PM10 emissions across different sectors.
Implementing the findings of this study could lead to more cost-effective strategies for controlling PM10 emissions. Quarry and iron ore operators could adopt control measures that are not only efficient but also financially feasible, ensuring continued economic activity without compromising environmental quality. Reducing PM10 emissions from quarries contributes to overall environmental sustainability by decreasing air pollution, preserving ecosystems, and promoting biodiversity. It may also lead to fewer environmental liabilities for quarry operators, reducing potential costs associated with environmental degradation. This study establishes a benchmark for future research on regional air quality modeling. It encourages further exploration of PM10 emissions from various industrial activities, helping to create a better understanding of air pollution sources and control methods.
Overall, the implications of this work are broad and impactful, ranging from improved public health and regulatory compliance to more sustainable industrial practices. It provides a critical tool for managing air quality, ensuring quarry operations and iron ore mining projects in Malaysia and similar regions can balance economic growth with environmental stewardship.
5.2. Contribution of This Work to Global Climate Change Mitigation
The work contributes to climate change mitigation in several ways, despite its focus on localized PM10 emissions from quarry operations and iron ore mining projects. Although PM10 is not a greenhouse gas (GHG), its mitigation is indirectly connected to broader efforts to combat climate change. PM10 is a significant air pollutant that affects human health, leading to respiratory and cardiovascular diseases. By using AERMOD to model and predict PM10 emissions from quarry operations, this study helps design effective control strategies to reduce the levels of this particulate matter. Cleaner air benefits public health and reduces the healthcare burden, contributing to more resilient communities better equipped to adapt to the adverse effects of climate change.
Although focused on air pollution, mitigating PM10 emissions can reduce the overall environmental footprint of quarrying operations. Quarry operations often contribute to dust, emissions, and land degradation, exacerbating environmental stress. By improving air quality, this work promotes sustainable industrial practices, indirectly aiding climate action efforts.
The research highlights the effectiveness of control measures in significantly reducing PM10 emissions. Many control technologies, such as dust suppression systems, water sprays, and filtration methods, can also be designed to lower energy consumption or incorporate renewable energy sources. By demonstrating the success of mitigation strategies in reducing particulate emissions, this work encourages industrial sectors, including mining and construction, to adopt cleaner, more energy-efficient practices, which can reduce overall emissions, including greenhouse gases.
Quarrying and mining are energy intensive and contribute to air pollution and greenhouse gas emissions. Focusing on improving quarry environmental performance, this study helps foster a transition toward more sustainable industrial practices. Reducing particulate emissions often requires improving operational efficiency, which can lead to lower fuel consumption and fewer greenhouse gas emissions from heavy machinery and vehicles used in these industries.
While the study directly targets PM10 emissions, the broader implication of reducing particulate matter can result in co-benefits for climate change. PM10 and other aerosols can interact with climate systems by affecting solar radiation and cloud formation, influencing weather patterns and climate dynamics. By mitigating PM10 emissions, there may be ancillary benefits in reducing these localized impacts, contributing to climate resilience efforts.
The AERMOD model used in this study could be applied on a larger scale in various regions and industries beyond quarry operations, including other sectors like cement production, steel manufacturing, and large-scale construction. The insights gained from this research could be adapted to reduce particulate matter emissions globally, particularly in developing regions facing rapid industrialization and urbanization, which are significant contributors to air pollution and climate change.
This research can inform policymakers by providing evidence on the effectiveness of emission control measures and predictive modeling. As nations strive to meet international climate goals and air quality standards, the methodologies and findings from this study can guide the development of regulatory frameworks that encourage industrial sectors to adopt sustainable practices. Well-implemented air quality regulations can simultaneously reduce harmful pollutants and incentivize the adoption of low-carbon technologies.
Quarries and iron ore mining often disrupt the natural landscape, contributing to land degradation and deforestation, which can reduce carbon sequestration potential. By promoting cleaner, more sustainable quarrying practices, the study indirectly supports efforts to restore or protect natural landscapes that can act as carbon sinks. Furthermore, effective dust control measures may prevent the loss of vegetation around quarries, helping to preserve the environment’s capacity to absorb CO2.
Overall, while the primary focus of the study is on PM10 emissions, its contribution to global climate change mitigation is multifaceted. By improving air quality, reducing energy consumption through efficient dust control technologies, supporting sustainable industrial practices, and informing policy, this work plays an indirect but meaningful role in addressing climate change challenges. Integrating emission reduction strategies into industries like quarrying can serve as a stepping stone toward broader environmental sustainability goals, including mitigating greenhouse gas emissions and promoting climate resilience.
5.3. Limitations of This Work and Mitigation Strategies
The work offers valuable insights into predicting and controlling PM10 emissions. However, like any scientific study, it has its limitations. Identifying these limitations and proposing mitigation strategies is essential for enhancing the reliability and applicability of the results. One of the significant challenges in air quality modeling is the accuracy and availability of input data. For AERMOD to provide reliable predictions, high-quality data on emission sources, meteorological conditions, and topographical features are essential. In Malaysia, comprehensive real-time data collection may be limited, which could affect the precision of the model’s output. To address this, it is crucial to implement continuous monitoring systems at quarry sites, ensuring real-time data collection on PM10 emissions. Integrating satellite data, ground sensors, and historical datasets can help fill data gaps. Additionally, investing in localized meteorological stations can improve the accuracy of weather inputs, further refining model predictions.
The study may focus primarily on emissions from rock crushing and quarrying and iron ore mining activities. However, dust generation can come from multiple sources within quarry operations and iron ore mining projects, such as material handling, transportation, and blasting. If all sources of particulate matter are not included, the model may underestimate the total PM10 emissions. Future studies should expand the scope to account for all emission sources in a quarry and mining environment, including haul roads, stockpiles, and other operational processes. A more holistic approach to source identification will improve the accuracy of total emissions and ensure that control measures target all relevant activities.
Like any dispersion model, AERMOD operates based on several assumptions and simplifications, such as steady-state atmospheric conditions and uniform terrain. These assumptions may not fully capture real-world environments’ dynamic and complex nature, especially in regions with varied topography and fluctuating weather conditions. Sensitivity analyses should be conducted to understand the extent to which model outputs are affected by assumptions and input uncertainties. Model validation should be conducted using field measurements to compare predicted PM10 concentrations with actual observations. Adjusting model parameters based on real-world feedback will improve its robustness and reliability.
The AERMOD model is sensitive to terrain features and geographical variations. Quarries located in regions with complex topography, such as hills or valleys, may experience different wind patterns and airflow dynamics that are not fully captured by the model’s assumptions. This can lead to inaccuracies in predicting how PM10 particles disperse across the area. Incorporating high-resolution geographical and topographical data into the model can help mitigate this issue. Using geographic information system (GIS) technology and digital elevation models (DEMs) to refine terrain inputs will result in more accurate simulations of PM10 dispersion. It is also beneficial to perform localized field studies to understand how terrain affects pollutant behavior.
The AERMOD model typically relies on snapshot-like representations of emissions and meteorological conditions, which may not fully reflect the temporal variations in PM10 emissions throughout different times of day, seasons, or weather events. For example, emissions may spike during dry, windy conditions and decrease during wet periods. Long-term monitoring and modeling efforts should be considered to address temporal variability. Conducting simulations over various timeframes and weather conditions can capture a more comprehensive picture of emissions patterns. Dynamic models incorporating hourly or seasonal emissions and meteorology changes would offer more accurate forecasts.
While the study demonstrates that control measures reduce PM10 emissions, the effectiveness of these measures may vary depending on factors such as implementation quality, maintenance practices, and operational behavior. In some cases, predicted reductions may not fully translate into real-world improvements. Continuous evaluation of control measures is essential. Regular maintenance of dust control technologies, such as water sprays and dust collection systems, should be ensured to maintain efficacy. Additionally, adopting a mix of control strategies, including operational changes like reducing vehicle speeds and covering stockpiles, can provide more robust and sustained emission reductions.
The model primarily focuses on the technical aspects of PM10 emissions but may not fully address the surrounding population’s socio-economic and community health concerns. Without active community engagement, it can be challenging to implement mitigation strategies effectively. Quarry and mining operators and researchers should involve local communities in monitoring efforts and decision-making processes. Public awareness campaigns on the health risks of PM10 exposure and the benefits of emission control measures can foster community support. Implementing real-time air quality monitoring accessible to the public will enhance transparency and encourage community participation in air quality management.
The study is based on a specific case in Malaysia, and the findings may not be directly transferable to other geographical regions with different climates, terrain, and operational practices. The model’s performance may vary in various environmental and industrial contexts. To generalize the findings, the approach should be replicated in different quarry sites across varying regions. Comparative studies in diverse geographical locations can explain how PM10 emissions behave in different environments and enhance the model’s adaptability for global application.
While the study provides valuable insights into PM10 emissions from quarry operations and iron ore mining projects, certain limitations must be addressed to ensure the model’s broader applicability and reliability. By enhancing data quality, expanding the scope of emissions sources, refining model assumptions, and fostering community involvement, future work can build upon this research to offer more comprehensive and effective solutions for air quality management.
5.4. Comparison with Previous Work
A previous study performed successful simulations of the combined heat and power plants (CHPPs) emissions in Kazakhstan using the AERMOD model, specifically in the controlled and uncontrolled scenario, which is similar to this work. When the control mechanism is implemented, the CHPPs emission is approximately 6%; when there is no control, the CHPPs emission ranges from 30% to 39% [35]. Another study successfully applied the AERMOD model to evaluate the dispersion of pollutants of industrial origin and estimate the concentrations of VOC and PM10 in the nearby community of a petrochemical complex in Brazil [36]. In addition, the AERMOD model was successfully applied to examine the distribution of PM10 around an organized industrial zone (OIZ) in Turkey [37]. Furthermore, the AERMOD model can predict VOCs such as benzene, toluene, and xylenes in a wastewater treatment facility, and the closed system will reduce the concentration of VOCs by 49% [38]. Overall, it shows that the AERMOD model is suitable and capable for applications similar to this work.
6. Conclusions
This study has demonstrated the effectiveness of implementing control measures in reducing PM10 emissions and preserving environmental quality in affected areas. The AERMOD model has been successfully applied in this study to predict the impact of dust emissions from quarrying and crushing operations to produce 40,000 tons per month and a mining rate of 154 tons per day in study site #1 and the iron ore mining project to produce 30,000 tons per month and a mining rate of 1153 tons per day in study site #2. The novelty of this work is a case study of the mitigation strategies that can be applied to quarry sites and iron ore mines in Malaysia to comply with UN SDGs 3, SDG 11, and SDG 13 [39], which is the first study that covers this topic in this region.
This case study has provided region-specific insights for Malaysia, a country where the quarrying and mining industry is a significant economic sector [40]. The tailored use of the AERMOD model addresses local meteorological and geographical conditions, ensuring more accurate predictions and practical solutions relevant to the country’s environmental management needs [41].
The model scenarios simulated that when control measures are taken to reduce emissions, the impacts are moderate and stay within the new MAAQG threshold of 100 µg/m3 for the maximum 24 h mean concentration and 40 µg/m3 for the yearly mean concentration. Nevertheless, when dust control measures are absent, the forecasted PM10 concentration dangerously exceeds the new MAAQG threshold for PM10 in most of the receptor grid. As expected, PM10 concentrations are above the limits, so it is highly recommended that stringent dust mitigation measures be continuously taken during the project’s operation.
The operation activities emit PM10 and other gaseous pollutants such as SO2, NO2, and CO in ambient air. The limitation of this study may include excluding the fine particulate matter PM2.5, which poses an even more significant threat to human health due to its smaller diameter size, which can penetrate deeper into the human lungs and enter the circulatory system’s blood vessels. Future studies include applying the AERMOD model to simulate the emission of PM2.5 and other gaseous pollutants in related industrial activities, such as quarrying and crushing operations.
The limitation of this work is a case study in Malaysia, and the findings may not directly be applied to other geographical regions with different climates and settings. Other finer particulate matters, such as PM2.5 and PM1, may be explored in future studies. The AERMOD model can be applied in different geographical regions to validate its robustness. PM2.5 may contain heavy metals such as lead (Pb), cadmium (Cd), zinc (Zn), and nickel (Ni), and persistent organic pollutants (POPs) such as PCBs and dioxins, which pose serious carcinogenic risks to workers and community members [42,43].
Overall, the findings from this study offer valuable information for policymakers and regulatory bodies in Malaysia and similar regions. By showing the effectiveness of control measures in reducing PM10 emissions, the study can inform the development of stricter air quality regulations, operational guidelines, and industrial best practices.
Author Contributions
Conceptualization, M.M.H.K. and T.A.K.; methodology, M.M.H.K. and T.M.T.L.; software, M.M.H.K. and T.M.T.L.; validation, T.A.K. and I.C.; formal analysis, M.M.H.K. and T.M.T.L.; investigation, M.M.H.K. and T.A.K.; resources, M.M.H.K. and T.M.T.L.; data curation, M.M.H.K., T.A.K. and T.M.T.L.; writing—original draft preparation, M.M.H.K., T.A.K., I.C. and T.M.T.L.; writing—review and editing, M.M.H.K., T.A.K., I.C. and T.M.T.L.; visualization, M.M.H.K. and T.M.T.L.; supervision, M.M.H.K. and T.A.K.; project administration, T.A.K. and T.M.T.L.; funding acquisition, M.M.H.K. and T.M.T.L. All authors have read and agreed to the published version of the manuscript.
Funding
The APC was partially funded by INTI International University.
Institutional Review Board Statement
Not applicable.
Informed Consent Statement
Not applicable.
Data Availability Statement
Dataset available on request from the authors.
Conflicts of Interest
The authors declare no conflicts of interest.
References
- Demirarslan, K.O.; Yener, İ. Investigation of total suspended particulate matter dispersion from quarries in Artvin, Turkey, using AERMOD and its relationship with topography. Air Qual. Atmos. Health 2022, 15, 2313–2327. [Google Scholar] [CrossRef]
- Ridzuan, N.; Ujang, U.; Azri, S.; Choon, T.L. Visualising urban air quality using AERMOD, CALPUFF and CFD Models: A critical review. Int. Arch. Photogramm. Remote Sens. Spat. Inf. Sci. 2020, 44, 355–363. [Google Scholar] [CrossRef]
- PriyaDarshini, S.; Sharma, M.; Singh, D. Synergy of receptor and dispersion modelling: Quantification of PM10 emissions from road and soil dust not included in the Inventory. Atmos. Pollut. Res. 2016, 7, 403–411. [Google Scholar] [CrossRef]
- Prasad, N.; Mishra, A.; Bhattacharya, T.; Lal, B.; Chandra Jha, P.; Kumar, A. Validation of AERMOD prediction accuracy for particulate matters (PM10, PM2.5) for a large coal mine complex: A Multisource perspective. Aerosol Sci. Eng. 2024, 1–15. [Google Scholar] [CrossRef]
- Kurniawan, T.A.; Khan, S.; Mohyuddin, A.; Haider, A.; Lei, T.M.; Othman, M.H.; Goh, H.H.; Zhang, D.; Anouzla, A.; Aziz, F.; et al. Technological Solutions for Air Pollution Control to mitigate climate change: An approach to facilitate global transition toward blue sky and net-zero emission. Chem. Pap. 2024, 78, 6843–6871. [Google Scholar] [CrossRef]
- United Nations. Sustainable Development Goals; United Nations: New York, NY, USA, 2015. [Google Scholar]
- Eibedingil, I.G.; Gill, T.E.; Van Pelt, R.S.; Tatarko, J.; Li, J.; Li, W.-W. Applying Wind Erosion and Air Dispersion Models to Characterize Dust Hazard to Highway Safety at Lordsburg Playa, New Mexico, USA. Atmosphere 2022, 13, 1646. [Google Scholar] [CrossRef]
- Rzeszutek, M.; Szulecka, A. Assessment of the AERMOD dispersion model in complex terrain with different types of digital elevation data. Iop Conf. Ser. Earth Environ. Sci. 2021, 642, 012014. [Google Scholar] [CrossRef]
- Ying, M.; Wang-Li, L.; Stikeleather, L.F.; Edwards, J. Modeling plume-rise of air emissions from animal housing systems: Inverse aermod. J. Environ. Prot. 2017, 08, 1254–1269. [Google Scholar] [CrossRef][Green Version]
- Gibson, M.D.; Kundu, S.; Satish, M. Dispersion Model Evaluation of PM2.5, NOx and SO2 from Point and Major Line Sources in Nova Scotia, Canada Using AERMOD Gaussian Plume Air Dispersion Model. Atmos. Pollut. Res. 2013, 4, 157–167. [Google Scholar]
- Rzeszutek, M.; Kłosowska, A.; Oleniacz, R. Accuracy Assessment of WRF Model in the Context of Air Quality Modeling in Complex Terrain. Sustainability 2023, 15, 12576. [Google Scholar] [CrossRef]
- Cau, P.; Muroni, D.; Satta, G.; Milesi, C.; Casari, C. AERQ—A Web-Based Decision Support Tool for Air Quality Assessment. Appl. Sci. 2025, 15, 2045. [Google Scholar] [CrossRef]
- Matthews, E.; Kraft, J.; Hossain, G.; Bednar, A.; Laber, C.; Alam, S.; Manzur, T.; Matthews, J.; Howell, J.; Eklund, S. Air Quality Dispersion Modelling to Evaluate CIPP Installation Styrene Emissions. Int. J. Environ. Res. Public Health 2022, 19, 13800. [Google Scholar] [CrossRef] [PubMed]
- Bellasio, R.; Bianconi, R. Analysis of the Odor Levels at the Closest Receptors Depending on the Stack Terminal Types. Atmosphere 2025, 16, 169. [Google Scholar] [CrossRef]
- Zhang, R.; Li, M.; Ma, H. Comparative study on numerical simulation based on CALPUFF and wind tunnel simulation of hazardous chemical leakage accidents. Front. Environ. Sci. 2022, 10, 1025027. [Google Scholar]
- Langner, C.; Klemm, O. A comparison of model performance between AERMOD and austal2000. J. Air Waste Manag. Assoc. 2011, 61, 640–646. [Google Scholar]
- Tartakovsky, D.; Broday, D.M.; Stern, E. Evaluation of AERMOD and CALPUFF for predicting ambient concentrations of Total Suspended Particulate Matter (TSP) emissions from a quarry in complex terrain. Environ. Pollut. 2013, 179, 138–145. [Google Scholar]
- Bonifacio, H.F.; Maghirang, R.G.; Razote, E.B.; Trabue, S.L.; Prueger, J.H. Comparison of AERMOD and WindTrax dispersion models in determining PM10 emission rates from a beef cattle feedlot. J. Air Waste Manag. Assoc. 2013, 63, 545–556. [Google Scholar]
- Tartakovsky, D.; Stern, E.; Broday, D.M. Dispersion of TSP and PM10 emissions from quarries in complex terrain. Sci. Total Environ. 2016, 542, 946–954. [Google Scholar]
- Hadlocon, L.S.; Zhao, L.Y.; Bohrer, G.; Kenny, W.; Garrity, S.R.; Wang, J.; Wyslouzil, B.; Upadhyay, J. Modeling of particulate matter dispersion from a poultry facility using AERMOD. J. Air Waste Manag. Assoc. 2015, 65, 206–217. [Google Scholar]
- Seangkiatiyuth, K.; Surapipith, V.; Tantrakarnapa, K.; Lothongkum, A.W. Application of the AERMOD modeling system for environmental impact assessment of NO2 emissions from a cement complex. J. Environ. Sci. 2011, 23, 931–940. [Google Scholar]
- Francisco, D.M.; Heist, D.K.; Venkatram, A.; Brouwer, L.H.; Perry, S.G. Incorporating the impact of roadside barrier effects on dispersion into AERMOD. J. Air Waste Manag. Assoc. 2023, 74, 39–51. [Google Scholar] [PubMed]
- Perry, S.G.; Cimorelli, A.J.; Paine, R.J.; Brode, R.W.; Weil, J.C.; Venkatram, A.; Wilson, R.B.; Lee, R.F.; Peters, W.D. AERMOD: A dispersion model for industrial source applications. Part II: Model performance against 17 field study databases. J. Appl. Meteorol. 2005, 44, 694–708. [Google Scholar]
- Ramli, M.I.; Rani, N.M.; Zafany, A.A. Air Quality Analysis and dispersion modelling by using AERMOD for amonia (NH3) parameters on toll roads in Makassar City. IOP Conf. Ser. Earth Environ. Sci. 2023, 1134, 012011. [Google Scholar]
- Tsai, J.-H.; Yeh, P.-C.; Huang, J.-J.; Chiang, H.-L. Characteristics of Air Toxics from Multiple Sources in the Kaohsiung Coastal Industrial Complex and Port Area. Atmosphere 2024, 15, 1547. [Google Scholar] [CrossRef]
- Manqele, N.M.; Moolla, R.; Frost Ramsay, L. A Mid-Tier Approach to Estimating Durban’s Port Marine Mobile Emissions: Gauging Air Quality Impacts in South Durban. Atmosphere 2024, 15, 1207. [Google Scholar] [CrossRef]
- Kultan, V.; Thepanondh, S.; Pinthong, N.; Keawboonchu, J.; Robson, M. Comprehensive Evaluation of Odor-Causing VOCs from the Painting Process of the Automobile Manufacturing Industry and Its Sustainable Management. Atmosphere 2022, 13, 1515. [Google Scholar] [CrossRef]
- Zou, B.; Zeng, Y.; Liu, H.; Zhang, H.; Qiu, Y.; Zhan, B.F. Sensitivity analysis of AERMOD in modeling local air quality under different model options. In Proceedings of the 2010 4th International Conference on Bioinformatics and Biomedical Engineering, Chengdu, China, 18–20 June 2010; pp. 1–4. [Google Scholar]
- Pandey, G.; Venkatram, A.; Arunachalam, S. Evaluating Aermod with measurements from a major U.S. airport located on a Shoreline. Atmos. Environ. 2023, 294, 119506. [Google Scholar]
- Askariyeh, M.H.; Kota, S.H.; Vallamsundar, S.; Zietsman, J.; Ying, Q. Aermod for near-road pollutant dispersion: Evaluation of model performance with different emission source representations and low wind options. Transp. Res. Part D Transp. Environ. 2017, 57, 392–402. [Google Scholar]
- Cimorelli, A.J.; Perry, S.G.; Venkatram, A.; Weil, J.C.; Paine, R.J.; Wilson, R.B.; Lee, R.F.; Peters, W.D.; Brode, R.W. AERMOD: A dispersion model for industrial source applications. Part I: General model formulation and boundary layer characterization. J. Appl. Meteorol. 2005, 44, 682–693. [Google Scholar]
- Katika, K.; Karuchit, S. Estimation of urban air pollutant levels using AERMOD: A case study in nakhon ratchasima, Thailand. IOP Conf. Ser. Earth Environ. Sci. 2018, 164, 012024. [Google Scholar]
- Lee, C.; Asbjörnsson, G.; Hulthén, E.; Evertsson, M. The environmental impact of extraction: A holistic review of the quarry lifecycle. Clean. Environ. Syst. 2024, 13, 100201. [Google Scholar] [CrossRef]
- Bui, L.T.; Nguyen, P.H.; Nguyen, D.C. Model for assessing health damage from air pollution in quarrying area—Case study at Tan Uyen Quarry, Ho Chi Minh Megapolis, Vietnam. Heliyon 2020, 6, e05045. [Google Scholar] [CrossRef] [PubMed]
- Ogbuabia, T.B.; Guney, M.; Baimatova, N.; Ulusoy, I.; Karaca, F. Assessing the Impact of Combined Heat and Power Plants (CHPPs) in Central Asia: A Case Study in Almaty for PM2.5 Simulations Using WRF-AERMOD and Ground Level Verification. Atmosphere 2023, 14, 1554. [Google Scholar] [CrossRef]
- Coelho, M.S.; Zacharias, D.C.; de Paulo, T.S.; Ynoue, R.Y.; Fornaro, A. Air Quality Impact Estimation Due to Uncontrolled Emissions from Capuava Petrochemical Complex in the Metropolitan Area of São Paulo (MASP), Brazil. Atmosphere 2023, 14, 577. [Google Scholar] [CrossRef]
- Bakar Attiq, A.; Nawaz, R.; Atif Irshad, M.; Nasim, I.; Nasim, M.; Latif, M.; Hussain Shah, S.I.; Fatima, A. Urban Air Quality Nexus: PM2.5 Bound-Heavy Metals and their Alarming Implication for Incremental Lifetime Cancer Risk. Pollution 2024, 10, 580–594. [Google Scholar]
- Keawboonchu, J.; Thepanondh, S.; Kultan, V.; Pinthong, N.; Malakan, W.; Robson, M.G. Integrated Sustainable Management of Petrochemical Industrial Air Pollution. Int. J. Environ. Res. Public Health 2023, 20, 2280. [Google Scholar] [CrossRef]
- Lei, T.M.; Cai, J.; Molla, A.H.; Kurniawan, T.A.; Kong, S.S.-K. Evaluation of machine learning models in air pollution prediction for a case study of Macau as an effort to comply with UN Sustainable Development Goals. Sustainability 2024, 16, 7477. [Google Scholar] [CrossRef]
- Mohd Shafie, S.H. Application of AERMOD dispersion model for assessment PM10 concentrations from mobile sources in Kuala Lumpur Metropolitan City, Malaysia. Environ. Monit. Assess. 2024, 196, 969. [Google Scholar] [CrossRef]
- Sairanen, M.; Pursio, S. Near field modelling of dust emissions caused by drilling and crushing. SN Appl. Sci. 2020, 2, 1188. [Google Scholar] [CrossRef]
- Mykhailenko, V.; Nitsenko, V.S.; Gerasymchuk, N.; Sambulov, A.; Demchuk, V. Air pollution by persistent organic pollutants from organic fuel combustion by stationary sources: The case of the Odesa agglomeration. Environ. Syst. Res. 2024, 13, 51. [Google Scholar] [CrossRef]
- Kunt, F.; Ayturan, Z.C.; Yümün, F.; Karagönen, İ.; Semerci, M.; Akgün, M. Modeling and Assessment of PM10 and Atmospheric Metal Pollution in Kayseri Province, Turkey. Atmosphere 2023, 14, 356. [Google Scholar] [CrossRef]


Disclaimer/Publisher’s Note: The statements, opinions and data contained in all publications are solely those of the individual author(s) and contributor(s) and not of MDPI and/or the editor(s). MDPI and/or the editor(s) disclaim responsibility for any injury to people or property resulting from any ideas, methods, instructions or products referred to in the content. |
© 2025 by the authors. Licensee MDPI, Basel, Switzerland. This article is an open access article distributed under the terms and conditions of the Creative Commons Attribution (CC BY) license (https://creativecommons.org/licenses/by/4.0/).