Abstract
Beta attenuation monitors (BAMs) are widely used for the regulatory monitoring of fine particulate matter (PM2.5) and fence line monitoring of industrial sites. The elemental analysis of BAM filter tapes potentially could enable additional source PM2.5 attribution. However, the chemical characterization of the glass fiber filters is hindered by high background metal values. A sample preparation method was developed using the ultrasonic extraction of particulate matter from BAM filter spots in nitric acid and the analysis of metals by inductively coupled plasma–mass spectrometry (ICP-MS) and scanning electron microscopy–energy-dispersive X-ray spectroscopy (SEM-EDS). To demonstrate the utility of this method, BAM filter spots were analyzed from wildfire smoke periods in the San Francisco Bay Area in California in Fall 2023 and indicated elevated levels of chromium compared to a non-wildfire period in Spring 2023. The SEM-EDS of the BAM tape was used to probe individual particulate morphology, but it only detected Fe and Ba at levels above the blank media. The ultrasonic extraction method of BAM filter spots could be used in future wildfire smoke events to extend the characterization of beta attenuation monitor filters in PM2.5 monitoring.
1. Introduction
The networks of beta attenuation monitors (BAMs) such as the Met One Instruments, Inc. BAM 1022 are used for fine particulate matter (PM2.5) regulatory monitoring in the U.S. as Federal Equivalent Method (FEM) monitors [1]. PM2.5 is known to have especially harmful health effects due to the inhalation and development of respiratory side effects [2,3,4]. As a result, the United States Environmental Protection Agency (USEPA) requires the regulatory monitoring of particulate matter levels in addition to other airborne pollutants. In 2024, the national ambient air quality standard for PM2.5 decreased to 9 µg/m3, and more communities are expected to reach nonattainment status as a result [5,6]. In addition to the ambient community monitoring of particulate matter, fence line monitoring at industrial sites and petroleum refineries allows for the monitoring of criteria pollutants such as particulate matter, benzene, and other volatile organic compounds [7,8,9,10,11,12].
Beta attenuation monitors measure the absorption of beta radiation to estimate the mass of particulate matter deposited on glass fiber filter rolls typically on an hourly basis [13]. Although the BAM is frequently used for PM monitoring, the monitor does not typically produce chemical speciation data useful for source attribution, such as elemental analysis. However, optical image techniques such as cellphone camera image analysis can be used to estimate black carbon concentrations [14].
Instruments that perform both in situ PM2.5 and speciation measurements by utilizing X-ray fluorescence (XRF) spectroscopy [15,16] have been developed but they are not currently approved for regulatory monitoring. Additionally, other spectroscopic techniques such as spark-induced breakdown spectroscopy [17] are used for real-time portable metals monitoring for elements such as Cr, Cu, Mn, Fe, Zn, Co, and Ni in the Toxic-metal Aerosol Real Time Analyzer (TARTA). However, the above instruments are more expensive than the BAM or are not yet commercially available.
Several research groups have expanded the PM monitoring of BAM filter spots to include the further chemical characterization of black carbon, metals, and ions [18]. BAM filters have been analyzed by XRF and scanning electron microscopy–energy-dispersive X-ray spectroscopy (SEM-EDS) for surface analyses [19,20]. The combination of both destructive and non-destructive techniques requires the consideration of the sequence of analyses to maintain the integrity of the sample. In addition, there are several obstacles specific to elemental analysis by inductively coupled plasma–mass spectrometry (ICP-MS). The glass fiber filter tape used in BAM are known to have high metal background values unlike the low background polytetrafluoroethylene (PTFE) filters preferred for ICP-MS [18]. The acid digestion of glass fiber filters for elemental analysis using methods such as EPA Method IO-3.1 [21] is typically hindered by high background values, although a double acid digestion procedure using HNO3/HclO4 followed by HF has been reported by Wang et al. [22]. As an alternative to complete filter digestion, particulate matter from glass fiber filters can be extracted using various solvents such as aqua regia [23], methanol [24,25], or physical methods such as vacuuming [26] or sonication [27] for analytes such as polycyclic aromatic hydrocarbons [24].
This work presents the development of a BAM filter extraction and analytical method that minimizes the interferences from glass fiber filters and allows for the elemental analysis of PM2.5 from BAM filters used in regulatory monitoring. BAM filter samples collected from Fall 2023 Northern California wildfire smoke events were extracted using the developed protocol and analyzed by ICP-MS to demonstrate its utility. Differences in the particulate morphology and composition of individual particles collected on the BAM filters were probed by SEM-EDS.
2. Materials and Methods
2.1. Sample Collection
The BAM (BAM 1022, Met One Instruments, Inc., Grants Pass, OR, USA) was calibrated and serviced by the manufacturer before use. Particles were collected on glass fiber filter tape (part 460180, Met One Instruments, Inc. Grants Pass, OR, USA) as shown in Figure 1. Samples for further elemental analysis were collected from the third floor rooftop of the California Department of Public Health (CDPH) campus in Richmond, California, USA during two wildfire smoke events (Happy Camp Complex: 12 August 2023 to 29 August 2023, 433 km northwest; Smith River Complex: 19 September 2023 to 25 September 2023, 470 km northwest; Figure 2) and a baseline non-wildfire smoke period from 10 April 2023 to 21 April 2023 [28]. Additionally, PM2.5 concentrations measured by the CDPH BAM during Fall 2023 and 2024 were representative of wildfire and non-wildfire monitoring periods, respectively.
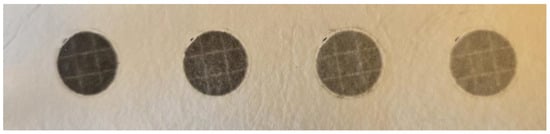
Figure 1.
Representative beta attenuation monitor (BAM) filter tape segment (24 h sampling) during wildfire smoke exposure periods at the California Department of Public Health (CDPH) in August 2023.
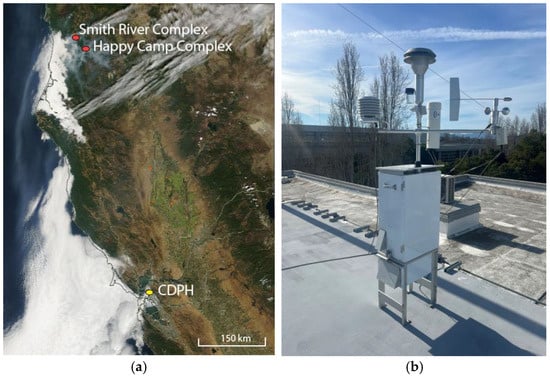
Figure 2.
(a) Locations of wildfires near California/Oregon border (red ellipses) in relation to sampling site (yellow ellipse) in Richmond, CA, USA on 19 September 2023. Satellite image was generated from NASA Worldview Snapshots. (b) Setup of BAM on the third-floor rooftop of the CDPH campus in Richmond, CA, USA.
Although both complexes were active during the fall, wind conditions resulted in smoke exposures for CDPH in mid-August and late September for the Happy Camp Complex and Smith River Complex, respectively, and limited the number of possible sampling days. Wind roses for the two wildfire and one non-wildfire periods mentioned previously were comparable and predominantly in the west and northwest direction [29]. A representative wind rose during the Smith River Complex is shown in Figure S1 of the Supporting Information.
Standard FEM parameters were used for the BAM except for the collection time [1]. Sample collection at each spot started at midnight each day and continued for 24 h at a flow rate of 16.7 L/min. During periods of heavy particulate matter loading, collection at one spot occurred at less than 24 h and the filter tape advanced to a new location due to manufacturer settings [13]. Hourly PM2.5 measurements from the CDPH BAM were averaged for daily measurements and compared to measurements during an analogous non-wildfire period.
2.2. Sample Preparation
BAM spots were punched from the filter tape roll using a hollow 7/16-inch diameter circular punch tool (part no. 3838/56180, Pittsburgh Tools, Calabasas, CA, USA). The size and shape of the punch tool matched those of the BAM spot to minimize interferences from the blank filter. The BAM spots were then directly transferred by stainless-steel tweezers to individual polypropylene centrifuge tubes for further sample preparation.
Single filter spots were extracted in 3 mL concentrated nitric acid (Optima, Fisher Scientific) in individual vessels in a multi-step sequence of vortexing and sonication to extract the particulate matter (Figure 3). Other solvents such as methanol (ACS reagent grade, Sigma Aldrich, Burlington, MA, USA) and acetone (ACS reagent grade, Sigma Aldrich, Burlington, MA, USA) were also tested for method optimization but had lower recoveries compared to nitric acid. During method optimization, extractions of multiple filter spots in one vessel were attempted but produced a slush-like material during sample processing.
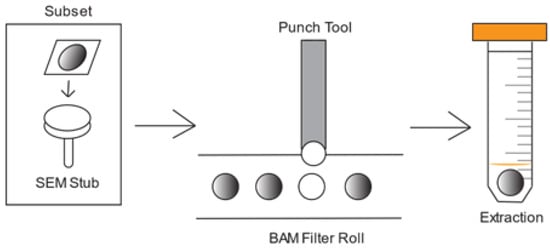
Figure 3.
Schematic of BAM filter sample preparation.
Extracts were vortexed for one minute using an analog vortex mixer (part no. 10153-838, VWR, Radnor, PA, USA) at maximum setting until the two layers (one with deposited particulates and one without) of the glass fiber filter were separated. The filter layer without deposited particles was manually removed from the extract using a glass stirring rod, and the remaining extract was then pulse sonicated (Blackstone-Ney Ultrasonics proSONIK, Jamestown, NY, USA) for 3 h at 30 °C. The following settings were used during sonication: Center: 5; Bandwidth: 5; Sweep t: 10; Train: 10; Degas t: 7; Bursts: 3; and Quiet t: 3. After sonication, the remaining filter was removed from the acidic extract solution using a glass stirring rod before microwave digestion (CEM Corporation Mars 6, Matthews, NC, USA) to further minimize the metal concentration attributed to the glass fiber filter. Microwave-assisted acid digestion occurred in four stages of 5 min of increasing temperature followed by 5 min of temperature hold (Stage 1: 90 °C, Stage 2: 100 °C, and Stages 3 and 4: 110 °C) at a power setting of 640 W. After cooling to room temperature, the acidic digestate was filtered through a 0.22 µm PTFE syringe filter and diluted with Type 1 water.
2.3. ICP-MS Materials and Methods
All filter samples were analyzed in helium mode (5.0 mL/min) using an inductively coupled plasma–mass spectrometer (ICP-MS, Agilent Technologies 7700x, Santa Clara, CA, USA) in pulse mode. Each sample was analyzed in replicates of three with 100 sweeps/replicate. Data processing was based on a peak pattern of three points. Calibration standards were prepared from commercially available multi-element standards (Spex CertiPrep Quality Control Standard 21, Metuchen, NJ, USA) and ranged from 0.25 to 50 µg/g solutions in 2% nitric acid with 10 µg/mL single-element standards of Sc, Ge, In, and Bi in 2% nitric acid (part no. CLSC2-1AY, CLGE9-1AY, CLIN2-1AY, and CLBI2-1AY, Spex CertiPrep, Metuchen, NJ, USA) prepared as internal standards. ICP-MS data were processed using the instrument software suite (Agilent MassHunter 5.2, Santa Clara, CA, USA). Statistical comparisons of elemental concentrations during wildfire and non-wildfire were performed using the two-sample t-test, assuming unequal variances.
Standard quality control samples such as reagent blanks, method blanks, matrix spikes, and matrix spike duplicates for each analytical batch of twenty samples were processed in the same manner as BAM filter samples, accordingly with control limits using criteria from EPA Method 200.8 [30]. Reagent blanks only contained the digestion acid while method blanks also had a blank BAM filter. Matrix spikes are method blanks that are spiked (added) with a known concentration of analyte. Matrix spike duplicates were also prepared to measure precision in an analytical batch. Minimum detection limit (MDL) studies were also performed according to EPA guidelines by spiking known concentrations of analytes in a minimum of seven, separate blank BAM filter spots and calculating the recoveries [31].
2.4. SEM-EDS Materials and Methods
A subset of 9 out of 25 sample spots were analyzed by mounting on adhesive carbon tabs on stubs using SEM-EDS for morphological and elemental comparisons of individual particles before ICP-MS analysis. Blank BAM filter tape was also analyzed by SEM-EDS for blank correction of the sample spots.
SEM-EDS analysis was conducted using an FEI XL30 Environmental SEM (Thermo Fisher Scientific, Madison, WI, USA) equipped with a Bruker Quantax energy-dispersive X-ray spectrometer (EDS) (Bruker, Billerica, MA, USA). To minimize the amount of sample charging under the electron beam, 0.5 mBar of water vapor was injected into the SEM chamber for wet-mode imaging and elemental analysis. Samples were imaged and analyzed at a working distance of 10 mm, 20 kV and wet mode using the back-scattered electron (BSE) detector.
As shown in Figure 3, filter subsamples for SEM analysis were not punched to isolate the particle deposit. Instead, the filter roll was cut such that the SEM subsample contained the circular particle deposit and the outer square perimeter of the blank filter which was used to attach to the specimen stub. After initial non-destructive imaging and elemental characterization by SEM-EDS, filter spots were removed using the hollow punch tool noted in Section 2.2, and samples were processed completely for ICP-MS analysis as noted in Section 2.3.
3. Results
Initial method development experiments focused on different extraction solvents using multiple elements available in the Spex Quality Control Standard 21 and then screened by matrix spike recoveries according to the EPA 200.8 method [30]. Table 1 and Table 2 list the ICP-MS calibration parameters and MDL for elements that met the screening criteria, respectively. The elements V, Cr, Mn, Co, Ni, Cu, As, Cd, Sb, and Pb had recoveries of 82–121% but other measured elements such as Fe and Zn had recoveries greater than 150% due to high blank values associated with the glass fiber filter matrix. The MDL for all reported elements was 0.001 µg/m3 based on a standard 24 h sampling time and 16.7 L/min flow rate. All field measurements are reported with blank correction determined from method blanks (unused glass fiber filters processed in the same analytical batch in the same manner as samples).

Table 1.
Calibration parameters for each element.
Table 2.
Minimum detection limits (MDL) for each element.
Average method blank concentrations using nitric acid as the extraction solvent were below 7 ng (concentration of the lowest instrument calibration standard) for Co, As, Cd, Sb, and Pb and ranged from 10 to 17 ng for V, Cr, Mn, Ni, and Cu (Figure S2). The analogous results for methanol as an extraction solvent were higher than for nitric acid. The average blank filter values were also below 7 ng for Co, As, and Cd, and ranged from 19 to 27 ng for Cr and Mn. Ni, Cu, and Pb were significantly higher than 1 µg (Figure S3 of the Supporting Information). The use of acetone as an extraction solvent was also impractical compared to nitric acid because the average concentrations of blank filters and previously collected filter samples used for method development were indistinguishable.
Figure 4 compares the PM2.5 concentrations measured during the Fall 2023 wildfire period with the analogous non-wildfire period in Fall 2024. During the 2023 wildfire period, peak daily PM2.5 concentrations occurred on 30 August and 20 September to 22 September and ranged from 16–35 µg/m3. During the 2024 non-wildfire period, average daily PM2.5 concentrations were less than 10 µg/m3 except on 30 September and 3 October, which had concentrations of 11 and 17 µg/m3, respectively.
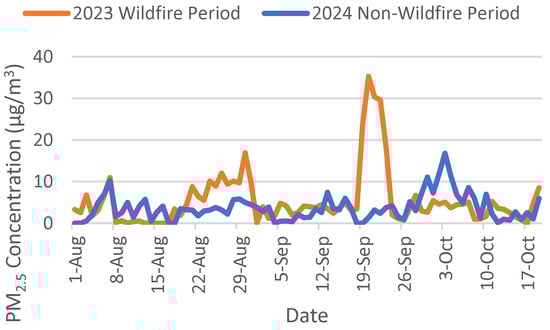
Figure 4.
Comparison plots of daily PM2.5 concentrations (µg/m3) at the BAM site in CDPH, Richmond, CA during a wildfire period in Fall 2023 (orange line) and non-wildfire period in Fall 2024 (blue line). Additional elemental analysis was performed for BAM samples collected on 12 August 2023 to 29 August 2023 and 19 September 2023 to 25 September 2023.
PM2.5 concentrations during the baseline non-wildfire period (0.9–4.9 µg/m3) were lower than concentrations during the Happy Camp Complex (0.1–12 µg/m3) and Smith River Complex (1.2–36 µg/m3) wildfire monitoring periods. Although PM2.5 measurements during the Smith River Complex monitoring period were higher than those during the Happy Camp Complex period, the higher PM values occurred during fewer days. PM levels measured during the Smith River Complex period were elevated for 4 days (19–23 September 2023) compared to the moderately elevated PM values over 2 weeks (18 August–1 September 2023) during the Happy Camp Complex period as shown in Figure 4.
Table 3 summarizes the PM2.5 and detected elemental concentration ranges obtained from the BAM site at CDPH during a non-wildfire period (April 2023), Happy Camp Complex period (August 2023), and Smith River Complex period (September 2023). Instrument errors for the CDPH BAM occurred between 12–14 August 2023 and 22–23 September 2023, and the respective PM2.5 data are excluded from Table 3. Individual daily ICP-MS results are listed in the Supporting Information (Tables S1–S3).
Table 3.
Summary of blank-corrected detected elemental concentration and PM2.5 (daily average from CDPH BAM) ranges during a non-wildfire period in April 2023, and wildfire smoke periods in August 2023 (Happy Camp Complex) and September 2023 (Smith River Complex). ND = below the minimum detection limits listed in Table 2. Individual daily results are listed in Tables S1–S3.
Although the PM concentrations were higher during the Smith River Complex collection period compared to the Happy Camp Complex period, the detected elemental concentrations do not exhibit a similar trend. The Cr and Cu concentrations were the highest during the Happy Camp Complex period in August 2023, while the V concentration was higher during the Smith River Complex period in September 2023. Other elemental concentrations such as for Mn, Co, Ni, As, Cd, Sb, and Pb were similar during both wildfire measurement periods and the baseline non-wildfire period in April 2023.
Figure 5 compares the distribution of elemental concentrations during non-wildfire (April 2023) and wildfire (August and September 2023) periods. Concentrations below the minimum detection limit are assigned zero.
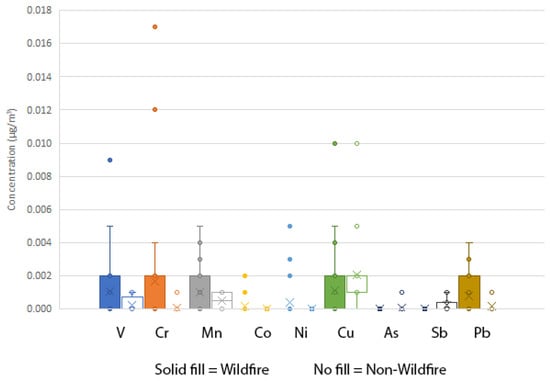
Figure 5.
Box plot of elemental concentrations (µg/m3) of particles measured from BAM filter tape spots collected during wildfire periods in August and September 2023 (solid fill) and a non-wildfire period in April 2023 (no fill) at CDPH, Richmond, CA, USA. Cd was not detected during both wildfire and non-wildfire periods.
As shown in Figure 5, the average elemental concentrations during the non-wildfire period were all less than 1 ng/m3 except for Cu (2.1 ng/m3). In contrast, there were several elements (V, Cr, Mn, and Cu) during the wildfire period with average elemental concentrations over 1 ng/m3, and the highest elemental concentration was for Cr (2.0 ng/m3). Average elemental concentrations for V, Cr, Mn, Co, Ni, and Pb were higher during the wildfire measurement period than the baseline non-wildfire period with a statistically significant higher difference for Cr (p < 0.05). Namely, Cr concentrations on 12 August 2023, 13 August 2023, 29 August 2023, and 20 September 2023 were 8, 12, 17, and 4 ng/m3, respectively. In comparison, the average Cr concentration during the non-wildfire period was below 1 ng/m3.
A representative SEM image of a BAM filter spot during a wildfire smoke period (23 August 2023) is shown in Figure 6a. The image features amorphous, irregular clusters of particles up to 5 µm in diameter embedded throughout the linear fibers of the BAM glass fiber filter. The elemental distribution of the particles is shown in Figure 6b indicating peaks corresponding to C, O, Zn, Si, Cl, K, Ca, Ba, and Fe. Table 4 lists the normalized % mass concentration of 10 particles shown in Figure 6a. In general, the particles have the same major elements with some variation of trace elements such as Mg, Al, Ti, and Zn. In total, C and O are approximately two-thirds of the normalized mass concentration, with the remaining elements each composing less than 10% of the total.
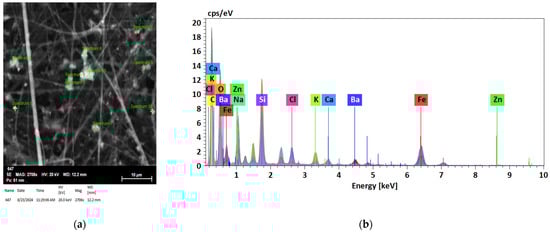
Figure 6.
(a) Scanning electron microscopy–energy-dispersive spectroscopy (SEM-EDS) image of BAM spot on 23 August 2023; and (b) overlaid elemental spectrum of the 10 analyzed BAM spots—different colors represent the different spectra.
Table 4.
Summary of normalized mass concentration (%) at multiple points on BAM filter analyzed by SEM-EDS.
The analogous SEM image, elemental spectrum, and normalized mass concentrations of a blank BAM filter are presented in Figure S4a, Figure S4b, and Table S4, respectively. The blank filter also features thin, linear glass fibers but does not have the irregular particles found in the BAM filter spot collected during the wildfire period. Although the elemental spectra and normalized mass concentrations of the BAM sample filter also indicate similar C, O, K, Ca, Ti, and Zn concentrations, the concentrations of other elements such as Fe and Ba are higher in the BAM sample filters with embedded particles.
4. Discussion
4.1. Method Development and Sampling
Although there are standardized methods for sampling PM using PTFE or MCE filters and analysis by ICP-MS, the ubiquity of BAM in real-time regulatory PM monitoring networks supports the need for a method to analyze the elemental composition of BAM glass fiber filters.
Several modifications of the PM2.5 BAM FEM sampling method acted in tandem to minimize the issue of high background metal concentrations in BAM glass fiber filter tape. Increasing the time resolution from 1 to 24 h produced more deposited particulate matter and, correspondingly, a higher ratio of metal sample concentration to background values. Despite the increased sampling time, daily PM2.5 measurements are helpful for a comparison to the 24 h exposure limits typically reported by the USEPA [32].
Physical methods (vortexing and sonication) were used to extract maximal particulate matter from the filter spot before the digestion step without the filter matrix. Due to the high background metal concentrations of glass fiber filters, the extraction of particles was a preferred approach to sample preparation compared to the complete digestion of the filter. Previously reported extraction efficiencies of glass fiber filters vary widely depending on the physical method and could range from 10–80% [33]. When digesting the entire filter using EPA Method IO-3.1, Raja et al. reported typical background metal concentrations of greater than 100 ng for one filter spot especially for the elements Na, Mg, Al, K, Ca, Fe, Zn, and Ba [18]. Although our extraction method is also limited by high background values for the same elements, the MDLs listed in Table 2 are significantly below the reference exposure levels and indicate that the method is appropriate for those elements of the highest health concern (Cr, Mn, Co, Ni, As, Cd, and Pb) [34]. The effectiveness of the extraction method was monitored by measuring recoveries of a spiked multi-element standard on an unused glass fiber filter spot of the same size. Recoveries ranged from 82 to 121%, which are similar to those from other studies [33].
The detection limits listed in Table 2 are comparable to those presented by other research groups [18]. The minimum detection limits are higher than those reported by the analogous Cooper Environmental Xact 625i, which has reported limits of less than 1 ng/m3 as the sampling time increases above one hour [15,16]. However, although our method does not have detection limits as low as standardized methods utilizing mixed cellulose ester or PTFE filters, the limits are significantly lower than the California Office of Environmental Health Hazard Assessment (OEHHA) health-based reference exposure limits [34]. The lowest published limit is 0.02 µg/m3 for Cd, which is greater than twenty times the MDLs listed in Table 2.
Although we report results based on extractions from single spots, multiple spots could be composited to potentially increase the amount of particulate matter in the extract. However, concentrations of the blank glass fiber filters tend to linearly increase as spots up to 24 are composited [18]. Additionally, we found that the extraction of multiple filter spots resulted in a slush-like consistency of the extract and introduced difficulties in manually separating the filter from the extract during the sample preparation process.
4.2. Analysis During Wildfire Smoke Events and Non-Wildfire Periods
As shown in Figure 4, the average daily PM2.5 was lower for the exposure period from the Happy Camp Complex compared to that of the Smith River Complex the following month. The daily PM2.5 plateaued at 5–10 µg/m3 for a week in late August (22–29 August 2023). In contrast, the daily PM2.5 was at least 20 µg/m3 on 19–23 September 2023 and exceeded the 35 µg/m3 daily regulatory limit on 20 September 2023 [32]. As shown in Figure 4, peak PM2.5 concentrations in Fall 2023 were elevated compared to the non-wildfire baseline period in Fall 2024. The wildfire comparisons in this work were intended primarily to demonstrate the utility of the analytical method and had limited background period data; future work could use additional data to strengthen such comparisons.
PM2.5 concentrations measured at CDPH during the Happy Camp Complex and Smith River Complex periods were significantly lower than those from the 2018 Camp Fire periods (240 km northeast) which reached over 100 µg/m3, significantly above regulatory limits [35]. The distance of the Camp Fire to CDPH was also approximately half of the distances from the Happy Camp and Smith River Complexes.
The elemental profiles of BAM filter tape spots collected during wildfire and non-wildfire periods differ in composition and concentration as plotted in Figure 5. The most abundant element during the non-wildfire period is Cu which is associated with traffic-related sources [36]. In contrast, several other elements of health concern such as Cr, Pb, Mn, As, and Cd were detected during the wildfire period in Fall 2023, although the concentrations are <10% of the reference exposure levels (RELs), and daily concentrations were often non-detectable [34]. In particular, the enrichment of Cr during the Happy Camp Complex and Smith River Complex wildfire periods is representative of the metals of health concern that can be detected using the ultrasonic extraction method. Although the detected concentrations during the Fall 2023 wildfire periods were low, chronic inhalation exposure of Cr (REL of 0.060 µg/m3) can lead to increased respiratory health effects [34,37].
4.3. Morphology of Individual Particulates on BAM Filter Tape by SEM-EDS
As shown in Figure 6a, irregular particles captured by the BAM filter during the wildfire were not present in the blank glass fiber filters (Figure S3a). The amorphous, irregular particles embedded in the BAM filter samples are similar in morphology and elemental composition to those reported by Gonzalez-Rocha et al., with a variety of potential sources such as crustal, traffic-related, and general industry [38], in addition to wildfires.
SEM-EDS analyses of the BAM blank filter indicate high concentrations of Al, Ba, Ca, Fe, K, Si, and Zn, which were also reported by Raja et al. [18]. Comparisons of the blank and sample filters only showed higher concentrations of Fe and Ba in the sample filter compared to the blank. Note that the elemental compositions are not representative because only up to 10 particles were analyzed per filter spot and SEM-EDS was not used as a bulk analysis.
4.4. Limitations and Future Work
One method limitation in this work is due to BAM 1022 parameters that limit the amount of particulate matter that can be collected in one location of the filter tape and automatically advance the filter tape to the next sampling location [13]. The Met One BAM 1020 and Environmental Beta Attenuation Mass (E-BAM) instruments do not have this feature and are able to sample particulate matter for the entire programmed duration time per spot and could be utilized in future work [39,40]. Alternatively, the sampling time of the BAM 1022 could be reduced during periods of poor air quality to counteract this effect.
The incorporation of PTFE or PTFE-coated tape instead of glass fiber filters into BAM instruments such as the Met One BAM 1022 PLUS could potentially allow for simplified elemental analysis by ICP-MS due to the low background metal values of PTFE [41]. Additionally, the smoothness of PTFE potentially allows for a different sample extraction/digestion process compared to the textured matrix of glass fiber filters. However, the BAM 1022 PLUS is intended for lower regulatory monitoring limits rather than periods of heavy air pollution such as wildfire smoke events [5].
Although our method reports low background values for several elements, high background concentrations of elements such as Fe and Zn persisted during sample filter extraction despite avoiding the complete digestion of the glass fiber BAM filters. Future work could involve additional extraction solvents and optimization of extraction parameters to improve existing recoveries and minimize BAM filter blank values. Additionally, equal-sized portions of the same BAM filter spots could be analyzed to obtain precision measurements similar to EPA Method IO-3.1 [21], although this approach is limited by the amount of collected particles.
Validated ICP-MS sample preparation methods have been published using a variety of acids such as HNO3, HF, and H3BO3 to completely digest PTFE filters [42]. Accordingly, due to the stepwise extraction steps of our method, the sample throughput would be minimized compared to a complete digestion preparation. The improvement of the sample throughput capability would improve the method’s usefulness for source apportionment techniques such as positive matrix factorization (PMF), which benefits from the inclusion of a large number of samples [43].
5. Conclusions
The elemental characterization of particulate matter in air samples remains a topic of significant interest in air quality research. In this study, we developed a BAM filter sample preparation method using ultrasonic extraction with nitric acid to minimize interference from the glass fiber filter matrix. The complete digestion of high-background filters often limits the feasibility of elemental analysis for BAM PM2.5 filters. However, extending the sampling duration beyond the standard Federal Equivalent Method parameters improved particulate loading on the filters and enhanced relative abundances compared to blanks. While certain elements, such as Zn, Fe, and Ba, suffered from background noise from the glass fiber filter tape, metals of health concern such as Pb, Mn, Cr, As, and Cd were validated with good recoveries and detection limits well below reference exposure thresholds. This makes the analytical protocol developed in this study a practical, reliable, alternative approach for heavy metal elemental analysis in routine air samples.
BAM samples collected during wildfire smoke periods in Fall 2023 were processed using this method and revealed elevated Cr levels compared to baseline, non-wildfire periods. The SEM-EDS characterization of individual particles on the BAM filters shows some potential, but only Fe and Ba were measurable at levels higher than blank values. The BAM ultrasonic extraction method can be further optimized and integrated into future studies for characterizing wildfire smoke events.
Supplementary Materials
The following supporting information can be downloaded at: https://www.mdpi.com/article/10.3390/atmos16040361/s1, Figure S1: Wind rose during Smith River Complex sampling period; Figure S2: Background values of single BAM filter spot extracted with nitric acid; Figure S3: Background values of single BAM filter spot extracted with methanol; Figure S4: SEM image and elemental spectrum of blank BAM spot; Table S1: Daily ICP-MS results in April 2023; Table S2: Daily ICP-MS results in August 2023; Table S3: Daily ICP-MS results in September 2023; Table S4: Normalized mass concentrations of multiple points of blank BAM spot.
Author Contributions
Conceptualization, K.C. and Z.-M.W.; methodology, K.C. and Z.-M.W.; validation, K.C. and Z.-M.W.; formal analysis, K.C. and Z.-M.W.; investigation, K.C. and Z.-M.W.; resources, K.K.; writing—original draft preparation, K.C.; writing—review and editing, K.C., Z.-M.W., J.W. and K.K.; visualization, K.C. and Z.-M.W.; supervision, Z.-M.W., J.W. and K.K.; project administration, Z.-M.W.; funding acquisition, K.K. All authors have read and agreed to the published version of the manuscript.
Funding
This research received no external funding.
Institutional Review Board Statement
Not applicable.
Informed Consent Statement
Not applicable.
Data Availability Statement
The raw data supporting the conclusions of this article will be made available by the authors upon request.
Acknowledgments
The authors thank Paul Wong for the preliminary experiments. The authors acknowledge use of imagery from the Worldview Snapshots application https://wvs.earthdata.nasa.gov (accessed on 27 January 2025), part of the Earth Observing System Data and Information System (EOSDIS). Wind roses were generated using NOAA Cooperative Network data obtained from the Midwestern Regional Climate Center, cli-MATE (MRCC Application Tools Environment, on/CLIMATE/. The mention of specific brands and model names is not intended as an endorsement of specific products. The findings and conclusions in this article are those of the authors and do not necessarily represent the views or opinions of the California Department of Public Health or the California Health and Human Services Agency.
Conflicts of Interest
The authors declare no conflicts of interest.
References
- EPA. List of Designated Reference and Equivalent Methods. Fed. Regist. 2023, 78, 67360. [Google Scholar]
- Xing, Y.F.; Xu, Y.H.; Shi, M.H.; Lian, Y.X. The impact of PM2.5 on the human respiratory system. J. Thorac. Dis. 2016, 8, E69–E74. [Google Scholar] [CrossRef]
- Thangavel, P.; Park, D.; Lee, Y.C. Recent Insights into Particulate Matter (PM2.5)-Mediated Toxicity in Humans: An Overview. Int. J. Environ. Res. Public Health 2022, 19, 7511. [Google Scholar] [CrossRef] [PubMed]
- Feng, S.; Gao, D.; Liao, F.; Zhou, F.; Wang, X. The health effects of ambient PM2.5 and potential mechanisms. Ecotoxicol. Environ. Saf. 2016, 128, 67–74. [Google Scholar] [CrossRef] [PubMed]
- EPA. Reconsideration of the National Ambient Air Quality Standards for Particulate Matter. Fed. Regist. 2024, 88, 5558–5719. [Google Scholar]
- Wang, Y.; Marshall, J.D.; Apte, J.S. U.S. Ambient Air Monitoring Network Has Inadequate Coverage under New PM2.5 Standard. Environ. Sci. Technol. Lett. 2024, 11, 1220–1226. [Google Scholar] [CrossRef]
- Roy, P.; Chen, L.W.A.; Gebreselassie, A.; Li, Y.; Chow, J.C.; Watson, J.G.; Chen, Y.-T. High time-resolution fenceline air quality sensing and dispersion modeling for environmental justice-centered source attribution. Atmos. Environ. 2023, 305, 119778. [Google Scholar] [CrossRef]
- Fos, P.J.; Honoré, P.A.; Honore, R.L.; Patterson, K. Health Status in Fence-Line Communities: The Impact of Air Pollution. Int. J. Family Med. Prim. Care 2021, 2, 1040. [Google Scholar]
- Sanchez, N.P.; Saffari, A.; Barczyk, S.; Coleman, B.K.; Naufal, Z.; Rabideau, C.; Pacsi, A.P. Results of Three Years of Ambient Air Monitoring Near a Petroleum Refinery in Richmond, California, USA. Atmosphere 2019, 10, 385. [Google Scholar] [CrossRef]
- Tehrani, M.W.; Fortner, E.C.; Robinson, E.S.; Chiger, A.A.; Sheu, R.; Werden, B.S.; Gigot, C.; Yacovitch, T.; Van Bramer, S.; Burke, T.; et al. Characterizing metals in particulate pollution in communities at the fenceline of heavy industry: Combining mobile monitoring and size-resolved filter measurements. Environ. Sci. Process. Impacts 2023, 25, 1491–1504. [Google Scholar] [CrossRef]
- Goldman, G.T.; Desikan, A.; Morse, R.; Kalman, C.; MacKinney, T.; Cohan, D.S.; Reed, G.; Parras, J. Assessment of Air Pollution Impacts and Monitoring Data Limitations of a Spring 2019 Chemical Facility Fire. Environ. Justice 2021, 15, 362–372. [Google Scholar] [CrossRef]
- Weitkamp, E.A.; Lipsky, E.M.; Pancras, P.J.; Ondov, J.M.; Polidori, A.; Turpin, B.J.; Robinson, A.L. Fine particle emission profile for a large coke production facility based on highly time-resolved fence line measurements. Atmos. Environ. 2005, 39, 6719–6733. [Google Scholar] [CrossRef]
- BAM 1022 Particulate Monitor Operation Manual. In BAM 1022-9805 Rev C; Met One Instruments, Inc.: Grants Pass, OR, USA, 2020.
- Anand, A.; Kompalli, S.; Ajiboye, E.; Presto, A.A. Estimation of hourly black carbon aerosol concentrations from glass fiber filter tapes using image reflectance-based method. Environ. Sci. Atmos. 2023, 3, 842–854. [Google Scholar] [CrossRef]
- Furger, M.; Minguillón, M.C.; Yadav, V.; Slowik, J.G.; Hüglin, C.; Fröhlich, R.; Petterson, K.; Baltensperger, U.; Prévôt, A.S.H. Elemental composition of ambient aerosols measured with high temporal resolution using an online XRF spectrometer. Atmos. Meas. Tech. 2017, 10, 2061–2076. [Google Scholar] [CrossRef]
- Asano, H.; Aoyama, T.; Mizuno, Y.; Shiraishi, Y. Highly Time-Resolved Atmospheric Observations Using a Continuous Fine Particulate Matter and Element Monitor. ACS Earth Space Chem. 2017, 1, 580–590. [Google Scholar] [CrossRef]
- Li, H.; Mazzei, L.; Wallis, C.D.; Davari, S.A.; Wexler, A.S. The performance of an inexpensive spark-induced breakdown spectroscopy instrument for near real-time analysis of toxic metal particles. Atmos. Environ. 2021, 264, 118666. [Google Scholar] [CrossRef]
- Raja, S.; Chandrasekaran, S.R.; Lin, L.; Xia, X.; Hopke, P.K.; Valsaraj, K.T. Analysis of Beta Attenuation Monitor Filter Rolls for Particulate Matter Speciation. Aerosol Air Qual. Res. 2017, 17, 14–23. [Google Scholar] [CrossRef]
- Watson, J.G.; Chow, J.C.; Chen, L.W.A.; Kohl, S.D.; Casuccio, G.S.; Lersch, T.L.; Langston, R. Elemental and morphological analyses of filter tape deposits from a beta attenuation monitor. Atmos. Res. 2012, 106, 181–189. [Google Scholar] [CrossRef]
- Li, X.; Zhang, X.; Qin, J.; Zhang, Y.; Chen, X.; Jia, J.; Feng, F.; Wu, H.; Bai, Y. Facile and fast elemental analysis using glass fiber filter by X-ray fluorescence. Spectrochim. Acta Part B At. Spectrosc. 2024, 216, 106951. [Google Scholar] [CrossRef]
- EPA. Compendium Method IO-3.1: Selection, Preparation and Extraction of Filter Material; EPA: Cincinnati, OH, USA, 1999. [Google Scholar]
- Wang, C.F.; Chin, C.J.; Chiang, P.-C. Multielement Analysis of Suspended Particulates Collected with a Beta-Gauge Monitoring System by ICP Atomic Emission Spectrometry and Mass Spectrometry. Anal. Sci. 1998, 14, 763–768. [Google Scholar] [CrossRef]
- Castilho, I.N.B.; Welz, B.; Vale, M.G.R.; de Andrade, J.B.; Smichowski, P.; Shaltout, A.A.; Colares, L.; Carasek, E. Comparison of three different sample preparation procedures for the determination of traffic-related elements in airborne particulate matter collected on glass fiber filters. Talanta 2012, 88, 689–695. [Google Scholar] [CrossRef] [PubMed]
- Roper, C.; Delgado, L.S.; Barrett, D.; Massey Simonich, S.L.; Tanguay, R.L. PM2.5 Filter Extraction Methods: Implications for Chemical and Toxicological Analyses. Environ. Sci. Technol. 2019, 53, 434–442. [Google Scholar] [CrossRef] [PubMed]
- Pietrogrande, M.C.; Bacco, D.; Trentini, A.; Russo, M. Effect of filter extraction solvents on the measurement of the oxidative potential of airborne PM2.5. Environ. Sci. Pollut. Res. 2021, 28, 29551–29563. [Google Scholar] [CrossRef] [PubMed]
- Mahdavi, A.; Siegel, J.A. Extraction of dust collected in HVAC filters for quantitative filter forensics. Aerosol Sci. Technol. 2020, 54, 1282–1292. [Google Scholar] [CrossRef]
- Sanchez, C.; Ericsson, M.; Carlsson, H.; Colmsjö, A. Determination of organophosphate esters in air samples by dynamic sonication-assisted solvent extraction coupled on-line with large-volume injection gas chromatography utilizing a programmed-temperature vaporizer. J. Chromatogr. A 2003, 993, 103–110. [Google Scholar] [CrossRef]
- Current Emergency Incidents. Available online: https://www.fire.ca.gov/incidents (accessed on 12 August 2023).
- NOAA Regional Climate Centers (RCCs), ACISA. Available online: http://xmacis.rcc-acis.org/ (accessed on 23 February 2025).
- EPA. Method 200.8: Determination of Trace Elements in Waters and Wastes by Inductively Coupled Plasma-Mass Spectrometry; EPA: Cincinnati, OH, USA, 1994. [Google Scholar]
- EPA. Determination and Procedure for the Determination of the Method Detection Limit, Revision 2; EPA: Cincinnati, OH, USA, 2016. [Google Scholar]
- EPA. Determination of Attainment for the San Francisco Bay Area Nonattainment Area for the 2006 Fine Particle Standard; California; Determination Regarding Applicability of Clean Air Act Requirements; EPA: Cincinnati, OH, USA, 2013; 40 CFR 52, 3. [Google Scholar]
- Sober, M.; Nikolin, B. Determination of the extraction efficiency of polycyclic aromatic hydrocarbons from airborne particulate matter. Biomol. Biomed. 2003, 3, 40–43. [Google Scholar] [CrossRef][Green Version]
- OEHHA. Air Toxics Hot Spots Program; Office of Environmental Health Hazard Assessment: Oakland, CA, USA, 2015. [Google Scholar]
- Wang, Z.-M.; Wang, P.; Wagner, J.; Kumagai, K. Impacts on Urban VOCs and PM2.5 during a Wildfire Episode. Environments 2024, 11, 63. [Google Scholar] [CrossRef]
- Liu, J.; Banerjee, S.; Oroumiyeh, F.; Shen, J.; del Rosario, I.; Lipsitt, J.; Paulson, S.; Ritz, B.; Su, J.; Weichenthal, S.; et al. Co-kriging with a low-cost sensor network to estimate spatial variation of brake and tire-wear metals and oxidative stress potential in Southern California. Environ. Int. 2022, 168, 107481. [Google Scholar] [CrossRef]
- Shin, D.Y.; Lee, S.M.; Jang, Y.; Lee, J.; Lee, C.M.; Cho, E.M.; Seo, Y.R. Adverse Human Health Effects of Chromium by Exposure Route: A Comprehensive Review Based on Toxicogenomic Approach. Int. J. Mol. Sci. 2023, 24, 3410. [Google Scholar] [CrossRef]
- González-Rocha, S.N.; Pérez, E.S.; Bermúdez, R.E.C.; Velasco, L.R.; Mendez, I.P.; Baca, R.A.; Quiroz, J.J.S.; Cortés, R.R. Elemental chemical characterization and morphology of PM10 using SEM/EDS in air quality monitoring station filters in Poza Rica, Veracruz, Mexico. Braz. Appl. Sci. Rev. 2023, 7, 2–20. [Google Scholar] [CrossRef]
- BAM 1020 Particulate Monitor Operation Manual. In BAM 1022-9800 Rev W; Met One Instruments, Inc.: Grants Pass, OR, USA, 2016.
- E-BAM Particulate Monitor Operation Manual. In E-BAM-9805 Rev B; Met One Instruments, Inc.: Grants Pass, OR, USA, 2019.
- BAM 1022 PLUS Particulate Monitor Operation Manual. In BAM 1022 PLUS-9800 Rev A; Met One Instruments, Inc.: Grants Pass, OR, USA, 2023.
- Camilleri, R.; Stark, C.; Vella, A.J.; Harrison, R.M.; Aquilina, N.J. Validation of an optimised microwave-assisted acid digestion method for trace and ultra-trace elements in indoor PM2.5 by ICP-MS analysis. Heliyon 2023, 9, e12844. [Google Scholar] [CrossRef] [PubMed]
- Kim, E.-A.; Koh, B. Utilization of road dust chemical profiles for source identification and human health impact assessment. Sci. Rep. 2020, 10, 14259. [Google Scholar] [CrossRef]
Disclaimer/Publisher’s Note: The statements, opinions and data contained in all publications are solely those of the individual author(s) and contributor(s) and not of MDPI and/or the editor(s). MDPI and/or the editor(s) disclaim responsibility for any injury to people or property resulting from any ideas, methods, instructions or products referred to in the content. |
© 2025 by the authors. Licensee MDPI, Basel, Switzerland. This article is an open access article distributed under the terms and conditions of the Creative Commons Attribution (CC BY) license (https://creativecommons.org/licenses/by/4.0/).