Abstract
This study establishes a dataset of ancient military defense system sites in the Hexi Corridor area from the Han Dynasty to the Qing Dynasty to analyze the temporal changes and spatial distribution characteristics of the military defense system in different periods. In addition, it compares the climate characteristics of the Hexi Corridor area though the past 2000 years. It also discusses the possible relationship between the construction of the Hexi military defense system and climate change. We found that the Han and Ming Dynasties were the main periods for constructing the regional military defense system. Furthermore, the Wei, Tsin, and Southern and Northern Dynasties expanded the scale based on the previous period. As a result, the spatial distribution was highly concentrated. During this time, multiple cold–dry and warm–humid periods occurred in the region. Moreover, significant climate change coincided with the heyday of building military facilities and the period of frequent warfare. Environmental factors have an impact on the spatial distribution of military sites. Therefore, the northern border war was the direct cause of the construction of the military defense system. However, the transformation of the environment caused by climate change was the fundamental driving force for this process, evolving across different eras.
1. Introduction
Designated as a World Heritage Site in 1987, the Great Wall of China symbolizes Chinese nationality and identity. The Great Wall heritage is not just a linear barrier but an overall military defense system including the Great Wall itself (including the wall, enemy towers, beacons, barriers, and trenches), forts, military settlements, post system, and related remains [1]. It stretches across northern China, runs through east and west, and has witnessed the rise and fall of ancient dynasties. Starting from the perspective of protection and development, the academic community has carried out extensive research on the ancient military defense system in northern China with the Great Wall as the main body [2,3,4,5,6,7,8,9,10,11,12,13]. The development characteristics of the military defense system in different regions and periods since the Han Dynasty, including the initial period of the Han Dynasty, the construction period of the Wei, Tsin, and Southern and Northern Dynasties and the Song, Liao, and Jin Dynasties, the stagnation period of the Five Dynasties (Yang) and Ten Kingdoms (Yuan and Qing) [14,15,16], and a mature period in the Ming Dynasty, reflect the rise and fall of the military defense system in northern China. It was the epitome of the ancient Chinese dynasties and their social development. Therefore, discussing the strengths and weaknesses of the military defense system in ancient northern China serves as a vital reference function for understanding its historical process. It is particularly useful for interpreting regional conflicts and dynastic and social changes. The variations in the construction strength of the military defense system in northern China across dynasties are currently summarized as the harassment by northern nomads, the refutation of cultural awareness, political differences, and the interplay between military and political strength and strategy [12,17,18,19,20,21]. The differences in construction caused by changes in the social environment should be noted. However, the natural environment’s impact is rarely discussed. Therefore, this article aims to take this perspective.
The Hexi Corridor in Gansu, China, constituted a relatively independent geographical unit, connecting the Guanlong region in the east, the Western Regions in the west, the Hehuang region in the south, and the Huns and Mongolia in the north. The Hexi Corridor was characterized by its extensive distribution of interfluvial valleys and vast oases, presenting a diverse and complex natural environment. The terrain gradually descended from east to west, with elevations ranging between 1000 and 2000 meters above sea level. The climate typically followed a temperate continental arid pattern, where annual precipitation remained scarce and was predominantly concentrated during summer months. The Qilian Mountains served as the primary water source, with rivers such as the Heihe, Shule, and Shiyang originating from this range and flowing through the corridor. This landscape supported both fertile oasis farmlands suitable for cultivation and expansive grasslands ideal for pastoral grazing, establishing the region as a convergence zone where the Central Plains’ agricultural civilization and northern nomadic pastoralist cultures intersected. The area witnessed continuous interactions and conflicts between these two distinct civilizational patterns throughout historical periods. Therefore, it has repeatedly been designated as an important military site (Figure 1). The Central Plains Dynasty and the northern tribes have long competed for its control. During historical periods, the Hexi Corridor area was the most important military defense in the Northwest region. It played a pivotal role in guarding the Silk Road, resisting harassment by northern nomads, blocking incursions from the Northwest, and stabilizing the Central Plains. Therefore, after the Han Dynasty opened the Western Regions and established the four prefectures in Hexi, successive dynasties in the Corridor established a series of military management systems such as the Hexi, Juyan, and Gansu Town Garrison Zones, the Anxi Dufu, and the Hexi Jiedushi [22,23]. These zones gradually formed a complete military defense system. The construction of the military defense system was complete and orderly. It was representative of the military defense system in ancient northern China. Furthermore, it has become an ideal area for research.
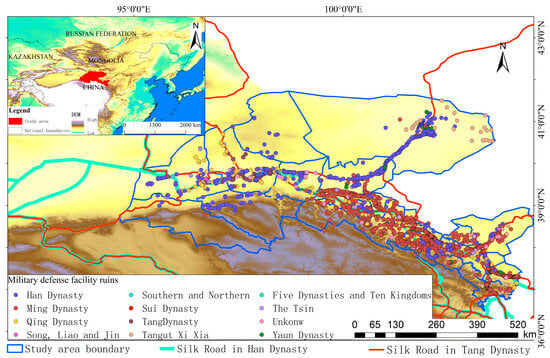
Figure 1.
Sites and locations of military defense facilities in the Hexi Corridor.
In existing studies, scholars have discussed the possible relationship between dynastic and social changes in ancient China and climate and environmental changes in historical periods. They have concluded that climate and environmental changes have impacted Chinese history to a significant extent [24,25,26,27,28]. In contrast, the discussion of the relationship between the military defense system in ancient northern China and climate and environmental changes has been less extensive. Thus, the relationship between these factors remains unclear. This article aimed to investigate the spatiotemporal changes in the military defense system of the Hexi Corridor from the Han Dynasty to the Qing Dynasty in 2000 and explore the possible relationship between climate and environmental changes in the evolution of military sites, providing a reference point for studying the interaction between climate change and human society.
2. Materials and Research Methods
2.1. Data Collection and Processing
This paper collects and records the locations, attributes, and geographical environment information of military ruins, buildings, facilities, city sites, walls, and towers (categories of cultural relics) in the Hexi Corridor from the Han to the Qing Dynasty (221 BC–1912 AD). The facilities include city sites, beacons, enemy and pier towers, side walls, barrier sites, forts, post stations, trenches, and other archaeological ruins. For the first time, a dataset of ancient military sites has been compiled. It covers the entire Hexi Corridor throughout its history. Due to the ancient military defense system’s expansion into Jinta County, Jiuquan City, the Hexi Corridor extended into the Ejina Banner area of the Alxa League in Inner Mongolia. Therefore, for the sake of data integrity, we also collected information on archaeological sites in the Ejina Banner area. The site data used in this paper were mainly realized through the digitization of written materials. These documents are the result of years of archaeological excavations in Gansu and Inner Mongolia, combined with the “Yearbook of Chinese Archeology” published by the Chinese Archaeological Society with the support of the State Administration of Cultural Heritage of China and the “Atlas of Chinese Cultural Relics Gansu: Inner Mongolia Volume”, “Investigation and Research on Hexi Hansai”, “Important Archaeological Discoveries in Gansu”, and “Research on the Historical Geography of the Silk Road Traffic Route (Chinese Section)” published by Jiangsu People’s Publishing House, as well as the “Witness of Grassland Civilization Ejina Banner” and “Hexi Corridor Historical Geography Research”, and supplemented by the results of China’s Third National Survey of Cultural Relics [29,30,31,32,33,34]. In this dataset, sites with unknown ages are denoted. In addition, information from different eras concerning the same sites is individually entered. Figure 2 shows the 2845 sites collected. According to the written description, the position of the archaeological ruins in the satellite image is calibrated. Its latitude and longitude information was recorded and verified by archaeological excavation reports and sampling field surveys. The heterogeneous sources of primary materials and inconsistent statistical methodologies employed in this study posed significant challenges during the archaeological site data collection process, potentially compromising dataset quality. Consequently, we adhered to rigorous protocols and standardized procedures throughout the information-gathering phase. While minor discrepancies in the recorded data were acknowledged, the aggregate data characterization remained sufficiently robust across both the temporal scope and geographical parameters of this investigation to fulfill the research objectives effectively.
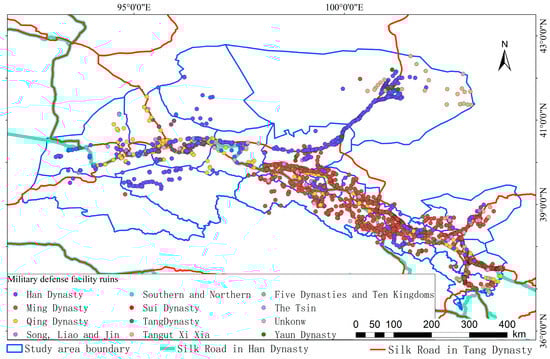
Figure 2.
Spatial distribution of military defense facilities during different periods in the Hexi Corridor.
Considering the lack of regional representation of any individual record, the climate and environment proxy indicators in this paper are drawn primarily from 4500-year precipitation data reconstructed from tree-ring widths in Juniper Qilian Juniper in Qilian County, Qinghai Province [35,36,37], a dataset of quantitative temperature and monsoon precipitation in northern China over the past 5000 years [38], and the 1556 tree-ring width precipitation data of Qilian Juncypress in Qifeng Town, Jiuquan City [39]. The selected dataset was collected in or near the Hexi area, which provides good-quality climate change records. Moreover, the tree-ring chronological framework adopted has high precision, high resolution, and clear environmental indication significance.
Digital elevation model (DEM) elevation data with a resolution of 30 m were obtained from the geospatial data cloud website (http://www.gcloud.cn, accessed on 1 January 2025), and 1:1 million-scale vegetation type spatial distribution data for China come from the Chinese Academy of Sciences Resource and Environmental Science Data Center (http://www.resdc.cn/Default.aspx, accessed on 1 January 2025) [40]. Chinese soil attribute data and landform type data come from the National Qinghai–Tibet Plateau Science Data Center (http://data.tpdc.ac.cn, accessed on 1 January 2025) [41,42]. Based on the above data, ArcGIS10.2 was used to extract and produce data on elevation, water system, slope, slope direction, soil type, and landform type for each site.
2.2. Method
The Maxent model is the realization of the maximum entropy theory. When the known conditions are met, and no biased assumptions are made concerning unknown situations, it obtains the least risky simulation results [43]. Maxent modeling is performed as follows. First, after selecting the appropriate environment variable, the boundary is unified. Next, the coordinates and resolution data on the environment variable are rasterized, the settlements are saved in comma-separated value (CSV) format, and relevant parameters are set. Finally, the environmental information is saved in American Standard Code for Information Interchange (ASCII) format.
MaxEnt mainly infers potential distribution areas based on known distribution points and environmental variables, while the location of military facilities may be influenced by factors such as terrain, water sources, and transportation routes, similar to how species habitats are affected by climate, soil, and other factors [44,45,46,47]. Therefore, we combined environmental variables such as soil, vegetation, terrain, landforms, and distance from rivers to simulate the defense range of military defense sites using this model. The model simulation results were tested by the Area Under Curve (AUC) of the Receiver Operating Characteristic Curve (ROC). Model accuracy was high. It was highest when it achieved a value greater than 0.9. For model simulation accuracy verification, Kvamme’s Gain Statistics were used to evaluate the accuracy of simulation results. Results whose gain value is close to 1 are considered final. These results were loaded into ArcGIS for visualization to obtain a hierarchical probability map.
Kernel density analysis is a non-parametric estimation research method. In this paper, the point data of the spatial distribution of military defense sites are used to smooth the space. In addition, the total number of all reference point positions on the surface of the plaque is obtained to count sample point density [44]. A higher density value indicates that data points in that area are more densely packed; a lower density value suggests that the data points are more sparsely distributed.
GeoDetector is a set of statistical analysis methods that detect the spatial heterogeneity of variables, reveal the correlation between variables, and reflect the driving force behind them [45,46]. The GeoDetector model is composed of four sub-models: a factor detector, interaction detector, risk detector, and ecological detector. This article mainly uses the core module of GeoDetector, the factor detector, to quantitatively study the effect of natural and socio-economic factors on the heavy metal loading of dust in the study area. The influence of differentiation and the calculation method of the factor detector q value are detailed in the literature [45].
3. Spatiotemporal Evolution of the Military Defense System Scale in the Hexi Corridor
3.1. Time-Varying Characteristics of the Scale of the Military Defense System in the Hexi Corridor
The changes in the area and quantity of military defense sites can effectively measure their strength during a certain period. Therefore, this paper calculates and presents statistics on the average area and number of military sites constructed in each period (the chronology of each dynasty can be found in the Supplementary Manual: Chronology of Dynasties) (Figure 3). The results show that the Han and Ming had the largest number of military defense facilities among all dynasties. In particular, the construction intensity of military defense facilities in the Ming Dynasty reached its peak, followed by the Wei, Tsin, Tang, and Qing Dynasties. These sites were classified together as another category, where the number of constructions remained between 100 and 200. The Southern and Northern Dynasties, Sui Dynasty, Five Dynasties and Ten Kingdoms, Song, Liao, and Jin Dynasties, Xixia Period, and Yuan Dynasty are the third category, and the number of constructions is small (n < 100). So, at this time, construction was at a low ebb. To understand this fluctuation, the strength and length of the existence of the dynasty should be considered. The Han and Ming Dynasties were the two most prosperous dynasties in Chinese history. They had sufficient national strength and time to engage in construction work. The Song, Liao, and Jin Dynasties and the Xixia Period saw many challenges, such as national power decline, civil strife, and instability compared to the Wei, Tsin, Sui, and Southern and Northern Dynasties and the Five Dynasties and Ten Kingdoms. The continuous development of major defense projects was difficult to maintain. The military defense system has been built. However, the results are not significant. Furthermore, the changes in rulers’ ideas and the country will mean that although the Tang and Qing Dynasties had sufficient time and strength, they were not eager to construct military defense facilities.
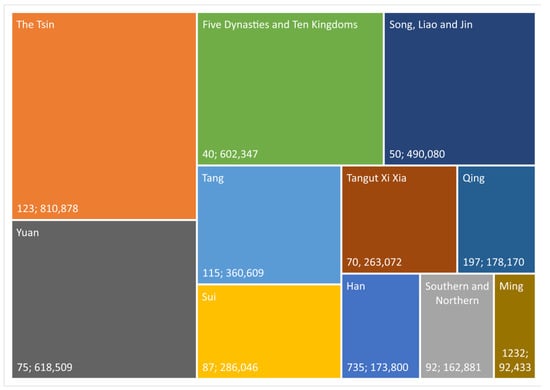
Figure 3.
Average area and number of military defense facilities in the Hexi Corridor. The data labels in the figure represent the number of sites and the average area. For example, (123; 810,878) represents 123 sites, with an average area of 810,878 square meters during that period.
In terms of scale (Figure 3), the average construction area during the Wei and Tsin Dynasties, the Five Dynasties and Ten Kingdoms, and the Yuan Dynasty was in the first echelon. Their construction areas were significantly larger than in other periods. Most of their preserved ruins are city sites with large building areas. Moreover, Central Plains management and the establishment of minority regimes have improved the Hexi area’s oversight, settlement, and political and economic functioning. Therefore, the number is small, but the scale is large. In contrast, the Han and Ming Dynasties emphasized the construction of beacon and enemy towers and barrier cities [47,48,49]. These edifices made the average building scales of the Han and Ming Dynasties smaller. Wei Tsin, Northern and Southern, Xixia, and Tang Dynasties also possess this feature.
3.2. Spatial Variation Characteristics of the Military Defense System Scale in the Hexi Corridor
Figure 4 shows the results obtained using Kernel density to accurately describe the spatial layout characteristics of elements of military defense facilities and analyze differences and trends. The circle in the figure represented the standard deviation ellipse result, which reflected the spatial concentration or dispersion directionality of the site. The smaller the circle, the more concentrated it is.
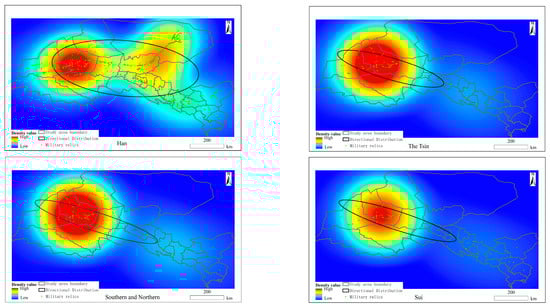
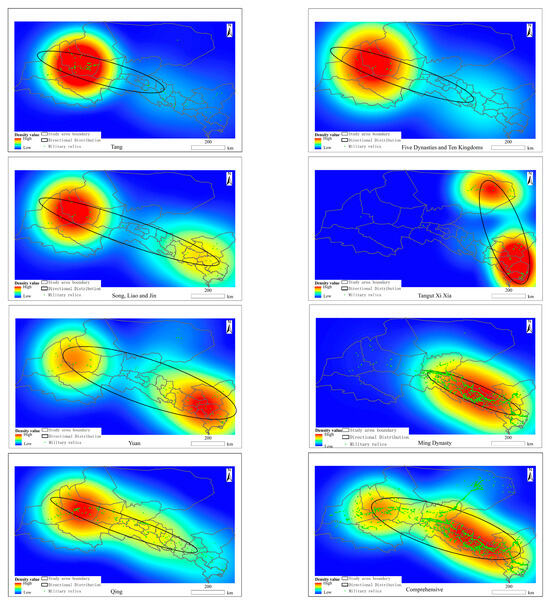
Figure 4.
The distribution density of military defense facilities in the Hexi Corridor in different periods.
As seen in Figure 4, during the Han Dynasty, the building density of military defense facilities in the Hexi Corridor experienced a shift from west to east and from north to south. The defense centers of Juyanhai in the north of the Hexi Corridor and Jiuquan in the west of the Han Dynasty, and Jiuquan in the Wei, Tsin, Southern and Northern Dynasties and the Sui, Tang, and Five Dynasties, were formed by the eastward shift of the strategic center of gravity during the Song, Liao, Jin, Xixia, and Yuan Dynasties. A similar eastward trend occurred involving the Jiuquan, Ejina Banner, and Jinchang defense centers. The Ming Dynasty further moved eastward to form the Wuwei defense center, and the Qing Dynasty expanded westward to restore the western defense center. The spatial change of the distribution density of military defense facilities depended on the demand. Thus, the demand changed across different periods for resisting external intrusion and maintaining internal stability. We speculated that as the historical situation evolved, the different strategies and distributions of invaders and defenses at different stages produced this result.
Since the Han Dynasty, the changes in the military defense system in the Hexi Corridor area have been reflected in the spatial movement and combination of positions.
The average nearest neighbor index (R) is an accurate indicator of the agglomeration or discrete distribution of military defense facilities (R = 1, showing random distribution characteristics; R < 1, showing agglomerated distribution characteristics; R > 1, showing discrete distribution characteristics). The average nearest neighbor index in each period: Han Dynasty: 0.2709, Wei and Tsin Dynasties: 0.2965, Southern and Northern Dynasties: 0.3836, Sui Dynasty: 0.3847, Tang Dynasty: 0.3711, Five Dynasties and Ten Kingdoms Period: 0.3615, Song, Liao, and Jin Dynasties: 0.4151, Xixia Period: 0.3983, Yuan Dynasty: 0.3886, Ming Dynasty: 0.2923, and Qing Dynasty: 0.5146. The calculation results show that the distribution of military defense facilities in different periods was clustered, with military defense facilities concentrated in local areas.
3.3. Division of Military Defense Levels in the Hexi Corridor
As a critical area, differences are evident in the distribution of the military defense system in the Hexi Corridor. These variations reflect the difference in fortification levels in the area. Such differences are of great significance for an in-depth understanding of the military defense strategy in this region. Therefore, an accurate model should be based on the environmental variable information related to military defense facilities (soil, vegetation, and landform types, section curvature, altitude, slope, slope aspect, and distance from the Silk Road’s main line). The Maxent model simulates the ideal area for the construction of military defense facilities used as the fortification level. Figure 5 displays the simulation. Figure 6 shows the AUC curve of the simulation results, with a gain value of 0.755 > 0.6 (significant value). The gain value demonstrates that the simulation results were credible.
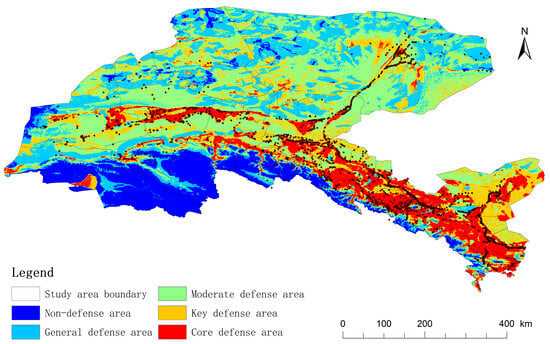
Figure 5.
Simulation of military defense levels in the Hexi Corridor area.
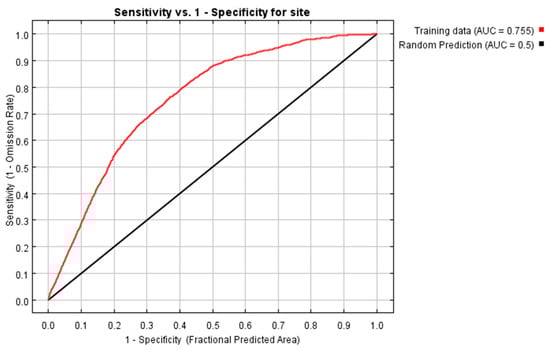
Figure 6.
AUC curve of simulation results.
Based on the ideal effectiveness of military defense facilities, this article categorizes the simulation results into five regional types: core, key, moderate, and general defense and non-defense. Among these categories, the narrow corridor with Wuwei and Jinchang as the main body constitutes the core defense area. It extends north and west to Minqin, Ejina Banner, and the Dunhuang area in the lower reaches of the Shule River, becoming a defensive outpost for intrusions from the south and west. At the same time, due to the relatively flat terrain in the west and north of the corridor, the ease of traversal, many passages, and a large defense area, the core is distributed contiguously in groups with the Ruoshui–Shule River as the main line.
3.4. Environmental Landscape Characteristics of Military Defense Sites in Different Periods
We conducted statistical analyses on soil types, landform categories, and vegetation communities of military sites located across different historical periods. For analytical purposes, we focused on the top five most prevalent landscape types within each category as this selection ensures robust statistical significance for the study. These findings are detailed in the document titled “Statistical Results of Landscape Type Distribution Patterns in Military Sites Across Different Periods” (Supplementary Manual).
The statistical analysis of soil types reveals that Grey-brown desert soil dominated military site distribution throughout all dynasties, maintaining consistent prominence. It accounted for 15.7% (444 cases) in the aggregated analysis and ranked among the top three in 10 out of 12 historical periods. It notably peaked during strong centralized dynasties: Han (16%), Tang (14.7%), and Ming (17.2%). Desert aeolian soils exhibited significant temporal variation, securing top-five positions in eight periods with an overall proportion of 9.2% (260 cases). Their prominence notably increased during nomadic regimes (Liao–Jin and Xia–Western Xia) reaching 21.4%. Gypsum brown desert soil demonstrated pronounced cyclical patterns, achieving maximum proportions during periods of political fragmentation: Qin (14.8%) and Southern–Northern Dynasties (15.2%). Peat soil (PS) exhibited sporadic occurrence, only attaining 15% coverage during the Five Dynasties and Ten Kingdoms period, potentially indicating anomalous climatic conditions.
The statistical analysis of landform types indicated that mid-altitude alluvial plain maintained consistent dominance across nine periods, constituting 26.3% (742 cases) of total occurrences. Its highest proportions occurred during unified dynasties: Han (21%), Tang (31.3%), and Qing (38.5%). The mid-altitude dry alluvial plain showed pronounced variability, with elevated proportions during fragmented periods: Southern–Northern Dynasties (35.8%) and Sui (31.9%). The mid-altitude small undulating mountains persisted in top-five rankings throughout all periods, accumulating 13.8% (389 cases). Mid-to-high altitude undulating mountainous areas experienced marked expansion during the Ming Dynasty (6.5%), reflecting intensified mountainous development.
The statistical analysis of vegetation types revealed that temperate semi-shrub/dwarf semi-shrub desert maintained top-tier status in eight periods, comprising 25.7% (724 cases). Notable peaks occurred during Qin (30.5%), Southern–Northern Dynasties (33.7%), and Ming (31.1%). Cold-resistant cultivated crops exhibited intermittent dominance, accumulating 20.4% (575 cases) with peak occurrences in Han (14.6%), Five Dynasties and Ten Kingdoms (32.5%), and Yuan (30.6%). Temperate grasses/miscellaneous grasses/saline meadows remained persistent top-five contributors at 10.2% (287 cases). Temperate shrub desert showed significant dynastic variation: prominent in Han (11.3%), Qin (16.6%), and Qing (8.6%).
Figure 7 shows the statistical results of the DEM-derived terrain analysis. We noticed that the slope distribution exhibited pronounced temporal variability: an abnormal peak in the Ming Dynasty (3.82°), which was significantly higher than the mean 1.4–2.2°. Secondary peaks in Yuan (2.20°) and Xia–Western Xia (2.05°) reflect the northern regimes’ geographical characteristics. Minimal slopes during Tang–Song Dynasties (1.4–1.5°) indicate geomorphic preferences.
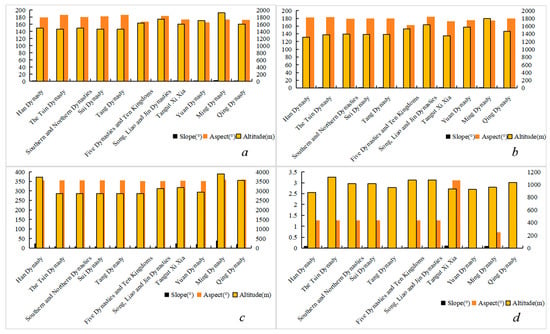
Figure 7.
Statistical results of topographic factors affecting the distribution of archaeological sites in different periods. The vertical axis on the right represents altitude, where (a) is the average value of each factor, (b) is the median, (c) is the maximum value, and (d) is the minimum value.
Aspect analysis revealed consistent solar orientation: overall south-facing (165–186°), anomalous westerly deviation in Five Dynasties and Ten Kingdoms (167.3°), and pronounced southeastern orientation in Yuan Dynasty (165.7°). Altitudinal gradient showed evolutionary pattern: early dynasties (Han–Tang): 1500 m zone. Medieval dynasties (Song–Yuan): 1700 m zone. Ming peak at 1920 m (possibly related to frontier expansion), Qing regression to 1603 m.
The correlation analysis of the above variables indicated a significant positive slope–altitude correlation (r ≈ 0.62), with steeper slopes at higher elevations (e.g., Ming Dynasty). Additionally, it showed a weak negative slope–aspect correlation, manifesting as northwest inclination in high-elevation zones (Yuan-Ming). Unified dynasties (Han–Tang–Ming) exhibited more regular topographic parameters compared to fragmented periods.
Based on the river distribution data, we conducted statistical analysis using the straight-line distance from military sites to rivers as the variable (Table 1). It should be noted that this study spans a 2000-year timeframe, during which climatic fluctuations (temperature and precipitation changes) and geomorphic processes could have caused river disappearance, emergence, and channel modifications. Consequently, the current river distribution pattern cannot adequately reflect ancient river systems. Furthermore, human water sources extended beyond rivers to include springs, wells, and other groundwater systems—factors critical for sustaining activities in regions distant from major watercourses. While modern spatial technologies remain incapable of fully reconstructing extinct or cryptic water sources, this research primarily examines the systematic role of perennial rivers in supporting military infrastructure, serving as a reference framework for analysis.

Table 1.
The distance between military defense facilities and rivers in different dynasties (km).
Statistical results reveal that most dynasties maintained an average distance of 4.1–4.6 km between military facilities and rivers, indicating a stable hydrological dependency pattern. The mean distance generally exhibited a fluctuating upward trend from the Han to the Qing Dynasty, reaching its peak in the Ming Dynasty (5.14 km) and its minimum during the Han period (3.40 km). The Han Dynasty’s military installations demonstrated exceptional proximity to rivers, with a mean distance of only 3.40 km and a minimum of 0.12 km, reflecting strategic reliance on natural river barriers for controlling key crossings [50]. Although the Tang Dynasty showed a slight increase in mean distance (4.19 km), its median value remained at 2.5 km, underscoring continued river-centric defense planning.
During the Five Dynasties–Song–Yuan periods (mean distances 4.20–4.50 km), there was a marked expansion in defense distances while maintaining a median of 2.5 km. This shift likely coincided with intensified warfare prompting the development of multi-layered defenses incorporating walls, beacon towers, and other structures to supplement river-based barriers [51]. The exceptional high value observed in the Tangut Xixia Dynasty (7.19 km) correlates with its unique geographical position in the Hetao region, requiring defense against multi-directional threats.
The Ming Dynasty’s record mean distance of 5.14 km (with maximum 30 km) signifies a fundamental transformation in riverine defense strategies. This era witnessed the establishment of coordinated defense networks comprising riverbanks, military settlements, and strategic garrison points, reducing reliance on single river barriers [51]. Conversely, key installations such as Piantou Pass and Laoliuwan Fortress maintained close proximity to the Yellow River (≤0.15 km), embodying the traditional principle of “controlling valleys and defending focal points” [51]. The substantially larger maximum distance (30 km compared to 20 km in other dynasties) for both Han and Ming Dynasties suggests significant environmental or policy shifts influencing strategic site selection.
4. Discussion
4.1. The Possible Relationship Between the Temporal and Spatial Changes of the Military Defense System in the Hexi Corridor and Climate Change
The early summer drought index in the Hexi area (Figure 8a), the index of glycerol dialkyl glyceride tetraethers (GDGTs) in the sediments of the Beilian Pool on the west side of the Hexi Corridor (Figure 8a), and the tree-ring width changes in the Qilian Mountains of Qinghai (Figure 8b) were combined with the environmental changes recorded in the sedimentary records of Juyanhai Lake to estimate the climate of the Hexi area [52]. The results displayed that the Qin and Han Dynasties witnessed a cold and dry state with strong fluctuations. The Wei, Tsin, and Southern and Northern Dynasties saw a period of low yet fluctuating temperature [52,53]. The climate during the Sui and Tang Dynasties was warm and dry. Between 800 and 950 AD (late Tang to Five Dynasties and Ten Kingdoms) and 1000–1200 AD (during the Song, Liao, and Jin–Western Xia periods), two long-term dry periods, the temperature shifted from warm to cold. Long-term wet periods occurred between 1200 and 1450 AD and 1510 and 1620 AD. The first one occurred during the Yuan Dynasty. The temperature in this period was generally low [53]; the second humid period occurred in the mid-to-late Ming Dynasty. During this period, the temperature gradually decreased after rising from 1510 to 1580 AD, entering the Little Ice Age until it began to slowly warm during the late Qing Dynasty [54,55].
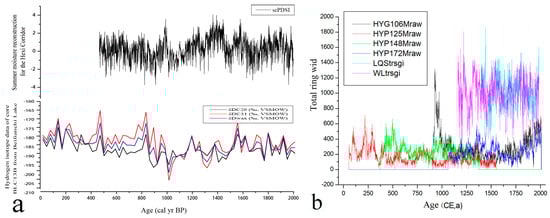
Figure 8.
The climate change process in the Hexi Corridor in the past 2000 years. (a) is the early summer drought index in the Hexi Corridor in the past 1500 years and the index of glycerol dialkyl glyceride tetraethers (GDGTs) in the sediments of the Beilian Pool on the west side of the Hexi Corridor; (b) refers to the change in tree-ring width in Qilian Mountains, Qinghai.
Changes in the environment caused by the fluctuation and disappearance of water sources, land desertification, and increased meteorological disasters typically lead to the declining self-sustainability of human beings guarding the environment. Therefore, space limitations in the suitability of the military defense system construction environment must be considered, strongly limiting its spatial distribution [56,57]. In previous environmental variable analyses, it was observed that military installation sites from the Han and Ming Dynasties exhibited maximum distances of 30 km from river channels, suggesting potential abrupt frontier shifts. This phenomenon was attributed to climatic fluctuations during the Qin–Han periods, particularly the Eastern Han cold period (25–220 AD), which induced the diversion of the Hei River, compelling strategic fortifications to relocate outward. The Ming Dynasty’s 30 km maximum distance occurred during the Wanli reign (1610s), correlating with hydrological disruptions caused by precipitation variability in the Ming–Qing Little Ice Age. Concurrently, the elevated proportion of cold-resistant cultivated landscapes during Han and Ming cold periods provided corroborative evidence for this interpretation.
The Hexi Corridor is deep in the interior and features a temperate steppe desert climate. It is an arid and semi-arid area. The dry and cold reduce the land-bearing capacity, degrade the grassland and arable land, shorten the growing season of plants, and suppress yield. These factors indirectly affect the livestock that rely on pasture for survival. In turn, the resulting limitations make human survival challenging and may eventually lead to social unrest and war [58,59,60]. Thus, the spatial distribution of the northern military defense system in the Hexi region has become agglomerated since the Han Dynasty. The fixedness (immutability and necessity) of such material needs limits habitability for humans to specific geographic locations, with strong geographic spatial correlation [61]. This has led to the spatial distribution of the living environment affecting the distribution of human activities to a certain extent. Based on the statistical results of environmental variables discussed earlier, it was evident that the distribution of military sites exhibited stability in their selection of environmental landscapes, with a primary concentration in plains, desert-cultivated vegetation areas, and regions characterized by grey desert soil. This pattern aligned with historical research indicating that military infrastructure often prioritized geographically strategic locations, such as fertile plains for resource access and arid regions near water sources for defensive advantages. For this purpose, we used the GeoDetector to analyze the intensity and significance of environmental factors that affect the distribution of military sites. The results were shown in Table 2. The factor analysis results showed that altitude, distance from the river, topography, and soil type passed the significance test, and the average explanatory power (q) of the four factors was 0.2123. Among them, altitude had the strongest explanatory power, and, combined with other environmental factors, it had an impact on the spatial distribution of the site.
Table 2.
The explanatory power of environmental variables on the spatial distribution of archaeological sites.
As society and the environment evolve, the behavior and spatial distribution of the offensive and defensive sides have changed. The relative abundance of agricultural groups and the instability of the living environment of nomadic groups intensified the military confrontation between the two sides at the northern border [62]. Therefore, the conflict between agriculture and animal husbandry extended deep into the Central Plains by using the Hexi Corridor as a passage. This prompted successive central dynasties to construct extensive military installations along both flanks of the Hexi Corridor. The Qilian Mountains lie behind the south side. Their terrain is steep and the climate of this region is highly variable. The mountains are blocked by heavy snow in winter. Thus, the routes available for long-term traffic are limited. The Hexi Corridor entry passages available for the Qinghai–Tibet Plateau regime included the upper reaches of the Heihe and the Jiayuguan Kuolai River–Baiyang River valleys and the upper reaches of the Shule River [63,64]. To the north, ingress into the Hexi region was facilitated through the lower Heihe River valley in the Ejinaqi area. Consequently, these strategic corridors emerged as focal points for defensive fortifications, forming the nucleus of regional military planning. At the same time, the intersection of the ancient Silk Road is readily seen to be a core fortification area. Silk Road merchants and travelers required military protection. Simultaneously, with population growth and territorial expansion, the spatial scope of the disputed areas between the two sides increased. Moreover, the geographical and spatial heterogeneity of war sites became prominent [65]. The two sides continued to optimize offensive and defensive areas to maximize strategic intentions and benefits. Therefore, as environmental and dynastic changes occurred, the construction of the military defense system showed diversity and differentiation in space across time. At the same time, the consistency of military defense requirements (defensive) and the inheritance of enemy strategies and technologies among different groups affected offensive and defensive behavior. The spatial characteristics of the distribution of military defense facilities also satisfy the characteristics of transitivity and gradual change. For this reason, the spatial distribution and aggregation characteristics of the military defense system in the Hexi region exhibit robust continuity, eventually tending toward offensive and defensive balance; this means that the attacking and defending sides ultimately move towards a complex game relationship of offensive and defensive balance (Figure 9).
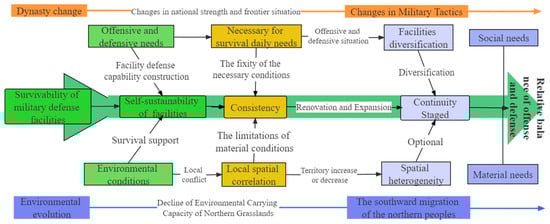
Figure 9.
The structure and time mechanism of the evolution of the military defense system in northern China.
4.2. The Impact of Frontier Wars on the Rise and Fall of the Hexi Corridor Military System
The decrease in land productivity due to temperature decrease during the cold period caused a shortage of resources [60]. Under this ecological pressure and social conditions, a peak period of war and unrest on a national scale followed [66]. The vegetation type statistics of the site distribution also show that the proportion of cold resistant cultivated crops reached its peak during the period of political instability (32.5% in the Five Dynasties and Ten Kingdoms and 30.6% in the Yuan Dynasty), which may reflect the ecological pressure and food security needs caused by war. In many cases, it eventually leads to the demise of a dynasty and the establishment of a new one. Therefore, in Chinese history’s dynastic cycles, with their alternating chaos and order, climate fluctuations were decisive [67,68]. Climate fluctuates violently or turns unfavorable, which becomes a critical node of dynastic change [69]. The apparent impact of this climate change in the northern region was the southward movement of the northern peoples [17,51,70]. These incursions forced the Central Plains Dynasty to build a permanent military defense system in the boundary zone between nomadic and farming civilizations. Therefore, war was the direct cause of building the northern military defense system. The fundamental driving force is its environmental changes was dominated by shifting climate conditions [71,72].
During the Han, Wei, Tsin, and Southern and Northern Dynasties, the cold and dry climate caused the deterioration of the northern grassland’s living environment. Hence, nomadic peoples such as the Xiongnu, Jie, Di, Qiang, and Xianbei moved south, leading to frequent wars [16,51,70,71]. The war with the Huns forced the Han Dynasty to build a military defense system in the Hexi area, extending to the lower reaches of the Heihe River [51,63,72]. Furthermore, military facilities were easy to both defend and attack as they were built in a circumscribed area. Therefore, military defense system construction shows a typical clustering feature. The Han and Ming Dynasties were periods when the construction of the military defense system in the Hexi Corridor area was at its greatest intensity, especially during the Ming Dynasty. The Ming Great Wall is a relevant example. Its most intensive construction period lasted 239 years, from the 14th year of Hongwu (1381) to the 48th year of Wanli (1620). This period exactly matched the transition process from humid to arid and then returned to humid in the early Ming Dynasty. However, the Han Dynasty was in a period of climatic fluctuations. These dramatic changes provided an environmental impetus for northern border troubles (Table 3) [71,73]. The expansion of the scale of military defense during the Wei, Jin, and Southern and Northern Dynasties also supports this conclusion.
Table 3.
The frequency of wars between farming and nomadic peoples in the Han and Qing Dynasties in China.
As the study prioritized discussing the spatiotemporal transformation of military sites at a macro scale, insufficient attention was allocated to meso- and micro-scale analyses. The influence of the natural environment was identified as a determining factor in the specific spatial positioning of military defensive installations. This spatial selection was demonstrated to be shaped by localized environmental conditions operating within constrained spatial parameters. Under analogous environmental constraints, such site configurations exhibited spatiotemporal extensibility and broad applicability, with their propagated impacts extending across broader regional systems and influencing macro-level spatiotemporal processes. These interlinked phenomena were acknowledged to necessitate further scholarly investigation.
Climate change, as a pivotal factor in internal strife and external conflict in ancient China, was intricately linked to the temporal and spatial dynamics of historical periods. In the transitional zone between agriculture and pastoralism (such as the Hexi Corridor), the 400 mm precipitation line served as the demarcation between agrarian and nomadic civilizations, with its north–south shifts directly shaping military defense configurations. For instance, the rise of the prosperous Han and Tang Dynasties was closely tied to climatic warming. During these warm periods, agricultural surpluses accumulated to critical levels, enabling Central Plains regimes to bolster border defenses. Conversely, during cold spells such as the Wei, Jin, and Southern and Northern Dynasties and the Song and Yuan periods, intensified resource competition led to increased warfare frequency and military technological advancements.
The application of econometric methods to study the temporal relationship between climate and conflict reveals dynamic evolutionary patterns. The protracted low temperatures and droughts during the Little Ice Age (1620–1680) in the late Ming Dynasty not only disrupted the provisioning of the northern military defense system but also accelerated societal collapse through the “famine-plague-war” mortality triangle [67]. The spatiotemporal evolution of the defense system in the Hexi Corridor region serves as a microcosm of this broader historical law.
5. Conclusions
This study investigated the ancient military defense system sites in the Hexi Corridor area of China from the Qin to the Qing Dynasty. Statistical and GIS spatial analysis were used to illustrate the temporal changes and spatial distribution characteristics of the construction intensity of military defense facilities through different periods through the examination of historical data. We discussed the possible relationship between the construction of the Hexi military defense system and climate change by surveying environmental conditions in the Hexi Corridor over the past 2000 years. The results demonstrate that the Han and Ming Dynasties were the main periods for the construction of the military defense system in this area. Moreover, Jiuquan has always been a key area for the construction of the military defense system. The Wei, Tsin, and Southern and Northern Dynasties expanded the scale of fortifications based on earlier construction. The military defense system began under the Han and agglomerated in a limited space and continued up to the Qing Dynasty. During this period, the climate and environment change process in this region was significant. Environmental factors have an impact on the spatial distribution of military sites. The period of significant climate change coincides with the peak period of military facilities construction and frequent wars. We believe that the occurrence of the northern border war is the direct cause of the construction of the military defense system. The shift in the environment caused by alterations in climate is the fundamental driving force for this process, showing various changes across historical periods.
Supplementary Materials
The following supporting information can be downloaded at: https://www.mdpi.com/article/10.3390/atmos16030335/s1.
Author Contributions
X.W.: conceptualization; methodology; writing—original draft; review; investigation. B.T.: methodology; investigation; writing and editing; visualization. All authors have read and agreed to the published version of the manuscript.
Funding
This study was supported by the Gansu Provincial Social Science Plan Project (2022YB104), the National Social Science Fund Project (23XMZ046), and the Gansu Provincial Higher Education Innovation Fund (2022 B-153).
Institutional Review Board Statement
Not applicable.
Informed Consent Statement
Not applicable.
Data Availability Statement
All data generated or analyzed during this study are included in this published article (and its supplementary information files).
Conflicts of Interest
The authors declare no conflict of interest.
References
- He, D.; Wang, Z.; Zhang, J.; Zhang, J.; Yang, Z.; Sun, Z. A Study on the Spatial Distribution Characteristics and Influencing Factors of Beijing Ming Great Wall Heritage. Arid Area Resour. Environ. 2022, 36, 8. [Google Scholar]
- Cao, Y.; Zhang, Y. Spatial distribution of military defense settlements on the Great Wall of the Ming Dynasty based on Voronoi diagram. J. Hebei Univ. Nat. Sci. Ed. 2014, 34, 8. [Google Scholar]
- Cao, Y.; Zhang, Y.; Li, Y. Research on the Spatial Layout of the Beacon Transmission System in Datong Town, the Military Defense Settlement System of the Ming Great Wall. New Archit. 2017, 2, 4. [Google Scholar]
- Fan, X. Research on the Planning and Layout Mechanism of the Ming Great Wall Military Defense System. Doctoral Dissertation, Tianjin University, Tianjin, China, 2015. [Google Scholar]
- Zhou, X. Military Defense Features and Image Protection of Pianguan Great Wall. Shanxi Arch. 2016, 2, 2. [Google Scholar]
- Qi, Y. The wisdom contained in the construction of ancient military defense spaces: Taking the military defense fortress settlements of the Great Wall as an example. Archit. Eng. Technol. Des. 2019, 4, 3394. (In Chinese) [Google Scholar]
- Wang, L. Spatial analysis of the great wall ji town military settlements in the ming dynasty: Research and conservation. Ann. GIS 2018, 24, 71–81. [Google Scholar] [CrossRef]
- Wu, J. Research on the human settlement environment of military defensive castles along the Ming Great Wall in Yulin area. Doctoral Dissertation, Xi’an University of Architecture and Technology, Xi’an, China, 2013. [Google Scholar]
- Wang, X. A Textual Research on the Date of Construction of the Zhaonan Great Wall in the Warring States Period. Chin. Hist. Geogr. Theory Ser. 2022, 4, 148–153+147. [Google Scholar] [CrossRef]
- Yang, S.; Qs, A.; Tja, B.; Xz, C. Characteristics of the site selection and the layout of the great wall of the ming dynasty from a military perspective: Xiaohekou section as an example. Front. Archit. Res. Engl. Ed. 2020, 9, 15. [Google Scholar]
- Cao, Y.; Zhang, Y. The fractal structure of the Ming Great Wall Military Defense System: A revised horizon over the relationship between the Great Wall and the military defense settlements. J. Cult. Herit. 2018, 33, 159–169. [Google Scholar] [CrossRef]
- Du, Y.; Chen, W.; Cui, K.; Guo, Z.; Wu, G.; Ren, X. An exploration of the military defense system of the Ming Great Wall in Qinghai Province from the perspective of castle-based military settlements. Archaeol. Anthropol. Sci. 2021, 13, 46. [Google Scholar] [CrossRef]
- Luo, L.; Bachagha, N.; Yao, Y.; Liu, C.; Shi, P.; Zhu, L.; Shao, J.; Wang, X. Identifying Linear Traces of the Han Dynasty Great Wall in Dunhuang Using Gaofen-1 Satellite Remote Sensing Imagery and the Hough Transform. Remote Sens. 2019, 11, 2711. [Google Scholar] [CrossRef]
- Xie, D.; Pang, Y. Illustration on the defense system of the Great Wall in Jin dynasty. In Proceedings of the 2011 International Conference on Electrical and Control Engineering, Yichang, China, 16–18 September 2011; pp. 5966–5968. [Google Scholar]
- Wang, Y. Resarch of Hebei Military Defense Region Before the Chuanyuanzhimeng in the Northern Song Dynasty. J. Hebei Univ. 2012, 31, 25–29. [Google Scholar]
- Qiu, J. The Historical Evolution of the Defense System of the Great Wall in Ancient China. Mil. Hist. 2019, 5, 84–90. [Google Scholar]
- Ma, W. On the Mongolian Issue in the Early Hongwu Period and the Construction of the Military Defense System in the Ming Dynasty. Orient. Collect. 2018, 1, 2. [Google Scholar]
- Bao, H. The relevant background and evolution track of the administrative system in the Ordos Plateau in the Sui Dynasty. J. Ningxia Norm. Univ. 2017, 1, 46–52. [Google Scholar]
- Zhao, X. Looking at the Great Wall from a foreign land—The concept of the Great Wall exercised by the Korean Yan during the Ming and Qing Dynasties. Hist. Mon. 2017, 6, 47–56. [Google Scholar]
- Shen, C. From the construction of the Great Wall in the Warring States Period and the formation of the common region of the Huaxia people. J. Hebei Norm. Univ. (Philos. Soc. Sci. Ed.) 2022, 5, 50–55. [Google Scholar]
- Chen, J.; Jin, S.; Liao, A.; Zhao, Y.; Zhang, H.; Rong, D.; Yang, Z. National Geomatics Center of China, et al Stereo mapping of ming great wall with remote sensing. Chin. Sci. Bull. 2010, 55, 2290–2294. [Google Scholar] [CrossRef]
- Xiao, L. Research on the Nine Frontier Military System in the Middle and Late Ming Dynasty; Jilin People’s Publishing House: Jilin, China, 2001. [Google Scholar]
- Shi, N. On the distribution of the Great Walls in Northwest China and their historical military geography (Part 2). Chin. Hist. Geogr. Theory Collect. 1994, 25, 311–312. [Google Scholar]
- Mischke, S.; Zhang, C.; Liu, C.; Zhang, J.; Lai, Z.; Long, H. Landscape Response to Climate and Human Impact in Western China During the Han Dynasty. In Socio-Environmental Dynamics along the Historical Silk Road; Springer: Cham, Switzerland, 2019. [Google Scholar]
- He, J.; Su, Y.; Fang, X. To what extent did changes in temperature affect China’s socioeconomic development from the Western Han Dynasty to the Five Dynasties period? J. Quat. Sci. 2020, 35, 433–443. [Google Scholar] [CrossRef]
- Su, Y.; Liu, L.; Fang, X.; Ma, Y.N. The relationship between climate change and wars waged between nomadic and farming groups from the Western Han Dynasty to the Tang Dynasty period. Clim. Past 2015, 12, 137–150. [Google Scholar] [CrossRef]
- Chen, S.; Liu, Q.; Jia, Y.; Chen, X.; Wang, C.; Wan, Z.; Wang, Y. The temporal and spatial evolution and mechanism of early social history in northern China driven by climate and environment. Acta Geogr. Sin. 2017, 9, 1580–1593. [Google Scholar]
- Wei, Z.; Fang, X.; Su, Y. Climate change, fiscal cycle and dynasty change in China in the past 2000 years. Quat. Stud. 2020, 40, 1180–1192. [Google Scholar]
- Chinese Archaeological Society. Yearbook of Chinese Archeology (2008–2020); Cultural Relics Publishing House: Beijing, China, 2021. [Google Scholar]
- Wu, X. Investigation and Research on Hexi Hansai; Cultural Relics Publishing House: Beijing, China, 2005. [Google Scholar]
- Gansu Provincial Institute of Cultural Relics and Archaeology. Gansu Provincial Institute of Cultural Relics and Archeology Important Archaeological Discoveries in Gansu 2000–2019; Cultural Relics Publishing House: Beijing, China, 2020. [Google Scholar]
- Masana, M. Research on the Historical Geography of the Hexi Corridor; China Tibetology Press: Beijing, China, 1993. [Google Scholar]
- Bao, J.; Xiao, F.; Fu, X.; Li, L. Witness of Grassland Civilization Ejina Banner; Sunshine Publishing House: Beijing, China, 2012. [Google Scholar]
- Zhou, J. Historical and Geographical Research on Silk Road Traffic Lines (Chinese Section); Jiangsu People’s Publishing House: Nanjing, China, 2012.
- Zu, R.Z. NOAA/WDS Paleoclimatology—Zu—Qilan Mountains—JUSP—ITRDB CHIN003; NOAA National Centers for Environmental Information: Asheville, NC, USA, 2015. [Google Scholar] [CrossRef]
- Yang, B.; Qin, C.; Wang, J.L.; He, M.H.; Melvin, T.M.; Osborn, T.J.; Briffa, K.R. (2014a-02-10): NOAA/WDS Paleoclimatology—Yang—Haiyagou—JUPR—ITRDB CHIN070; NOAA National Centers for Environmental Information: Asheville, NC, USA, 2014. [CrossRef]
- Yang, B.; Qin, C.; Wang, J.L.; He, M.H.; Melvin, T.M.; Osborn, T.J.; Briffa, K.R. (2014b-02-10): NOAA/WDS Paleoclimatology—Yang—Zhamashi—JUPR—ITRDB CHIN071]; NOAA National Centers for Environmental Information: Asheville, NC, USA, 2014. [CrossRef]
- Zhang, C. Quantitative Temperature and Monsoon Precipitation Data Sets for the Past 5000 Years in Northern China; National Tibetan Plateau/Third Pole Environment Data Center: Beijing, China, 2021. [Google Scholar] [CrossRef]
- Yang, B.; Wang, J.L.; Liu, J. (2020-05-12): NOAA/WDS Paleoclimatology—Hexi Corridor, Northwestern China 1556 Year scPDSI Reconstruction; NOAA National Centers for Environmental Information: Asheville, NC, USA, 2020. [Google Scholar]
- Hou, X.; Sun, S.; Zhang, J.; He, M.; Wang, Y.; Kong, D.; Wang, S. The vegetation map at the 1:4,000,000 of China (1979). National Tibetan Plateau/Third Pole Environment Data Center: Beijing, China, 2012. [Google Scholar] [CrossRef]
- Food and Agriculture Organization of the United Nations (FAO). International Institute for Applied Systems Analysis. China soil Map Based Harmo-Nized World Soil Database (HWSD) (v1.1). National Tibetan Plateau Data Center. Available online: https://data.tpdc.ac.cn/en/data/611f7d50-b419-4d14-b4dd-4a944b141175 (accessed on 1 December 2024).
- Zhou, C.; Cheng, W. National Tibetan Plateau Data Center. 1: 1,000,000 Geomorphological Map of Western China. Available online: https://data.tpdc.ac.cn/en/data/bb79d39c-6da0-4c0f-b089-61eb671803c9/ (accessed on 1 December 2024).
- Elith, J.; Phillips, S.J.; Hastie, T.; Dudík, M.; Chee, Y.E.; Yates, C.J. A statistical explanation of MaxEnt for ecologists. Divers. Distrib. 2015, 17, 43–57. [Google Scholar] [CrossRef]
- Cai, W.; Xiao, T.; Bi, F.; Shi, Y. Analysis of Spatial Distribution Characteristics of Cultivated Land Quantity in Metropolises Based on Kernel Density Estimation—Taking Tianjin as an Example. Chin. Agric. Resour. Reg. Plan. 2019, 40, 9. [Google Scholar]
- Wang, J.F.; Li, X.H.; Christakos, G.; Liao, Y.L.; Zhang, T.; Gu, X.; Zheng, X.Y. Geographical detectors-based health risk assessment and its application in the neural tube defects study of the Heshun Region, China. Int. J. Geogr. Inf. Sci. 2010, 24, 107–127. [Google Scholar] [CrossRef]
- Wang, J.F.; Hu, Y. Environmental health risk detection with GeogDetector. Environ. Model. Softw. 2012, 33, 114–115. [Google Scholar] [CrossRef]
- Gu, B. Book of Han; Shanghai Ancient Books Publishing House: Shanghai, China, 2003. [Google Scholar]
- Zhang, T. Ming History: Military Chronicles; Zhonghua Book Company: Beijing, China, 1974. [Google Scholar]
- Wang, T.; Li, Z. Analysis of the Military River Defense Spatial Pattern of the Ming Great Wall: Taking the Shanxi Section of the Yellow River as an Example. Landsc. Archit. 2024, 32, 124. (In Chinese) [Google Scholar] [CrossRef]
- Fang, Y. A Preliminary Study on the Military Defense System of Luoyang in the Eastern Han Dynasty. Res. Qin Han Dynast. 2020, 1, 7. (In Chinese) [Google Scholar]
- Academy of Military. Sciences General Military History of China; Military Science Press: Beijing, China, 1998. (In Chinese) [Google Scholar]
- Qu, W.; Wu, R.; Wang, S.; Zhang, Z. Pigment content and environmental significance of lake sediments in Juyanhai, Inner Mongolia in the past 2600 years. Acta Sedimentum Sin. 2000, 18, 5. [Google Scholar]
- Yang, B.; Wang, J.; Liu, J. A 1556 year-long early summer moisture reconstruction for the Hexi corridor, northwestern China. Chin. Sci. 2019, 62, 953–963. [Google Scholar] [CrossRef]
- Yang, B.; Kang, X.; Shi, Y. The 10-year-scale climate change of Dulan tree rings in the last 2000 years and its comparison with temperature proxy data in other regions of China. Geogr. Sci. 2000, 20, 6. [Google Scholar]
- Liu, X.; Qin, D.; Shao, X.; Chen, T.; Ren, J. Tree ring records of temperature changes in the central Qilian Mountains in the past millennium. Chin. Sci. Ser. D 2004, 34, 89–95. [Google Scholar]
- Chen, S.; Su, Y.; Chen, X.; Yang, L.E. The spatio-temporal evolution of the Chongzhen drought (1627–1644) in China and its impact on famine. Clim. Past 2024, 20, 2287–2307. [Google Scholar] [CrossRef]
- Webster, J.W.; Brook, G.A.; Railsback, L.B.; Cheng, H.; Edwards, R.L.; Alexander, C.; Reeder, P. Stalagmite evidence from belize indicating significant droughts at the time of preclassic abandonment, the maya hiatus, and the classic maya collapse. Palaeogeogr. Palaeoclimatol. Palaeoecol. 2007, 250, 1–17. [Google Scholar] [CrossRef]
- Tsonis, A.A.; Swanson, K.L.; Sugihara, G.; Tsonis, P.A. Climate change and the demise of Minoan civilization. Clim. Past 2010, 6, 525–530. [Google Scholar] [CrossRef]
- Haug, G.H.; Gnther, D.; Peterson, L.C.; Sigman, D.M.; Hughen, K.A.; Aeschlimann, B. Climate and the Collapse of Maya Civilization. Science 2003, 299, 1731–1735. [Google Scholar] [CrossRef]
- Ge, Q.; Fang, X.; Zheng, J. Learning from the historical impacts of climatic change in China. Adv. Earth Sci. 2014, 29, 23–29. [Google Scholar]
- Tobler, W. A Computer Movie Simulating Urban Growth in the Detroit Region. Econ. Geogr. 1970, 46, 234–240. [Google Scholar] [CrossRef]
- Su, Y.; Zhai, X. The Relationship between Climate Change and the Interaction between Sedentary and Nomadic Groups in Northern China over the Past 2000 Years. In The Social Impacts of Climate Change in China over the Past 2000 Years; Springer: Singapore, 2024. [Google Scholar]
- Bai, S. History of Transportation in China; Commercial Press: Beijing, China, 1993. (In Chinese) [Google Scholar]
- He, R. Huarong Intersection: Dunhuang Ethnicity and Transportation Between China and the West; Gansu Education Publishing House: Gansu, China, 2008. (In Chinese) [Google Scholar]
- Anselin, L. What is special about spatial data? Alternative perspectives on spatial data analysis. Technical Report of National Center for Geographic Infor mation and Analysis No. 89–4. 1989. Available online: https://escholarship.org/uc/item/3ph5k0d4 (accessed on 1 December 2024).
- Turchin, P. Historical Dynamics: Why States Rise and Fall: Why States Rise and Fall; Princeton University Press: Princeton, NJ, USA, 2003. [Google Scholar] [CrossRef]
- Zhang, D.; Zhan, Z.; Lin, C.; He, Y.; Li, F. Climate change and China’s war, social unrest and dynastic change. Chin. Sci. Bull. 2004, 49, 2468–2474. [Google Scholar]
- Li, J.; Dodson, J.; Yan, H.; Zhang, D.D.; Zhang, X.; Xu, Q.; Lee, H.F.; Pei, Q.; Cheng, B.; Li, C.; et al. Quantifying climatic variability in monsoonal northern china over the last 2200 years and its role in driving chinese dynastic changes. Quat. Sci. Rev. Int. Multidiscip. Rev. J. 2017, 159, 35–46. [Google Scholar] [CrossRef]
- Wang, H. Southward Migration of Nomadic People in Northern China and Climate Change in the Past 2000 Years; Geographical Science: Changchun, China, 1996. [Google Scholar]
- Zhang, Z. Population transfer in the ethnic structure of the ancient Hexi Corridor. Guizhou Ethn. Stud. 2018, 39, 4. (In Chinese) [Google Scholar]
- Zhang, J.; Zhou, X.; Jiang, S.; Tu, L.; Liu, X. Monsoon Precipitation, Economy and Wars in Ancient China. Front. Earth Sci. 2020, 8, 317. [Google Scholar] [CrossRef]
- Hsiang, S.M.; Burke, M.; Miguel, E. Quantifying the Influence of Climate on Human Conflict. Science 2013, 341, 1235367. [Google Scholar] [CrossRef]
- Liu, L.; Su, Y.; Fang, X. Wars among the northern farmers and herdsmen from the Western Han Dynasty to the Qing Dynasty in China and their relationship with temperature changes. J. Beijing Norm. Univ. Nat. Sci. Ed. 2016, 52, 8. (In Chinese) [Google Scholar]
Disclaimer/Publisher’s Note: The statements, opinions and data contained in all publications are solely those of the individual author(s) and contributor(s) and not of MDPI and/or the editor(s). MDPI and/or the editor(s) disclaim responsibility for any injury to people or property resulting from any ideas, methods, instructions or products referred to in the content. |
© 2025 by the authors. Licensee MDPI, Basel, Switzerland. This article is an open access article distributed under the terms and conditions of the Creative Commons Attribution (CC BY) license (https://creativecommons.org/licenses/by/4.0/).