
Elevation Correction of ERA5 Reanalysis Temperature over the Qilian Mountains of China
Abstract
1. Introduction
2. Data and Methods
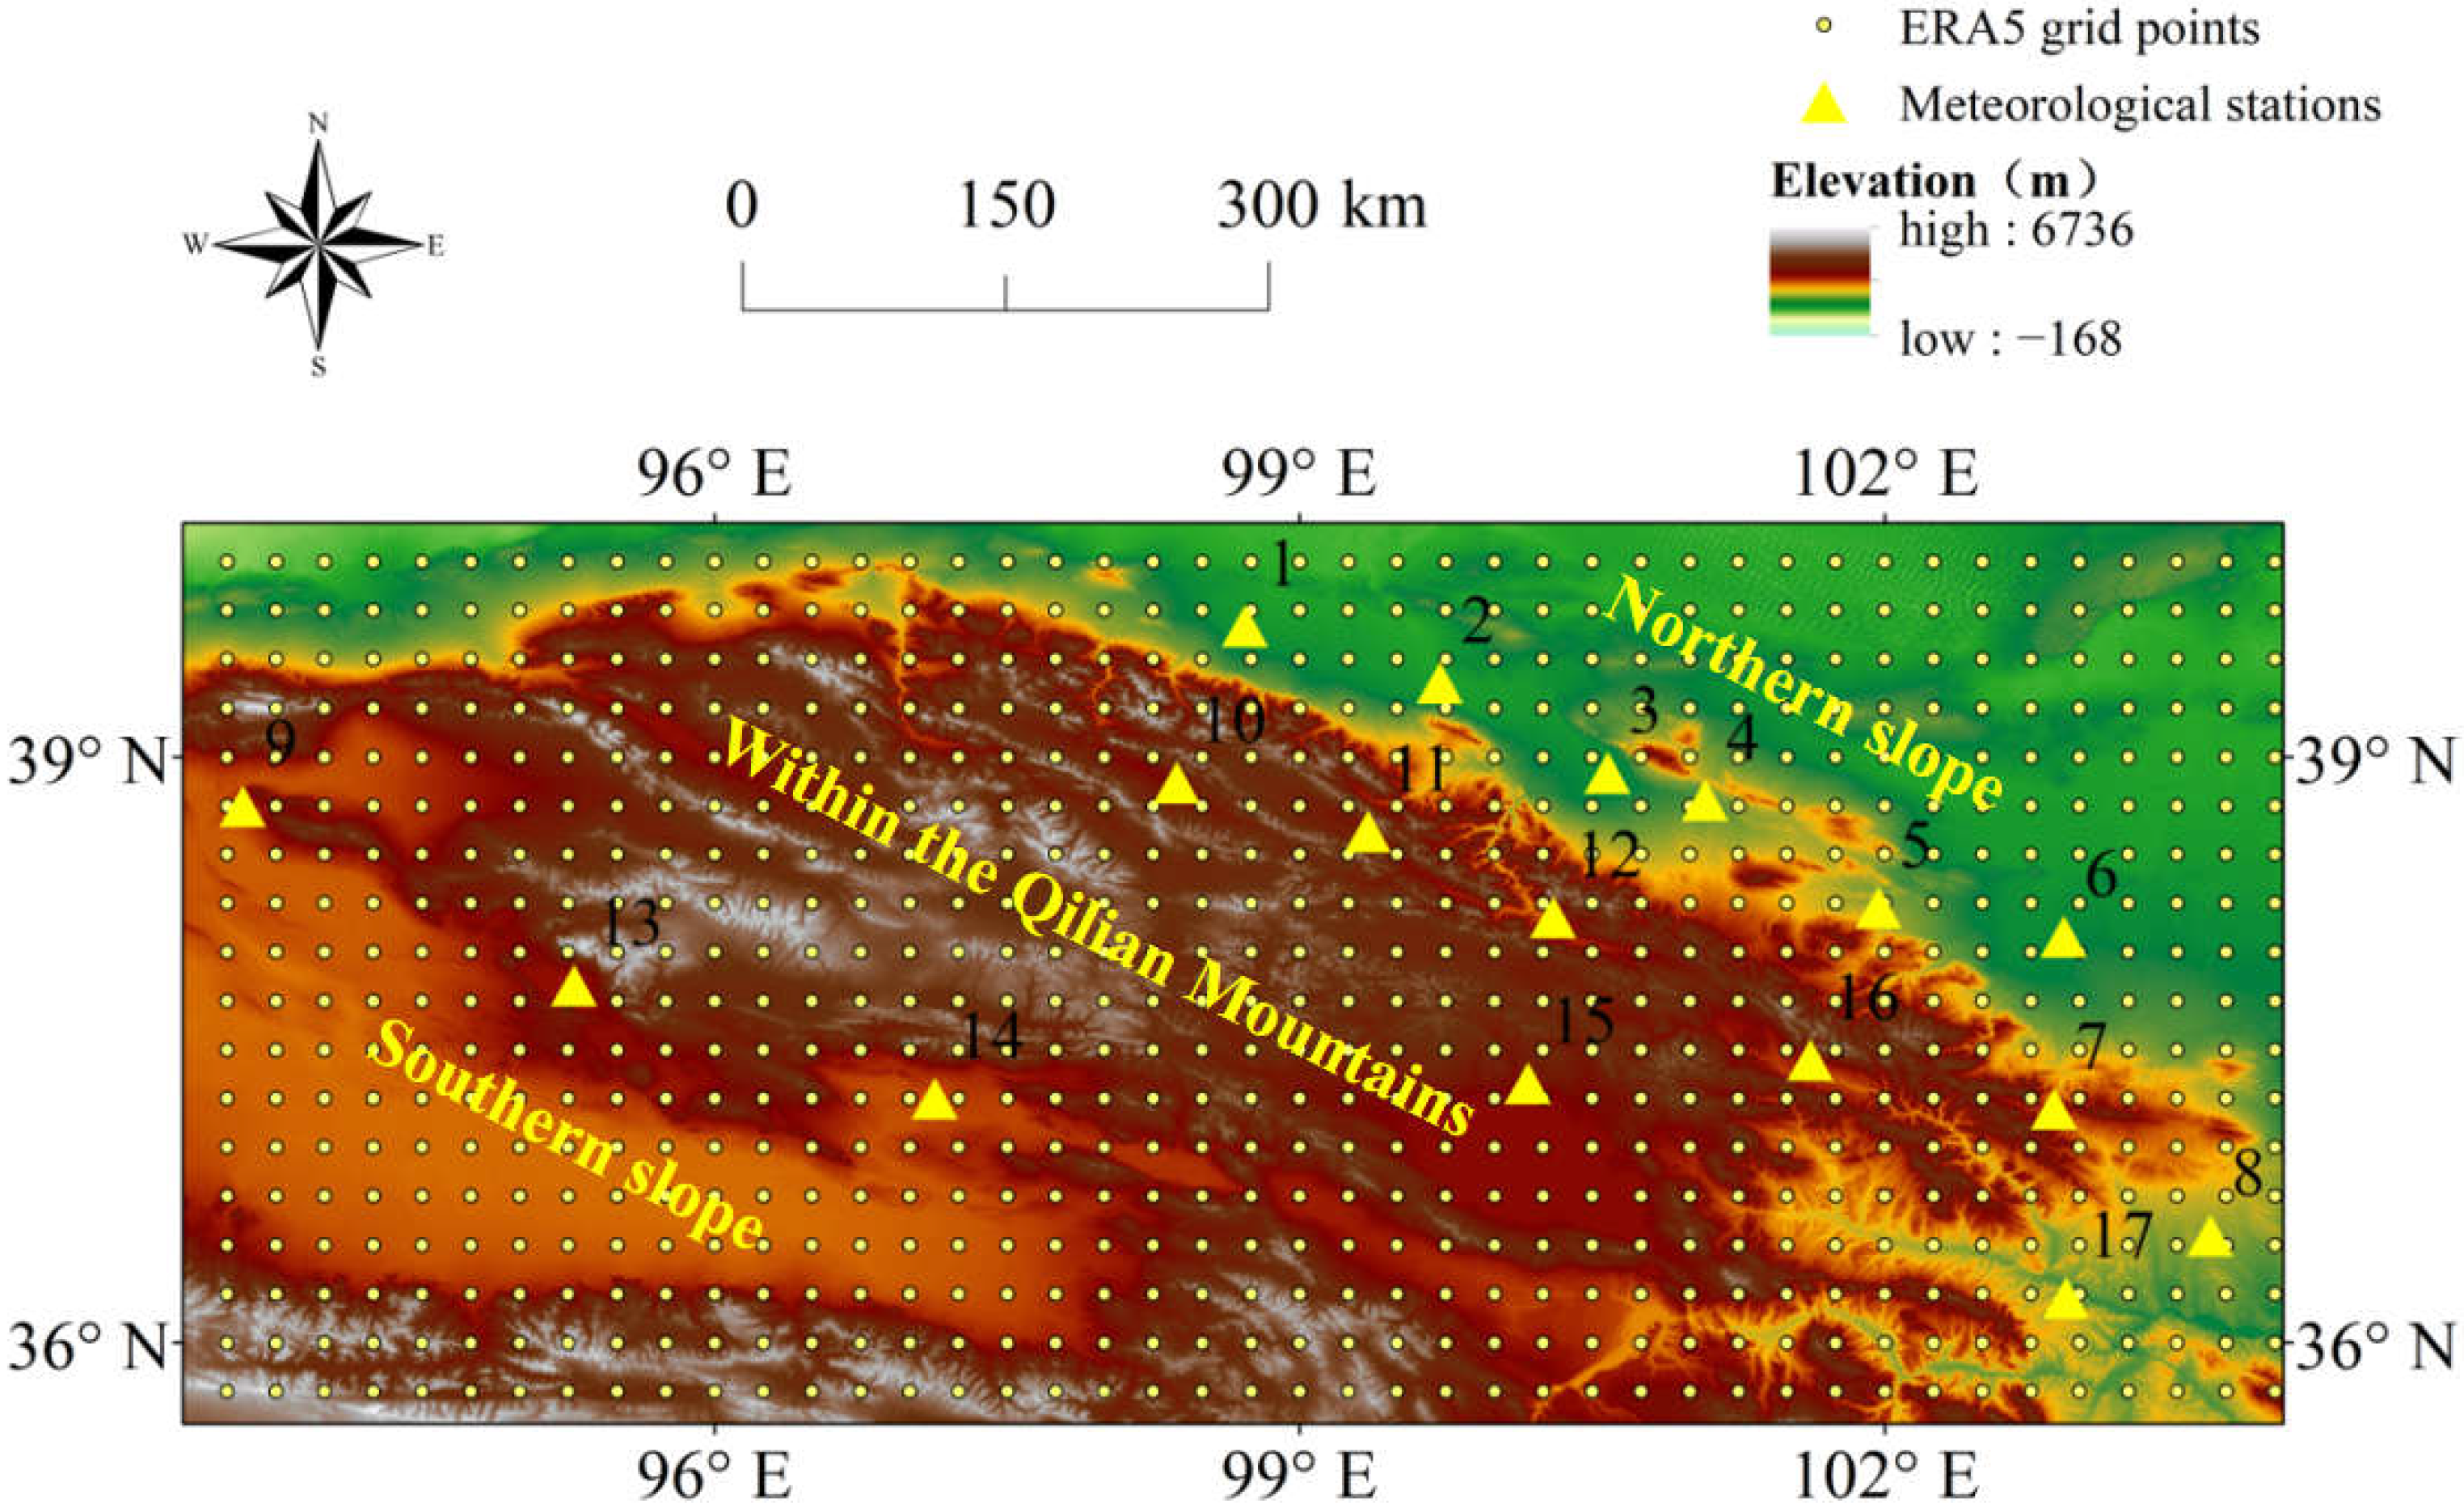
2.1. Study Area
2.2. ERA5 Reanalysis Data
2.3. Observed Data
2.4. Correction Method
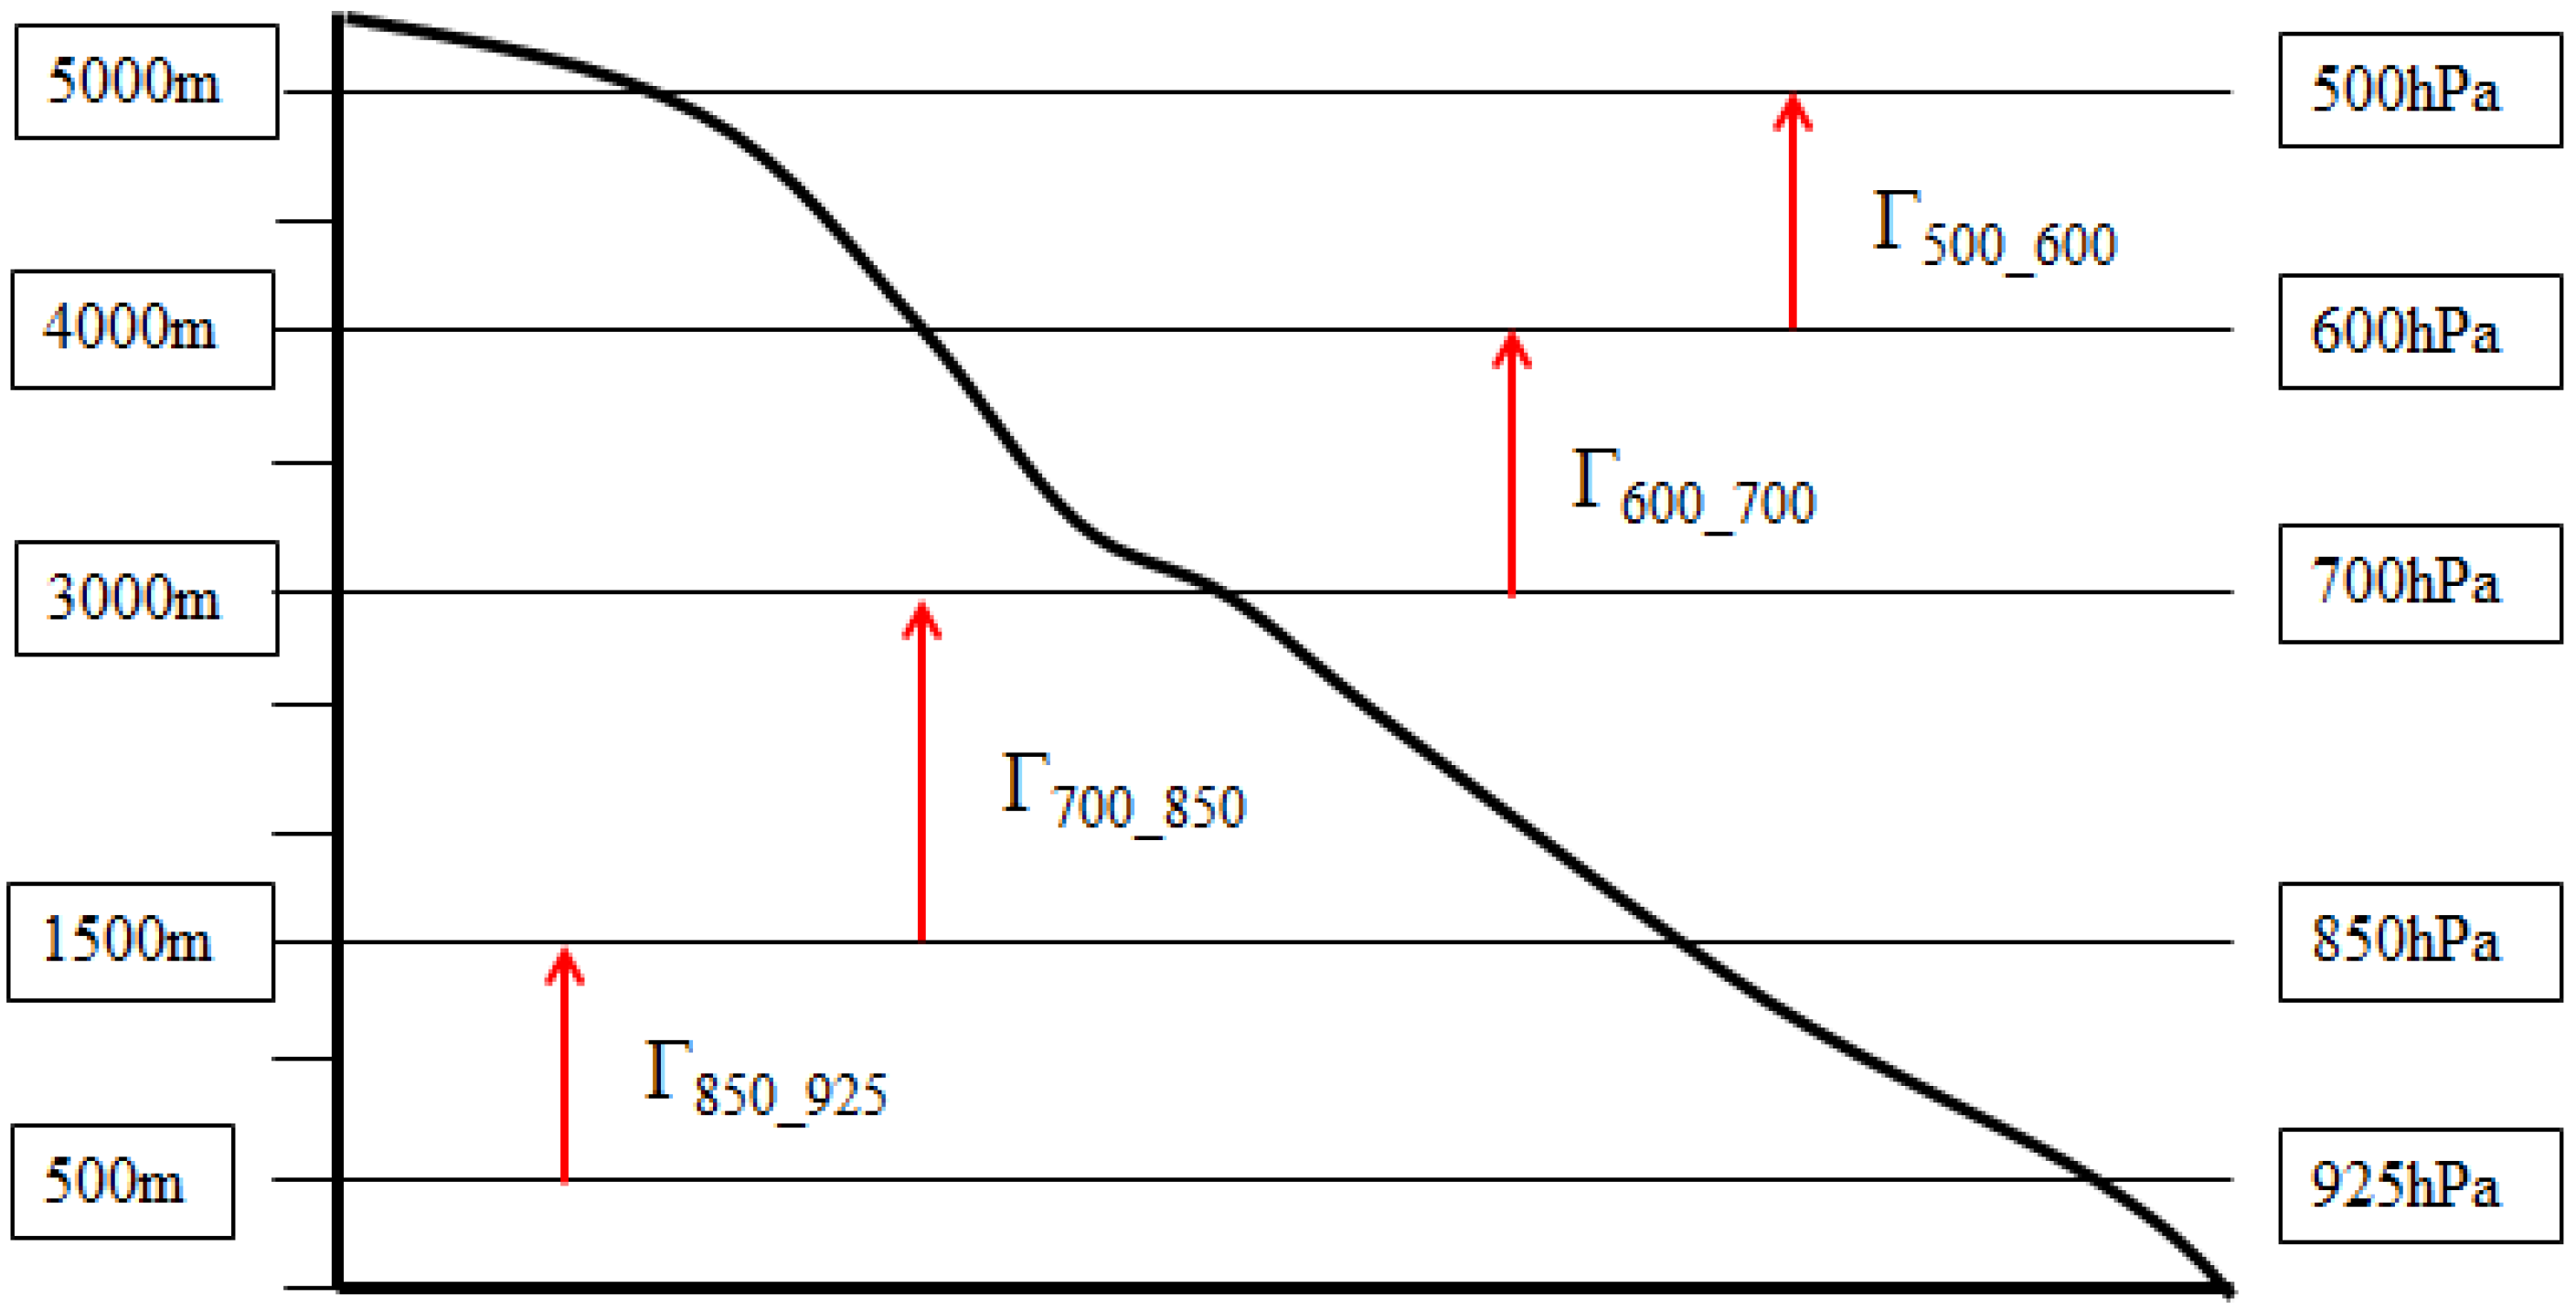
2.4.1. Construction of Temperature Lapse Rate
2.4.2. ERA5 Reanalysis Correction of Temperature Data
2.4.3. Verification of ERA5 Reanalysis Temperature Correction Results
3. Results
3.1. Time Variation Characteristics of Temperature Lapse Rates
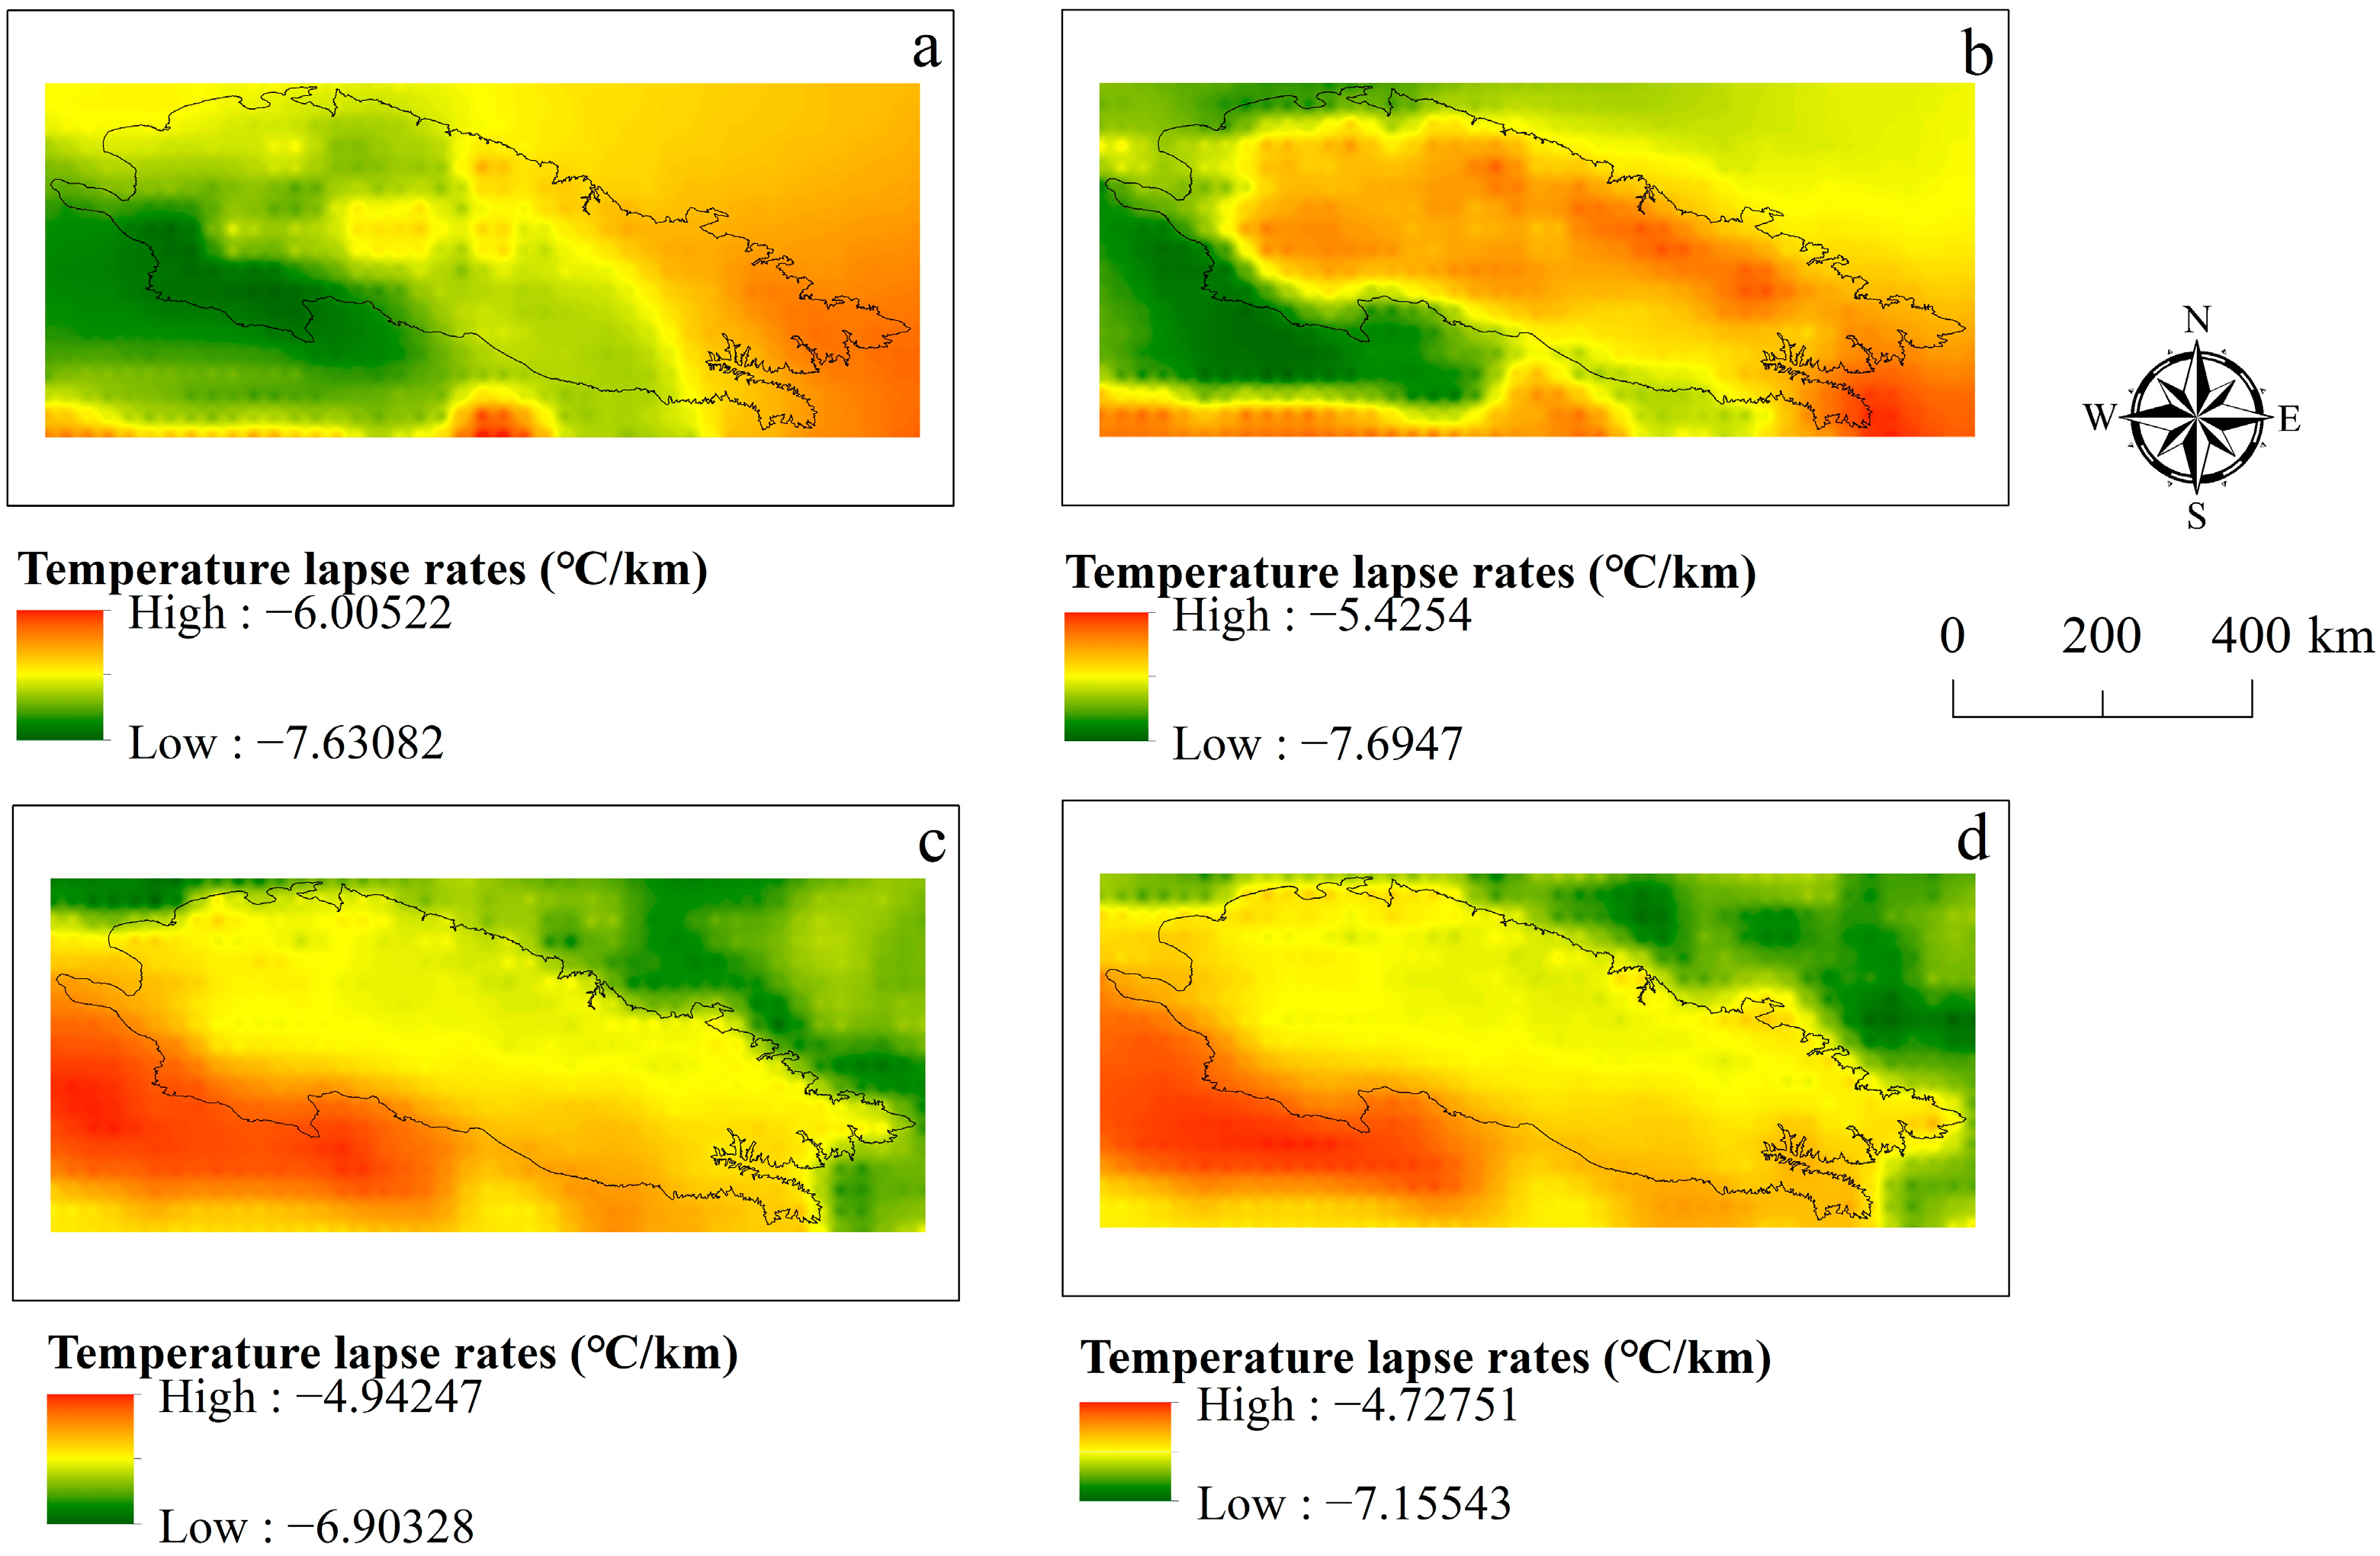
3.2. Spatial Variation Characteristics of Temperature Lapse Rates
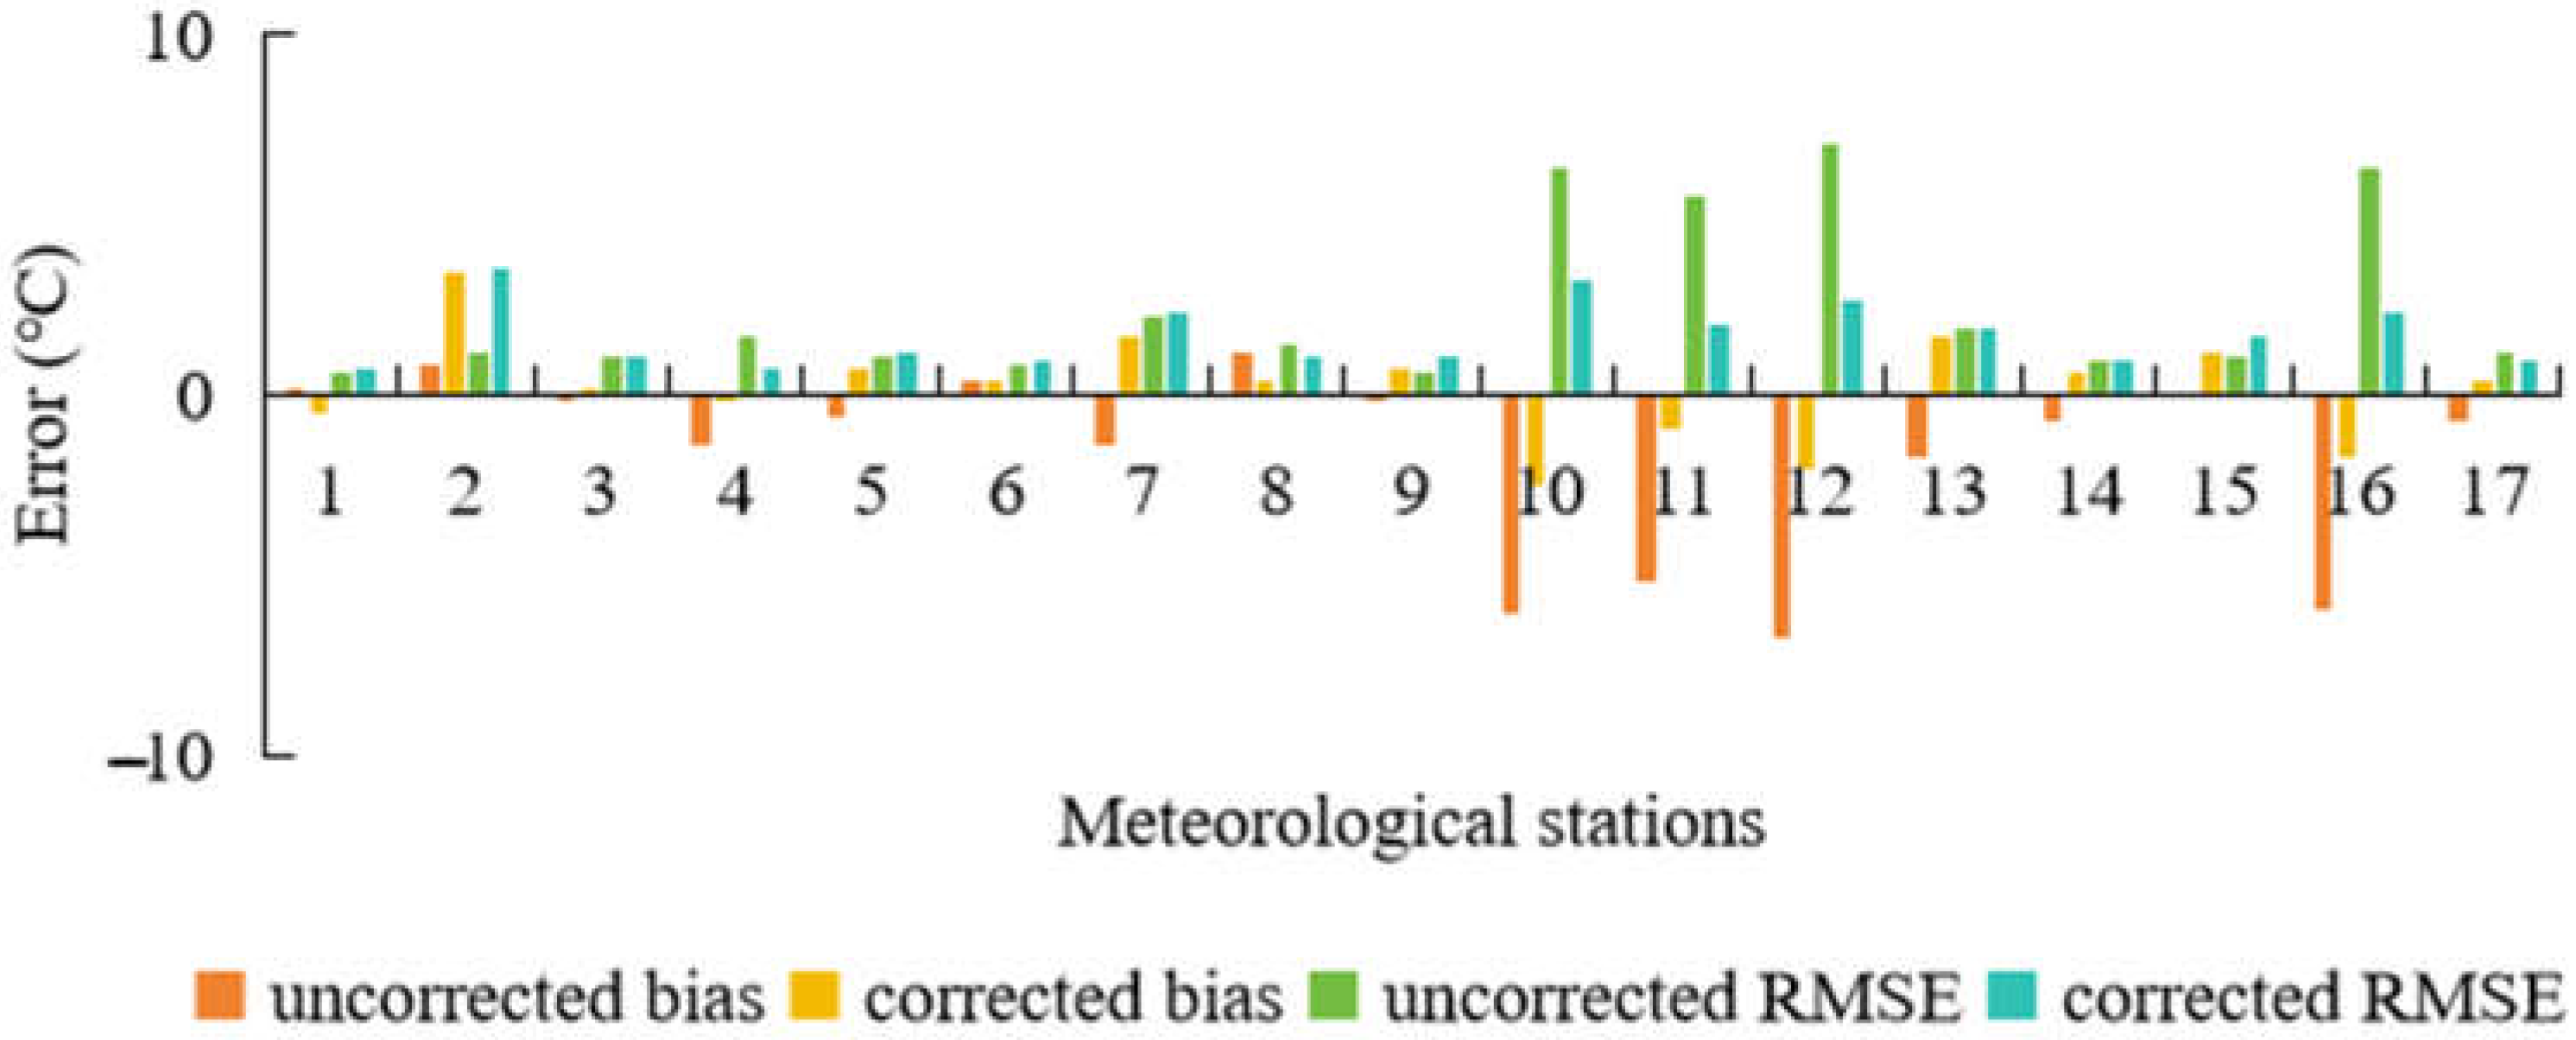
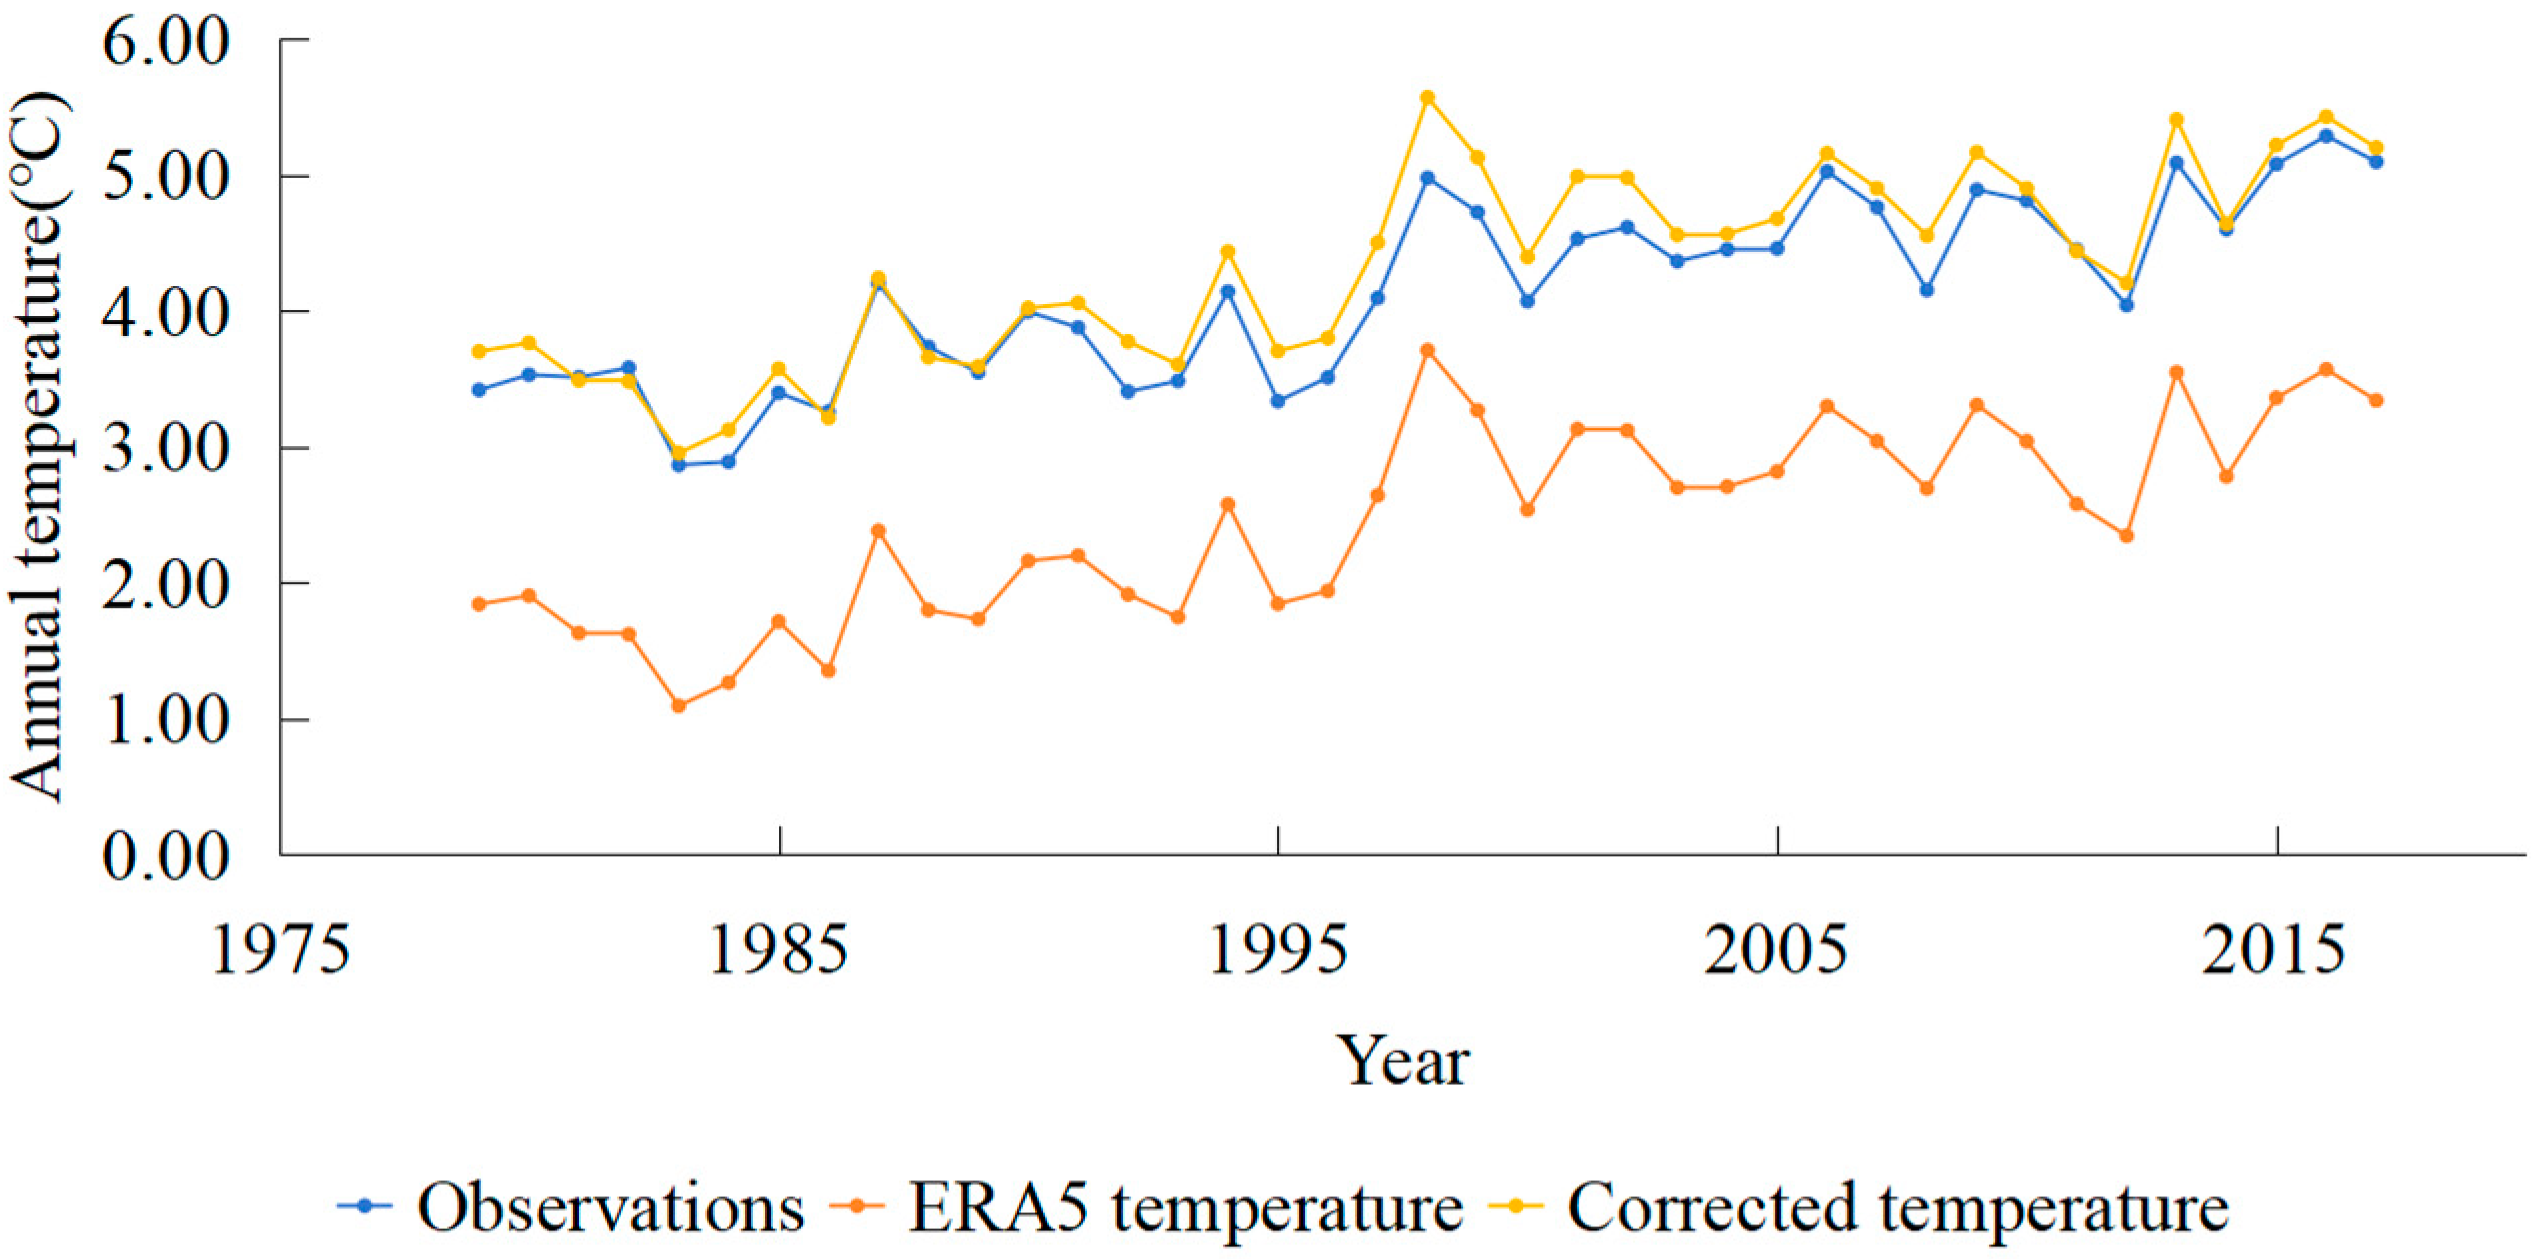
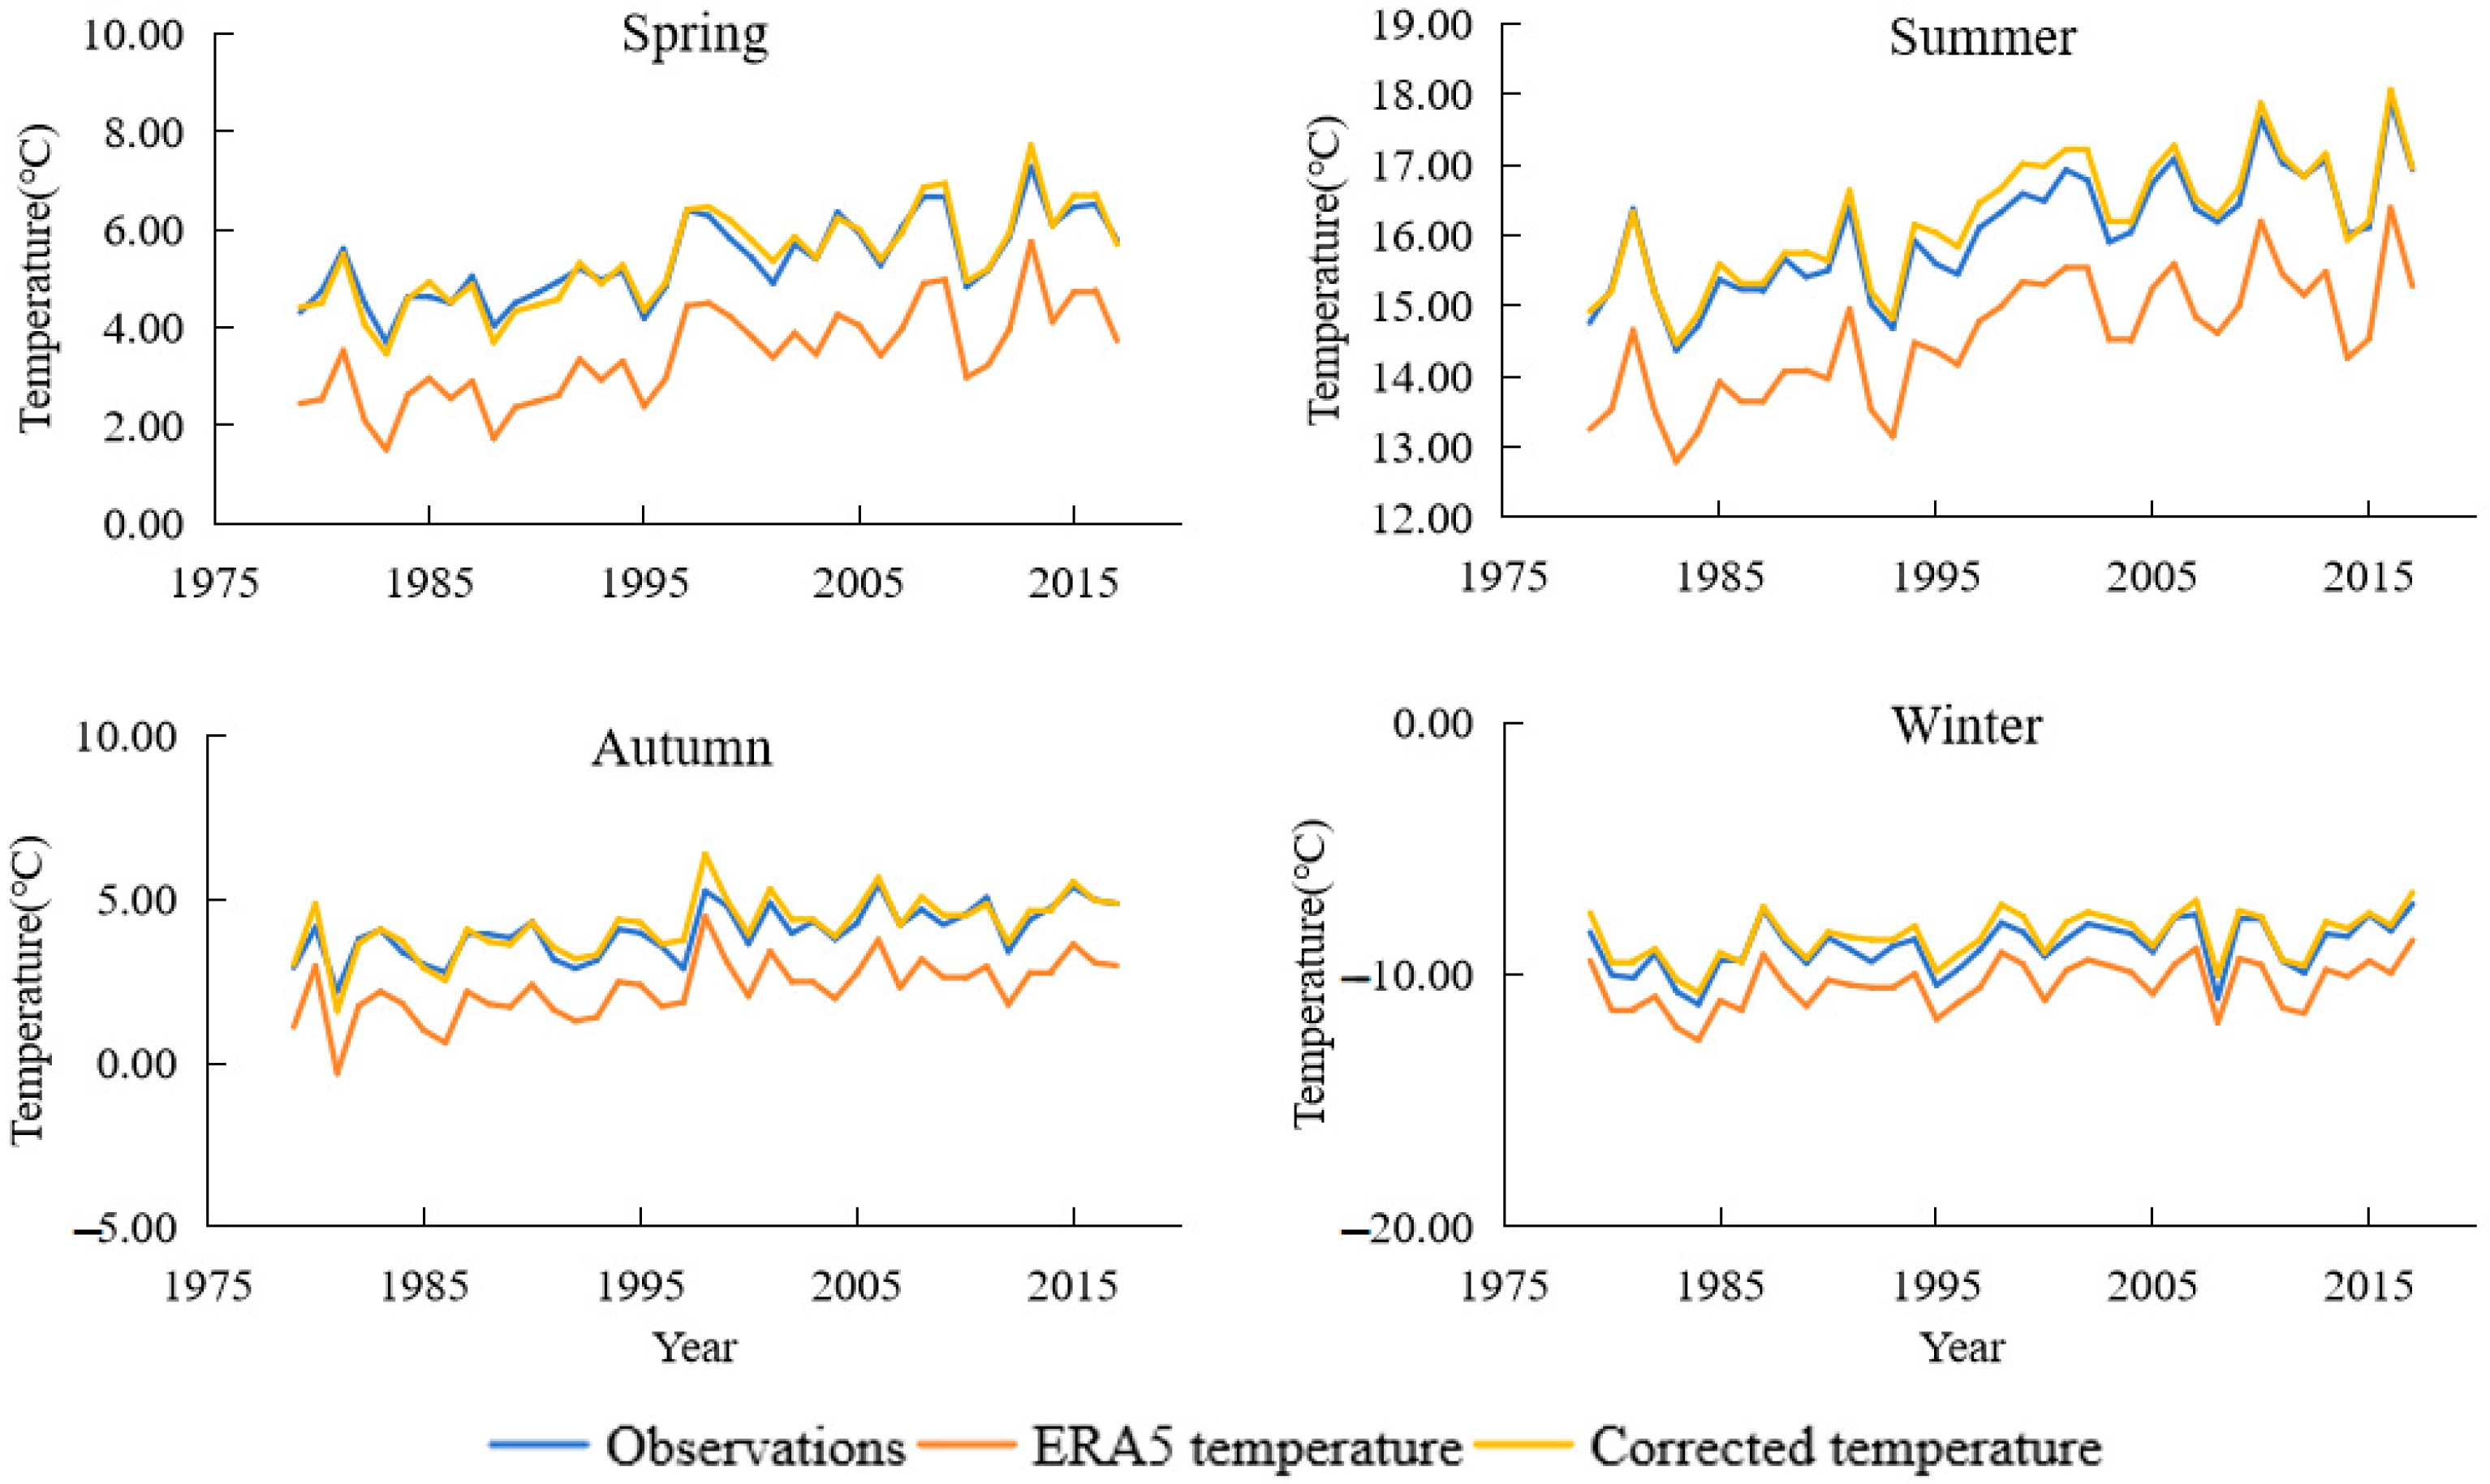
3.3. Correction Results of Annual Mean Temperature Data
4. Discussion
5. Conclusions
Author Contributions
Funding
Institutional Review Board Statement
Informed Consent Statement
Data Availability Statement
Acknowledgments
Conflicts of Interest
References
- Guo, Z.; Wang, N.; Shen, B.; Gu, Z.; Wu, Y.; Chen, A. Recent Spatiotemporal Trends in Glacier Snowline Altitude at the End of the Melt Season in the Qilian Mountains, China. Remote Sens. 2021, 13, 4935. [Google Scholar] [CrossRef]
- Du, W.; Kang, S.; Qian, L.; Jiang, Y.; Sun, W.; Chen, J.; Xu, Z.; Sun, W.; Qin, X.; Chai, X. Spatiotemporal Variation of Snow Cover Frequency in the Qilian Mountains (Northwestern China) during 2000–2020 and Associated Circulation Mechanisms. Remote Sens. 2022, 14, 2823. [Google Scholar] [CrossRef]
- Huai, B.; Wang, J.; Sun, W.; Wang, Y.; Zhang, W. Evaluation of the near-surface climate of the recent global atmospheric reanalysis for Qilian Mountains, Qinghai-Tibet Plateau. Atmos. Res. 2021, 250, 105401. [Google Scholar] [CrossRef]
- Cui, X.; Xu, G.; He, X.; Luo, D. Influences of Seasonal Soil Moisture and Temperature on Vegetation Phenology in the Qilian Mountains. Remote Sens. 2022, 14, 3645. [Google Scholar] [CrossRef]
- Wei, X.; Eboy, O.V.; Cao, G.; Xu, L. Spatio-temporal variation of water conservation and its impact factors on the southern slope of Qilian Mountains. Reg. Sustain. 2023, 4, 54–67. [Google Scholar] [CrossRef]
- Lin, P.; He, Z.; Du, J.; Chen, L.; Zhu, X.; Li, J. Recent changes in daily climate extremes in an arid mountain region, a case study in northwestern China’s Qilian Mountains. Sci. Rep. 2017, 7, 2245. [Google Scholar] [CrossRef]
- Aguilar-Lome, J.; Espinoza-Villar, R.; Espinoza, J.-C.; Rojas-Acuña, J.; Willems, B.L.; Leyva-Molina, W.-M. Elevation-dependent warming of land surface temperatures in the Andes assessed using MODIS LST time series (2000–2017). Int. J. Appl. Earth Obs. Geoinf. 2019, 77, 119–128. [Google Scholar] [CrossRef]
- Pepin, N.; Deng, H.; Zhang, H.; Zhang, F.; Kang, S.; Yao, T. An Examination of Temperature Trends at High Elevations Across the Tibetan Plateau: The Use of MODIS LST to Understand Patterns of Elevation-Dependent Warming. J. Geophys. Res. Atmos. 2019, 124, 5738–5756. [Google Scholar] [CrossRef]
- Li, Y.; Qin, X.; Jin, Z.; Liu, Y. Future Projection of Extreme Precipitation Indices over the Qilian Mountains under Global Warming. Int. J. Environ. Res. Public Health 2023, 20, 4961. [Google Scholar] [CrossRef]
- Zhu, L.; Fan, G. Assessment and projection of elevation-dependent warming over the Tibetan Plateau by CMIP6 models. Theor. Appl. Climatol. 2022, 147, 1713–1723. [Google Scholar] [CrossRef]
- Peng, Y.; Duan, A.; Zhang, C.; Tang, B.; Zhao, X. Evaluation of the surface air temperature over the Tibetan Plateau among different reanalysis datasets. Front. Environ. Sci. 2023, 11, 1152129. [Google Scholar] [CrossRef]
- Lan, H.; Guo, D.; Hua, W.; Pepin, N.; Sun, J. Evaluation of reanalysis air temperature and precipitation in high-latitude Asia using ground-based observations. Int. J. Climatol. 2022, 43, 1621–1638. [Google Scholar]
- Li, Y.; Qin, X.; Liu, Y.; Jin, Z.; Liu, J.; Wang, L.; Chen, J. Evaluation of Long-Term and High-Resolution Gridded Precipitation and Temperature Products in the Qilian Mountains, Qinghai–Tibet Plateau. Front. Environ. Sci. 2022, 10, 906821. [Google Scholar] [CrossRef]
- Gao, L.; Hao, L.; Chen, X.-W. Evaluation of ERA-interim monthly temperature data over the Tibetan Plateau. J. Mt. Sci. 2014, 11, 1154–1168. [Google Scholar] [CrossRef]
- Wu, Y.; Jiang, Y.; Zhang, Y.; Li, Y.; Chen, X.; Zhang, W.; Zhao, X. Reconstruction of 2 m air temperature from ERA5 reanalysis at Dome A, Antarctica. Int. J. Climatol. 2024, 45, e8722. [Google Scholar] [CrossRef]
- Medina, H.; Tian, D.; Srivastava, P.; Pelosi, A.; Chirico, G.B. Medium-range reference evapotranspiration forecasts for the contiguous United States based on multi-model numerical weather predictions. J. Hydrol. 2018, 562, 502–517. [Google Scholar]
- Frnda, J.; Durica, M.; Rozhon, J.; Vojtekova, M.; Nedoma, J.; Martinek, R. ECMWF short-term prediction accuracy improvement by deep learning. Sci. Rep. 2022, 12, 7898. [Google Scholar] [CrossRef]
- Zhao, P.; Gao, L.; Ma, M.; Du, J. Bias correction of ERA-Interim reanalysis temperature for the Qilian Mountains of China. Front. Environ. Sci. 2022, 10, 1033202. [Google Scholar]
- Gao, L.; Bernhardt, M.; Schulz, K.; Chen, X. Elevation correction of ERA-Interim temperature data in the Tibetan Plateau. Int. J. Climatol. 2017, 37, 3540–3552. [Google Scholar] [CrossRef]
- Gao, L.; Bernhardt, M.; Schulz, K. Elevation correction of ERA-Interim temperature data in complex terrain. Hydrol. Earth Syst. Sci. 2012, 16, 4661–4673. [Google Scholar]
- Gao, L.; Wei, J.; Wang, L.; Bernhardt, M.; Schulz, K.; Chen, X. A high-resolution air temperature data set for the Chinese Tian Shan in 1979–2016. Earth Syst. Sci. Data 2018, 10, 2097–2114. [Google Scholar] [CrossRef]
- Hersbach, H.; Bell, B.; Berrisford, P.; Hirahara, S.; Horányi, A.; Muñoz-Sabater, J.; Nicolas, J.; Peubey, C.; Radu, R.; Schepers, D.; et al. The ERA5 global reanalysis. Q. J. R. Meteorol. Soc. 2020, 146, 1999–2049. [Google Scholar] [CrossRef]
- Jiang, Q.; Li, W.; Fan, Z.; He, X.; Sun, W.; Chen, S.; Wen, J.; Gao, J.; Wang, J. Evaluation of the ERA5 reanalysis precipitation dataset over Chinese Mainland. J. Hydrol. 2021, 595, 125660. [Google Scholar] [CrossRef]
- Gomis-Cebolla, J.; Rattayova, V.; Salazar-Galán, S.; Francés, F. Evaluation of ERA5 and ERA5-Land reanalysis precipitation datasets over Spain (1951–2020). Atmos. Res. 2023, 284, 106606. [Google Scholar] [CrossRef]
- Bindajam, A.A.; Mallick, J.; AlQadhi, S.; Singh, C.K.; Hang, H.T. Impacts of Vegetation and Topography on Land Surface Temperature Variability over the Semi-Arid Mountain Cities of Saudi Arabia. Atmosphere 2020, 11, 762. [Google Scholar] [CrossRef]
- Wu, F.; You, Q.; Cai, Z.; Sun, G.; Normatov, I.; Shrestha, S. Significant elevation dependent warming over the Tibetan Plateau after removing longitude and latitude factors. Atmos. Res. 2023, 284, 106603. [Google Scholar] [CrossRef]
- Jin, H.; Li, X.; Frauenfeld, O.W.; Zhao, Y.; Chen, C.; Du, R.; Du, J.; Peng, X. Comparisons of statistical downscaling methods for air temperature over the Qilian Mountains. Theor. Appl. Climatol. 2022, 149, 893–896. [Google Scholar] [CrossRef]


| Station Number | Station Name | Latitude (°) | Longitude (°) | HOBS (m) | HERA5 (m) | Δh (m) |
|---|---|---|---|---|---|---|
| 1 | Jiu Quan | 39.67 | 98.72 | 1470 | 1372.69 | 97.31 |
| 2 | Gao Tai | 39.38 | 99.72 | 1357 | 1750.63 | −393.63 |
| 3 | Zhang Ye | 38.92 | 100.58 | 1550 | 1569.94 | −19.94 |
| 4 | Shan Dan | 38.78 | 101.08 | 1760 | 1948.03 | −188.03 |
| 5 | Yong Chang | 38.23 | 101.97 | 1987 | 2200.30 | −213.30 |
| 6 | Wu Wei | 38.08 | 102.92 | 1525 | 1534.51 | −9.51 |
| 7 | Wu Shaoling | 37.20 | 102.87 | 3045 | 3525.72 | −480.72 |
| 8 | Gao Lan | 36.55 | 103.67 | 2032 | 1920.80 | 111.20 |
| 9 | Leng Hu | 38.75 | 93.58 | 2762 | 2906.15 | −144.15 |
| 10 | Tuo Te | 38.87 | 98.37 | 3460 | 4063.61 | −603.61 |
| 11 | Ye Niugou | 38.62 | 99.35 | 3200 | 3931.52 | −731.52 |
| 12 | Qi Lian | 38.18 | 100.30 | 2800 | 3579.73 | −779.73 |
| 13 | Da Chaidan | 37.83 | 95.28 | 3000 | 3464.35 | −464.35 |
| 14 | De Lingha | 37.25 | 97.13 | 2762 | 3005.05 | −243.05 |
| 15 | Gang Cha | 37.33 | 100.17 | 3100 | 3302.15 | −202.15 |
| 16 | Men Yuan | 37.45 | 101.62 | 2800 | 3524.30 | −724.30 |
| 17 | Min He | 36.23 | 102.93 | 1900 | 2076.61 | −176.61 |
| Γ | Tref | Station Elevation Ranges |
|---|---|---|
| Γ500_600 | TERA_2m | 4000–5000 m |
| Γ600_700 | TERA_2m | 3000–4000 m |
| Γ700_850 | TERA_2m | 1500–3000 m |
| Γ850_925 | TERA_2m | 500–1500 m |
| Month | Γ500_600 | Γ600_700 | Γ700_850 | Γ850_925 |
|---|---|---|---|---|
| January | −6.76 | −5.70 | −5.76 | −6.51 |
| February | −6.90 | −6.05 | −6.20 | −6.53 |
| March | −7.12 | −6.59 | −6.57 | −6.51 |
| April | −7.29 | −7.08 | −6.57 | −6.28 |
| May | −7.16 | −7.16 | −6.15 | −5.74 |
| June | −6.86 | −7.03 | −5.52 | −5.05 |
| July | −6.55 | −6.68 | −4.95 | −4.50 |
| August | −6.56 | −6.52 | −4.99 | −4.61 |
| September | −6.69 | −6.63 | −5.75 | −5.51 |
| October | −6.98 | −6.65 | −6.34 | −6.32 |
| November | −7.09 | −6.28 | −6.09 | −6.53 |
| December | −6.80 | −5.74 | −5.68 | −6.50 |
| No. | Uncorrected Bias | Corrected Bias | Uncorrected RMSE | Corrected RMSE |
|---|---|---|---|---|
| 1 | 0.15 | −0.48 | 0.61 | 0.77 |
| 2 | 0.84 | 3.44 | 1.21 | 3.54 |
| 3 | −0.04 | 0.09 | 1.06 | 1.05 |
| 4 | −1.42 | −0.18 | 1.60 | 0.76 |
| 5 | −0.64 | 0.77 | 1.03 | 1.14 |
| 6 | 0.35 | 0.41 | 0.87 | 0.90 |
| 7 | −1.42 | 1.60 | 2.12 | 2.28 |
| 8 | 1.11 | 0.40 | 1.42 | 1.03 |
| 9 | −0.05 | 0.74 | 0.66 | 1.09 |
| 10 | −6.03 | −2.51 | 6.32 | 3.14 |
| 11 | −5.21 | −0.99 | 5.48 | 1.93 |
| 12 | −6.71 | −2.06 | 6.92 | 2.57 |
| 13 | −1.70 | 1.61 | 1.86 | 1.78 |
| 14 | −0.69 | 0.59 | 0.95 | 0.89 |
| 15 | −0.10 | 1.17 | 1.07 | 1.63 |
| 16 | −6.01 | −1.72 | 6.26 | 2.30 |
| 17 | −0.77 | 0.39 | 1.12 | 0.94 |
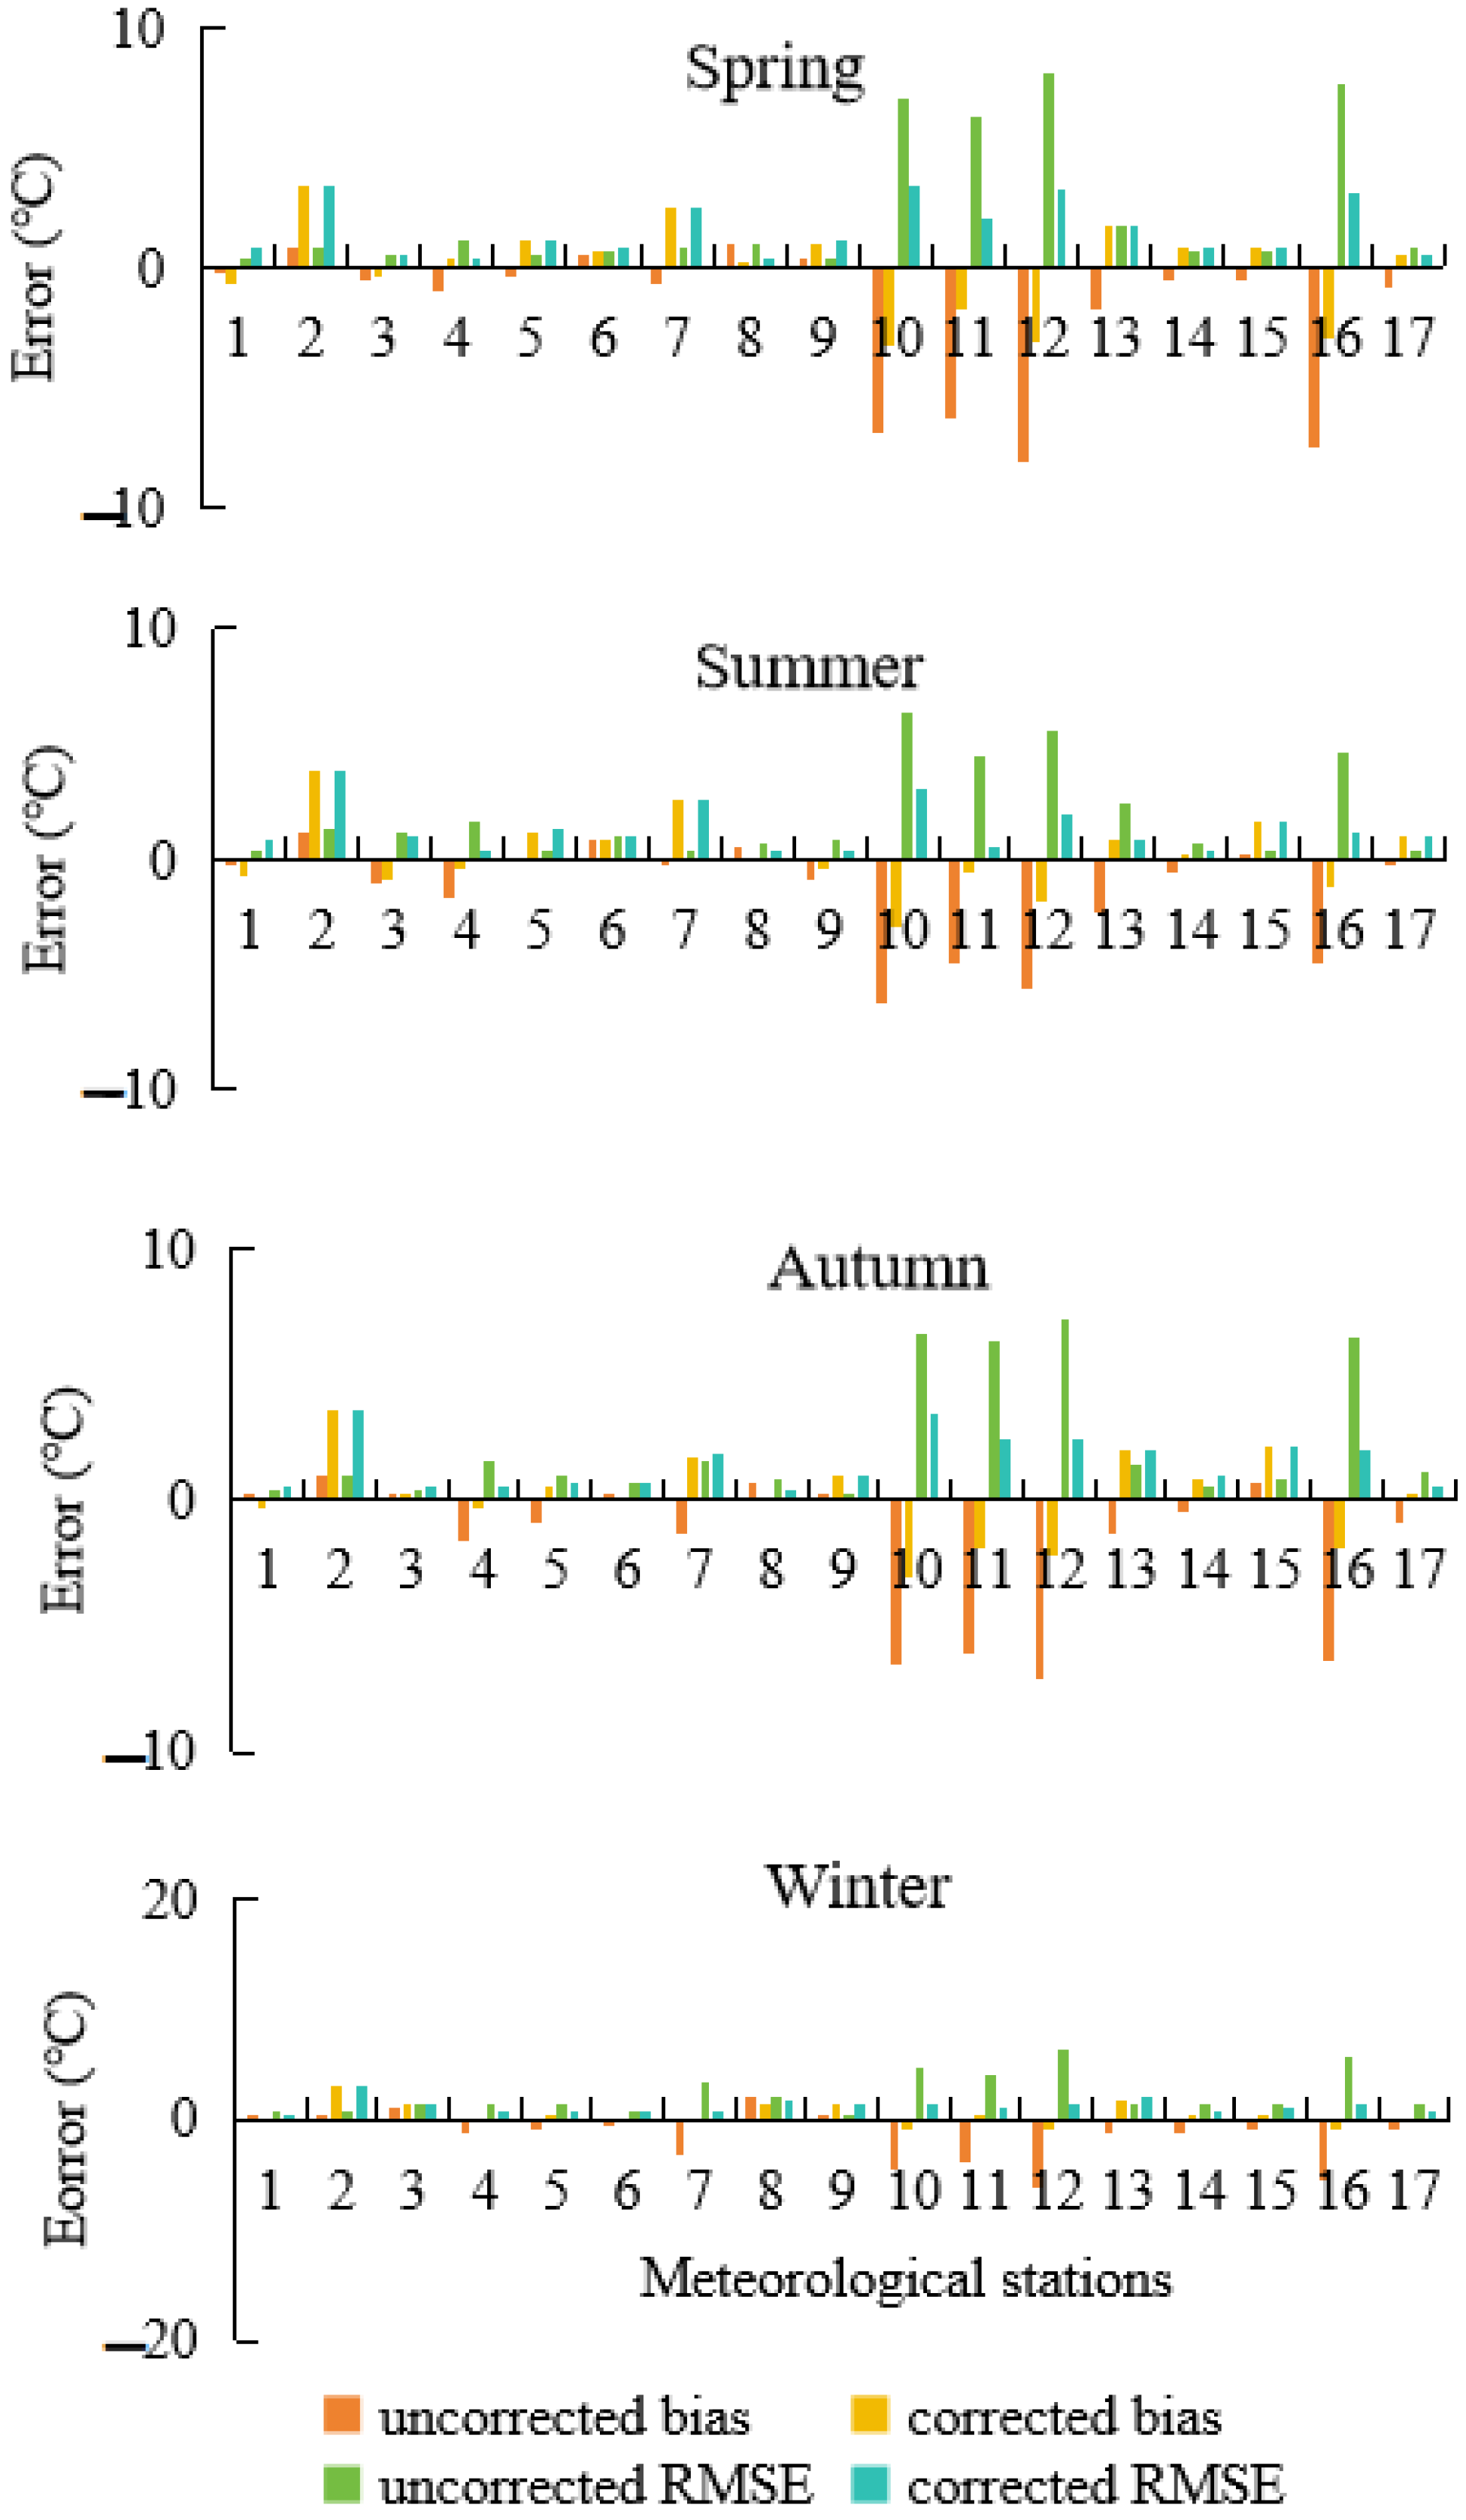
| No. | Corrected Bias in Spring | Corrected Bias in Summer | Corrected Bias in Autumn | Corrected Bias in Winter | Uncorrected Bias in Spring | Uncorrected Bias in Summer | Uncorrected Bias in Autumn | Uncorrected Bias in Winter |
|---|---|---|---|---|---|---|---|---|
| 1 | −0.73 | −0.74 | −0.39 | −0.05 | −0.09 | −0.08 | 0.24 | 0.55 |
| 2 | 3.41 | 3.78 | 3.52 | 3.03 | 0.81 | 1.17 | 0.92 | 0.46 |
| 3 | −0.34 | −0.91 | 0.31 | 1.28 | −0.49 | −1.05 | 0.19 | 1.18 |
| 4 | 0.31 | −0.34 | −0.33 | −0.35 | −1.04 | −1.68 | −1.57 | −1.4 |
| 5 | 1.08 | 1.23 | 0.53 | 0.23 | −0.43 | −0.17 | −0.89 | −1.05 |
| 6 | 0.65 | 0.89 | 0.17 | −0.07 | 0.57 | 0.82 | 0.11 | −0.11 |
| 7 | 2.48 | 2.56 | 1.71 | −0.34 | −0.74 | −0.33 | −1.38 | −3.25 |
| 8 | 0.21 | −0.16 | 0.03 | 1.53 | 0.99 | 0.61 | 0.72 | 2.12 |
| 9 | 1.00 | −0.37 | 0.99 | 1.32 | 0.15 | −0.87 | 0.14 | 0.38 |
| 10 | −3.20 | −2.98 | −3.00 | −0.84 | −6.94 | −6.27 | −6.46 | −4.43 |
| 11 | −1.81 | −0.55 | −1.93 | 0.34 | −6.23 | −4.46 | −6.12 | −4.02 |
| 12 | −3.17 | −1.88 | −2.14 | −1.05 | −8.08 | −5.58 | −7.03 | −6.13 |
| 13 | 1.74 | 0.87 | 1.98 | 1.87 | −1.76 | −2.37 | −1.39 | −1.27 |
| 14 | 0.81 | 0.25 | 0.89 | 0.43 | −0.57 | −0.53 | −0.46 | −1.19 |
| 15 | 0.76 | 1.62 | 2.09 | 0.21 | −0.54 | 0.28 | 0.72 | −0.87 |
| 16 | −3.01 | −1.18 | −1.85 | −0.86 | −7.56 | −4.57 | −6.33 | −5.56 |
| 17 | 0.44 | 0.97 | 0.22 | −0.06 | −0.82 | −0.27 | −0.93 | −1.05 |
| No. | Corrected RMSE in Spring | Corrected RMSE in Summer | Corrected RMSE in Autumn | Corrected RMSE in Winter | Uncorrected RMSE in Spring | Uncorrected RMSE in Summer | Uncorrected RMSE in Autumn | Uncorrected RMSE in Winter |
|---|---|---|---|---|---|---|---|---|
| 1 | 0.82 | 0.84 | 0.55 | 0.46 | 0.39 | 0.42 | 0.46 | 0.71 |
| 2 | 3.42 | 3.82 | 3.55 | 3.11 | 0.87 | 1.27 | 1.04 | 0.85 |
| 3 | 0.45 | 0.94 | 0.49 | 1.43 | 0.57 | 1.09 | 0.42 | 1.35 |
| 4 | 0.39 | 0.44 | 0.50 | 0.70 | 1.07 | 1.7 | 1.61 | 1.52 |
| 5 | 1.15 | 1.27 | 0.74 | 0.68 | 0.58 | 0.37 | 1.02 | 1.23 |
| 6 | 0.76 | 1.01 | 0.69 | 0.67 | 0.71 | 0.95 | 0.68 | 0.68 |
| 7 | 2.52 | 2.57 | 1.87 | 0.82 | 0.85 | 0.38 | 1.57 | 3.33 |
| 8 | 0.36 | 0.32 | 0.45 | 1.60 | 1.03 | 0.67 | 0.85 | 2.16 |
| 9 | 1.05 | 0.44 | 1.03 | 1.36 | 0.35 | 0.9 | 0.32 | 0.5 |
| 10 | 3.41 | 2.99 | 3.44 | 1.35 | 7.04 | 6.28 | 6.67 | 4.56 |
| 11 | 2.08 | 0.59 | 2.35 | 0.90 | 6.31 | 4.46 | 6.26 | 4.1 |
| 12 | 3.26 | 1.89 | 2.41 | 1.36 | 8.12 | 5.58 | 7.11 | 6.2 |
| 13 | 1.77 | 0.91 | 2.01 | 1.95 | 1.8 | 2.39 | 1.44 | 1.39 |
| 14 | 0.86 | 0.45 | 0.95 | 0.75 | 0.65 | 0.65 | 0.56 | 1.34 |
| 15 | 0.84 | 1.64 | 2.15 | 0.90 | 0.65 | 0.37 | 0.88 | 1.23 |
| 16 | 3.05 | 1.21 | 2.04 | 1.39 | 7.58 | 4.58 | 6.39 | 5.67 |
| 17 | 0.56 | 1.02 | 0.53 | 0.65 | 0.89 | 0.43 | 1.05 | 1.24 |
Disclaimer/Publisher’s Note: The statements, opinions and data contained in all publications are solely those of the individual author(s) and contributor(s) and not of MDPI and/or the editor(s). MDPI and/or the editor(s) disclaim responsibility for any injury to people or property resulting from any ideas, methods, instructions or products referred to in the content. |
© 2025 by the authors. Licensee MDPI, Basel, Switzerland. This article is an open access article distributed under the terms and conditions of the Creative Commons Attribution (CC BY) license (https://creativecommons.org/licenses/by/4.0/).
Share and Cite
Zhao, P.; Qian, L. Elevation Correction of ERA5 Reanalysis Temperature over the Qilian Mountains of China. Atmosphere 2025, 16, 324. https://doi.org/10.3390/atmos16030324
Zhao P, Qian L. Elevation Correction of ERA5 Reanalysis Temperature over the Qilian Mountains of China. Atmosphere. 2025; 16(3):324. https://doi.org/10.3390/atmos16030324
Chicago/Turabian StyleZhao, Peng, and Lihui Qian. 2025. "Elevation Correction of ERA5 Reanalysis Temperature over the Qilian Mountains of China" Atmosphere 16, no. 3: 324. https://doi.org/10.3390/atmos16030324
APA StyleZhao, P., & Qian, L. (2025). Elevation Correction of ERA5 Reanalysis Temperature over the Qilian Mountains of China. Atmosphere, 16(3), 324. https://doi.org/10.3390/atmos16030324