Article

Role of Position of Pacific Subtropical High in Deciding Path of Tropical Storms

by
Ravi Shankar Pandey
Dipartimento di Fisica e Astronomia “Augusto Righi”, Alma Mater Studiorum–Università di Bologna, Viale Berti Pichat 6/2, 40127 Bologna, Italy
Atmosphere 2025, 16(3), 322; https://doi.org/10.3390/atmos16030322
Submission received: 22 January 2025 / Revised: 23 February 2025 / Accepted: 8 March 2025 / Published: 11 March 2025
(This article belongs to the Section Meteorology)

Abstract

:
The Pacific Subtropical High (PSH) predominantly develops during the boreal summer (June–August) over the Northwest Pacific (NWP) basin, with August accounting for the highest tropical storm (TS) frequency (46.9%). This study examines the critical influence of the PSH’s position on TS trajectories and the consequent exposure of affected countries, utilizing four decades (1977–2016) of August TS data from the NWP. A total of 55 TSs, unaffected by other environmental factors, were analyzed. The PSH’s observed position during each TS’s turning point was delineated using a geopotential height of 500 hPa, while track sinuosity was quantified using a validated sinuosity index (SI). Three distinct TS paths were identified: an eastward PSH position leads to highly sinuous tracks, directing TSs toward Japan; a westward PSH position results in straighter tracks, steering TSs toward the South China Sea (SCS) below Taiwan; and a mid-position guides TSs toward Taiwan. These findings underscore the PSH’s pivotal role in modulating TS behavior and provide valuable insights for disaster risk management agencies to mitigate TS impacts in the NWP basin, the world’s most active TS region, responsible for one-third of global tropical cyclones.

1. Introduction

Tropical storms (TSs) are one of the most destructive natural phenomena, causing great damage to life and property globally. In tropical regions, TSs are the most damaging natural disaster [1,2]. Among all six active TS ocean basins in the world, the Northwest Pacific (NWP) ocean basin, which includes many major marginal seas such as the South China Sea, the Eastern China Sea, the Philippine Sea, the Coral Sea, the Sea of Japan, the Tasman Sea, and the Sea of Okhotsk, alone accounts for one-third (30%) of all global TSs since 1970, as per the National Oceanic and Atmospheric Administration’s (NOAA) 2010 Hurricane Research Division report [3]. Over a 40-year (1977–2016) period, the NWP basin produced an average of 24 TSs per year, which is the most among all TS-prone ocean basins in the world [4]. The heavy movement and formation of TSs in the NWP can even trigger earthquakes when they cross the boundary of the Pacific–Philippine Sea plates during the boreal summer season [5]. Recent data clearly show the correlation between the increasing sea surface temperature (SST) of the marginal seas of the NWP and the increasing strength of TSs [6]. Moreover, a similar recent investigation in the NWP shows that the tracks and cyclogenesis locations of TSs that have hit Taiwan in the last 40 years have varied along with an increase of 35% in the strength of TSs due to an increase of 0.4 to 0.7 °C in the SST of marginal seas in the NWP [7]. Nine STYs in 2015 was the second-largest number of STYs recorded in the NWP’s history, whereas, on average, seven STYs per year were noticed during 2013~2016, and an average of 5.5, 4.25, and 3.5 STYs per year were observed during 2001~2004, 2005~2008, and 2009~2012, respectively. To clarify, when a TS’s maximum (01 min mean) sustained wind is ≥113 knots, then it is called an STY. Thus, as shown above, the recent data support several forecasts of growing TS strength in the NWP. This situation indeed provides a frightening inspiration for the constant study of the nature of TS in the NWP [8].
Intensifying TSs in the NWP region are also creating new challenges in predicting the tracks of TSs. For example, the interaction between two TSs (also known as the Fujiwhara effect after the name of a Japanese meteorologist, Dr. Sakuhei Fujiwhara, who first proposed it in 1921) makes predictions rather challenging for models. A recent study found that seven out of thirty STYs over 2013–2017 in the NWP region were involved in causing the Fujiwhara effect [9,10,11]. Hence, a natural phenomenon such as the Fujiwhara effect is also boosted by the presence of stronger TSs in the region. Another recent study showed that an interaction between two TSs (Melor and Parma, 2009) in the NWP basin can cause very heavy unexpected damage due to the reduced accuracy of track predictions [12]. Recent research shows the deflection in the tracks of two different TSs in the Bay of Bengal (BoB) and compares the response of two models in accurately predicting their tracks, along with a discussion of the possible physical causes [13]. Another study finds 10 different paths through which TSs can hit Taiwan [7]. To quantify the extent of the curviness of a TS track, a new track sinuosity index was introduced by Terry and Gienko [14].
A recent study shows that the swelling strength of TSs in the NWP basin is also increasing the curviness (sinuosity) of their tracks, which further allows them to survive longer by covering longer distances and hence creating more damage [4]. The trajectory made by the twisting path of the track of a TS can tell us the probability of its landfall over exposed countries and coastlines; thus, this is a lucrative area of study [15,16]. Correspondingly, recent research shows the association between a TS’s maximum intensity and the track’s recurvature point [17]. Global warming and climate change can be linked with the changing pattern in the tracks of TSs in any ocean basin [4,18].
Environmental factors are vital in providing the particular shape of the track of a TS. A crucial role is played by the northwest cold air masses and southwest airflows in strengthening STYs in the winter and summer seasons, respectively, in the NWP basin [9]. In the boreal summer season (June, July, and August) in the NWP, the Pacific Subtropical High (PSH) originates, and its position and strength can play an essential role in deciding the path followed by the existing TSs, along with other environmental factors [19,20].
The current paper firstly aims to detect only those TSs during the peak season (August makes up 46.9% of boreal summer TSs) of the boreal summer season during 4 decades (1977–2016), accompanied by the existence of the PSH and unaffected by other environmental factors due to their absence. Later, this paper aims to measure the types of paths followed by TSs with different positions of the PSH in the NWP, along with measuring the track sinuosity of each TS track separately. Lastly, this paper aims to discuss the exposed countries due to the different paths of TSs caused by the different positions of the PSH in the NWP. Note here that the current paper is the extension of the previous paper by Pandey and Liou (2020) [4], which linked the track sinuosity of TSs to their strength in the NWP during 1977–2016, whereas the current paper extends this work to link the impact of the PSH on the track sinuosity of TSs. Hence, the current study chooses the same timeframe of study to keep it comparative and useful for the prospective combined conclusion based on other studies. This kind of research on the tracks of TSs is very crucial for countries exposed to NWP-based TSs, such as Japan, China, Taiwan, Republic of Korea, etc.

2. Materials and Methods
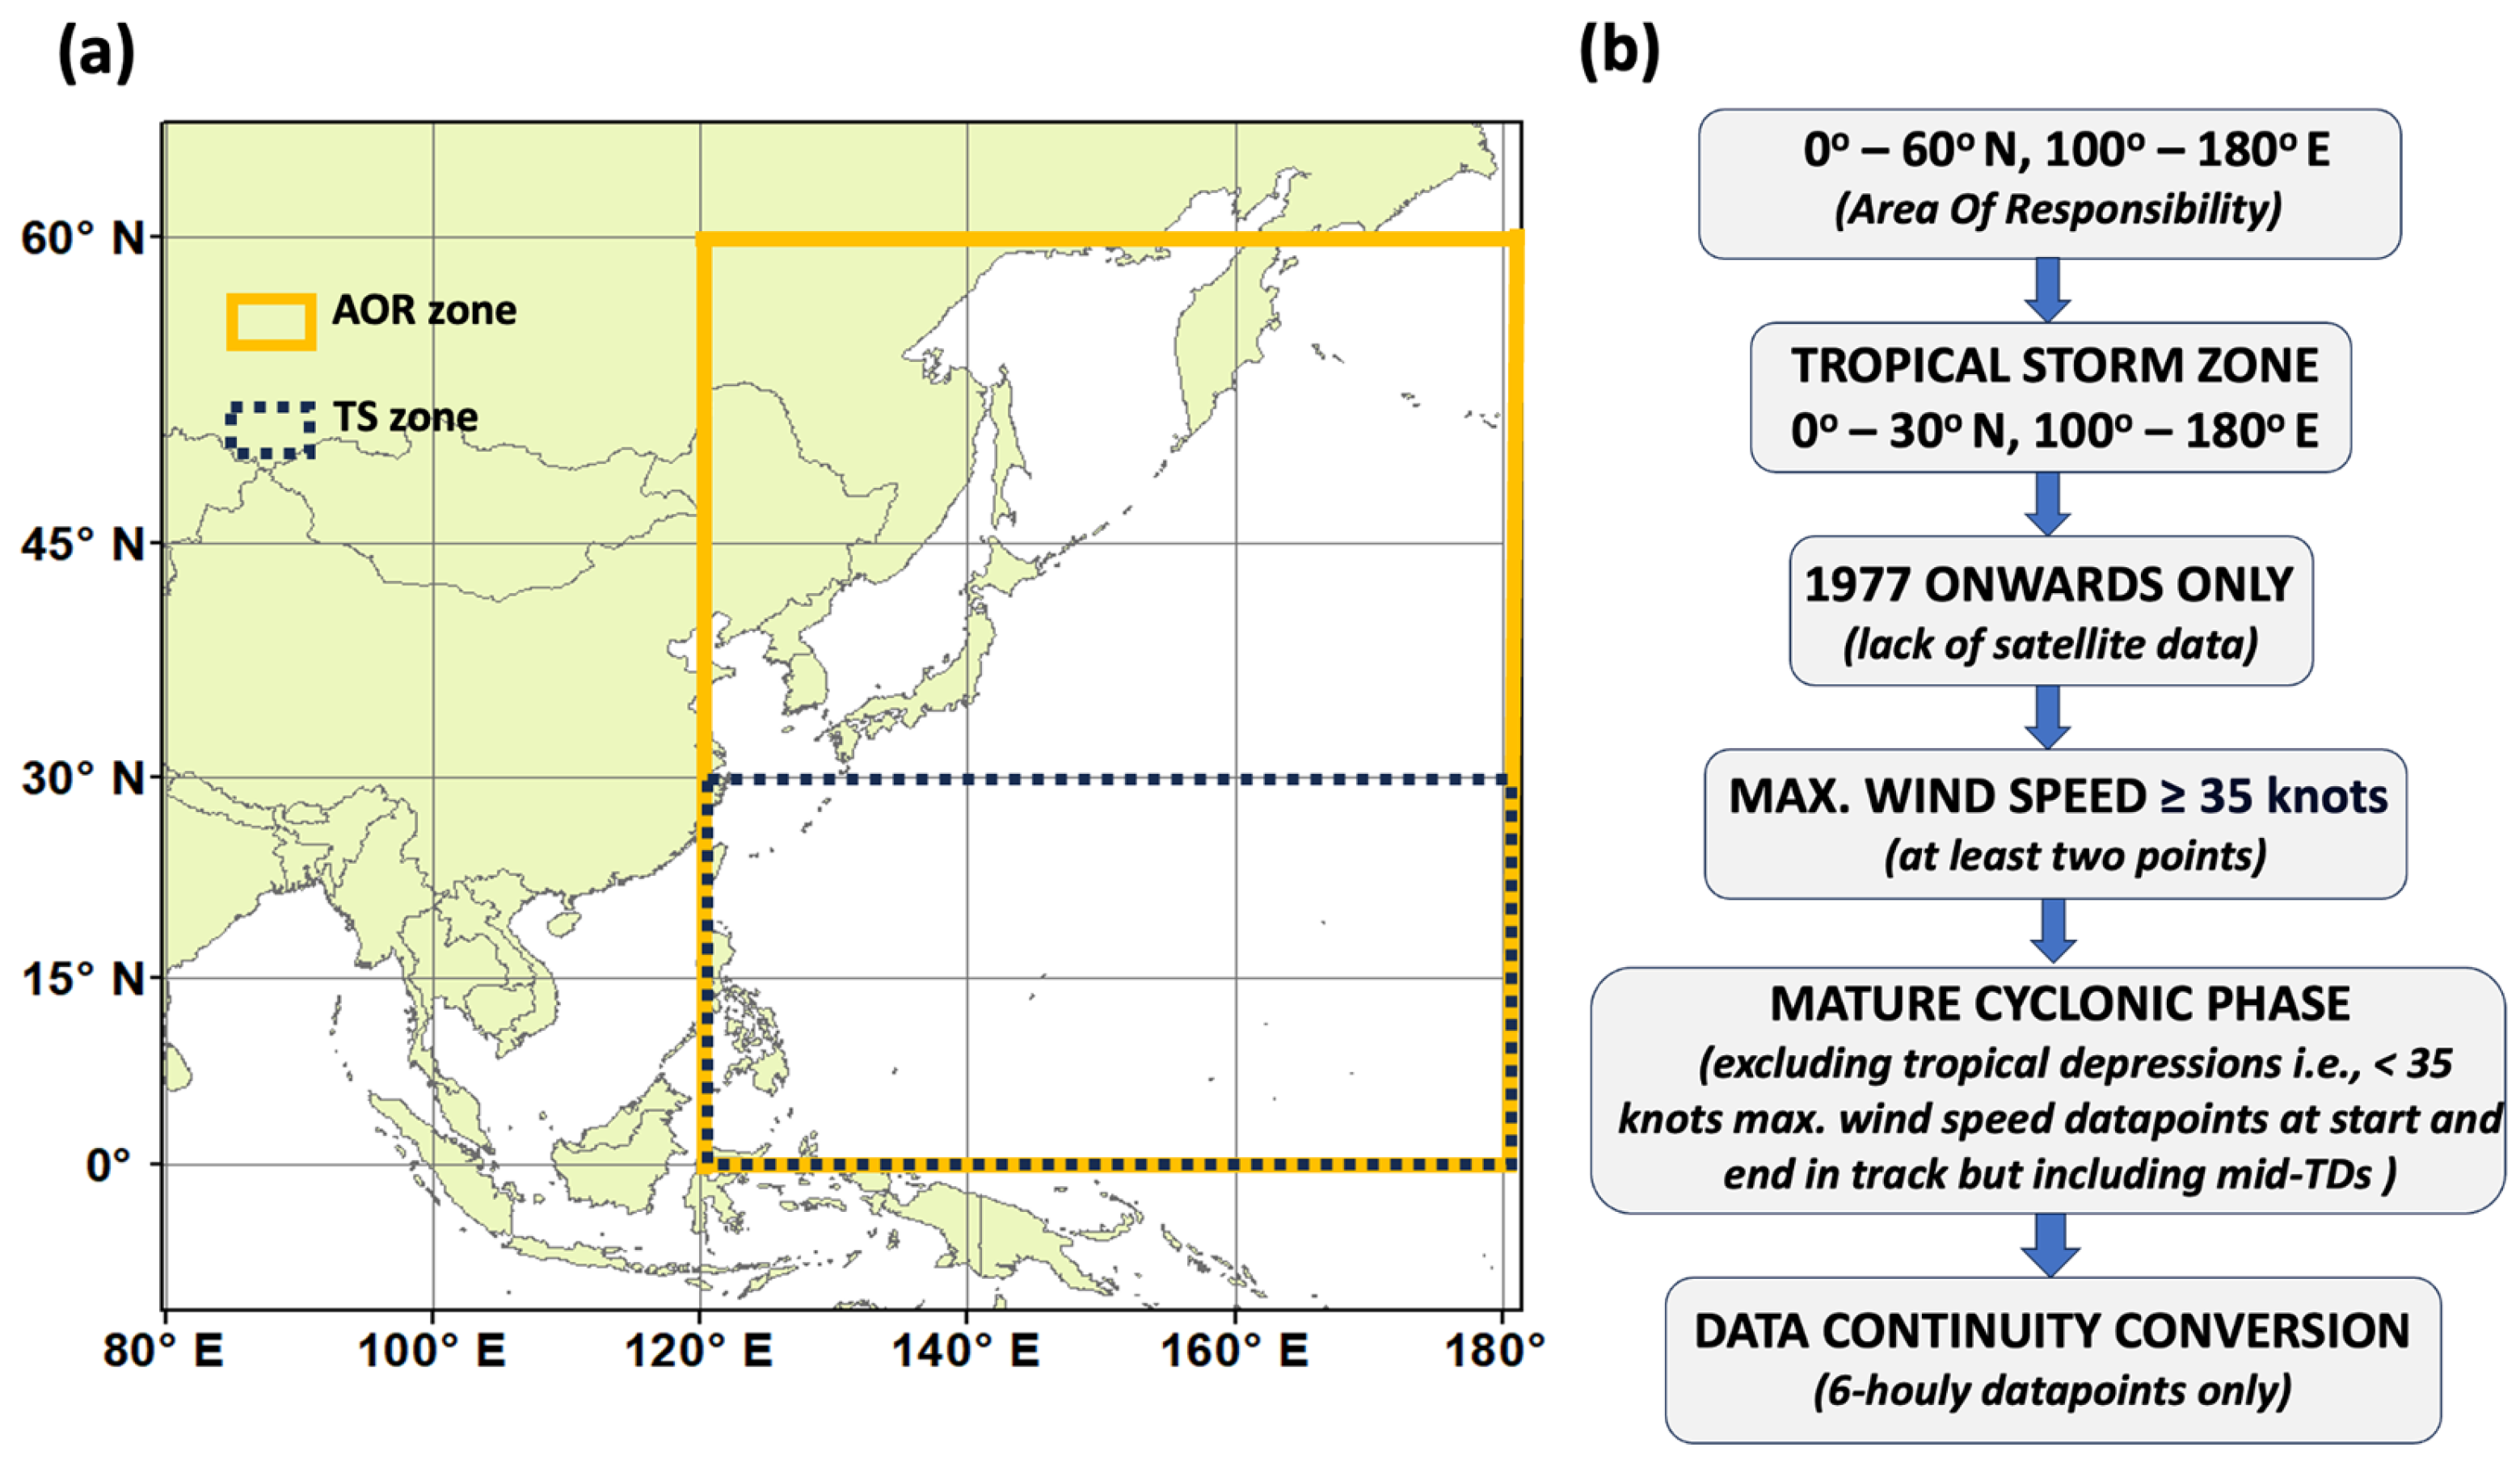
2.1. Data Source

The data of TSs, with their individual names, duration of existence, intensity (maximum (10 min mean) wind speed and minimum central pressure), time stamps, and positions on the map (longitude and latitude), were taken from the International Best Track Archive for Climate Stewardship (IBTrACS) database, which is kept in a public domain by the United States’ National Oceanic and Atmospheric Administration (NOAA). The data originally belong to the Regional Specialized Meteorological Center—Tokyo (RSMC—Tokyo) center of the Japan Meteorological Agency (JMA). The IBTrACS dataset contains the majority of 6-hourly satellites, reporting data relating to the above-explained TS parameters, along with a few 3-hourly and 1-hourly reports of the same TS parameters’ data. The temporal resolution of the data is from 1951 to 2017. Moreover, before 1977, the TS data in the NWP were not completely dependent on satellites but were predominantly obtained by utilizing other conventional methods of the time, such as aircraft reconnaissance, which is less reliable when used for investigations [21]. The use of radars was also limited to when any TS luckily came within range. In addition, the use of the Dvorak technique and measurements of maximum wind speed began to be regularly used after 1976 in the NWP basin [21,22,23,24]. Hence, data on TSs before 1977 are not used due to their reduced precision. This dataset contained 1695 recorded TS event cases in the NWP ocean basin. In total, 959 TS cases belong to the four decades of the 1977–2016 period, and 401 TS cases are from the boreal summer season, of which 188 TS cases are from August. The current paper uses only August TS data from the 4 decades from 1977 to 2016 for analysis.

2.2. Data Sorting

Figure 1 provides the study region and the steps for data sorting.
Data sorting is necessary to ensure that the data are homogeneous, reliable, noise-free, and suitable for statistical measurements such as the track’s sinuosity index (SI) (Figure 1).
(1) In the current paper, the entire NWP (NWP) ocean basin, which includes many major marginal seas such as the South China Sea, the Eastern China Sea, the Philippine Sea, the Coral Sea, the Sea of Japan, the Sea of Okhotsk, and the Tasman Sea, is the main study area (Figure 1a). All TSs that fall within the NWP region are considered. More specifically, we have analyzed only the data of TSs falling within the area of responsibility (AOR) of the Regional Specialized Meteorological Center—Tokyo center (RSMC—Tokyo) of the Japan Meteorological Agency (JMA). The AOR of RSMC—Tokyo is found to be capable of representing the whole NWP basin, covering the South China Sea (0°–60° N, 100°–180° E) and including marginal seas and adjacent land areas (Figure 1a). TSs with cyclogenesis between 0° and 30° latitude are called TSs (TSs), and TSs with cyclogenesis beyond 30° latitude are called extra-TSs. Thus, it can be clearly understood that for this paper, only TSs with cyclogenesis between 0° and 30° N are considered. This zone of the NWP is shown with a blue dashed box in Figure 1a.
(2) Homogeneity is one of the requirements for statistical analysis and Spatiotemporal comparisons in a dataset. Thus, all 3-hourly and 1-hourly measured data points were removed by suitable algorithms to make the data smooth (Figure 1b).
(3) The data points belonging to the immature tropical depression stage with a maximum wind speed of less than 35 knots during initial cyclogenesis and late cyclolysis were removed as it is misleading to investigate the TS track sinuosity of TS cases. Sometimes, when the maximum wind speed drops to zero knots (under 35 knots), the TS does not enter the cyclolysis process but regains its strength and its maximum wind speed crosses 35 knots. In this case, only the final cyclolysis process, with a maximum wind speed below 35 knots, will have its track length removed from the investigation, not the middle one. This is required to avoid the same TS plotting as two different TSs in ArcGIS.

2.3. Sinuosity Index

After sorting and optimization, the final IBTrACS dataset contains 188 August TS cases, which were later rearranged into GIS-compatible files to be imported into the GIS environment (ESRI ArcGIS 10.5). The tracks of TSs were plotted by the ArcGIS software based on their respective latitudinal and longitudinal positions on the map. For measuring the geodesic distance, we took two steps, as shown below. (1) The direct geodesic distance between the cyclolysis and cyclogenesis positions was measured for each TS case separately utilizing the ArcGIS software. In detail, we first plotted each TS track in ArcGIS. Then, by using the “measure” tool, we measured the geodesic distance between any two fixed latitude and longitude points on the map. (2) The geodesic distances between each latitude and longitude point, along with its succeeding 6-hourly measured latitude and longitude points, were also calculated for every TS track. By adding all geodesic distances that were measured between succeeding coordinate points for each TS, we can find the total geodesic track length for that individual TS. Finally, the track sinuosity value is found by a simple division of the total geodesic track length calculated for each TS from the direct geodesic distance between the cyclolysis and cyclogenesis coordinate points of each TS case separately.
S i n u o s i t y   V a l u e   S = T o t a l   g e o d e s i c   t r a c k   l e n g t h   ( m e a s u r e d   w i t h   e v e r y   6 h o u r   c o n t i n u o u s   d a t a ) C y c l o g e n e s i s   t o   c y c l o l y s i s   d i r e c t   g e o d e s i c   l e n g t h
Before proceeding with the sinuosity values to measure the sinuosity index, the terms “sinuous” and “recurving” must be defined properly to avoid confusion for readers: following Equation (1), the sinuous track refers to the level of curviness in that particular track as it is represented by the ratio of the total track length to the directly measured length (geodesic distance) between its starting (cyclogenesis, i.e., the first 6-hourly measured position of the eye of the TS when the maximum wind speed is 35 knots or more) and ending (cyclolysis, i.e., the last 6-hourly measured position of the eye of the TS when the maximum wind speed is 35 knots or more) points [4,14]. Hence, a sinuous track following a TS can go in any zig-zag direction, including a curved one, whereas a recurving track following a TS must form a curve or turn in a backward or reverse direction. Recurving tracks are typically formed due to the impact of the Coriolis force, although the impact of other environmental factors can also create these [9].
The shortest direct route between any two coordinate points on Earth is called a geodesic distance. Vincenty’s formula is better than the method of great-circle distance as it considers the earth as an oblate spheroid, which increases accuracy. Vincenty’s formula for computing the shortest distance between two coordinate points on Earth is applied in the thesis [25]. ArcGIS software has an in-built capability of using the Vincenty formula for measuring the distance between any two coordinate points on a map, which is utilized to measure the track lengths and direct distance between cyclogenesis and cyclolysis locations on the map.
The equation of the sinuosity index (SI) is used to quantify the level of the sinuous nature of TS tracks and is given below [4,9,14]:
S i n u o s i t y   I n d e x   ( S I ) =   S 1 3 × 10
where SI is the TS track’s SI value for each individual TS, and S is the measured sinuosity value for each individual TS. Note here that the sinuosity index was developed in 2011 by Terry and Gienko [14] by applying a simple cube-root transformation to the original track sinuosity values; thus, it is an empirical equation and cannot be derived. Since then, it has been used by various recent research studies to measure the level of curviness in the tracks of TSs [4,9].
In Equation (2), the deduction of unity (1) from the calculated sinuosity value (S) produces the minimum possible sinuosity index value zero (0) of any particular TS. A SI value of zero (0) represents a TS with a faultlessly straight track. To avoid small decimal fractions in the SI data, the digit ten (10) is multiplied in Equation (2) to retain most of the sinuosity index values larger than unity (1).
Based on Equation (2), the values of SI are measured for all TSs under study. All TSs are divided into 4 equal quartiles, putting them in order of increasing SI values. Thus, the SI values in the first quartile have the lowest SI values among all quartiles and relate to TSs following the straightest path. Similarly, TSs based in the 2nd and 3rd quartiles have quasi-straight and quasi-sinuous paths, respectively. The last quartile has the highest SI values and TSs with the most curved or sinuous tracks. The above process is well-established for dividing TSs in terms of their track sinuosity in the NWP [4,9].

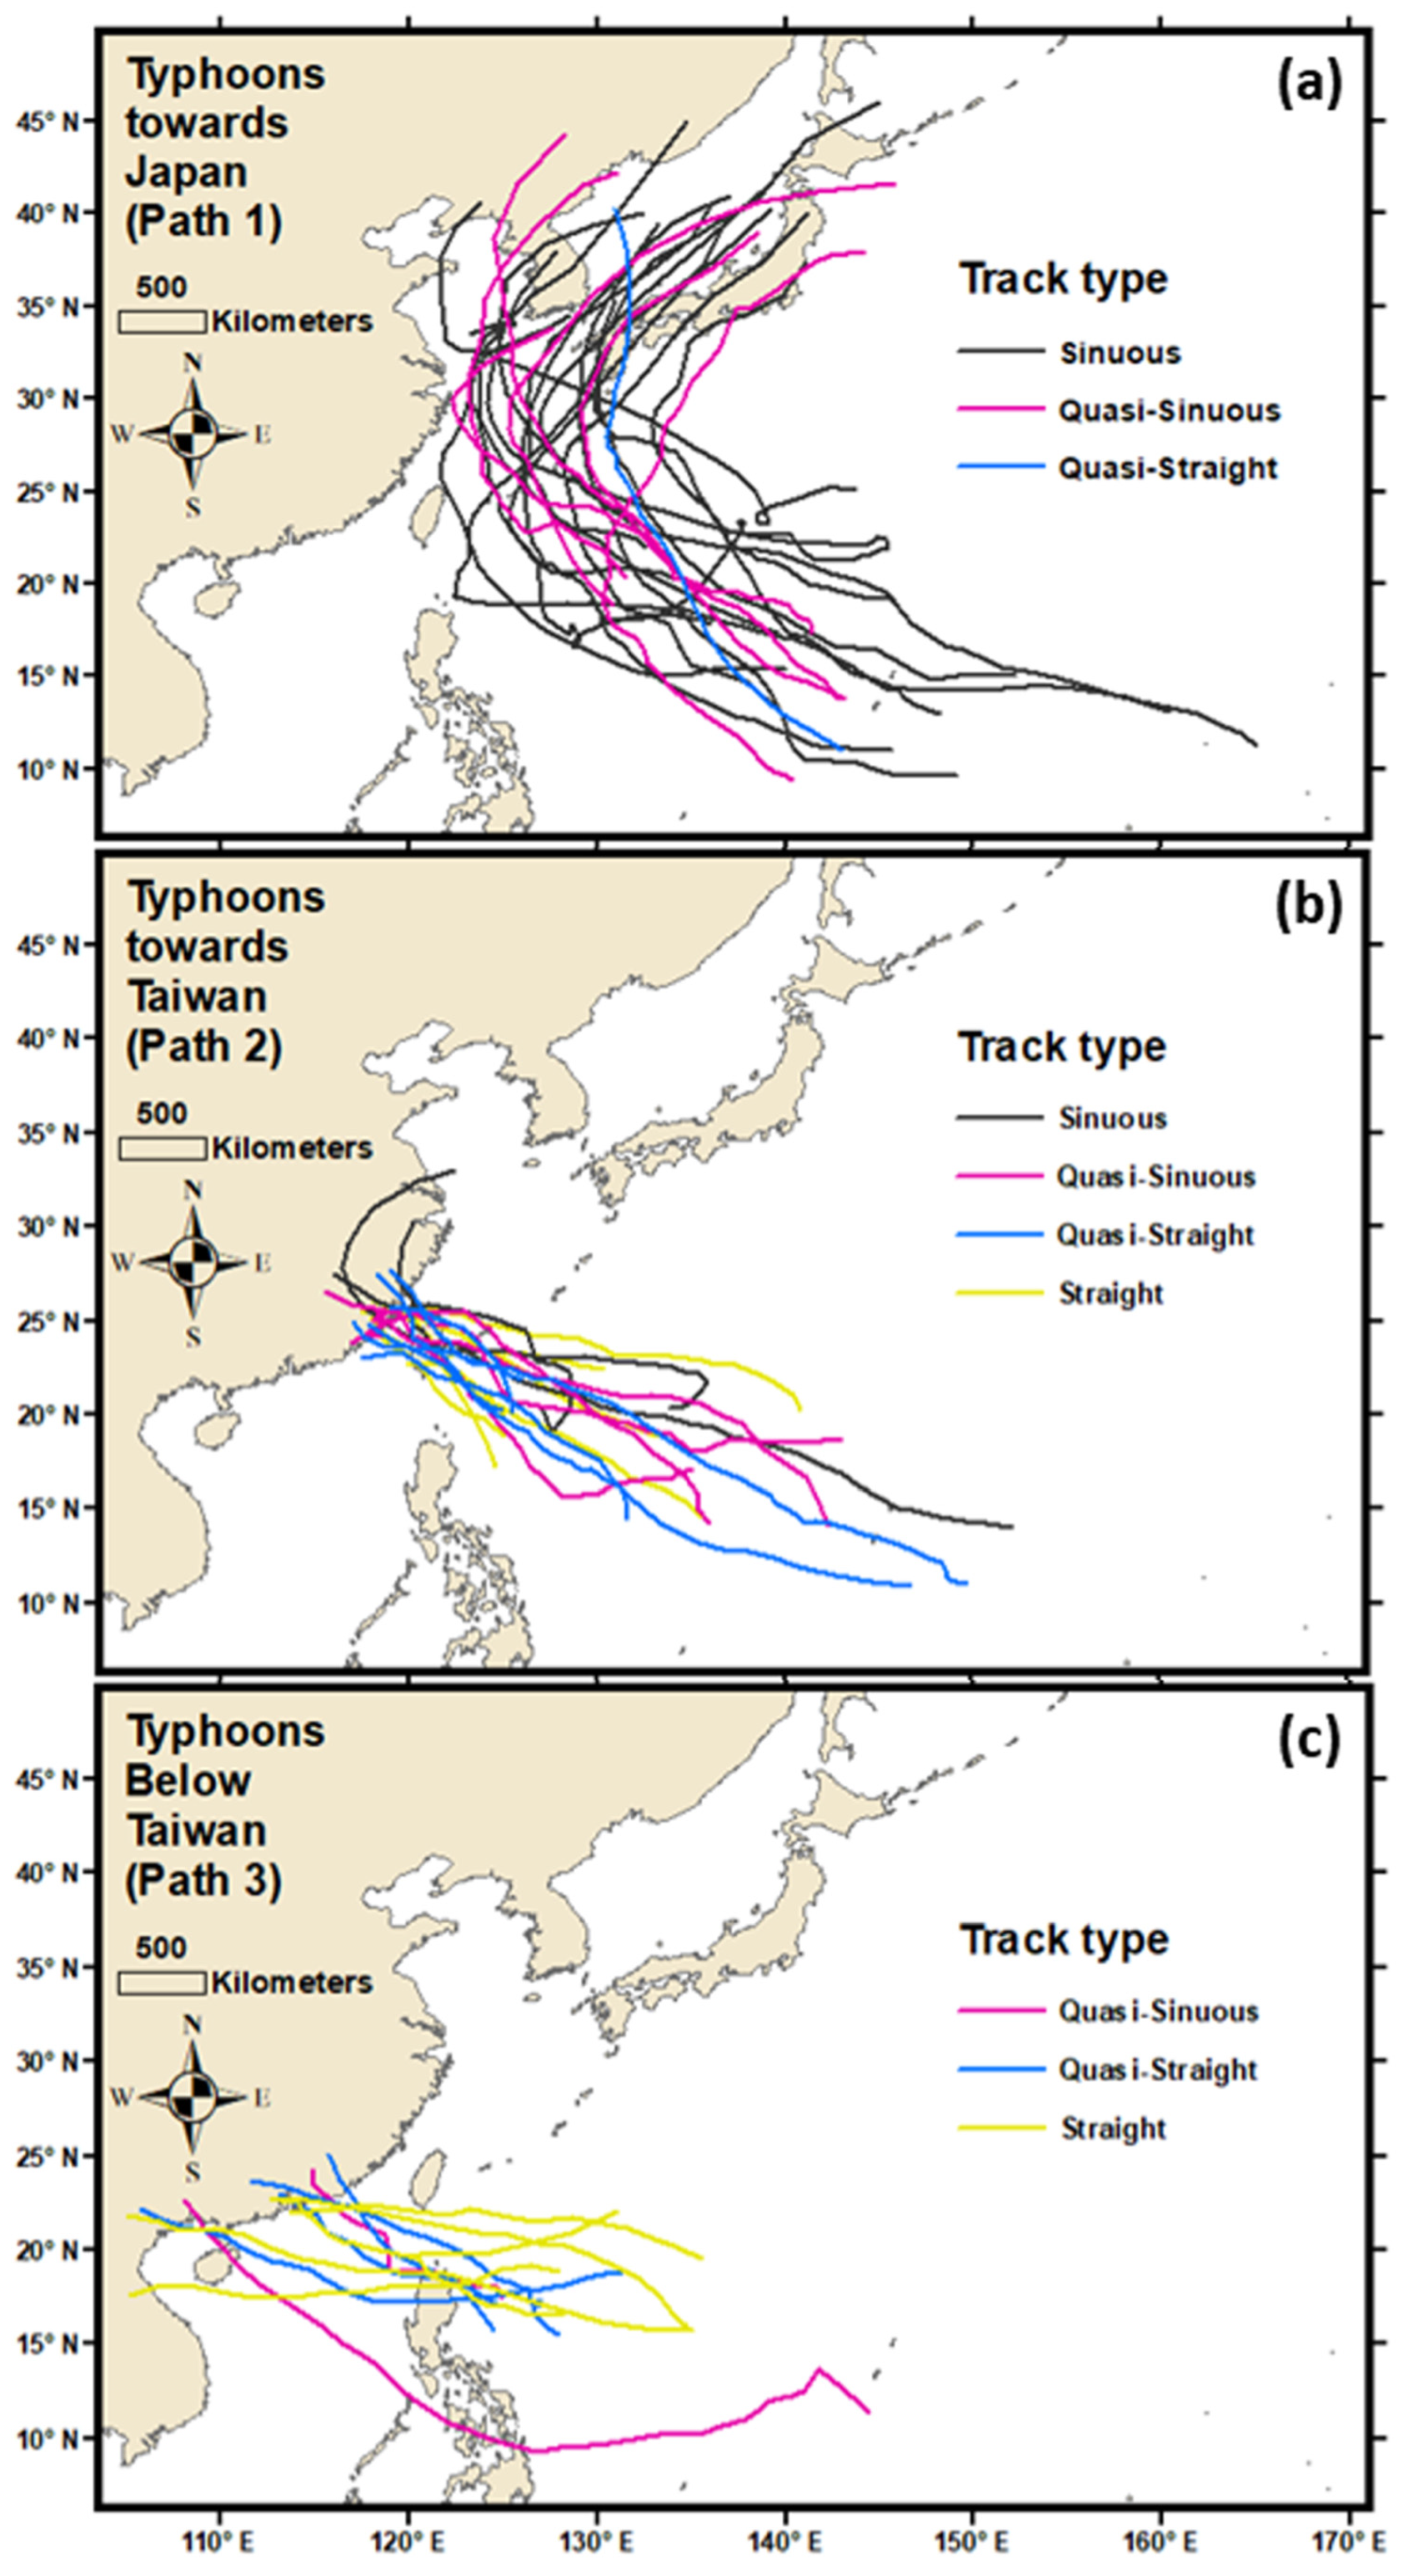
2.4. Technique for Detecting TSs Following Three Different Paths

For detecting TSs that follow the three different ideal paths, the tool named “selection by region” in ArcGIS 10.5 and the ocean boundaries map shape (.shp) file from the International Hydrological Organization are used [7]. All TSs that enter into the ocean region of the South China Sea are detected as TSs following Path 3. Similarly, all TSs entering the land region of Taiwan are detected as TSs following Path 2. All TSs that avoid both of the above conditions, along with carrying higher sinuosity values and entering either the Eastern China Sea or remaining in the North Pacific Ocean, are considered as TSs following Path 1. The rest of the TSs are not considered for analysis.

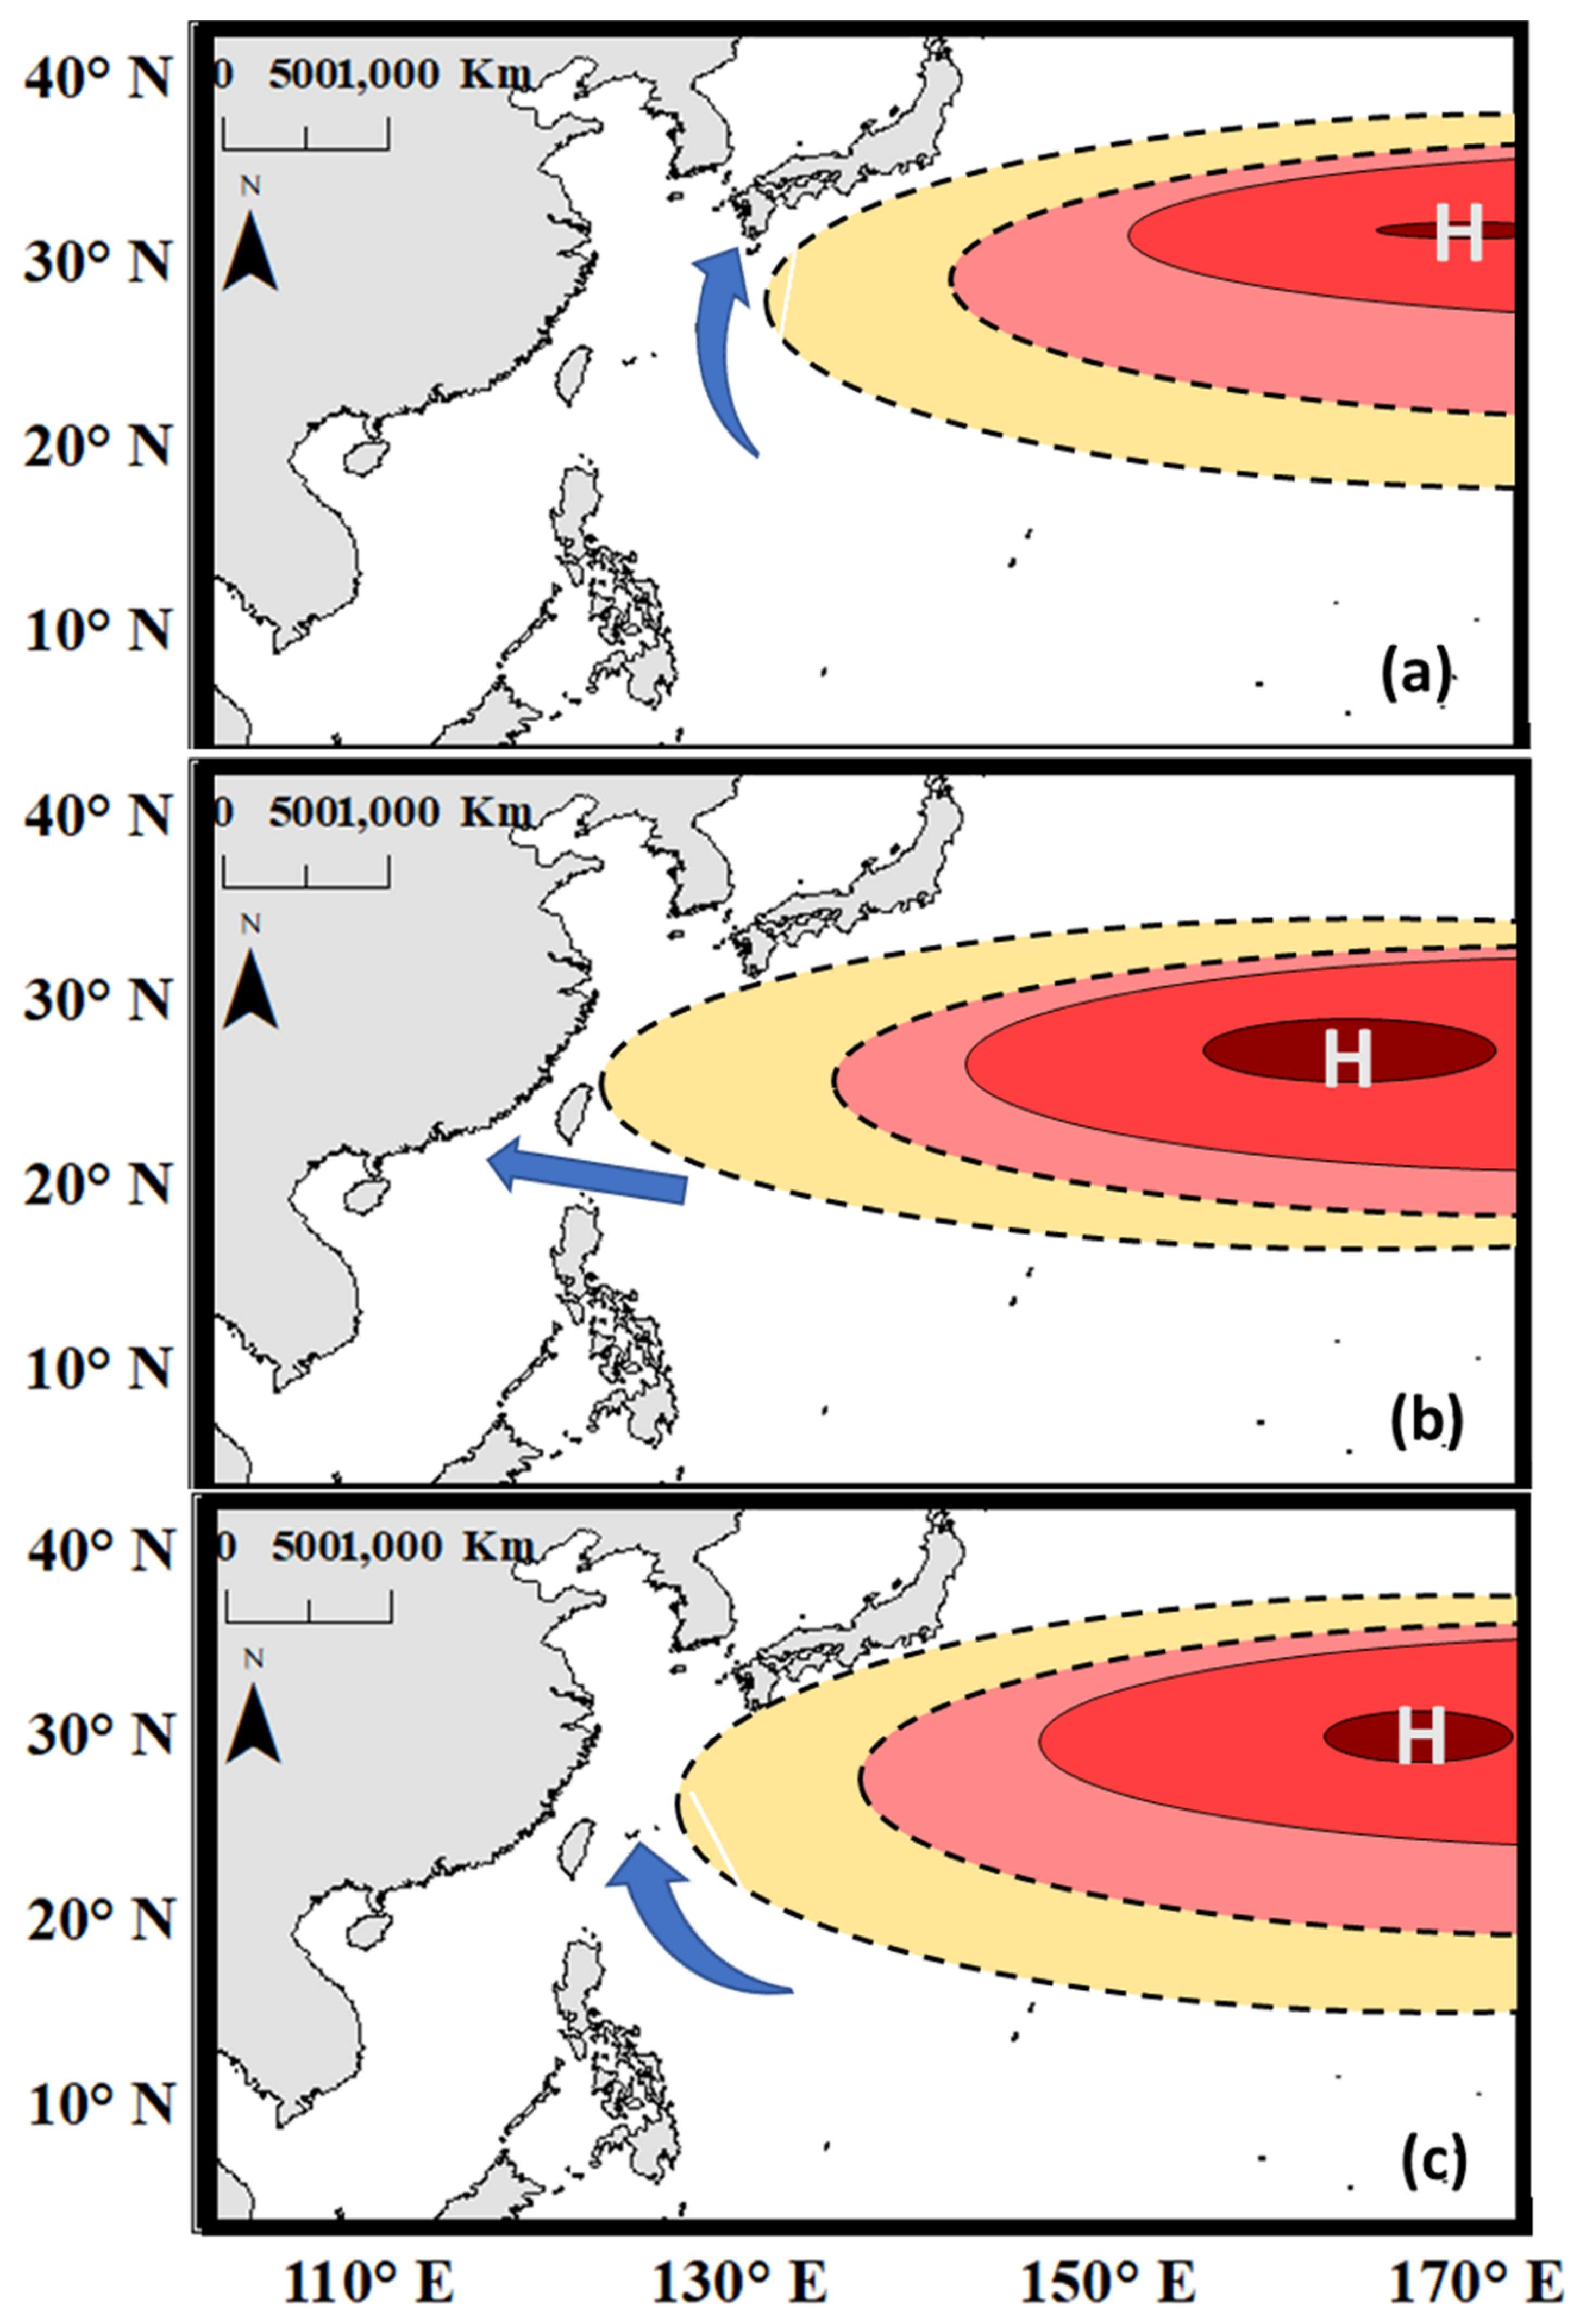
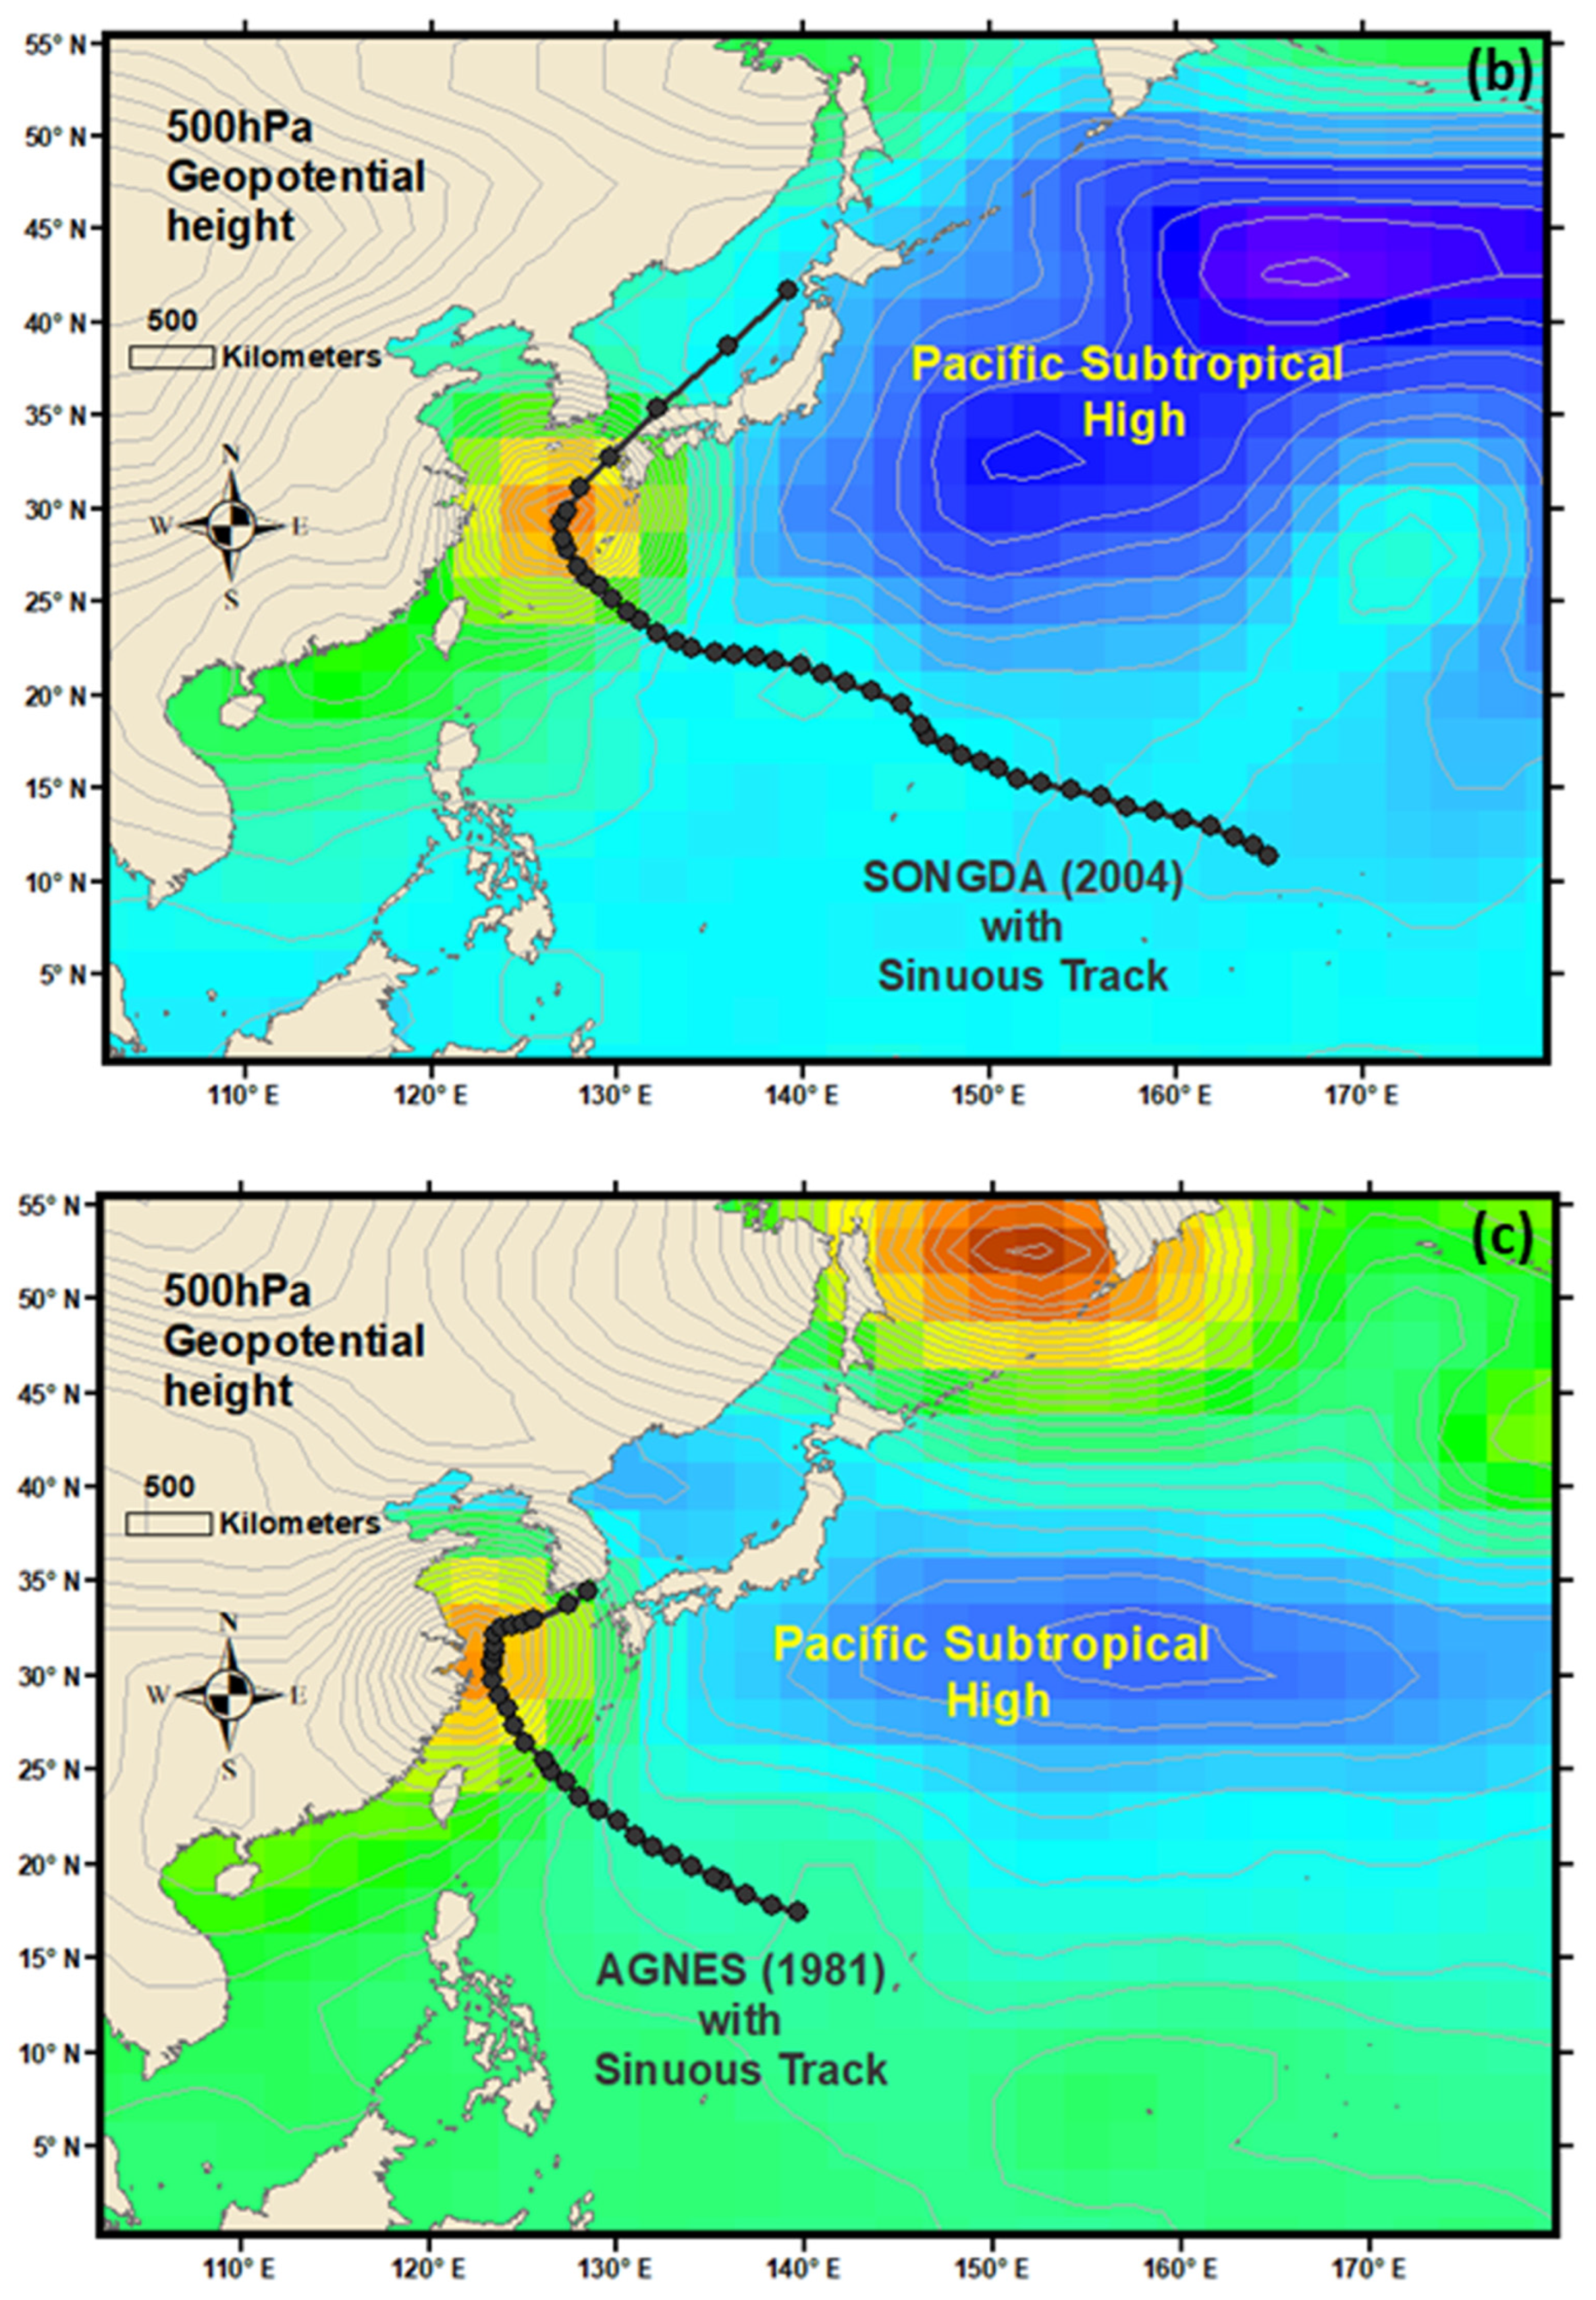
2.5. Detection of the Pacific Subtropical High

A geopotential height of 500 hPa can detect the location of the PSH. A similar technique for identifying the PSH was also used in recent TS-related research in the NWP ocean basin [19,20]. Note here that although the study ensures the presence of a PSH during the entire journey of the chosen TSs, its presence is more inevitable at the time of the turning point of the TSs.

3. Results and Discussion

The North Pacific High is a semi-permanent, subtropical anticyclone located in the northeastern portion of the Pacific Ocean, located northeast of Hawaii and west of California. It is also called the Pacific Subtropical High (PSH). It is strongest during summer in the northern hemisphere and forms over the latitudinal zone between 23°27′ N (the Tropic of Cancer) and the temperate zones (normally referring to latitudes between 35° N), which represents the Pacific subtropics. The PSH later shifts towards the equator during the winter and it tends to be stronger in summer than in winter. An abrupt northward movement of the PSH is typically observed from winter to summer in the NWP. Thus, it can be detected in the north of the NWP ocean basin conventionally during the summer season, especially in June, July, August, and September. The PSH is an important component of the East Asian summer monsoon system. The monsoon’s diabatic heating, land–sea heating, diabatic amplification related to cloud-reduced radiative cooling, and air–sea interaction are a few of the dominant factors that cause the development and maintenance of the PSH. The detection and measurements of the strength of the PSH are also very crucial in understanding whether and when TSs can recurve or turn and which countries will be exposed to damages related to these TSs in the NWP basin. A geopotential height of 500 hPa can detect the location of the PSH. A similar technique for identifying the PSH was also used in recent TS-related research in the NWP ocean basin [19,20].
Environmental factors are vital in providing a particular shape of the track of a TS. The SST patterns changing due to climate change also contribute to it. Despite the above, the position and strength of the PSH play essential roles in deciding the shape of the TSs’ tracks in the NWP ocean basin. Figure 2 shows the approximate ideal position of the PSH in the NWP and indicates the possible TSs’ directions and, thus, the exposed countries.
Figure 2 shows that overall, there are three kinds of possibilities for a TS track based on the position of the PSH.
Path 1: In the case of the PSH’s eastwards retreat, the accompanying steering flow guides TSs to make an early recurvature toward Japan and Republic of Korea.
Path 2: In cases where the PSH lies in the middle zone between east and west, the steering flow guides TSs towards Taiwan and nearby areas, as shown in Figure 2b.
Path 3: Finally, if the PSH’s extension is to the west, the steering flow on the south transfers TSs moving westward to the South China Sea.
Figure 2 reveals that the ridge formed due to the extension of the PSH works like a barrier to block out TSs from passing through. Thus, TSs must avoid the PSH in the NWP, as shown in Figure 2. In this scenario, the countries that are covered under the PSH can potentially possess stable and hot summer weather conditions, which means that TSs cannot reach these countries in the summer.
The shape of tracks of many TSs in this research can potentially be influenced by the position and strength of the PSH, and the detection of the PSH for each of these is not feasible for the current study as it is typically situated at the north of the NWP during the summer season, especially during June to September. Thus, a one-month period (August) can be used in several TS cases with different track sinuosity values to investigate the impact of the PSH on the shape of tracks of TSs in the NWP. August is the month with the highest TS frequency (46.9%) in the boreal summer season. Among the 959 TSs during 1977–2016, 188 TSs (45 with straight tracks, 50 with quasi-straight tracks, 48 with quasi-sinuous tracks, and 45 with sinuous tracks) formed during August, with an overall range of track sinuosity values of 1 to 4.44 and an overall range of track sinuosity index values of 0 to 15. 09. Based on the similarity with the three possible paths of TSs in the presence of the PSH in the NWP, a total of 66 TSs (13 with straight tracks, 23 with quasi-straight tracks, 11 with quasi-sinuous tracks, and 19 with sinuous tracks) are selected automatically. Please refer to Section 2.4—Technique of Detecting TSs Following Three Different Paths—for information about the automatic method involved for this purpose. The overall range of the track sinuosity values is 1 to 2.68 and the overall range of the track sinuosity index is 1.61 to 11.90. Among 66 TSs, 11 TSs are observed moving a little northwards (above) of Taiwan (vicinity of Taiwan), 20 TSs are observed moving directly towards Taiwan, 12 TSs are observed moving southwards (below) of Taiwan (towards the South China Sea), and 23 TSs are observed moving towards Japan, creating a recurvature (turn) in the NWP ocean basin. Thus, 55 TSs are detected as clearly following the three possible ideal paths, along with not having other dominant factors except for the presence of the PSH in the basin. Figure 3 shows all 55 TSs divided into three paths.
Figure 3 reveals that among 55 TSs under study, the majority of TSs (41.8%, 23) moved towards Japan, following Path 1, in which most of the TSs possessed sinuous and quasi-sinuous tracks, with a prevalence of 69.6% and 26.1%, respectively. In addition, the second-highest number of TSs (36.4%, 20) moved towards Taiwan following Path 2, and most (70%, seven straight and seven quasi-straight) of them were straighter TSs. Moreover, the lowest frequency of TSs (21.8%, 12) moved towards below the Taiwan zone, following Path 3, in which again the majority (83.3%, six straight and four quasi-straight) had straighter tracks. For detecting the PSH, we first know the day and time when the TSs turned or were prone to make a turn (the middle point in the case of perfectly straight tracks), which is shown below in Table 1.
Table 1 reveals that in all 55 TSs, 19 are following the sinuous track with a sinuosity value range of 1.35 to 2.68 and an SI range of 7.03 to 11.9, in which most of them (16) are moving toward Japan, 13 are following a straight track with a sinuosity value range of 1 to 1.03 and an SI range of 1.61 to 3.14, almost equally moving towards the Taiwan and below Taiwan regions. A total of 12 are following quasi-straight tracks with a sinuosity value range of 1.04 to 21.11 and an SI range of 3.44 to 4.81, mostly moving towards the Taiwan and below Taiwan regions, and 11 are following quasi-sinuous tracks with a sinuosity value range of 1.13 to 1.33 and an SI range of 5 to 6.89, in which the majority are moving towards Japan. The detection and investigation of the PSH for each of the 55 TSs were performed at the turning time of each individual TS. A few TS cases from Path 1 are plotted below in Figure 4.
Figure 4 shows that when the PSH is situated more easterly (Figure 4a), the TSs are more prone to make steep curves (sinuous tracks) and hit Japan. Steepness reduces along with the chance of directly hitting Japan (Figure 4b,c) with the westward movement of the PSH. Similar scenarios are validated with all 23 TSs (calculated separately for each case) following Path 1. A few TS cases from Path 2 are plotted below in Figure 5.
Figure 5 reveals that straighter tracks are mostly reaching Taiwan following Path 2 when the extent and position of the PSH is up to the middle of the east and west, which acts as a ridge and then does not allow TSs to take a curve towards Japan. Similar scenarios are validated with all 20 TSs (calculated separately for each case) following Path 2. A few TS cases from Path 3 are plotted below in Figure 6.
Figure 6 shows that when the PSH is covering Japan and moving towards the west, as in Figure 6a, the TSs are suppressed towards regions below Taiwan, following Path 3. It is also found that both the westwards movement and the southwards movement (Figure 6c) suppress TSs further towards regions below Taiwan, following Path 3. Thus, these TSs are prone to form straight to quasi-straight paths. Similar scenarios are validated with all 12 TSs (calculated separately for each case) following Path 3.
Overall, we tried to check the variation in track sinuosity with the position of the PSH in the NWP and how it is affecting the paths in the basin. With 55 TS cases, we found that where there are no other dominating factors, the eastward position of the PSH creates more sinuous tracks, bringing TSs towards Japan. The eastward position of the PSH creates more straight tracks, bringing TSs toward the South China Sea to regions below Taiwan. The middle position brings TSs toward Taiwan. However, a more detailed investigation is needed in the future for better results. This information is crucial for the investigation of TS track shapes in the NWP.

4. Conclusions

The present study validates the critical role of the position of the Pacific Subtropical High (PSH) in modulating the trajectories of tropical storms (TSs) in the Northwestern Pacific (NWP) during August. Analysis of 55 TS cases demonstrates that the position of the PSH significantly influences track sinuosity. When the PSH is positioned eastward, TS tracks exhibit high sinuosity, predominantly steering storms toward Japan. A westward PSH position results in relatively straight tracks, directing TSs toward the South China Sea, south of Taiwan. In contrast, a mid-positioned PSH tends to guide TSs toward Taiwan. These findings underscore the pivotal role of the PSH in determining TS trajectories in the NWP. While further detailed investigations are required, these insights are crucial for advancing the understanding of TS behavior and enhancing disaster preparedness in the region. Incorporating real-time PSH positioning and intensity into atmospheric models may contribute to improving the real-time forecasting of TS tracks within the basin. However, determining the most appropriate method for integrating this information into such models lies beyond the scope of the present study.
Similar to the PSH, the Mascarene High is a semi-permanent subtropical high-pressure system in the Indian Ocean, typically forming near the Mascarene Islands around 30 degrees south latitude, especially during the austral winter [26]. It plays a key role in influencing weather and climate over Southern Africa [27] and affects TS tracks by generating cyclonic vorticity from East African outflows [28]. Additionally, low-level clouds impact its strength and position, further influencing storm behavior [29]. Hence, subtropical highs in different ocean basins can impact the TSs’ tracks and strengths, making these kinds of research crucial.
Moreover, in light of the increasing intensity of tropical storms (TSs) in the Northwestern Pacific (NWP) due to climate change, and the resulting heightened risk of damage to human populations and infrastructure, research of this nature is essential for understanding the potential trajectories of TSs under varying environmental conditions [1,2,3,4,5,6,7,8].

Funding

This research received no external funding.

Institutional Review Board Statement

Not applicable.

Informed Consent Statement

Not applicable.

Data Availability Statement

All sorted TS data used in the current paper are available in the Mendeley online repository for free use by researchers worldwide with proper citation. The online repository’s name is “Refined and Improved Tropical Storm 6-hourly data and track Sinuosity measurements for the North West Pacific basin during 1977–2016” with link doi: 10.17632/3927f6gm72.1.

Acknowledgments

The author acknowledges the data provider. The author thanks the National Oceanic and Atmospheric Administration (NOAA) and the Regional Specialized Meteorological Center (RSMC) of the Japan Meteorological Agency (JMA) for providing TS data through the International Best Track Archive for Climate Stewardship (IBTrACS). The author also acknowledges both anonymous reviewers for their valuable time and constructive comments.

Conflicts of Interest

The author declares no conflicts of interest.

Abbreviations

The following abbreviations are used in this manuscript:
TSTropical Storm
PSHPacific subtropical high
NWPNorthwest Pacific
SISinuosity Index
IBTrACSInternational Best Track Archive for Climate Stewardship
SCSSouth China Sea
BoBBay of Bengal
NOAANational Oceanic and Atmospheric Administration
STYSuper typhoon
RSMCRegional Specialized Meteorological Center
JMAJapan Meteorological Agency
AORArea of Responsibility

References

  1. IPCC. Contribution of Working Group I to the Sixth Assessment Report of the Intergovernmental Panel on Climate Change. In Climate Change 2021: The Physical Science Basis; Masson-Delmotte, V., Zhai, P., Pirani, A., Connors, S.L., Péan, C., Berger, S., Caud, N., Chen, Y., Goldfarb, L., Gomis, M.I., et al., Eds.; Cambridge University Press: Cambridge, UK; New York, NY, USA, 2021. [Google Scholar] [CrossRef]
  2. IPCC. Climate Change 2007—The Physical Science Basis: Contribution of Working Group I to the Fourth Assessment Report of the IPCC; Cambridge University Press: Cambridge, UK, 2007; p. 996. Available online: https://www.ipcc.ch/pdf/assessment-report/ar4/wg2/ar4_wg2_full_report.pdf (accessed on 26 October 2018).
  3. NOAA. Hurricane Research Division Report. Available online: http://www.aoml.noaa.gov/hrd/tcfaq/E25.html (accessed on 26 October 2018).
  4. Pandey, R.S.; Liou, Y.A. Decadal Behaviors of Tropical Storm Tracks in the Northwest Pacific Ocean. Atmos. Res. 2020, 246, 105143. [Google Scholar] [CrossRef]
  5. Pandey, R.S. Statistical analysis of environmental parameters on the occurrences of tropical cyclones and earthquakes: An example from West North Pacific region. Mar. Geophys. Res. 2022, 43, 44. [Google Scholar] [CrossRef]
  6. Pandey, R.S.; Liou, Y.A. Yearly, 5-Yearly, and Decadal Sea Surface Temperature (SST) and SST Anomaly (SSTA) Data Averaged over the Whole Typhoon Season (May–November) over the Entire Global Ocean, North Pacific Ocean, Philippine Sea, South China Sea, and Eastern China Sea; Mendeley Data V1; National Central University Center for Space and Remote Sensing Research: Taoyuan, Taiwan, 2020. [Google Scholar] [CrossRef]
  7. Pandey, R.S.; Liou, Y.A. Typhoon Strength Rising in the Past Four Decades. Weather Clim. Extrem. 2022, 36, 100446. [Google Scholar] [CrossRef]
  8. Hornyak, T. Typhoons Getting Stronger, Making Landfall More Often. Eos 2020, 101. [Google Scholar] [CrossRef]
  9. Pandey, R.S.; Liou, Y.A.; Liu, J.C. Season-Dependent Variability and Influential Environmental Factors of Super-Typhoons in the Northwest Pacific Basin During 2013–2017. Weather Clim. Extrem. 2021, 31, 100307. [Google Scholar] [CrossRef]
  10. Kornei, K. Storms Interact but Rarely Merge into Bigger Tempests. Eos 2020, 101. [Google Scholar] [CrossRef]
  11. Sangomla, A. Perfect Storm: What Is the Fujiwhara Effect? Down to Earth. Available online: https://www.downtoearth.org.in/news/world/perfect-storm-what-is-the-fujiwhara-effect--85337 (accessed on 28 November 2022).
  12. Liou, Y.A.; Pandey, R.S. Interactions Between Typhoons Parma and Melor (2009) in Northwest Pacific Ocean. Weather Clim. Extrem. 2020, 29, 100272. [Google Scholar] [CrossRef]
  13. Pandey, R.S. A Comparative Analysis of a Global and a Regional Model on the tropical cyclone track forecast. Nat. Hazards 2024. [Google Scholar] [CrossRef]
  14. Terry, J.P.; Gienko, G. Developing a New Sinuosity Index for Cyclone Tracks in the Tropical South Pacific. Nat. Hazards 2011, 59, 1161–1174. [Google Scholar] [CrossRef]
  15. Nakazawa, T.; Rajendran, K. Relationship Between Tropospheric Circulation over the Western North Pacific and Tropical Cyclone Approach/Landfall on Japan. J. Meteorol. Soc. Jpn. 2007, 85, 101–114. [Google Scholar] [CrossRef]
  16. Wang, C.; Liu, H.; Lee, S.K.; Atlas, R. Impact of the Atlantic Warm Pool on United States Landfalling Hurricanes. Geophys. Res. Lett. 2011, 38, L19702. [Google Scholar] [CrossRef]
  17. Knaff, J.A. Revisiting the Maximum Intensity of Recurving Tropical Cyclones. Int. J. Climatol. 2009, 29, 827–837. [Google Scholar] [CrossRef]
  18. Wu, L.; Wang, B. Assessing Impacts of Global Warming on Tropical Cyclone Tracks. J. Clim. 2004, 17, 1686–1698. [Google Scholar] [CrossRef]
  19. Hong, C.C.; Lee, M.Y.; Hsu, H.H.; Lin, N.H.; Tsuang, B.J. Tropical SST Forcing on the Anomalous WNP Subtropical High During July–August 2010 and the Record-High SST in the Tropical Atlantic. Clim. Dyn. 2015, 45, 633–650. [Google Scholar] [CrossRef]
  20. Hung, C.W.; Shih, M.F.; Lin, T.Y. The Climatological Analysis of Typhoon Tracks, Steering Flow, and the Pacific Subtropical High in the Vicinity of Taiwan and the Western North Pacific. Atmosphere 2020, 11, 543. [Google Scholar] [CrossRef]
  21. Song, J.J.; Wang, Y.; Wu, L. Trend Discrepancies Among Three Best Track Data Sets of Western North Pacific Tropical Cyclones. J. Geophys. Res. 2010, 115, D12128. [Google Scholar] [CrossRef]
  22. Schreck, C.J.; Knapp, K.R.; Kossin, J.P. The Impact of Best Track Discrepancies on Global Tropical Cyclone Climatologies Using IBTrACS. Mon. Weather Rev. 2014, 142, 3881–3899. [Google Scholar] [CrossRef]
  23. Dvorak, V.F. A Technique for the Analysis and Forecasting of Tropical Cyclone Intensities from Satellite Pictures. NOAA Tech. Memo. NESS 1972, 36, 15. [Google Scholar]
  24. Dvorak, V.F. A Technique for the Analysis and Forecasting of Tropical Cyclone Intensities from Satellite Pictures. NOAA Tech. Memo. NESS 1973, 45, 19. [Google Scholar]
  25. Vincenty, T. Direct and Inverse Solutions of Geodesics on the Ellipsoid with Application of Nested Equations. Surv. Rev. 1975, 22, 88–93. [Google Scholar] [CrossRef]
  26. Morioka, Y.; Yamagata, T.; Behera, S.K. Structure and Maintenance Mechanisms of the Mascarene High in Austral Winter. Int. J. Climatol. 2021, 41, 1–15. [Google Scholar]
  27. Xulu, N.G.; Chikoore, H.; Bopape, M.-J.M.; Nethengwe, N.S. Climatology of the Mascarene High and Its Influence on Weather and Climate over Southern Africa. Climate 2020, 8, 86. [Google Scholar] [CrossRef]
  28. Jury, M.R. Climate-Weather Interactions Modulating Tropical Cyclones over the Mascarene Islands 2000–2024. Meteorol. Atmos. Phys. 2025, 137, 14. [Google Scholar] [CrossRef]
  29. Miyamoto, A.; Nakamura, H.; Miyasaka, T.; Kosaka, Y. Wintertime Weakening of Low-Cloud Impacts on the Subtropical High in the South Indian Ocean. J. Clim. 2022, 35, 323–334. [Google Scholar] [CrossRef]
Figure 1. (a) Area of responsibility of the RSMC—Tokyo (Highlighted box in orange), and its region for the cyclogenesis of TSs (Highlighted box in dashed-black). (b) Flow chart of all steps involved in data sorting and improvement of the IBTrACS dataset.
Atmosphere 16 00322 g001
Figure 2. Approximate ideal position of the PSH and corresponding TS routes. The PSH can (a) retreat eastward; (b) further extend to the west; or (c) lie in areas between the above two scenarios. The arrows indicate different TS routes as per the approximate position of the PSH margin.
Atmosphere 16 00322 g002
Figure 3. Ideal three possible paths of all 55 TSs suitable for detecting the existence of the PSH towards the (a) west, (b) the middle zone between the east and west, and (c) the east.
Atmosphere 16 00322 g003
Figure 4. Geopotential height of 500 hPa and the detected PSH for TSs following Path 1 toward Japan. (a) Etau, 2003; (b) Songda, 2004; and (c) Agnes, 1981.
Atmosphere 16 00322 g004aAtmosphere 16 00322 g004b
Figure 5. Geopotential height of 500 hPa and the detected PSH for TSs following Path 2 toward Taiwan. (a) Bilis, 2000; (b) Omar, 1992; (c) Norris, 1980; and (d) Nelson, 1985.
Atmosphere 16 00322 g005aAtmosphere 16 00322 g005b
Figure 6. Geopotential height of 500 hPa and the detected PSH for TSs following Path 3 toward the region below Taiwan. (a) Krovanh, 2003; (b) Pabuk, 2007; and (c) Nuri, 2008.
Atmosphere 16 00322 g006aAtmosphere 16 00322 g006b
Table 1. Path nature, track type, and Turning day and time of all 55 TSs.
YearTS NameTrack TypeTurning Day/TimePathSinuosity ValueSinuosity Index
1979IRVINGSn15-08-79 18:00Towards Japan (Path 1)1.538.11
1979JUDYQSn22-08-79 6:00Towards Japan (Path 1)1.336.91
1980NORRISSt27-08-80 0:00Towards Taiwan (Path 2)1.012.01
1981AGNESSn1/9/1981 0:00Towards Japan (Path 1)1.397.32
1982DOTQSt12/8/1982 6:00Towards Taiwan (Path 2)1.043.44
1982ELLISQSt23-08-82 6:00Towards Japan (Path 1)1.094.43
1983ABBYQSn10/8/1983 0:00Towards Japan (Path 1)1.336.9
1983CARMENSt14-08-83 12:00Towards Below Taiwan (Path 3)1.022.62
1984FREDAQSt7/8/1984 0:00Towards Taiwan (Path 2)1.043.46
1984HOLLYSn20-08-84 0:00Towards Japan (Path 1)1.357.03
1984IKEQSn31-08-84 12:00Towards Below Taiwan (Path 3)1.165.47
1984JUNEQSn28-08-84 12:00Towards Below Taiwan (Path 3)1.155.29
1985NELSONSt21-08-85 18:00Towards Taiwan (Path 2)1.033.23
1986VERASn27-08-86 6:00Towards Japan (Path 1)2.6811.9
1987DINAHSn29-08-87 12:00Towards Japan (Path 1)1.377.18
1990BECKYSt25-08-90 6:00Towards Below Taiwan (Path 3)1.022.65
1990YANCYQSn17-08-90 12:00Towards Taiwan (Path 2)1.256.29
1992JANISQSn7/8/1992 12:00Towards Japan (Path 1)1.336.89
1992OMARQSt2/9/1992 0:00Towards Taiwan (Path 2)1.053.63
1992POLLYQSt28-08-92 0:00Towards Taiwan (Path 2)1.053.62
1993ROBYNSn9/8/1993 6:00Towards Japan (Path 1)1.367.11
1993YANCYSn1/9/1993 12:00Towards Japan (Path 1)1.497.9
1994CAITLINQSt2/8/1994 18:00Towards Taiwan (Path 2)1.043.47
1994DOUGSn8/8/1994 6:00Towards Japan (Path 1)1.477.75
1994ELLIESn15-08-94 18:00Towards Japan (Path 1)1.437.53
1995KENTQSt29-08-95 6:00Towards Below Taiwan (Path 3)1.114.81
1997AMBERQSt28-08-97 0:00Towards Taiwan (Path 2)1.074.03
1998OTTOSt3/8/1998 6:00Towards Taiwan (Path 2)1.032.94
1999SAMQSt20-08-99 0:00Towards Below Taiwan (Path 3)1.053.64
2000BILISSt21-08-00 12:00Towards Taiwan (Path 2)1.012.38
2000PRAPIROONQSn27-08-00 6:00Towards Japan (Path 1)1.316.74
2001PABUKSn20-08-01 0:00Towards Japan (Path 1)1.538.1
2003DUJUANSt31-08-03 18:00Towards Below Taiwan (Path 3)1.032.93
2003ETAUSn7/8/2003 0:00Towards Japan (Path 1)1.357.08
2003KROVANHQSt21-08-03 18:00Towards Below Taiwan (Path 3)1.053.79
2003MORAKOTSt2/8/2003 18:00Towards Taiwan (Path 2)1.022.85
2004AEREQSn23-08-04 12:00Towards Taiwan (Path 2)1.135
2004CHABASn29-08-04 18:00Towards Japan (Path 1)1.538.11
2004MEGIQSn18-08-04 0:00Towards Japan (Path 1)1.286.54
2004SONGDASn6/9/2004 6:00Towards Japan (Path 1)1.538.11
2005NABISn6/9/2005 0:00Towards Japan (Path 1)1.568.22
2005SANVUQSt11/8/200512:00Towards Below Taiwan (Path 3)1.053.72
2005TALIMQSt28-08-05 18:00Towards Taiwan (Path 2)1.063.83
2006BOPHASt8/8/2006 12:00Towards Taiwan (Path 2)1.022.69
2007PABUKSt6/8/2007 18:00Towards Below Taiwan (Path 3)1.022.48
2007SEPATQSn15-08-07 0:00Towards Taiwan (Path 2)1.165.47
2007WUTIPSt8/8/2007 6:00Towards Taiwan (Path 2)11.61
2008NURISt19-08-08 6:00Towards Below Taiwan (Path 3)1.033.24
2009MORAKOTSn7/8/2009 6:00Towards Taiwan (Path 2)1.517.97
2010KOMPASUSn1/9/2010 6:00Towards Japan (Path 1)1.357.07
2012BOLAVENQSn25-08-12 0:00Towards Japan (Path 1)1.236.1
2012KAI-TAKSt14-08-12 0:00Towards Below Taiwan (Path 3)1.022.81
2013TRAMISn20-08-13 18:00Towards Taiwan (Path 2)1.467.72
2015GONISn21-08-15 12:00Towards Japan (Path 1)1.638.59
2015SOUDELORSn6/8/2015 0:00Towards Taiwan (Path 2)1.377.18
Disclaimer/Publisher’s Note: The statements, opinions and data contained in all publications are solely those of the individual author(s) and contributor(s) and not of MDPI and/or the editor(s). MDPI and/or the editor(s) disclaim responsibility for any injury to people or property resulting from any ideas, methods, instructions or products referred to in the content.

