Article

Temporal Dynamics and Long-Term Trends in Aerosol Optical Properties over Two Sites of Indo Gangetic Plains (IGP): Insights from AERONET Observations

1
Amity Centre for Ocean Atmospheric Science and Technology (ACOAST), Amity University Haryana, Gurugram 122413, Haryana, India
2
Amity Centre for Air Pollution Control (ACAPC), Amity University Haryana, Gurugram 122413, Haryana, India
3
Space System Engineering, Delft University of Technology, Kluyverweg 1, 2629HS Delft, The Netherlands
*
Authors to whom correspondence should be addressed.
Atmosphere 2025, 16(3), 321; https://doi.org/10.3390/atmos16030321
Submission received: 8 February 2025 / Revised: 5 March 2025 / Accepted: 7 March 2025 / Published: 11 March 2025
(This article belongs to the Section Aerosols)

Abstract

:
This study presents the longest time series of aerosol optical properties and Precipitable Water Vapor (PW) from two AERONET sites in the Indo-Gangetic Plains (IGP). Analyzing 22 years of data (2001–2022) from Kanpur and 16 years (2007–2023) from Gandhi College, the study focuses on Aerosol Optical Depth (AOD), Ångström Exponent (α), Single Scattering Albedo (SSA), and Precipitable Water Vapor (PW). Significant variability in aerosol properties is observed across monthly, seasonal, and annual scales. The highest mean AOD500 values, coupled with higher α440–870 during post-monsoon and winter, indicate the dominance of fine-mode aerosols. A decrease in SSA with wavelength during these seasons further highlights the absorbing nature of these fine-mode aerosols, driven by fossil fuels and biomass burning. In contrast, summer and pre-monsoon have relatively lower mean AOD500, lowest α440–870, and increased SSA with wavelength, suggesting the dominance of coarse-mode scattering dust aerosols. PW exhibits a seasonal cycle, reaching its peak during the monsoon due to moisture transport from the Arabian Sea and Bay of Bengal, then decreasing post-monsoon as drier conditions prevail. Long-term annual trends reveal increasing aerosol concentrations, with AOD500 rising by 18% at Kanpur and 29% at Gandhi College, suggesting faster aerosol loading at the latter. Sub-period analysis indicates a slowdown in AOD500 increase during 2012–2023 at Kanpur, indicating potential stabilization post-industrialization, while Gandhi College’s more pronounced AOD500 and α440–870 increase underscores the growing impact of fine aerosols in rural IGP areas. Kanpur shows a sustained SSA increase, though at a slower rate in recent years, indicating dominant scattering aerosols. In contrast, Gandhi College has transitioned from moderate SSA increases to declines at longer wavelengths, suggesting enhanced fine-mode absorbing aerosols. At Gandhi College, the decline in PW reduces atmospheric moisture, limiting wet scavenging and likely contributing to the rise in fine-mode aerosols, especially during the monsoon and post-monsoon seasons. Our findings highlight the evolving aerosol sources in the IGP, with Kanpur stabilizing and rural areas like Gandhi College seeing continued increases in pollution.

1. Introduction

Aerosols refer to the small colloidal particles existing in the atmosphere, characterized by diverse chemical compositions, and dispersed or incorporated within gases, smoke, or mist. Produced by natural and human activities, aerosols significantly impact global and regional climate change by directly interacting with solar radiation and indirectly altering cloud microphysics and hydrological cycle [1,2,3]. They also affect the health of humans, animals, and plants by degrading the environment and air quality [4]. The consequences of aerosols released into the atmosphere are not confined to local areas, as they can travel over long distances, affecting regions far from their origins [5,6,7]. Consequently, addressing aerosol pollution requires understanding its optical properties, identifying source regions, and monitoring spatial and temporal variations on a local, regional, and global scale.
Over recent decades, ground-based monitoring systems and satellite platforms have effectively investigated the temporal and spatial characteristics of aerosols on regional and global scales [8,9,10,11,12,13,14]. Satellite remote sensing provides continuous aerosol monitoring and enables rapid, global-scale data collection. However, retrieval accuracy over land is influenced by surface reflectance, which is accounted for in aerosol retrieval algorithms through techniques such as multi-angle and spectro-polarimetric retrievals [15,16,17,18,19]. On the other hand, ground-based remote sensing networks, for example, AERONET (Aerosol Robotic Network), SKYNET (Sky Radiometer Network), and SONET (Sun–Sky Radiometer Observation Network) [20,21,22,23] are effective in characterizing aerosol optical and microphysical properties [24]. While spatially confined, these networks are not hindered by surface reflectance limitations, making them more accurate than satellite observations. AERONET is an important ground-based aerosol observation network with more than 800 sites across the world encompassing different land use types, including urban and rural areas, forests, deserts, and mountains [25,26,27,28]. Researchers around the world have utilized AERONET datasets in multiple studies to understand the spatiotemporal characteristics of aerosols, including their categorization based on type, particle size distribution, albedo, and absorption properties [29,30,31].
India has seen a rising trend in population, urbanization, and industrialization, leading to a significant increase in atmospheric aerosol concentrations in recent decades [32,33,34]. The Indian subcontinent, particularly the Indo–Gangetic Plains (IGP) in northern India, is widely recognized as a global hotspot for high aerosol loading [35,36]. This region, one of the most densely populated agricultural basins, experiences persistently high aerosol levels throughout the year- due to varied emission sources and pronounced seasonal variations [37,38]. The source characteristics of aerosols over the IGP include anthropogenic sources such as vehicular emissions, industries, coal-fired plants, and biomass and domestic biofuel burning [39,40]. Additionally, convection-induced winds can carry desert and alluvial dust aerosols into the atmosphere, particularly during the pre-monsoon/summer season [41,42]. Air quality during the winter and post-monsoon months deteriorates due to the frequent formation of dense fog, haze, and severe smog, which reduces visibility. This is mainly caused by agricultural residue burning, solid waste materials, and fossil fuel use in various sectors [43,44] along with unfavorable meteorological conditions that limit pollution dispersion, posing potential health risks [45]. Numerous studies have documented the properties and characteristics of aerosols and have found an overall increase in aerosol loading based on satellite observations and ground-based AERONET data in the IGP of India [46,47,48]. Kaskaoutis et al. [49] studied the long-term variability and trends of aerosol properties over Kanpur, Northern India, using AERONET data for a relatively longer time from 2001 to 2010. Recently, a long-term change in aerosol loading over the Bihar State of India using 19 years (2001–2019) of high-resolution satellite data was studied [48]. Using satellite-derived aerosol properties, Kumar et al. [38] assessed the long-term aerosol characteristics over a decade (2007–2017) at two locations: Delhi and Lucknow in the IGB. Using AERONET data, Bibi et al. [50] examined the distribution and spectral behavior of the optical properties of atmospheric aerosols at four locations in the IGP. While numerous studies over the IGP have utilized AERONET and satellite data (such as (Moderate Resolution Imaging Spectroradiometer (MODIS) and Multi-angle Imaging Spectroradiometer (MISR), this study offers the longest term, site-specific assessment of aerosol optical properties and PW, emphasizing local vs transported aerosol contributions at urban-industrial (Kanpur) and semi-rural (Gandhi College) sites. A comprehensive understanding of aerosol particle size, nature (absorbing and/or scattering), composition, and long-term trends is crucial for several reasons. It enhances the accuracy of climate models by improving predictions of aerosol/radiation interactions and aerosol/cloud interactions, which are key factors in climate change. It also aids in identifying the sources and types of aerosols, enabling targeted pollution control measures. Additionally, understanding these characteristics is essential for assessing the impact of aerosols on public health, as different aerosol types have varying effects on air quality and human health.
This study presents the longest time series of aerosol optical properties and PW for two sites in the IGP: Kanpur, a highly industrialized urban area, and Gandhi College, a rural background site. Utilizing AERONET ground truth data, we analyze 22 years of data from Kanpur (2001–2022) and 16 years of data from Gandhi College (2007–2023). The study focuses on key aerosol optical properties, including Aerosol Optical Depth (AOD500), Ångström Exponent (α440–870), Single Scattering Albedo (SSA), and Precipitable Water Vapor (PW). It also incorporates back air mass trajectory analysis to compare aerosol loading and identify potential sources across rural and urban environments.. The analysis delves into both annual and seasonal variations along with long-term trends, providing a comprehensive assessment of how aerosol characteristics vary across time. A significant contribution of this study is its inclusion of recent years not previously analyzed, offering fresh insights into evolving aerosol trends in both rural and urban regions. Of particular note, the results reveal surprisingly high aerosol loading at rural Gandhi College, underscoring a growing environmental concern as rural areas face escalating pollution levels. This highlights the increasing vulnerability of rural regions to the impacts of air pollution, even amidst India’s rapid urbanization. The findings emphasize the urgent need for proactive management and tailored interventions to address the environmental challenges faced by rural areas in the face of broader industrial growth.

2. Methodology and Data
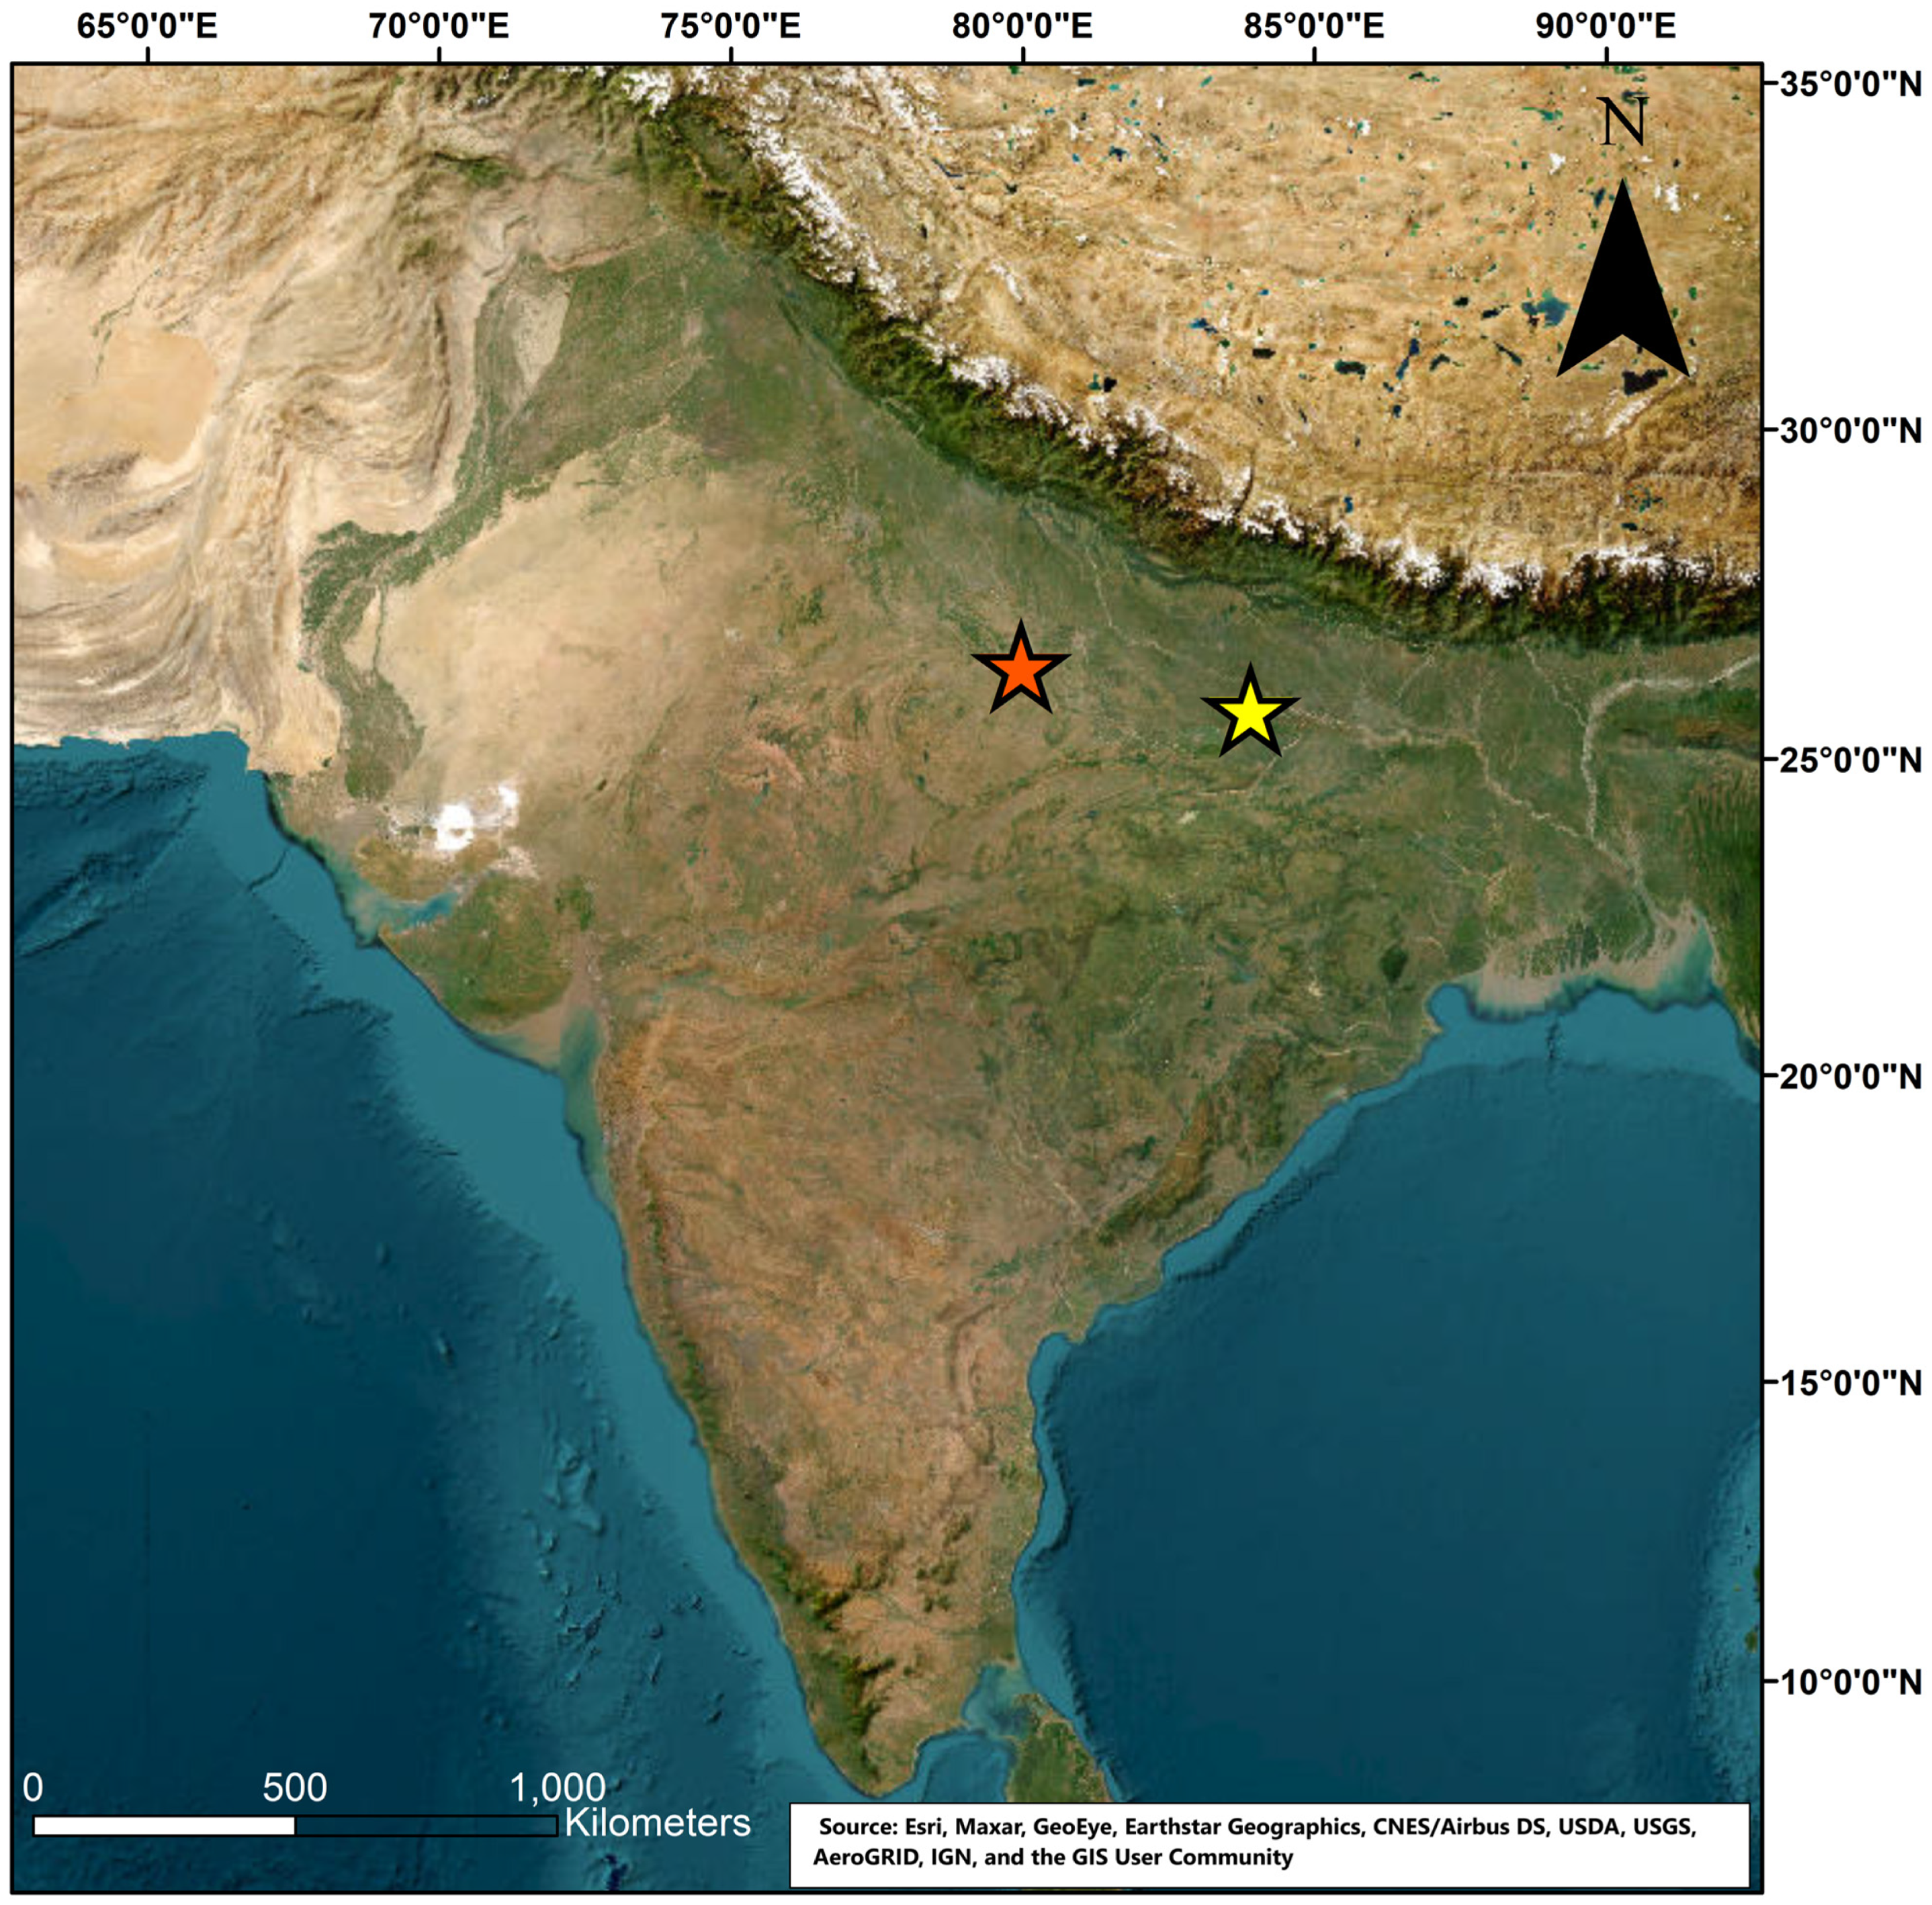
2.1. Study Area

In this research, two AERONET sites from the IGP of Northern India were selected for understanding the long-term trend of aerosol properties. The two selected sites are Kanpur, an urban and industrial area (26.51° N, 80.23° E), and Gandhi College within a rural background (25.87° N, 84.13° E). Based on their closeness to diverse ecosystems and land utilization, these stations may encounter varying aerosol sizes and categories. The locations of the two selected sites are shown in Figure 1.
Kanpur, a major industrial city in central-western Uttar Pradesh, India, is geographically situated between the Vindhyan–Satpura ranges to the south and the Himalayas to the north. It is flanked by two significant rivers, the Yamuna and the Ganga, along with their tributaries. The city has seen substantial rural-to-urban migration spurred by economic opportunities and urban development. This population growth has led to increased land development and industrial activities, contributing to elevated pollution levels and higher aerosol concentrations [51]. Gandhi College, located in Ballia, lies approximately 466 km east of Kanpur and is set in a predominantly rural area [52]. The region is primarily agricultural, relying on ample groundwater and monsoon rainfall for irrigation, with wheat, paddy, mustard, and pulses being the main crops. Due to its agricultural nature, land surface factors are likely to have a more significant impact on aerosol climatology at Gandhi College compared to the urbanized environment of Kanpur. Both study sites are situated far from the Arabian Sea and the Bay of Bengal, contributing to their continental climate. They experience a semi-arid climate with four distinct seasons: summer (March to April)/pre-monsoon (May to June), monsoon (July to September), post-monsoon (October to November), and winter (December to February). December and January are the coldest months, while May and June are the hottest. Despite some variability, around 80–85% of the annual rainfall in these regions occurs during the southwest monsoon. The region experiences hot summers, cold and foggy winters, and frequent thunderstorms and dust storms, particularly around the pre-monsoon/monsoon season.

2.2. AERONET

This study employed data from the AERONET ground-based observation stations at Kanpur and Gandhi College, located in the IGP. AERONET is a globally established network of sun- and sky-tracking radiometers that provides continuous, high-quality data on aerosol optical properties [20]. This network plays a crucial role in measuring aerosol characteristics and validating satellite-derived aerosol data (http://aeronet.gsfc.nasa.gov/ (last accessed on 20 October 2024). AERONET provides daily data on various optical and radiative properties of aerosols across different spectral bands (340, 380, 440, 500, 675, 870, and 1020 nm) through a global network of sun and sky radiometers [20]. AERONET offers three levels of data quality: Level 1.0: Raw, unscreened data, Level 1.5: Cloud-screened and pre-processed data, and Level 2.0: Fully quality-assured data. The system combines sun measurements with sky radiance observations to retrieve aerosol properties, including Aerosol Optical Depth (AOD), Ångström Exponent (α), Single Scattering Albedo (SSA), and Complex Refractive Index (RI). AOD uncertainties are less than ±0.01 for longer wavelengths (λ > 440 nm) and ±0.02 for shorter wavelengths in cloud-free conditions, while columnar water vapor retrievals have an uncertainty of up to 10% [53,54].
Level 2.0 AERONET data were utilized in this study, accounting for retrieval uncertainties. In the present study, AOD at 500 nm was analyzed to assess aerosol concentration, and the α440–870 derived from the 440–870 nm wavelength was examined to determine aerosol size characteristics. Seasonal variations in SSA at four wavelengths (440, 675, 870, and 1020 nm) were investigated to understand the scattering versus absorption properties of aerosols. Additionally, spectral AOD variation was analyzed across wavelengths to discern the presence of fine- and coarse-mode aerosols. For further details on the AERONET instrument and retrieval methodologies, refer to [53,55].

2.3. HYSPLIT (Hybrid Single-Particle Lagrangian Integrated Trajectory Model)

Backward air mass trajectories were derived using the HYSPLIT (Hybrid Single-Particle Lagrangian Integrated Trajectory) model to better understand the potential source sectors of pollutants. HYSPLIT is a widely used model that simulates the movement of air particles in a Lagrangian framework, tracing their pathways over time and providing insights into how pollution from different sources might be transported to specific locations. The model was initially developed by the Air Resources Laboratory (ARL) of the National Oceanic and Atmospheric Administration (NOAA) in the 1980s [56,57] and has since become a crucial tool for studying atmospheric dispersion and pollution transport [57,58,59,60].
The primary aim of this analysis was to identify the origin of atmospheric pollutants at Kanpur and Gandhi College by evaluating the trajectory of air masses over specific time frames. In this study, the 5-days backward trajectories of air masses were calculated for the years 2005, 2010, 2015, and 2020, with a focus on air masses reaching an altitude of 500 m above ground level (a.g.l.). The 5-days backward trajectory represents a comprehensive examination of how air masses move over the area, showing the mean direction of transport over each year considered. These temporal snapshots allowed for the evaluation of long-term trends and variability in aerosol loading across different years.
The input meteorological data for the model were sourced from the Global Data Assimilation System (GDAS) provided by NOAA, with data resolution of 1° × 1° latitude and longitude. GDAS is a globally recognized meteorological data assimilation system that integrates observational data and numerical weather prediction models to provide accurate atmospheric data for different regions and heights [61]. These high-quality data were essential for obtaining reliable and precise trajectories, ensuring that the model results would be accurate in representing the movement of air masses.

2.4. Trend Analysis

A long-term trend analysis of aerosol optical properties and PW were conducted using time-series data from two sites in the IGB. The analysis was performed on both annual and daily mean values of various aerosol optical properties and PW obtained from AERONET for each location. Before applying trend analysis, data normality was assessed using the Shapiro–Wilk and Kolmogorov–Smirnov tests. Based on this assessment, annual trends (year−1) of AOD500, α440–870, and PW were analyzed using parametric linear regression, as these datasets followed a normal distribution, while trends per day (day−1) were analyzed using the non-parametric Mann–Kendall (M–K) test, which is well-suited for non-normally distributed data [62,63]. The Mann–Kendall test is widely used in atmospheric and environmental sciences for detecting monotonic trends in long-term datasets and has been extensively applied for analyzing AOD trends, including studies over the IGP and the Indian subcontinent [35,64]. The M-K test was used to examine day−1 trends of AOD500, α440–870, PW, and SSA at four wavelengths during the complete study periods (2001–2022 for Kanpur and 2006–2023 for Gandhi College) across different seasons within the study period, and for two sub-periods at each site (2001–2011 and 2012–2022 for Kanpur, 2006–2014 and 2015–2023 for Gandhi College).
The trend analysis methodology follows Kaskaoutis et al. [49] and is described by the equation:
x   % = a N x 100
where x is the variable, x′ is the mean value, N is the whole number of days or years during the studied period, and a is the slope value from the linear regression analysis. The statistical significance of the slope was evaluated using the p-value, with values less than 0.05 indicating statistically significant trends at the 95% confidence level.

3. Results

3.1. Aerosol Optical Depth (AOD) and Angstrom Exponent (α)

Aerosol Optical Depth (AOD) is a crucial parameter for quantifying aerosol concentration in the atmosphere, serving as an indirect indicator of air pollution levels [65,66]. AOD represents the column-integrated aerosol extinction coefficient, reflecting the attenuation of solar radiation by aerosols across different wavelengths throughout the entire atmospheric column [67]. Figure 2a,b illustrates the seasonal/monthly variations in AOD500 for Kanpur (2001–2022) and Gandhi College (2006–2023), respectively. In Kanpur, the highest AOD500 values (Average ± Standard Error) were recorded during the post-monsoon period (0.80 ± 0.012), followed by winter (0.68 ± 0.014) and pre-monsoon seasons (0.72 ± 0.009). The lowest AOD500 values were seen during summer (0.50 ± 0.007, the lowest across seasons), with the monsoon season (Figure 2a) registering a mean AOD500 of 0.57 ± 0.011. At Gandhi College, more pronounced seasonal variations and higher aerosol concentrations were observed (Figure 2b). The highest mean AOD500 levels were recorded during winter (0.94 ± 0.017), followed by the post-monsoon period (0.84 ± 0.023), with the pre-monsoon season (Figure 2b) registering a mean AOD500 of 0.78 ± 0.011. The lowest mean AOD500 values at Gandhi College were observed during the monsoon (0.58 ± 0.013) and summer seasons (0.59 ± 0.011). Marked and sudden changes in aerosol loading were also evident in monthly (within seasons) AOD500 values at both sites (Figure 2). The increase in AOD500 was very sharp from March (0.45 ± 0.008; 0.56 ± 0.016) to June (0.74 ± 0.015; 0.81 ± 0.019), and immediately after the monsoon seasons from September (0.55 ± 0.015; 0.64 ± 0.021) to November (0.90 ± 0.018; 1.03 ± 0.037) at Kanpur and Gandhi College, respectively. The highest monthly average AOD500 was observed in November (0.90 ± 0.018) at Kanpur (Figure 2a) and December (1.06 ± 0.029) at Gandhi College (Figure 2b). However, the lowest monthly average AOD500 was seen in March at both sites.
The Ångström Exponent (AE or α) measures how the AOD varies in relation to various light wavelengths—a phenomenon known as “spectral dependence”. The α exhibits a lower magnitude for coarse-mode particles and a higher magnitude for fine-mode particles [54,68]. This makes α a useful measure for determining atmospheric aerosol size and understanding the wavelength dependence of aerosol optical properties. The average seasonal/monthly variation in α440–870 values at Kanpur and Gandhi College is shown in Figure 2c,d, respectively. The highest mean seasonal of α440–870 values were recorded during the post-monsoon (1.29 ± 0.006; 1.35 ± 0.008), followed by winter (1.26 ± 0.009; 1.31 ± 0.007) and monsoon seasons (1.12 ± 0.012; 1.28 ± 0.010) at Kanpur (Figure 2c) and Gandhi College (Figure 2d), respectively. The relatively lower α440–870 values were recorded during the summer (0.76 ± 0.01; 0.97 ± 0.013), with the lowest seasonal value registered in pre-monsoon seasons (0.64 ± 0.013; 0.95 ± 0.013) at Kanpur (Figure 2c) and Gandhi College (Figure 2d), respectively. Monthly mean values of α440–870 varied considerably at Kanpur but not prominently at Gandhi College. At Kanpur (Figure 2c), the α440-870 varied from 0.59 ± 0.015 in May (minimum) to 1.32 ± 0.006 in November (maximum). At Gandhi College, the changes in monthly average α440-870 values were less distinct, with values ranging from 0.85 ± 0.016 in April (minimum) to 1.38 ± 0.009 in November (maximum) (Figure 2d).
The spectral variation of AOD across five different wavelengths (380 nm, 440 nm, 500 nm, 675 nm, and 870 nm), as depicted in Figure 3, provides valuable insights into the aerosol characteristics over Kanpur (Figure 3a) and Gandhi College (Figure 3b). The observed trend, where AOD value decreases with increasing wavelength, is indicative of the presence of both fine and coarse aerosol particles, with a predominance of fine-mode aerosols in the atmosphere [69]. Examining the variations (mean ± standard error) at different wavelengths over the entire period revealed that in Kanpur, the average highest values of AOD at 380 nm (1.15 ± 0.021), 440 nm (1.01 ± 0.019), 500 nm (0.90 ± 0.018), and 675 nm (0.62 ± 0.012) occurred in the month of November, whereas, at wavelengths 870 nm peak average AOD values were seen in the month of June (Figure 3a).
The lowest average AOD values across all wavelengths: 380 nm (0.58 ± 0.010), 440 nm (0.50 ± 0.009), 500 nm (0.45 ± 0.008), 675 nm (0.34 ± 0.006), and 870 nm (0.28 ± 0.006) were observed during March compared to other months (Figure 3a). A similar trend of higher AOD values at lower wavelengths and lower values at higher wavelengths was observed at Gandhi College (Figure 3b). However, at this location, the highest average AOD was recorded in December for wavelengths of 380 nm (1.34 ± 0.033), 440 nm (1.20 ± 0.032), and 500 nm (1.06 ± 0.029), and in January for 675 nm (0.74 ± 0.025) and 870 nm (0.52 ± 0.019). The lowest average AOD values across all wavelengths at Gandhi College were noted in August (Figure 3b).

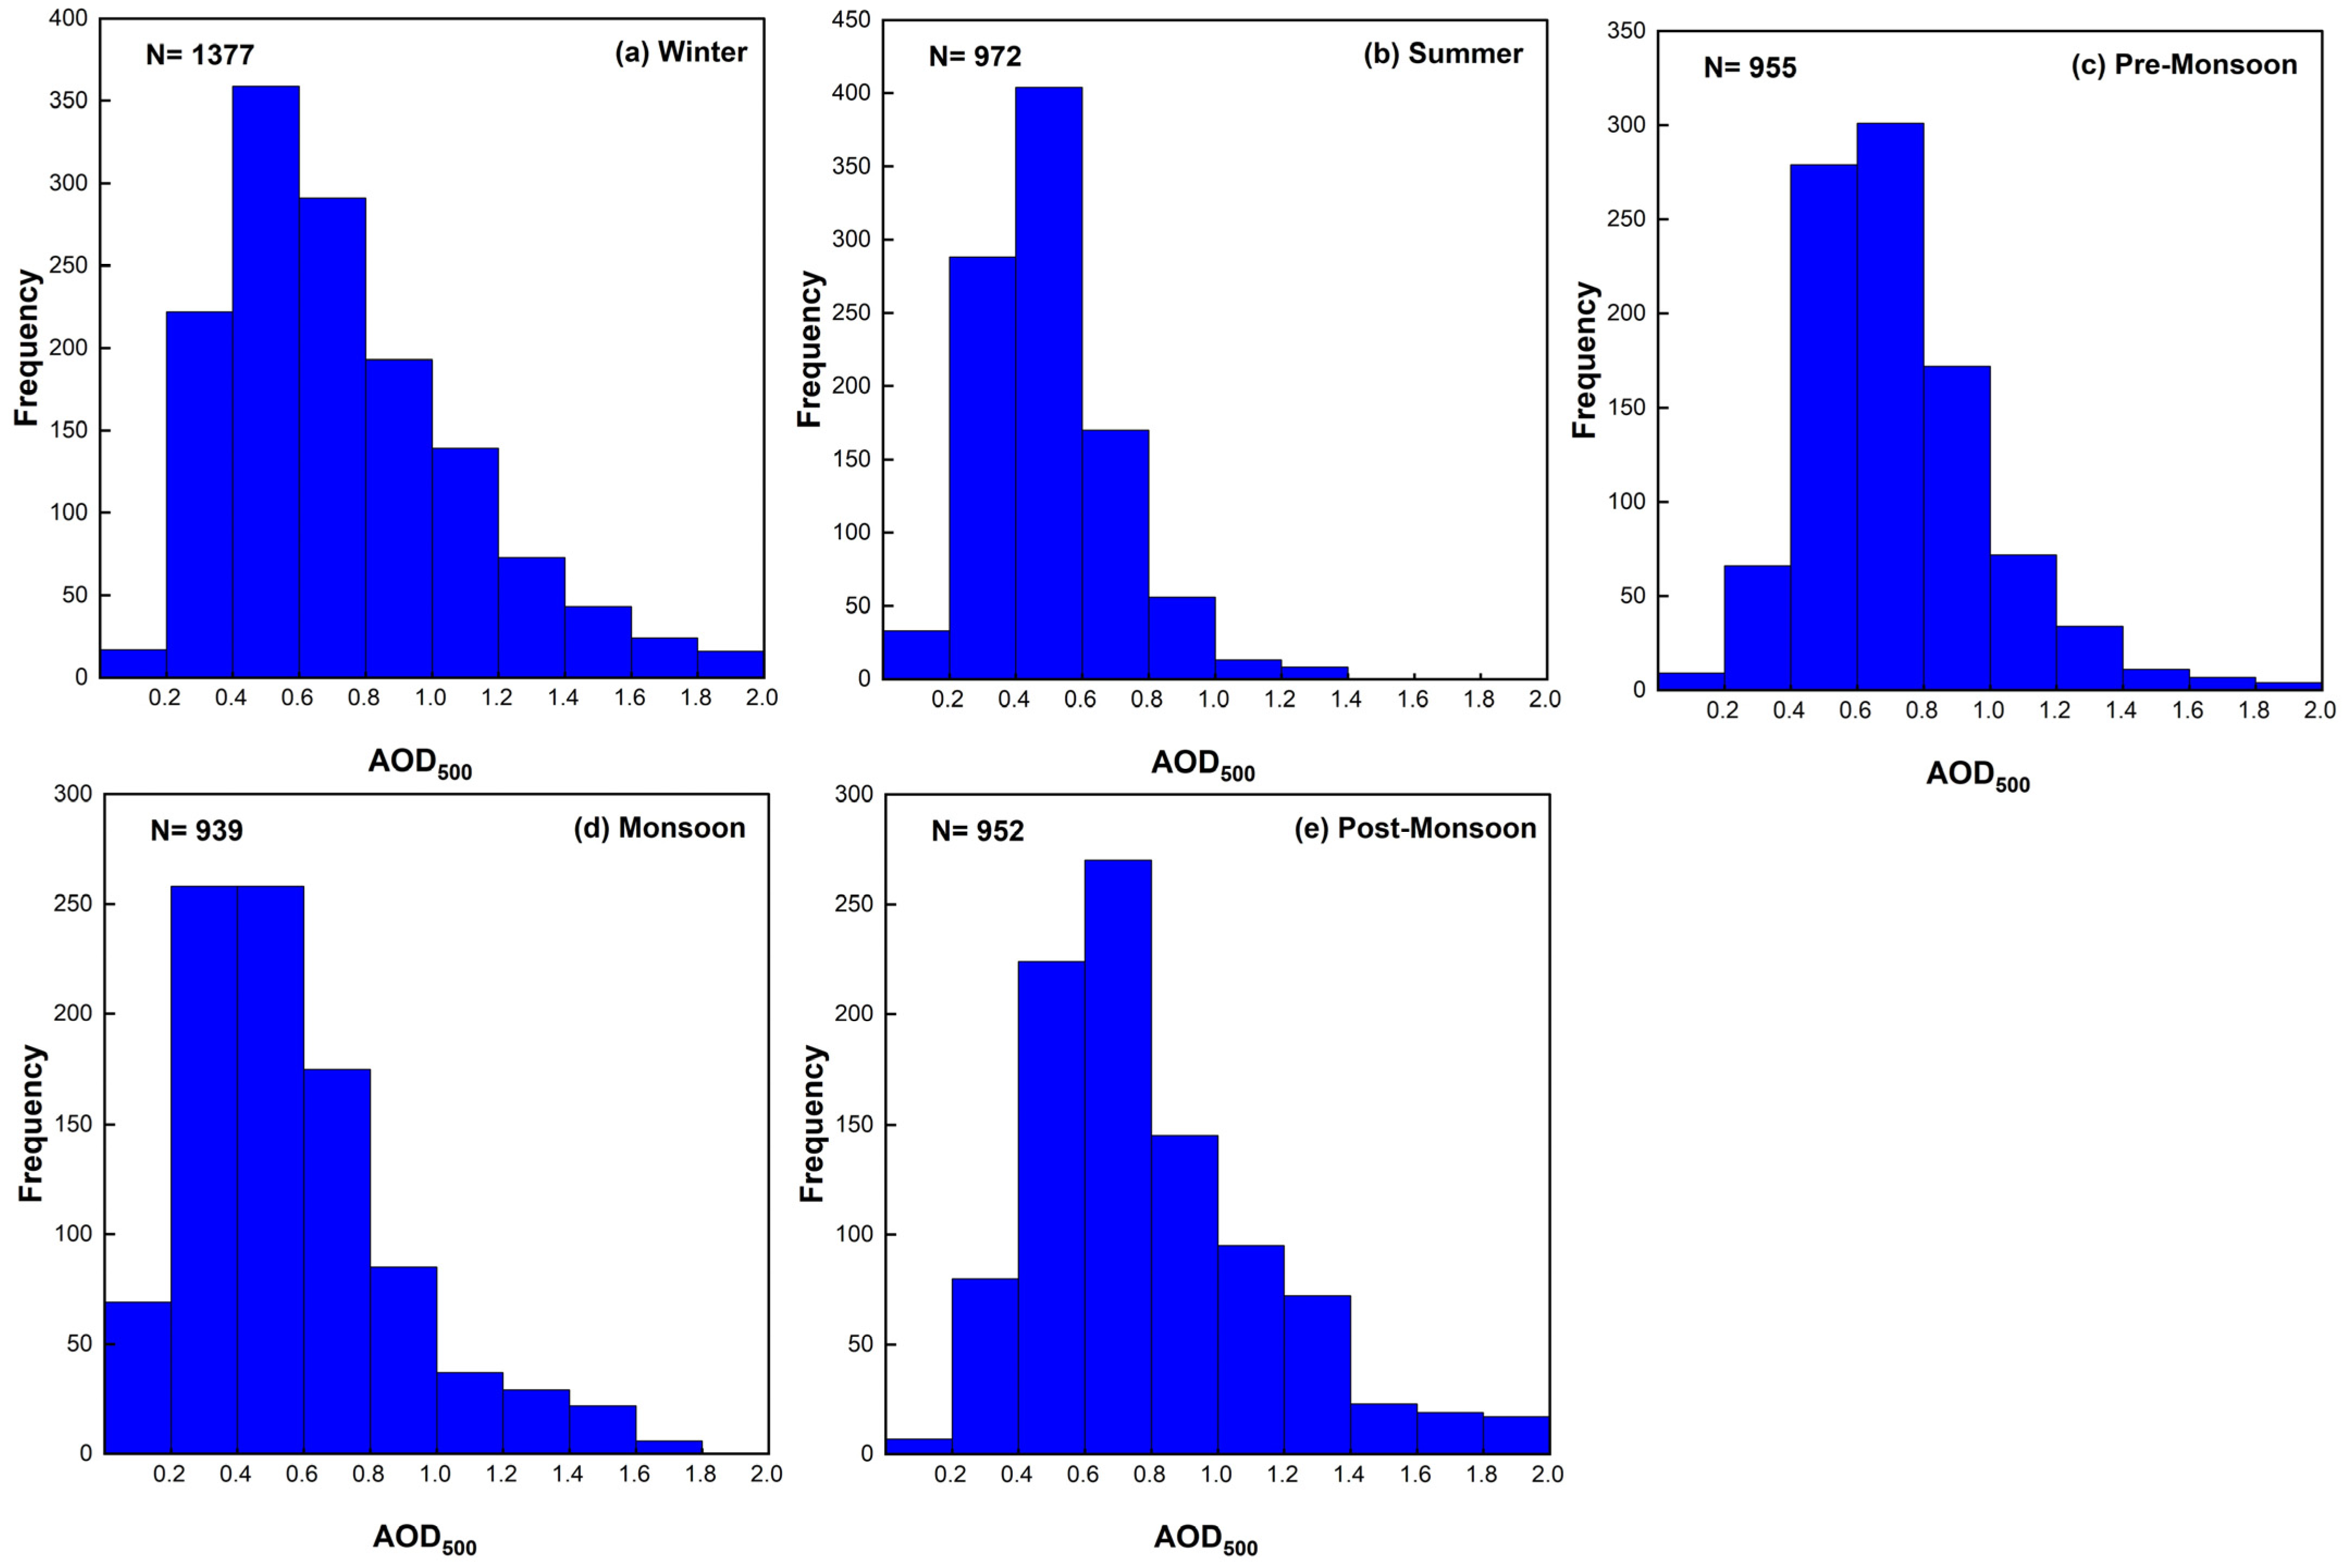
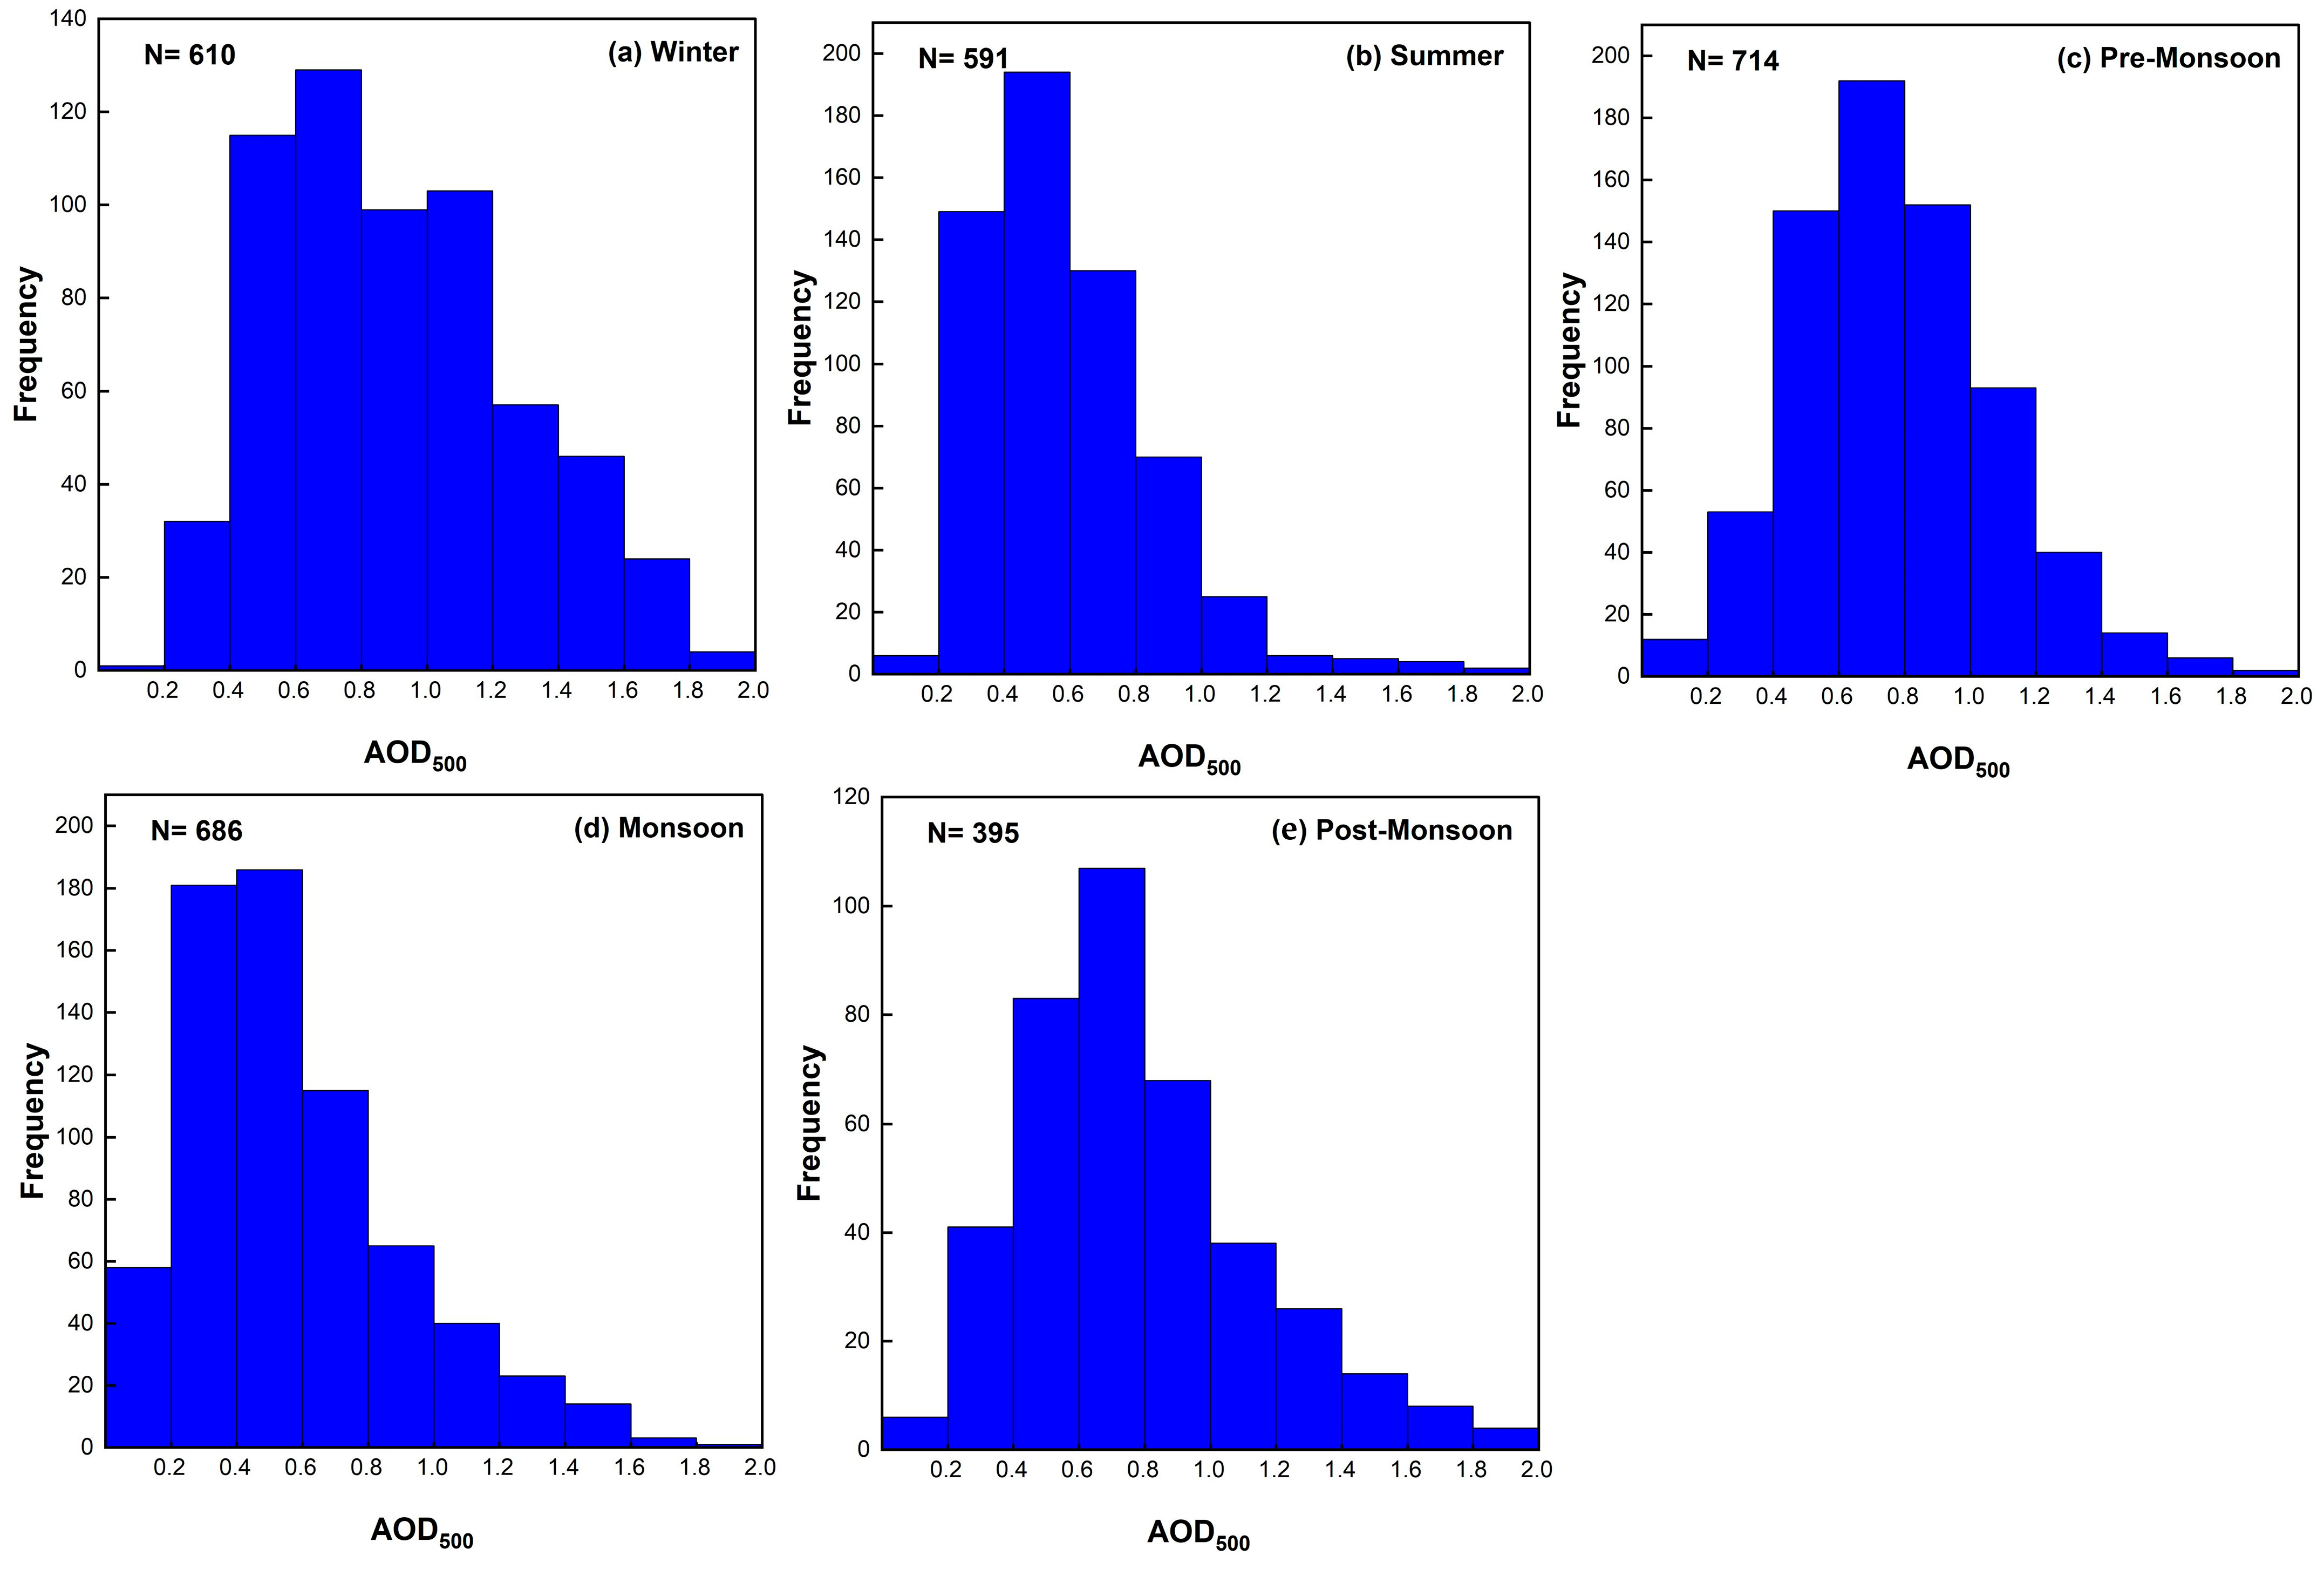
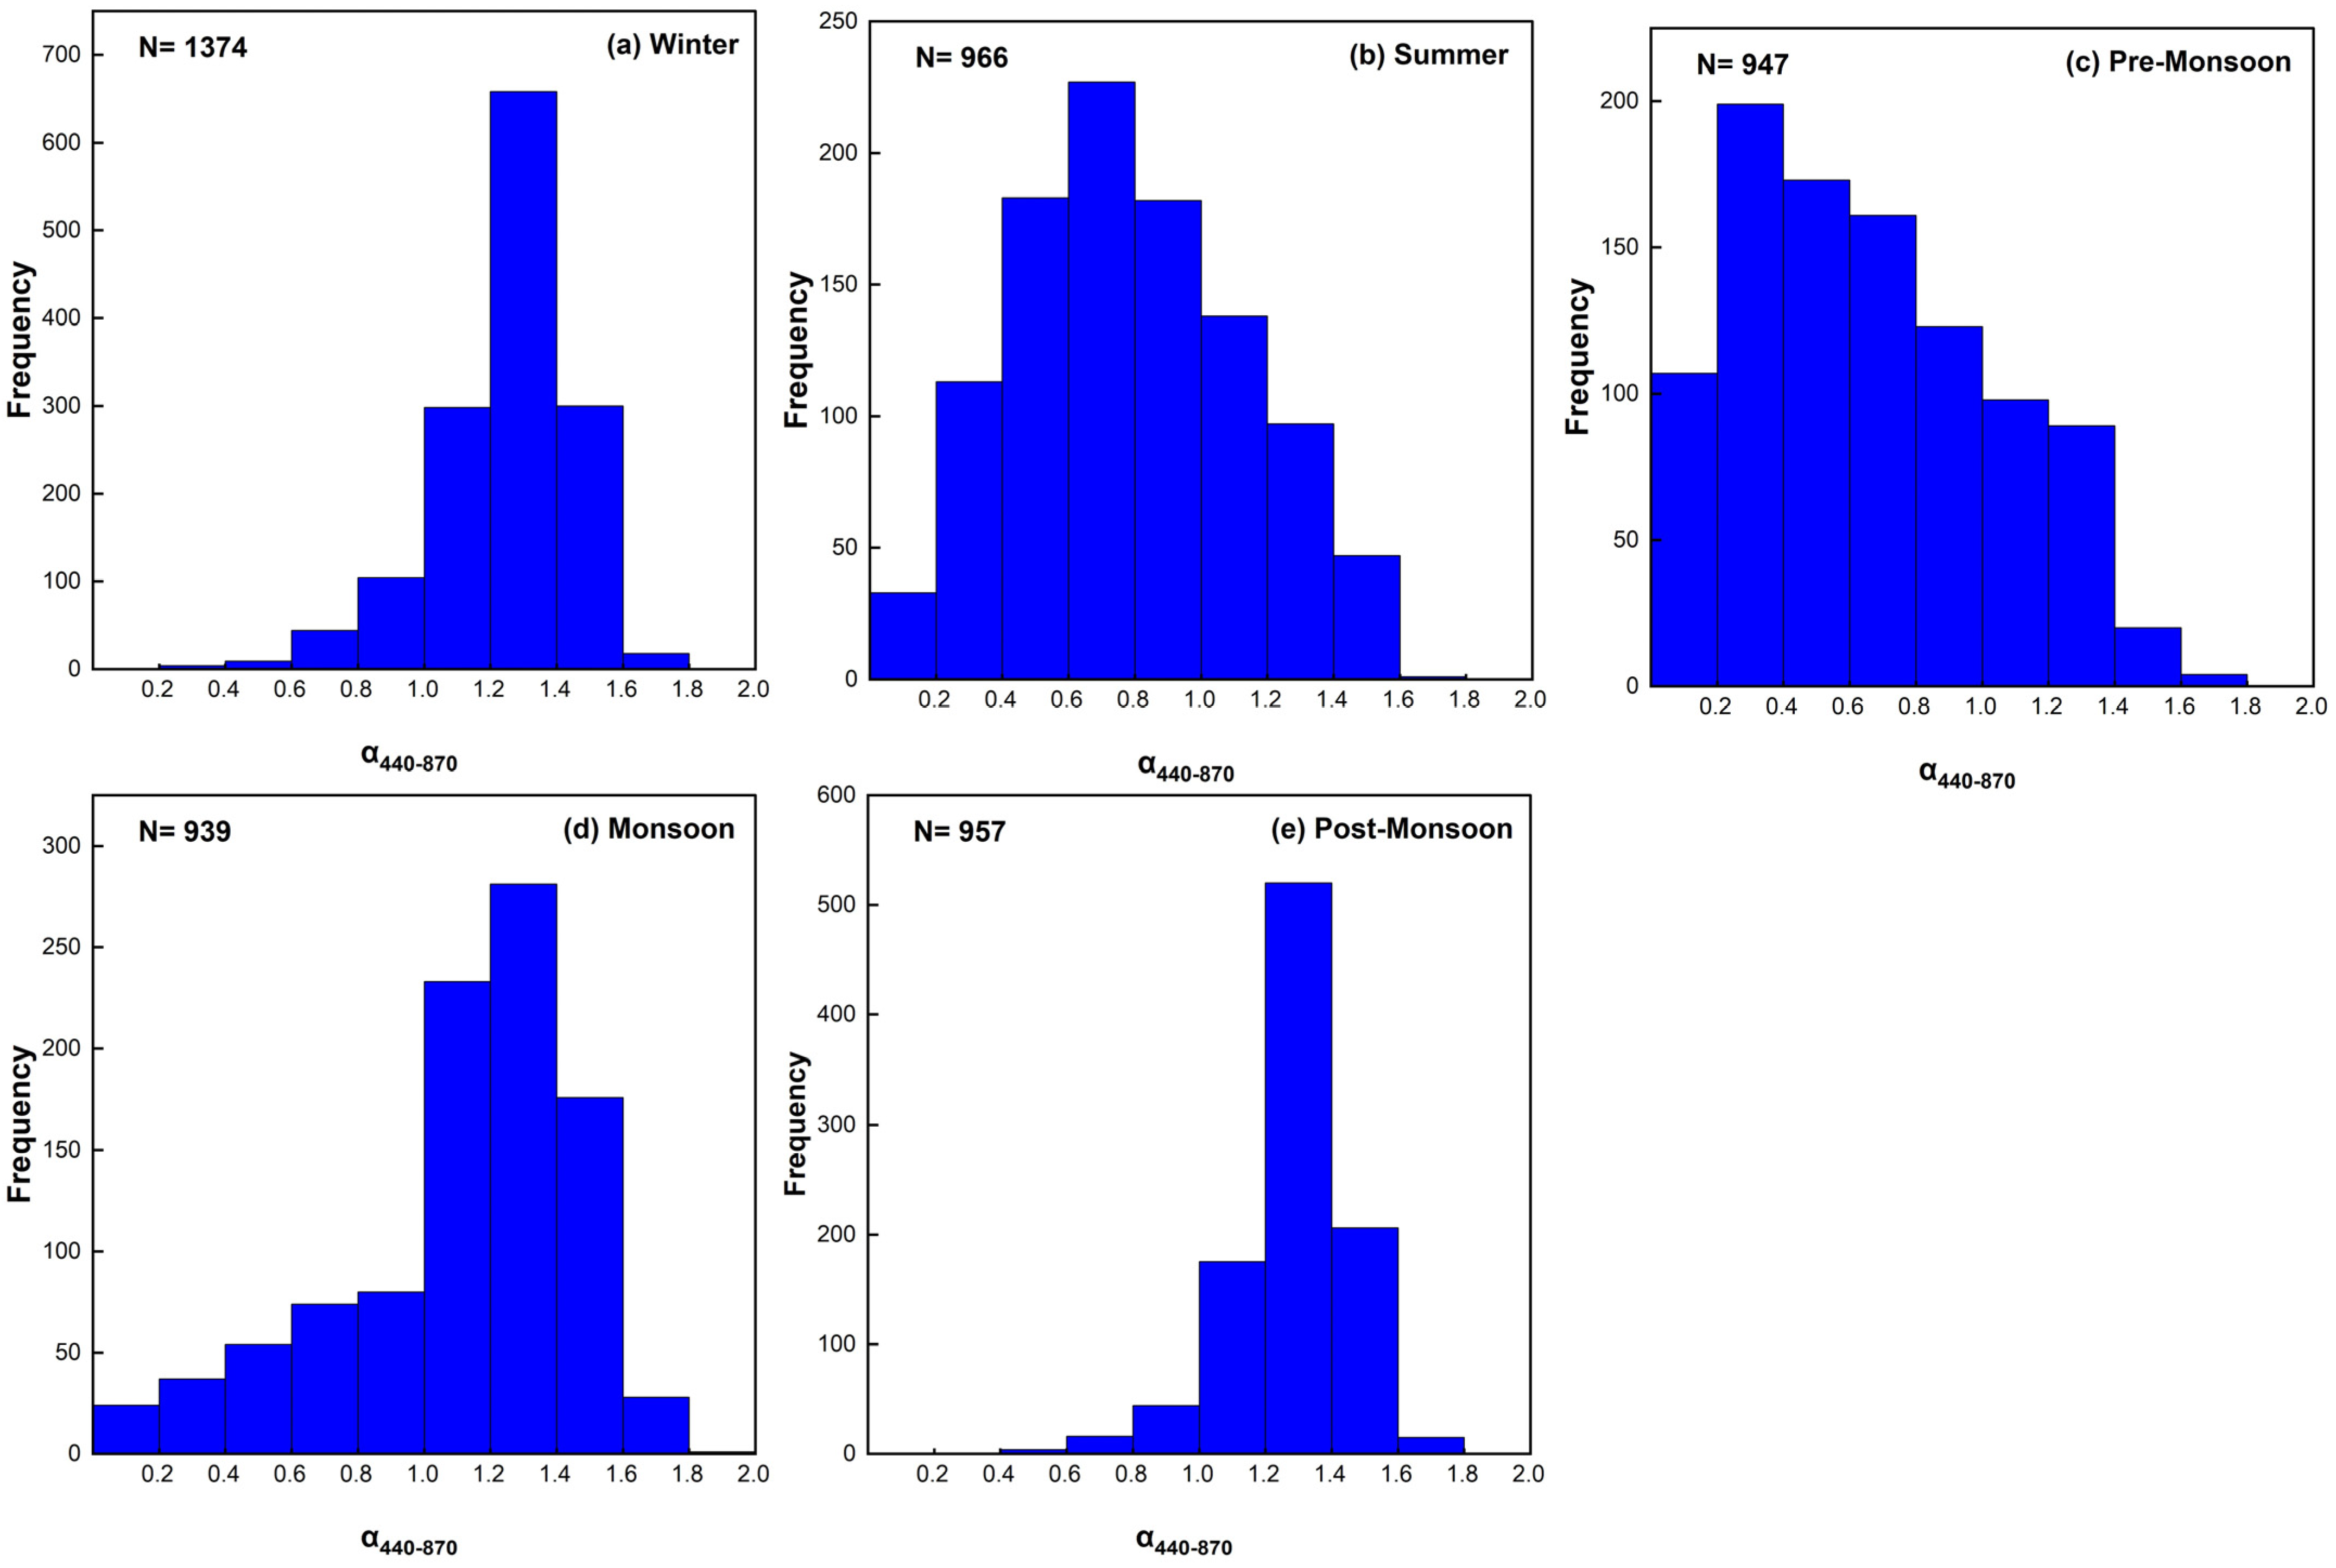
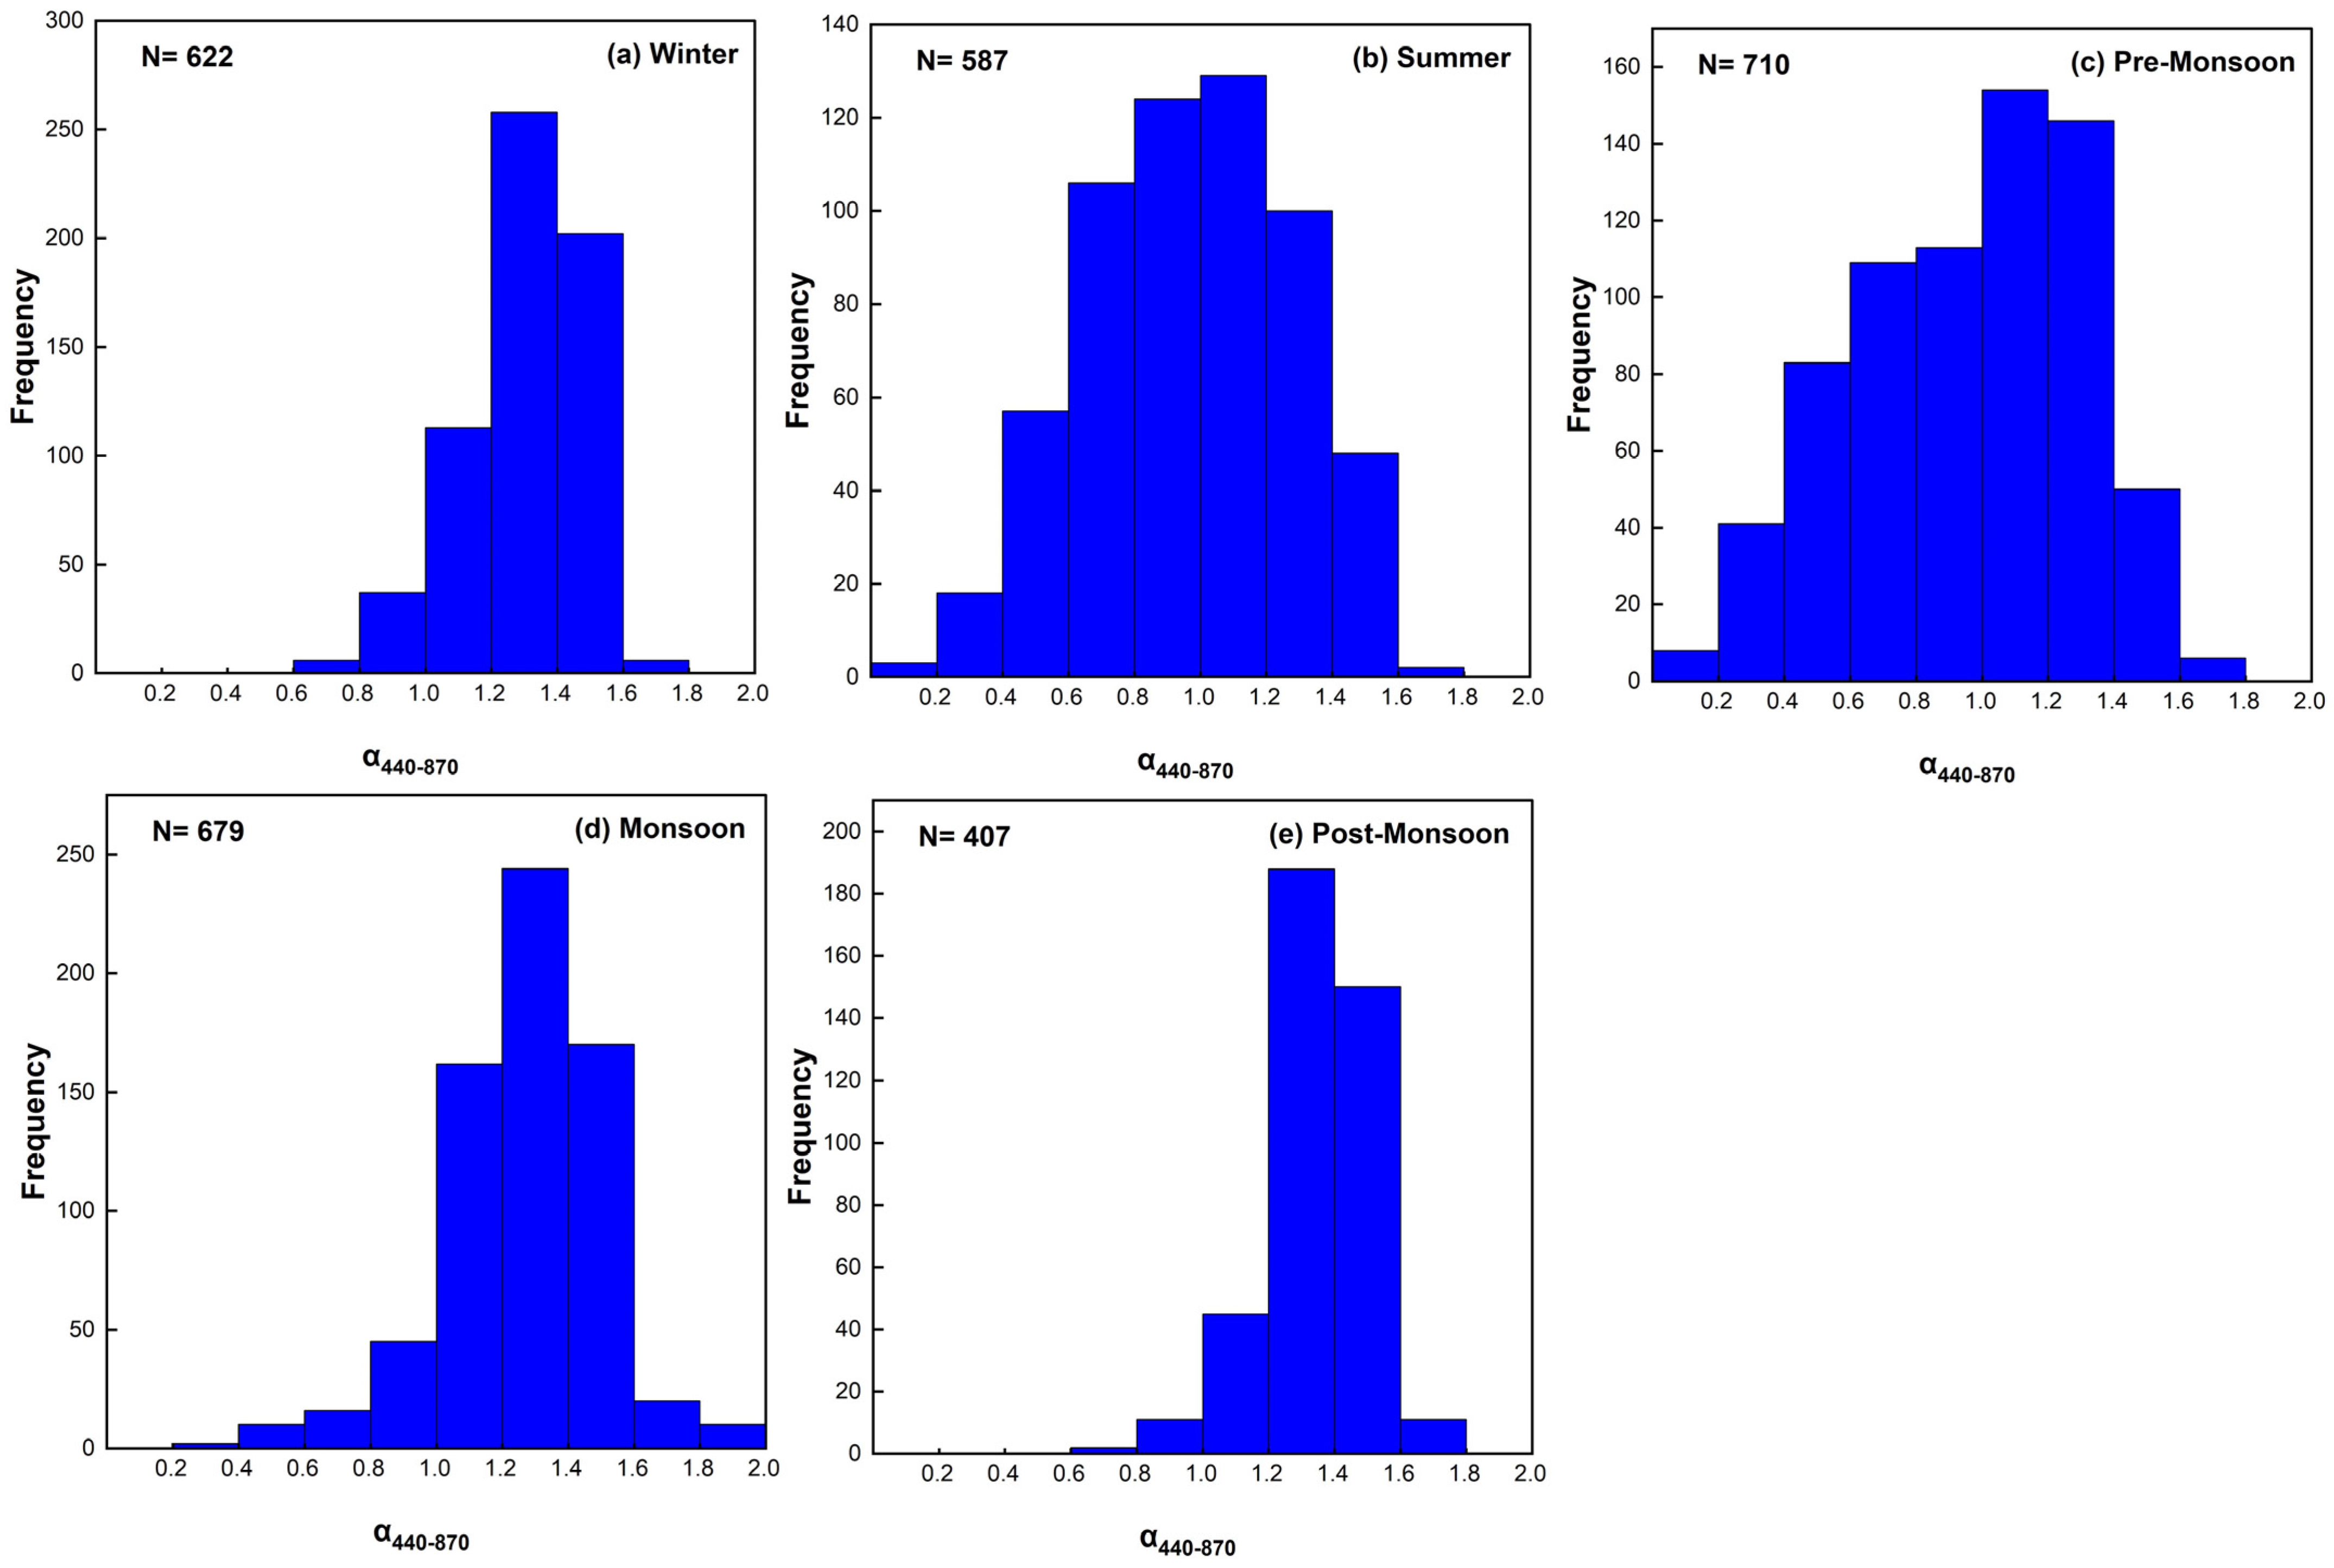
3.2. Frequency Distribution

The seasonal frequency distribution data show that the frequency of AOD500 values exceeding 0.6 varied from 25.4% to 67.3% at Kanpur (Figure 4) (summer: 25.4%, pre-monsoon: 62.9%, monsoon: 37.7%, post-monsoon: 67.3%, and winter: 56.6%), and from 38.2% to 75.9% at Gandhi College (Figure 5) (summer: 41.1%, pre-monsoon: 70.0%, monsoon: 38.2%, post-monsoon: 67.3%, and winter: 75.9%). The seasonal α440–870 frequency distribution graphs for both the locations (Figure 6 and Figure 7) show unimodal distribution during winter (Figure 6a and Figure 7a) and post-monsoon (Figure 6e and Figure 7e) with a modal value of 1.2, which is very close to the mean value of α440–870.
The seasonal α440–870 frequency distribution also shows a relatively higher percentage of α440–870 values below 0.6 during summer (33.4% and 13.3%) and pre-monsoon (49.6%) and 18.6%) seasons at Kanpur (Figure 6b,c) and Gandhi College (Figure 7b,c), respectively. Additionally, the intra-seasonal variability observed in AOD500 and α440–870 values at both Kanpur and Gandhi College, as evidenced by wider frequency distributions (Figure 4 and Figure 5). Throughout the study period, the average AOD500 values were consistently higher at Gandhi College compared to Kanpur across all seasons and months, except for July and August (Figure 2a,b). Similarly, α440-870 values were consistently higher at Gandhi College across all seasons and months (Figure 2c,d).

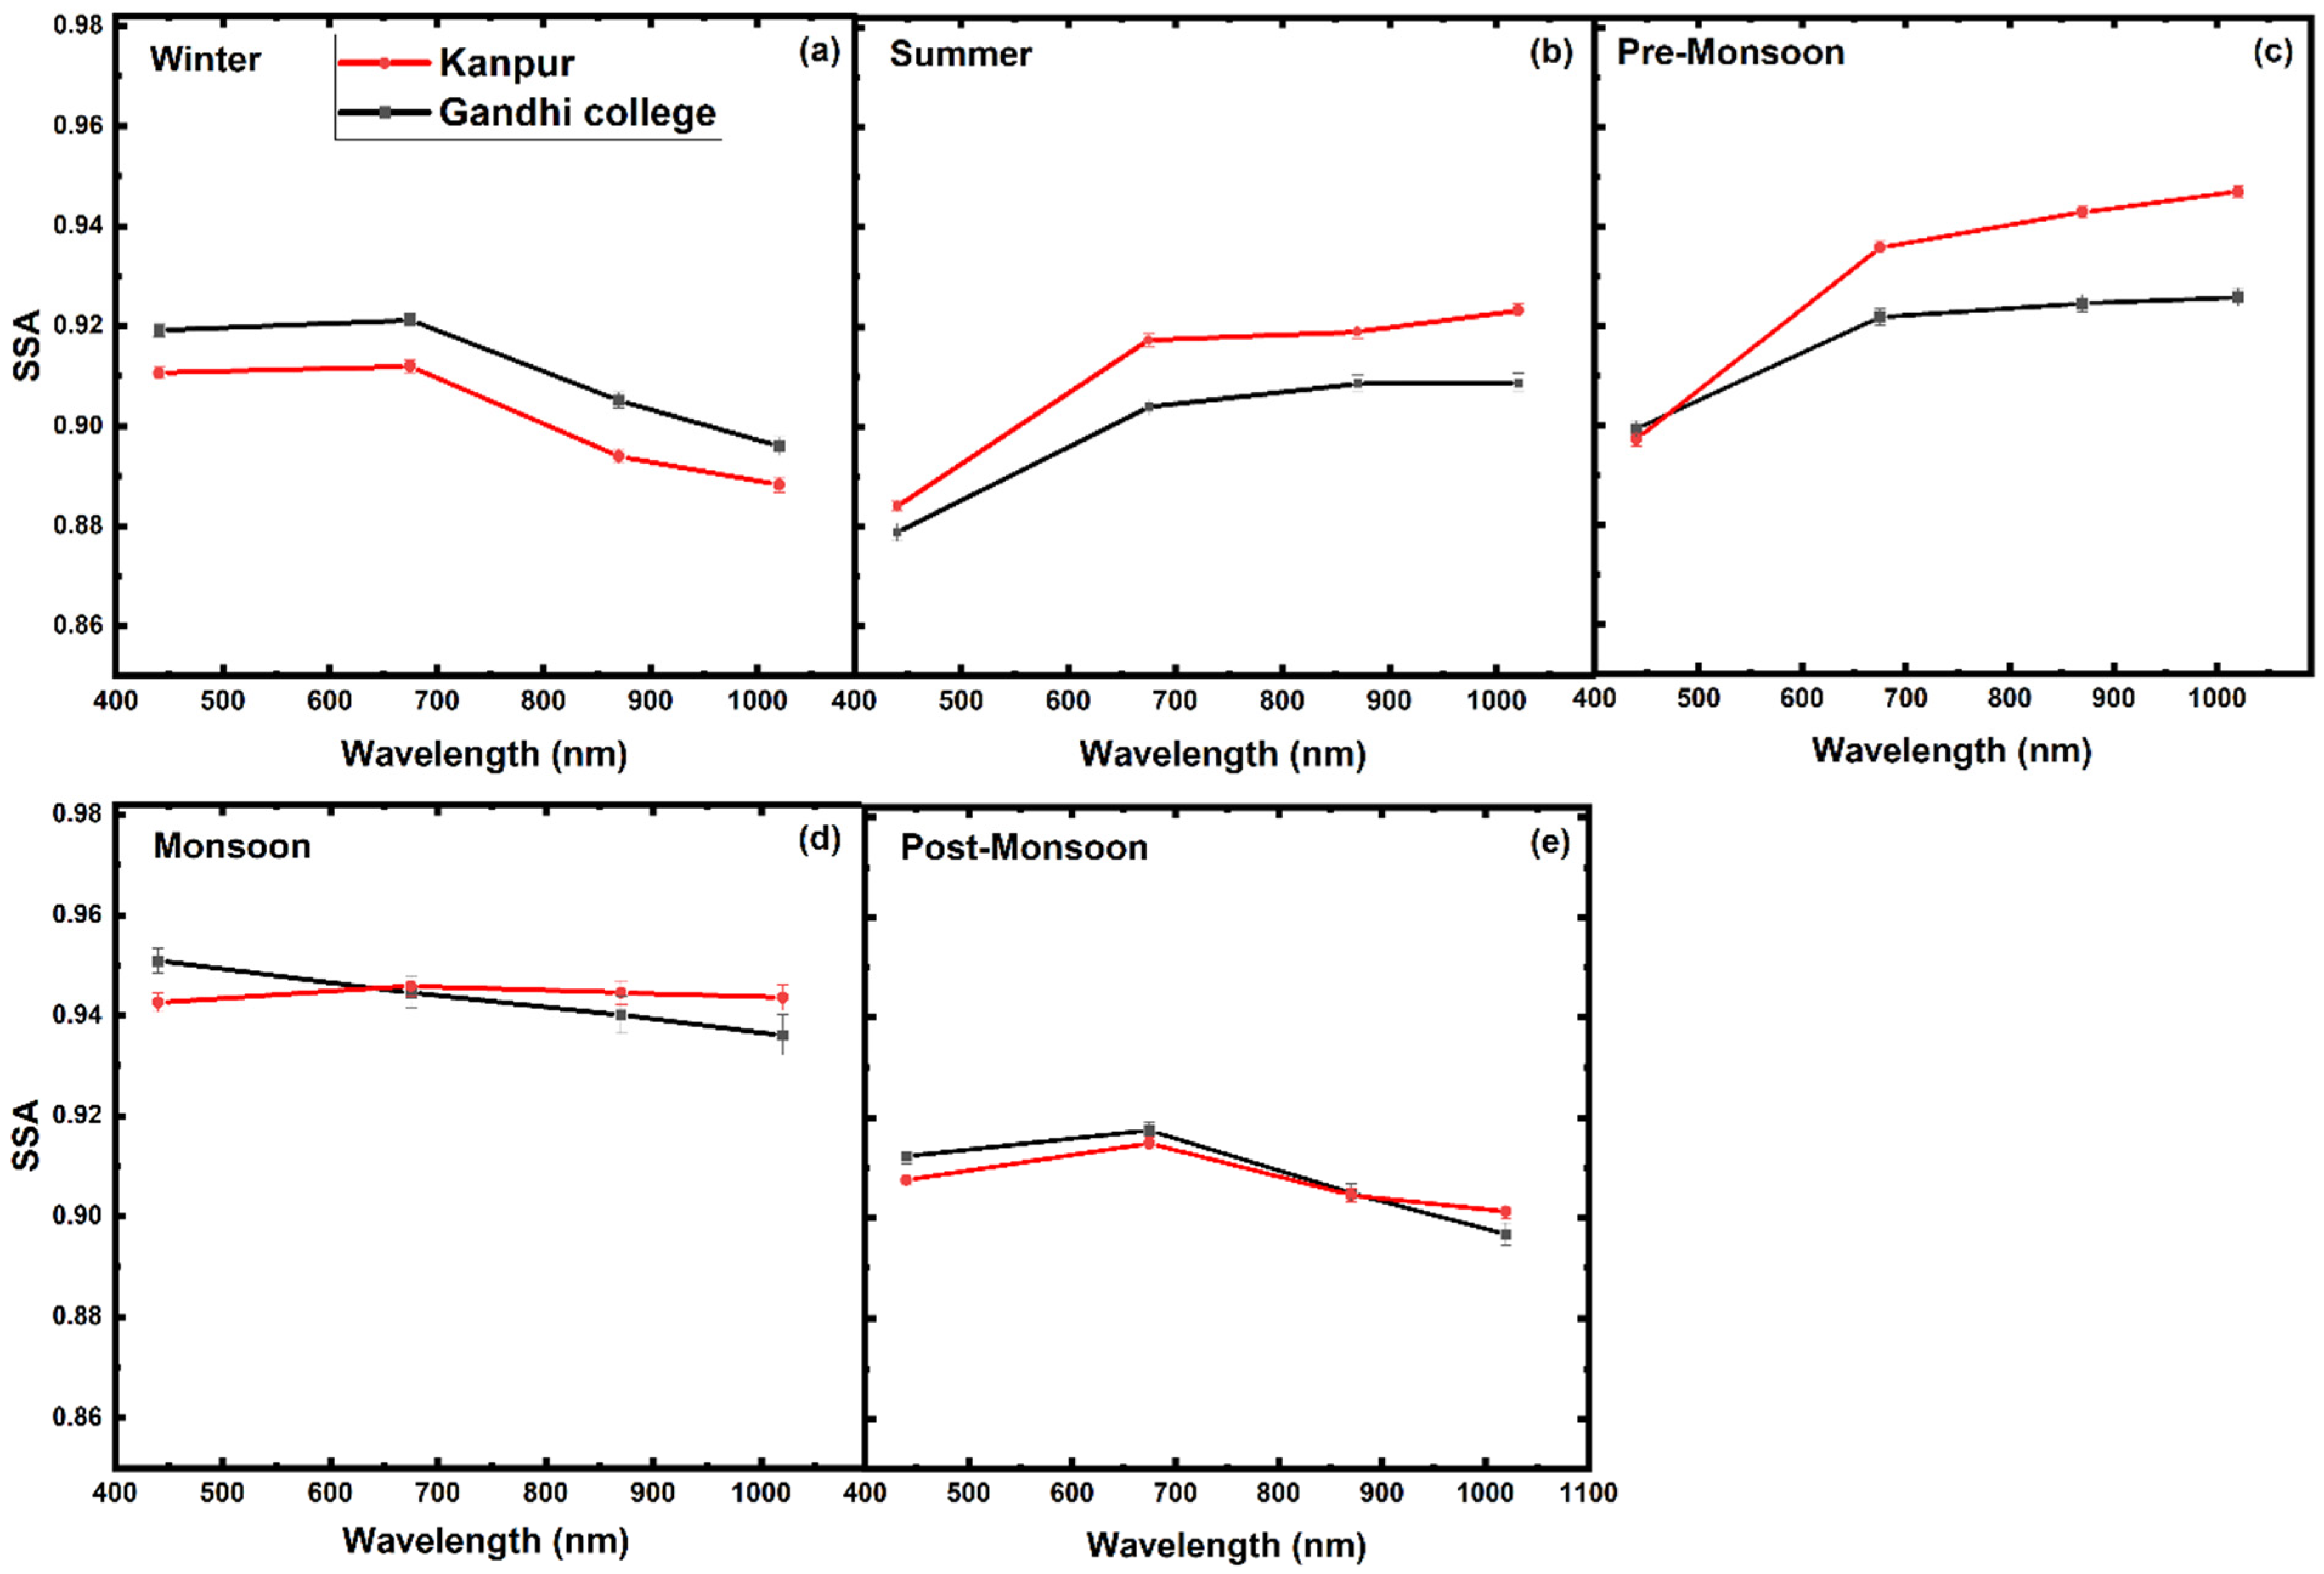
3.3. Single Scattering Albedo (SSA)

Single Scattering Albedo (SSA) is a key parameter for assessing the scattering versus absorption properties of aerosol particles, with values ranging from 0 (indicating complete absorption) to 1 (indicating pure scattering). The seasonal spectral variation of mean SSA values at various wavelengths (440 nm, 675 nm, 870 nm, and 1020 nm) for Kanpur (2001–2022) and Gandhi College (2006–2023) provides important insights into the aerosol characteristics at these sites. Figure 8a–e depicts the seasonal spectral variation of the mean (±SE) of SSA for Kanpur (2001–2022) and Gandhi College (2006–2023). The seasonal average SSA values showed no significant spectral dependence across the study area. Both Kanpur and Gandhi College exhibited similar SSA variations across all wavelengths and seasons. However, apart from the monsoon season, the SSA was strongly wavelength-dependent at both sites. During winter and post-monsoon, SSA slightly decreased with increasing wavelength, showing relatively higher values at shorter wavelengths. Conversely, during summer and pre-monsoon, SSA increased with wavelength at both the studied sites (Figure 8a–e). Notably, during the monsoon season, SSA values remained consistent across both lower and higher wavelengths.

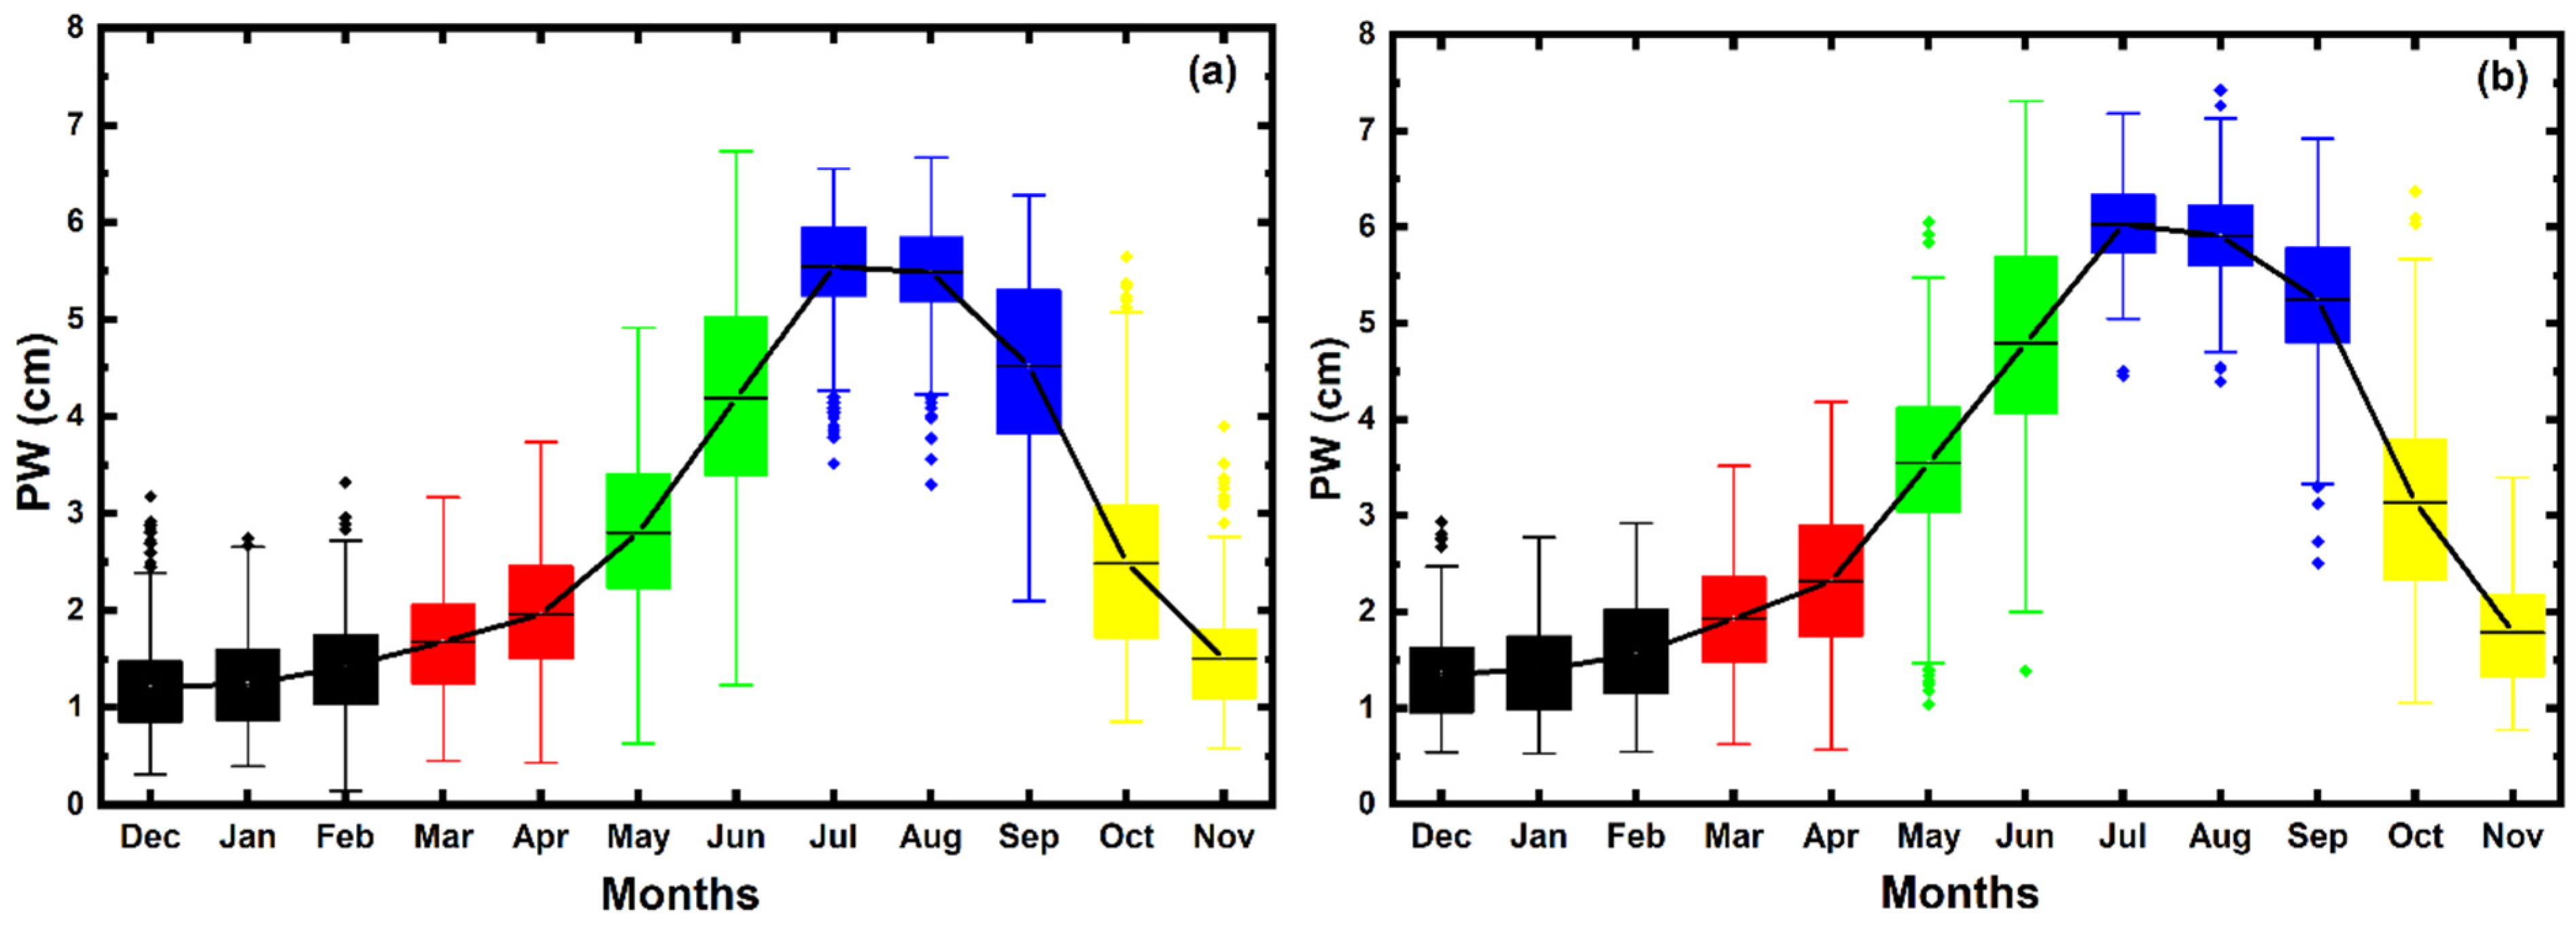
3.4. Precipitable Water Vapor (PW)

Precipitable Water Vapor (PW) quantifies the total amount of water vapor contained in a vertical column of the atmosphere, extending from the surface to the top of the atmosphere [70]. This parameter, derived from AERONET direct sun irradiance measurements in the water vapor absorption band near 940 nm, offers critical insights into atmospheric moisture content. Figure 9a,b presents the monthly/seasonal variation of PW content at Kanpur and Gandhi College, revealing significant monthly and seasonal variability at both sites. The highest PW concentrations were recorded during the monsoon season, followed by the pre- and post-monsoon periods at both sites. Specifically, the long-term mean PW and its standard deviation at Kanpur were 5.14 ± 0.029 during monsoon (maximum), 3.47 ± 0.038 during pre-monsoon, 1.99 ± 0.030 during post-monsoon, 1.82 ± 0.020 in summer, and 1.29 ± 0.019 in winter (minimum; in December) (Figure 9a). At Gandhi College, PW content was consistently higher than at Kanpur, with mean values of 5.71 ± 0.027, 4.12 ± 0.044, 2.55 ± 0.058, 2.13 ± 0.031, and 1.44 ± 0.021 during monsoon (maximum), pre-monsoon, post-monsoon, summer, and winter, respectively. Among the months, the highest PW content was seen in July (5.54 ± 0.032; 6.03 ± 0.0), and the lowest values were observed in December (1.21 ± 0.023; 1.36 ± 0.033) at Kanpur (Figure 9a) and Gandhi College (Figure 9b), respectively. Following the monsoon season, there was a marked decrease in PW content, with values dropping significantly in October (2.49 ± 0.06) at Kanpur and at Gandhi College (3.14 ± 0.076) and continuing to decline through November (1.50 ± 0.025 at Kanpur) and (1.79 ± 0.043 at Gandhi College), and December (Figure 9).
Table 1 presents the trends of AOD500, α440–870, and PW at Kanpur and Gandhi College using both annual and daily means, along with SSA trends (440 nm, 670 nm, 875 nm, and 1020 nm) based on daily means. Statistical parameters such as trend day−1, trend year−1, % change, and p-values are also provided for both stations. The trend analysis covers time period from 2001–2022 for Kanpur and 2006–2023 for Gandhi College. Due to limited observations in 2008 (44 days), 2010 (12 days), and 2017 (76 days) at Gandhi College, these years were excluded from the annual trend analysis. The analysis of long-term annual and daily mean AOD500 values reveals a variable yet statistically significant increasing trend at both Kanpur and Gandhi College, indicating a notable rise in AOD500 over the study period (Table 1). Specifically, at Kanpur, AOD500 has been increasing at a rate of 0.0056776 year−1 and 0.0000230 day−1, equivalent to a ~18% increment. Interestingly, Gandhi College exhibited a slightly higher rate of increase in AOD500, with values rising by 0.0123218 year−1 (29%) and 0.0000644 day−1 (27%) (Table 1). Similarly, α440–870 values have also shown a notable upward trend at both sites. Gandhi College again displayed a relatively higher increment in α440-870, with an increase of 0.0097700 year−1 (~14%) and 0.0000611 day−1 (~16%), compared to Kanpur’s 0.0093563 year−1 (~20%) and 0.0000294 day−1 (~15%) (Table 1). The long-term SSA trends (day−1) at Kanpur and Gandhi College exhibit distinct wavelength-dependent variations. At Kanpur, SSA shows a significant increasing trend across all wavelengths (440–1020 nm), with the highest rise at 440 nm (0.0000122 day−1; ~5%) and the lowest at 1020 nm (0.0000067 day−1; ~3%) (Table 1). In contrast, at Gandhi College, SSA increases at 440 nm (0.0000087 day−1; ~2%) and 675 nm (0.0000037 day−1; ~1%) but declines at 870 nm (−0.0000039 day−1; −0.9%) and 1020 nm (−0.000011 day−1; ~−2%) (Table 1). All trends are statistically significant (p < 0.05), indicating robust long-term changes.
The trend in PW content shows divergent patterns between the two sites. Kanpur experienced a considerable increase in PW, with an annual increment of 0.0156395 year−1 (~13%) and a daily increase of 0.0000528 day−1 (~10%) (Table 1). Conversely, Gandhi College exhibited a marked decrease in PW content, with a decline of −0.0484076 year−1 (~−25%) and −0.000163 day−1 (~−15%).

3.5. Long-Term Seasonal Trend Analysis

The long-term seasonal trends of AOD500 and α440–870 at Kanpur (2001–2022) and Gandhi College (2006–2023) highlight significant variations in aerosol loading and particle size distribution across seasons. As detailed in Table 2, AOD500 shows a statistically significant increasing trend across all seasons at both locations. At Kanpur, the largest seasonal AOD500 increases occurred during the post-monsoon (0.0002289 day−1; ~27%), followed by winter (0.0001768 day−1; ~33%), monsoon (0.0000840 day−1; ~13%), summer (0.0000711 day−1; ~13%), and pre-monsoon 0.0000101 day−1; ~1%. At Gandhi College, the most significant rise was observed during the post-monsoon (0.000556 day−1; ~27%), followed by monsoon (0.0003279 day−1; ~38%), winter (0.0002719 day−1; 18%), pre-monsoon (0.0001827 day−1; ~17%), and summer seasons (0.0001548 day−1; ~16%).
For α440–870, significant upward trends were observed across all seasons at both locations, except for winter, where a non-significant negative trend was observed at Gandhi College (−0.0000522 day−1; ~−2%), and a non-significant positive trend at Kanpur (0.0000298 day−1; ~3%) (Table 2). The most pronounced increase in α440–870 occurred during the pre-monsoon season, followed by summer at both locations. Kanpur experienced a steeper rise (0.0005800 day−1; ~86%) compared to Gandhi College (0.0004349 day−1; ~32%) in pre-monsoon. However, summer increments were higher at Gandhi College (0.0003153 day−1; ~20%) than at Kanpur (0.0001879 day−1, ~24%). The monsoon season showed a significant increase in α440–870 at Kanpur (0.0003067 day−1; ~26%) and a moderate rise at Gandhi College (0.0001127 day−1; ~6%). During the post-monsoon season, α440–870 exhibited a moderate increasing trend at both the sites, with an increase of 0.0000788 day−1 (~6%) at Kanpur and 0.000134 day−1 (~4%) at Gandhi College.
SSA trends at Kanpur were consistently positive, with the highest increases during winter (0.0000470 to 0.0000546 day−1, ~5 to 7% across the 440 nm to 1020 nm wavelengths) (Table 2). Post-monsoon trends were between 0.0000500 and 0.0000186 day−1, with a percentage changes of ~4 to 2%. In summer, positive trends persisted with slopes of 0.0000390 to 0.0000230 day−1, resulting in increases of ~4 to 2%. During the pre-monsoon season, while SSA showed a positive trend at 440 nm (0.0000500 day−1; ~4%), there was a slight decline at 1020 nm (−0.0000178 day−1; ~−1%). In contrast, Gandhi College presented more variable trends, with positive changes at shorter wavelengths in winter (0.0000114 to 0.0000104 day−1, 0.6% at 440 nm and 675 nm) but negative at longer wavelengths (−0.0000113 to −0.0000385 day−1, −0.6% to −2% at 870 nm and 1020 nm, respectively). Post-monsoon trends showed slight increases at shorter wavelengths (0.0000365 day−1; 1% at 440 nm) but significant declines at longer wavelengths (−0.0000276 to −0.0001081 day−1, −1 to −3% at 870 nm and 1020 nm) (Table 2). Summer exhibited positive trends with slopes of 0.0000251 day−1 (440 nm) to 0.0000178 (1020 nm) day−1, leading to increases of 1 to 2% across all wavelengths. However, during pre-monsoon, minor increases at 440 nm (0.0000283 day−1; ~1%) were contrasted by negative trends at longer wavelengths (−0.0000103 to −0.0000323 day−1; −0.6% to −2% at 870 nm and 1020 nm) (Table 2).
At Kanpur, PW exhibited a significant increase in monsoon (0.0005887 day−1; ~10%) followed by pre-monsoon (0.0003390 day−1; ~9%) and summer (0.0003146 day−1; ~16%) (Table 2), whereas a negative non-significant trend was observed during the post-monsoon (−0.0001243 day−1; ~−6%) and winter seasons (−0.0000746 day−1; ~−8%). At Gandhi College, a significant declining trend was observed in the post-monsoon (−0.001283 day−1; ~−20%) followed by monsoon seasons (−0.0004171 day−1; ~5%). However, a slight to moderate non-significant positive trend was observed in all the other seasons (0.0001871 day−1;~ 8% in winter, 0.0000786 day−1; ~1% in pre-monsoon, and 0.0000177 day−1; 0.5% during summer) (Table 2).

3.6. Sub-Period Analysis and Comparison of Aerosol Characteristics

The statistical trend analyses of aerosol parameters over two sub-periods—2001–2011 and 2012–2023 at Kanpur and 2006–2014 and 2015–2023 at Gandhi College—offer insights into the temporal dynamics of aerosol concentrations and their optical properties in the IGP. The results, summarized in Table 3, reveal significant shifts in aerosol loading and composition between these periods. At Kanpur, AOD500 showed a statistically significant increasing trend of 0.0000404 day−1 (~16%) during the first sub-period (2001–2011). During the second sub-period (2012–2023) at Kanpur, the rate of increase in AOD500 slowed to a non-significant trend, 0.0000135 day−1 (~5%), despite the relatively higher mean AOD500 value during this period (0.70 ± 0.01) compared to the first period (0.64 ± 0.01) (Table 3). In contrast, at Gandhi College, AOD500 exhibited a statistically significant increase trend of 0.00008050 day−1 (~15%) in 2006–2014 (first sub-period) and 0.0000723 day−1 (~17%) in 2015–2023 (second sub-period). The α440–870 levels at Kanpur showed a moderately increasing trend of 0.0000449 day−1 (~11%, mean: 1.08 ± 0.01) in the second period compared to the first period (0.0000344 day−1; ~9% increase; mean: 0.98 ± 0.01). At Gandhi College, the rate of increase significantly increased during the second sub-period (0.0000531 day−1; ~8%) compared to the first (0.0000196 day−1; ~2%) (Table 3).
Regarding SSA, our sub-period results reveal a statistically significant, yet variable, trend that either increases or decreases with wavelength (Table 3). During the first period, the SSA values at Kanpur were slightly lower but showed positive trends (varied from 0.0000259 day−1 at 440 nm to 0.0000231 day−1 at 1020 nm). In the second sub-period, although SSA values remained relatively high (Table 3), the trends day−1 were lower (0.0000080 day−1 at 440 nm to 0.0000062 day−1 at 1020 nm). At Gandhi College, the SSA showed a positive trend across all wavelengths during the first period, ranging from 0.0000127 day−1 at 440 nm to 0. 0.0000046 day−1 at 1020 nm (Table 3). However, during the second period, the SSA exhibited a more variable trend. While a slight positive trend was observed at 440 nm (0.0000001 day−1), there was a negative trend at all other wavelengths, with the most significant decrease at 1020 nm (−0.0000231 day−1) (Table 3).
The PW content at Kanpur showed an increasing trend during both periods, with a more substantial rise in the second half (0.0001584 day−1; ~16%) compared to the first half (0.000091 day−1; ~9%) (Table 3). However, at Gandhi College, the PW content showed a significant declining trend during the first period (−0.0008584 day−1; −31.1%) and an insignificant positive trend in the second period (0.0000073 day−1; 0.41%).

3.7. Back Air Mass Trajectory

Figures S1–S12 provide an overview of the mean monthly back-trajectories of air masses ending at Kanpur and Gandhi College, demonstrating significant seasonal and monthly variations in wind directions. Figures S1, S2 and S12 clearly depict north-westerly as the prominent wind direction, with a high frequency of air masses observed in January, February, and December (winter season), respectively, at both Kanpur and Gandhi College. In these winter months, most air masses are of local origin, with additional contributions from the northwestern regions of India and Pakistan. The analysis of 5-days back air mass trajectories reveals that in March, the atmosphere over Kanpur and Gandhi College is primarily influenced by air masses transported from the distant west and northwest (Figure S3). In April, while easterly air mass contributions increase at both sites, the prevailing wind direction remains similar to earlier months (Figure S4). Highly variable wind directions were observed in May at both sites. At Kanpur, a significant fraction (15–50%) of air masses originate from the local easterly direction. At Gandhi College, there is a notable increase in easterly winds from the Bay of Bengal (Figure S5). In June, there is a noticeable shift as the relative contribution of easterly winds compared to north-westerly winds increases at both sites (Figure S6). During July (Figure S7) and August (Figure S8), a marked shift in air mass trajectory is observed from the north-westerly region (continental) to the south-westerly and south-easterly regions (oceanic) at both locations. The south-westerly air masses originate from the Arabian Sea, and the south-easterly air masses from the Bay of Bengal, traversing over the Indian landmass before reaching the receptor sites. By September, in addition to the SW and SE air mass trajectories, contributions from the northwestern region of India also become prominent (Figure S9). During the post-monsoon season (Figures S10 and S11), both Kanpur and Gandhi College are dominated by north-westerly air masses originating from the northwestern IGP. These air masses, traveling through regions such as Punjab, Haryana, Uttar Pradesh, and eastern Pakistan, are likely to carry aerosols from biomass or crop residue burning activities, highlighting a significant anthropogenic influence.

4. Discussion

Our results indicate a pronounced seasonal variation in AOD500 and α440–870 over both the studied sites of IGP. This variability can be attributed to the alternating dominance of fine- and coarse-mode aerosols in the atmosphere. Throughout the year, there is a clear progression in air mass direction from north-westerly in winter, shifting to westerly, then to south-westerly during the monsoon, and back to north-westerly in the post-monsoon period (Figures S1–S12). During winter, the majority of air masses are local, with their distance increasing from winter to summer and further to the monsoon season. The more pronounced variation in AOD500 values at shorter wavelengths (Figure 3) suggests that these wavelengths are more sensitive to the presence of fine particles, which dominate the aerosol population. The relatively greater intensity of AOD500 variation at shorter wavelengths may also be influenced by the production of ultra-fine particles, which are more effective at scattering light at these wavelengths. The relatively higher values of AOD500 and α440–870 during winter are mostly associated with shorter trajectories (Figure 2 and Figures S1, S2 and S12), indicating a predominance of fine-mode aerosols, which are typically anthropogenic and are local in origin (urban, industrial, and rural combustion sources). The highest AOD500 and α440–870 values during the post-monsoon, combined with air masses predominantly originating from the northwest (both local and distant: particularly from the Punjab and Haryana), point to biomass or crop residue burning as the primary source of pollutants at this time (Figure 2 and Figures S10 and S11) [35,71]. During the summer, the relatively higher AOD500 and lower α440–870 values, coupled with the long-range transport from the Thar Desert, Iran, and Pakistan, suggest that natural aerosols, particularly from dust storms, are the main contributors to atmospheric pollutants. The significant AOD500 reduction and slight increase in α440–870 during the monsoon season (Figures S7–S9) compared to pre-monsoon seasons results from wet scavenging, which predominantly removes coarse particles, altering aerosol composition and increasing the relative abundance of fine-mode aerosols (Figure 2b,d). Additionally, high humidity during the monsoon, associated with high PW vapor content, promotes particle coagulation, where smaller particles aggregate to form larger, coarser particles. These larger particles are more readily removed through wet deposition or gravitational settling [72,73]. Moreover, wet scavenging during rainfall significantly reduces the concentration of near-surface coarse particles. However, finer aerosols, often present at higher altitudes, remain less affected. This selective removal enhances the relative abundance of fine-mode particles, resulting in higher α440–870 values during the monsoon season. During the monsoon, the wind direction shifts significantly, unlike the pre-monsoon period when long-range dust storms are dominant. The combination of heavy rainfall, increased humidity, and altered wind patterns during the monsoon season leads to a substantial reduction in the concentration of coarse particles and a relative increase in fine-mode aerosols in the atmosphere. This effect is more pronounced at the rural Gandhi College site. The seasonal α440–870 frequency distribution reveals a unimodal pattern in winter and post-monsoon, with a modal value of 1.2, confirming fine-mode aerosol dominance. In contrast, summer and pre-monsoon exhibit a higher fraction of α440–870 values below 0.6, indicating a seasonal increase in coarse-mode aerosols due to transported dust. Both the sites consistently exhibit higher AOD values at the lower spectral wavelengths (380 nm, 440 nm, and 500 nm) coupled with higher α440–870 values, suggesting a greater fine-mode aerosol burden, except during the monsoon and pre-monsoon due to wet scavenging and the natural dust transport from the That Desert. Nevertheless, the differences in AOD500 and α440–870 frequency distribution patterns between the two sites across different seasons (Figure 4 and Figure 5) suggest substantial seasonal heterogeneity in aerosol concentrations due to varying emission sources and atmospheric conditions.
The seasonal variations in SSA follow distinct patterns at both Kanpur and Gandhi College, with no significant spectral dependence, on average, across the study area. Although SSA values showed similar trends at both sites throughout the year, notable seasonal differences in wavelength dependence were observed, particularly outside the monsoon season. The decrease in mean SSA values with increasing wavelength during the winter and post-monsoon seasons at both the studied sites, suggests a significant presence of fine-mode absorbing aerosol dominance from vehicular emissions, industrial activities, and biomass burning [41,74]. In contrast, higher SSA values at longer wavelengths during summer and pre-monsoon indicate a greater influence of scattering coarse-mode dust aerosols (Table 3). Dust aerosols are highly efficient at scattering radiation, particularly at wavelengths greater than 500 nm, leading to elevated SSA values. The spectral dependence of SSA at these sites reflects the dynamic interplay between different aerosol types—fine-mode absorbing aerosols dominating during winter and post-monsoon, and coarse-mode scattering aerosols becoming more prevalent during summer and pre-monsoon seasons. PW content follows a seasonal pattern, peaking during the monsoon due to moisture influx from the Arabian Sea and Bay of Bengal and declining post-monsoon as drier conditions set in. Gandhi College exhibits consistently higher PW values than Kanpur, likely due to increased vegetation and evapotranspiration in its rural setting [75]. These variations align with previous studies in Indian Sub-continent [76,77], reinforcing the role of monsoonal dynamics and local geography in atmospheric moisture distribution.
Our long-term annual findings also suggest aerosol loading, with a dominance of fine-mode particles, has intensified more rapidly at Gandhi College compared to Kanpur (Table 1). Both the studied sites of IGP show a statistically significant increasing trend in AOD500 and α440–870 values, indicating a general rise in aerosol loading and an increase in fine-mode anthropogenic aerosols. Interestingly, however, Gandhi College demonstrates a significantly higher increase in AOD500 and a slightly rising trend in α440–870 compared to Kanpur (Table 1). This suggests that the Gandhi College site, located in a rural area, may be influenced by more localized pollution sources. These could include intensified biomass burning or agricultural activities, in addition to the transport of pollutants from nearby urban and industrial regions [77]. Such localized sources of pollution appear to be more prominent at Gandhi College than in urban areas like Kanpur. The long-term seasonal variations in AOD500 and α440–870 at Kanpur (2001–2022) and Gandhi College (2006–2023) reflect the interplay of regional meteorology, emission sources, and aerosol transport across the IGP. Our analysis reveals a variable but consistent increase in aerosol loading across all seasons at the studied sites in the IGP (Table 2). At Kanpur, the relatively moderate increase in AOD500, coupled with a significantly higher rise in α440–870 during the pre-monsoon, monsoon, and summer seasons, when aerosol loadings are generally driven by high dust storm activity and wet deposition, indicates a marked decline in coarse-mode dust aerosols and an increase in fine-mode anthropogenic aerosols. However, in winter and post-monsoon, a reverse trend is observed, indicating a relative increase in natural aerosols compared to anthropogenic aerosols. Similarly, at Gandhi College, the trends in AOD500 and α440–870 show a decrease in coarse-mode natural dust during the summer and pre-monsoon seasons, with a relative increase in natural dust aerosols compared to anthropogenic aerosols during winter and post-monsoon. During the monsoon season at Gandhi College, unlike Kanpur, there is a significant increase in AOD500 and relatively lower increase in α440–870, indicating a relative rise in coarse-mode dust aerosols. This increase in AOD500 during the monsoon, along with the higher aerosol loading during winter and post-monsoon, appears to be driven by regional pollution buildup, high humidity, and biomass burning, which contribute to elevated aerosol concentrations in these periods.
The long-term SSA trends (day−1) (Table 1) at Kanpur and Gandhi College highlight significant changes in aerosol composition over time. The consistent increase in SSA across all wavelengths at Kanpur indicates a shift toward less-absorbing aerosols. The more pronounced rise at shorter wavelengths (440 nm) suggests a prominent increase in scattering from fine-mode aerosols, possibly due to a higher proportion of scattering aerosols such as sulfates or nitrates or a reduction in black carbon emissions. The smaller increase in SSA at longer wavelengths indicates that the change in the composition of larger aerosols is less significant compared to smaller aerosols. The diverging trends at Gandhi College, with increasing SSA at shorter wavelengths and decreasing SSA at longer wavelengths, suggest a more complex evolution of aerosol properties. The increase at the shorter wavelengths again suggests an increase in scattering aerosols, but the decrease at the longer wavelengths indicates an increase in absorbing aerosols or a decrease in scattering aerosols of a larger size, likely driven by shifts in aerosol composition and sources such as biomass burning.
Long-term SSA slopes at Kanpur show a consistent increase across all wavelengths, whereas Gandhi College experiences increasing SSA at shorter wavelengths (440 nm: 0.0000087 day−1; ~2%) but declining trends at longer wavelengths (1020 nm: −0.000011 day−1; ~−2%), suggesting stronger absorption at Gandhi College and a shift toward more scattering aerosols at Kanpur (Table 1). Seasonal SSA slope trends reinforce these findings, with Kanpur showing consistent positive slopes, particularly in monsoon (440 nm: 0.00014 day−1), while Gandhi College exhibits strong negative slopes in winter (−0.0000385 day−1 at 1020 nm) and post-monsoon (−0.0001081 day−1 at 1020 nm) (Table 2), indicating an increasing dominance of absorbing aerosols.
The long-term annual PW trends emphasize regional contrasts (Table 2). The contrasting PW trends at Gandhi College and Kanpur influence aerosol characteristics differently across seasons. At Gandhi College, the significant decline in PW suggests reduced atmospheric moisture availability, which can enhance aerosol loading by limiting wet scavenging processes. This may contribute to the observed rise in fine-mode aerosols, particularly during the monsoon and post-monsoon seasons (Table 3), as drier conditions favor the persistence of anthropogenic emissions from biomass burning and industrial sources. In contrast, Kanpur’s increasing PW trend in most of the seasons indicates higher atmospheric moisture, potentially leading to enhanced aerosol hygroscopic growth and secondary aerosol formation. The higher humidity can also influence aerosol optical properties by increasing light scattering, thereby affecting AOD trends. The seasonal variability in PW thus plays a critical role in shaping aerosol composition, transport, and removal processes over both sites. This finding emphasizes the evolving aerosol characteristics in the IGP, shaped by both natural and anthropogenic influences.
Sub-period analysis reveals that AOD500 at both sites increased significantly during the first sub-period. However, during the second sub-period, the rate of increase in AOD500 slowed down (Table 3). The more pronounced rise in α440–870 in the second sub-period at both sites suggests a shift toward finer aerosols. This change is likely driven by increased urbanization, vehicular emissions, agricultural activities, transported pollutants, and secondary aerosol formation. Although aerosol concentrations continued to rise, the rate of increase—particularly in coarse-mode aerosols—slowed in the later years particularly at Kanpur. This deceleration may be attributed to the saturation of aerosol levels following rapid industrialization and the growth of construction activities and vehicular traffic during the initial period, which significantly contributed to aerosol loading in Kanpur. By the second period, the aerosol levels were already elevated, so the additional increases, though present, were less pronounced. Interestingly, Gandhi College, a rural site, saw a more substantial recent increase in fine-mode aerosols (agricultural emissions and transported pollutants) compared to the urban industrial site of Kanpur. However, the continuous rise in AOD500, even if slower, emphasized the persistent pollution issues in the region. This finding challenges the assumption that urban centers are always the primary contributors to rising aerosol levels in the region. Sub-period analysis at Kanpur reveals stronger SSA increases in 2001–2011 (675 nm) but weaker trends in 2012–2022 (440 nm) (Table 3), indicating changing aerosol characteristics. Gandhi College, however, transitions from moderate SSA increases in 2006–2014 (870 nm) to significant negative trends in 2015–2023 (1020 nm), highlighting enhanced absorption from black carbon and dust. The long-term sub-period PW trends highlight regional climatic influences on aerosol properties. The rising PW trend at Kanpur during both sub-periods (2001–2011 and 2012–2022) and at Gandhi College during the second sub-period (2015–2023) suggests enhanced aerosol/water interactions, contributing to the observed increased AOD500 and α440–870. Moreover, this rising trend in PW during the second sub-period is likely linked to changes in regional humidity and moisture levels, potentially driven by large-scale climatic factors such as the South Asian monsoon. However, Gandhi College’s PW significant declining annual trend during the first sub-period may be linked to local climatic variability or land-use changes. This contrast emphasizes the role of regional moisture conditions in modulating aerosol concentrations. Meanwhile, the rise in PW at Kanpur aligns with trends observed in other urban areas, where increased humidity is often linked to higher aerosol loads due to enhanced aerosol/water interactions [50].
Overall, our findings emphasize the evolving nature of aerosol sources in the IGP, with urban centers like Kanpur showing signs of stabilization while rural areas such as Gandhi College continue to experience considerable increases in aerosol pollution. The contrasting trends underscore the need for targeted air pollution control strategies that address both urban/industrial and rural/agricultural emissions. Overall, the seasonal and spatial variability in AOD500, α440–870, SSA, and PW highlights the complex interactions between aerosol sources, transport, and atmospheric processes governing aerosol characteristics in the IGP.

5. Conclusions

This study presents the longest time series of aerosol optical properties and PW at two AERONET sites in the IGP, covering 22 years at Kanpur (2001–2022) and 16 years at Gandhi College (2007–2023). Significant seasonal and annual fluctuations in aerosol properties were observed over both the studied sites of IGP. During winter, high AOD500 and α440–870 values indicate the dominance of fine-mode anthropogenic aerosols from local sources like urban, industrial, and rural combustion, linked to shorter air mass trajectories. In the post-monsoon season, the highest AOD500 and α440–870 values are associated with air masses from the northwest, carrying pollutants from biomass and crop residue burning. During summer, high AOD500 and lower α440–870 values suggest natural aerosols, mainly coarse-mode dust from the Thar Desert, Iran, and Pakistan. In the monsoon season, AOD500 decreases due to wet scavenging of coarse particles, while α440–870 slightly increases, leaving a higher proportion of fine-mode aerosols.
The long-term analysis reveals a significant rise in aerosol loading, particularly fine-mode particles, at both Gandhi College and Kanpur, with Gandhi College showing a faster increase in AOD500 and α440–870. Gandhi College, located in a rural area, is more influenced by localized pollution sources like biomass burning and agricultural activities, in addition to regional transport from urban centers. The seasonal variations in aerosol loading highlight the complex interplay of meteorology, emission sources, and aerosol transport across the IGP, with both sites exhibiting shifts toward finer, anthropogenic aerosols, particularly during the monsoon and post-monsoon periods. The long-term SSA trends at Kanpur and Gandhi College reveal significant shifts in aerosol composition. Kanpur consistently shows increasing scattering aerosols, likely due to higher sulfate or nitrate levels and reduced black carbon emissions. In contrast, Gandhi College exhibits a more complex trend, with increased scattering at shorter wavelengths but declining SSA at longer wavelengths, indicating overall enhancement of fine mode absorbing aerosols. PW follows a seasonal cycle, peaking during the monsoon due to moisture transport from the Arabian Sea and the Bay of Bengal, then declining post-monsoon as drier conditions set in. Long-term contrasting PW trends at Gandhi College and Kanpur impact aerosol characteristics differently. Gandhi College’s declining PW limits wet scavenging, enhancing fine-mode aerosols, especially during the monsoon and post-monsoon seasons. In contrast, Kanpur’s rising PW promotes aerosol hygroscopic growth and secondary formation, influencing AOD trends.
Sub-period analysis reveals distinct aerosol trends over time. Kanpur shows a slowing increase in aerosol concentrations and stabilization in the second sub-period, indicating potential mitigation or changes in emission sources. In contrast, Gandhi College experiences a steady rise in aerosol loading, driven by local sources like biomass burning and agriculture, along with regional influences. Kanpur’s SSA increase weakened in the later sub-period, indicating evolving aerosol composition, while Gandhi College shifted from moderate SSA growth in the first sub-period to significant declines at longer wavelengths, highlighting the increased concentration of fine-mode absorbing aerosols. The rising PW trends at Kanpur and Gandhi College (second sub-period) indicate increased aerosol/water interactions. The second-period PW rise is linked to regional humidity and climatic factors like the South Asian monsoon, while the decline at Gandhi College in the first sub-period may reflect local climatic or land-use change
These findings emphasize the complex and evolving aerosol dynamics in the IGP, with significant implications for air quality and climate. The rising trends in fine-mode aerosols, especially at Gandhi College, highlight the need for targeted mitigation strategies in both urban and rural areas.

Supplementary Materials

The following supporting information can be downloaded at: https://www.mdpi.com/article/10.3390/atmos16030321/s1, Figure S-1 -S12: 5-days Back air mass trajectories during 2005, 2010, 2015, and 2020 representative of the study period at Kanpur and Gandhi College from January to December.

Author Contributions

We, the undersigned authors, hereby confirm that we all have made significant contributions to the work reported in this manuscript. Specifically: S.W.: Conceptualization, Formal Analysis, Data Curation, Investigation, Methodology, Software, Writing—original draft. A.A.K.: Conceptualization, Formal Analysis, Investigation, Visualization, Writing—original draft, Writing—review and editing. A.K.: Data Curation, Formal Analysis, Methodology, Resources, Visualization. P.J.: Data Curation, Methodology, Resources, Software, Validation. All authors have read and agreed to the published version of the manuscript.

Funding

This research received no external funding.

Institutional Review Board Statement

Not applicable.

Informed Consent Statement

Not applicable.

Data Availability Statement

The datasets used and analyzed during the current study are downloaded from the http://aeronet.gsfc.nasa.gov/.

Acknowledgments

The authors express their sincere gratitude to the Honourable Founder President, Honourable Chancellor, Vice Chancellor, and Pro-Vice Chancellor of Amity University Haryana (AUH), Manesar-Gurugram India, for continuous encouragement and support. The authors would like to express their gratitude to the AERONET group at NASA, USA, for their efforts in putting the data for sun/sky radiometers online at http://aeronet.gsfc.nasa.gov/ (last accessed on 20 October 2024). We sincerely thank the Principal Investigators of the Kanpur and Gandhi College AERONET sites, along with their teams, for their invaluable contributions to the establishment and maintenance of the sites used in this study. We sincerely thank the editor and the anonymous reviewers for their valuable comments and suggestions, which have helped improve the quality of this work.

Conflicts of Interest

The authors have no relevant financial or non-financial interests to disclose. The authors declare that they have no known competing financial interests or personal relationships that could have appeared to influence the work reported in this paper.

References

  1. Myhre, G.; Samset, B.H.; Schulz, M.; Balkanski, Y.; Bauer, S.; Berntsen, T.K.; Bian, H.; Bellouin, N.; Chin, M.; Diehl, T. Radiative forcing of the direct aerosol effect from AeroCom Phase II simulations. Atmos. Chem. Phys. 2013, 13, 1853–1877. [Google Scholar] [CrossRef]
  2. Ramanathan, V.; Crutzen, P.J.; Kiehl, J.T.; Rosenfeld, D. Aerosols, climate, and the hydrological cycle. Science 2001, 294, 2119–2124. [Google Scholar] [CrossRef] [PubMed]
  3. Lohmann, U.; Stier, P.; Hoose, C.; Ferrachat, S.; Kloster, S.; Roeckner, E.; Zhang, J. Cloud microphysics and aerosol indirect effects in the global climate model ECHAM5-HAM. Atmos. Chem. Phys. 2007, 7, 3425–3446. [Google Scholar] [CrossRef]
  4. Manisalidis, I.; Stavropoulou, E.; Stavropoulos, A.; Bezirtzoglou, E. Environmental and health impacts of air pollution: A review. Front. Public Health 2020, 8, 14. [Google Scholar] [CrossRef]
  5. Filonchyk, M.; Yan, H. The characteristics of air pollutants during different seasons in the urban area of Lanzhou, Northwest China. Environ. Earth Sci. 2018, 77, 1–17. [Google Scholar] [CrossRef]
  6. Hsu, S.; Liu, S.C.; Huang, Y.; Chou, C.C.K.; Lung, S.C.C.; Liu, T.; Tu, J.; Tsai, F. Long-range southeastward transport of Asian biosmoke pollution: Signature detected by aerosol potassium in northern Taiwan. J. Geophys. Res. Atmos. 2009, 114, D14. [Google Scholar] [CrossRef]
  7. Zhang, Z.; Wenig, M.; Zhou, W.; Diehl, T.; Chan, K.-L.; Wang, L. The contribution of different aerosol sources to the Aerosol Optical Depth in Hong Kong. Atmos. Environ. 2014, 83, 145–154. [Google Scholar] [CrossRef]
  8. Jethva, H.; Satheesh, S.K.; Srinivasan, J. Seasonal variability of aerosols over the Indo-Gangetic basin. J. Geophys. Res. Atmos. 2005, 110, D21. [Google Scholar] [CrossRef]
  9. Dey, S.; di Girolamo, L. A climatology of aerosol optical and microphysical properties over the Indian subcontinent from 9 years (2000–2008) of Multiangle Imaging Spectroradiometer (MISR) data. J. Geophys. Res. Atmos. 2010, 115, D15204. [Google Scholar] [CrossRef]
  10. Lee, H.J.; Son, Y.S. Spatial variability of AERONET aerosol optical properties and satellite data in South Korea during NASA DRAGON-Asia campaign. Environ. Sci. Technol. 2016, 50, 3954–3964. [Google Scholar] [CrossRef]
  11. Rupakheti, D.; Kang, S.; Bilal, M.; Gong, J.; Xia, X.; Cong, Z. Aerosol optical depth climatology over Central Asian countries based on Aqua-MODIS Collection 6.1 data: Aerosol variations and sources. Atmos. Environ. 2019, 207, 205–214. [Google Scholar] [CrossRef]
  12. Eom, S.; Kim, J.; Lee, S.; Holben, B.N.; Eck, T.F.; Park, S.B.; Park, S.S. Long-term variation of aerosol optical properties associated with aerosol types over East Asia using AERONET and satellite (VIIRS, OMI) data (2012–2019). Atmos. Res. 2022, 280, 106457. [Google Scholar] [CrossRef]
  13. Ansari, K.; Ramachandran, S. Aerosol characteristics over Indo-Gangetic Plain from ground-based AERONET and MERRA-2/CAMS model simulations. Atmos. Environ. 2023, 293, 119434. [Google Scholar] [CrossRef]
  14. Li, J.; Carlson, B.E.; Yung, Y.L.; Lv, D.; Hansen, J.; Penner, J.E.; Liao, H.; Ramaswamy, V.; Kahn, R.A.; Zhang, P. Scattering and absorbing aerosols in the climate system. Nat. Rev. Earth Environ. 2022, 3, 363–379. [Google Scholar] [CrossRef]
  15. Reid, J.S.; Hyer, E.J.; Johnson, R.S.; Holben, B.N.; Yokelson, R.J.; Zhang, J.; Campbell, J.R.; Christopher, S.A.; Di Girolamo, L.; Giglio, L.; et al. Observing and understanding the Southeast Asian aerosol system by remote sensing: An initial review and analysis for the Seven Southeast Asian Studies (7SEAS) program. Atmos. Res. 2013, 122, 403–468. [Google Scholar] [CrossRef]
  16. Kokhanovsky, A.A.; Davis, A.B.; Cairns, B.; Dubovik, O.; Hasekamp, O.P.; Sano, I.; Mukai, S.; Rozanov, V.V.; Litvinov, P.; Lapyonok, T.; et al. Space-based remote sensing of atmospheric aerosols: The multi-angle spectro-polarimetric frontier. Earth Sci. Rev. 2015, 145, 85–116. [Google Scholar] [CrossRef]
  17. Verma, S.; Prakash, D.; Soni, M.; Ram, K. Atmospheric aerosols monitoring: Ground and satellite-based instruments. In Advances in Environmental Monitoring and Assessment; IntechOpen: London, UK, 2019; pp. 67–80. [Google Scholar]
  18. Gupta, G.; Ratnam, M.V.; Madhavan, B.L.; Jayaraman, A. Global trends in the aerosol optical, physical, and morphological properties obtained using multi-sensor measurements. Atmos. Environ. 2023, 295, 119569. [Google Scholar] [CrossRef]
  19. Remer, L.A.; Knobelspiesse, K.; Zhai, P.W.; Xu, F.; Kalashnikova, O.V.; Chowdhary, J.; Hasekamp, O.; Dubovik, O.; Wu, L.; Ahmad, Z.; et al. Retrieving aerosol characteristics from the PACE mission, Part 2: Multi-angle and polarimetry. Front. Environ. Sci. 2019, 7, 94. [Google Scholar] [CrossRef]
  20. Holben, B.N.; Eck, T.F.; Slutsker, I.; Tanré, D.; Buis, J.P.; Setzer, A.; Vermote, E.; Reagan, J.A.; Kaufman, Y.J.; Nakajima, T. AERONET—A federated instrument network and data archive for aerosol characterization. Remote Sens. Environ. 1998, 66, 1–16. [Google Scholar] [CrossRef]
  21. Nakajima, T.Y.; Ohta, S. Significance of direct and indirect radiative forcings of aerosols in the East China Sea region. J. Geophys. Res. Atmos. 2003, 108, D23. [Google Scholar] [CrossRef]
  22. Dong, X.; Chen, B.; Yamazaki, A.; Shi, G.; Tang, N. Variations in aerosol optical characteristics from SKYNET measurements in Beijing. Atmos. Environ. 2023, 302, 119747. [Google Scholar] [CrossRef]
  23. Li, Z.Q.; Xu, H.; Li, K.T.; Li, D.H.; Xie, Y.S.; Li, L.; Zhang, Y.; Gu, X.F.; Zhao, W.; Tian, Q.J. Comprehensive study of optical, physical, chemical, and radiative properties of total columnar atmospheric aerosols over China: An overview of Sun–Sky Radiometer Observation Network (SONET) measurements. Bull. Am. Meteorol. Soc. 2018, 99, 739–755. [Google Scholar] [CrossRef]
  24. Dubovik, O.; King, M.D. A flexible inversion algorithm for retrieval of aerosol optical properties from Sun and sky radiance measurements. J. Geophys. Res. Atmos. 2000, 105, 20673–20696. [Google Scholar] [CrossRef]
  25. Giles, D.M.; Sinyuk, A.; Sorokin, M.G.; Schafer, J.S.; Smirnov, A.; Slutsker, I.; Eck, T.F.; Holben, B.N.; Lewis, J.R.; Campbell, J.R. Advancements in the Aerosol Robotic Network (AERONET) Version 3 database-automated near-real-time quality control algorithm with improved cloud screening for Sun photometer aerosol optical depth (AOD) measurements. Atmos. Meas. Tech. 2019, 12, 169–209. [Google Scholar] [CrossRef]
  26. Boiyo, R.; Kumar, K.R.; Zhao, T.; Guo, J. A 10-year record of aerosol optical properties and radiative forcing over three environmentally distinct AERONET sites in Kenya, East Africa. J. Geophys. Res. Atmos. 2019, 124, 1596–1617. [Google Scholar] [CrossRef]
  27. Hu, Y.; Kang, S.; Yang, J.; Ji, Z.; Rupakheti, D.; Yin, X.; Du, H. Impact of atmospheric circulation patterns on properties and regional transport pathways of aerosols over Central-West Asia: Emphasizing the Tibetan Plateau. Atmos. Res. 2022, 266, 105975. [Google Scholar] [CrossRef]
  28. El-Nadry, M.; Li, W.; El-Askary, H.; Awad, M.A.; Mostafa, A.R. Urban health related air quality indicators over the Middle East and North Africa countries using multiple satellites and AERONET data. Remote Sens. 2019, 11, 2096. [Google Scholar] [CrossRef]
  29. Liu, C.; Yang, L.; Che, H.; Xia, X.; Zhao, H.; Wang, H.; Gui, K.; Zheng, Y.; Sun, T.; Li, X. Aerosol optical properties over an urban site in Central China determined using ground-based sun photometer measurements. Aerosol Air Qual. Res. 2019, 19, 620–638. [Google Scholar] [CrossRef]
  30. Glantz, P.; Freud, E.; Johansson, C.; Noone, K.J.; Tesche, M. Trends in MODIS and AERONET derived aerosol optical thickness over Northern Europe. Tellus B Chem. Phys. Meteorol. 2019, 71, 1554414. [Google Scholar] [CrossRef]
  31. Eibedingil, I.G.; Gill, T.E.; van Pelt, R.S.; Tong, D.Q. Comparison of aerosol optical depth from MODIS product collection 6.1 and AERONET in the Western United States. Remote Sens. 2021, 13, 2316. [Google Scholar] [CrossRef]
  32. Gurjar, B.R.; Ravindra, K.; Nagpure, A.S. Air pollution trends over Indian megacities and their local-to-global implications. Atmos. Environ. 2016, 142, 475–495. [Google Scholar] [CrossRef]
  33. Kaur, R.R.; Luthra, A. Population growth, urbanization and electricity-Challenges and initiatives in the state of Punjab, India. Energy Strategy Rev. 2018, 21, 50–61. [Google Scholar] [CrossRef]
  34. Kumar, A. Spatio-temporal variations in satellite-based aerosol optical depths & aerosol index over Indian subcontinent: Impact of urbanization and climate change. Urban Clim. 2020, 32, 100598. [Google Scholar]
  35. Kumar, M.; Parmar, K.S.; Kumar, D.B.; Mhawish, A.; Broday, D.M.; Mall, R.K.; Banerjee, T. Long-term aerosol climatology over Indo-Gangetic Plain: Trend, prediction and potential source fields. Atmos. Environ. 2018, 180, 37–50. [Google Scholar] [CrossRef]
  36. Shukla, K.K.; Attada, R.; Sarangi, C.; Kunchala, R.K.; Devulapalli, V.P. Exploring the factors responsible for aerosol asymmetric trends over Indo-Gangetic Plain using remote sensing observations. J. Atmos. Sol. Terr. Phys. 2024, 258, 106220. [Google Scholar] [CrossRef]
  37. Krishna Moorthy, K.; Suresh Babu, S.; Manoj, M.R.; Satheesh, S.K. Buildup of aerosols over the Indian Region. Geophys. Res. Lett. 2013, 40, 1011–1014. [Google Scholar] [CrossRef]
  38. Kumar, A.; Pratap, V.; Kumar, S.; Singh, A.K. Atmospheric aerosols properties over Indo-Gangetic Plain: A trend analysis using ground–truth AERONET data for the year 2009–2017. Adv. Space Res. 2022, 69, 2659–2670. [Google Scholar] [CrossRef]
  39. Banerjee, T.; Murari, V.; Kumar, M.; Raju, M.P. Source apportionment of airborne particulates through receptor modeling: Indian scenario. Atmos. Res. 2015, 164, 167–187. [Google Scholar] [CrossRef]
  40. Singh, S.; Lodhi, N.K.; Mishra, A.K.; Jose, S.; Kumar, S.N.; Kotnala, R.K. Assessment of satellite-retrieved surface UVA and UVB radiation by comparison with ground-measurements and trends over Mega-city Delhi. Atmos. Environ. 2018, 188, 60–70. [Google Scholar] [CrossRef]
  41. Srivastava, A.K.; Dey, S.; Tripathi, S.N. Aerosol characteristics over the Indo-Gangetic basin: Implications to regional climate. Atmos. Aerosol Reg. Charact. Chem. Phys. 2012, 10, 47782. [Google Scholar]
  42. Srivastava, A.K.; Thomas, A.; Hooda, R.K.; Kanawade, V.P.; Hyvärinen, A.-P.; Bisht, D.S.; Tiwari, S. How secondary inorganic aerosols from Delhi influence aerosol optical and radiative properties at a downwind sub-urban site over Indo-Gangetic Basin? Atmos. Environ. 2021, 248, 118246. [Google Scholar] [CrossRef]
  43. Sharma, A.R.; Kharol, S.K.; Badarinath, K.V.S.; Singh, D. Impact of agriculture crop residue burning on atmospheric aerosol loading—A study over Punjab State, India. Ann. Geophys. 2010, 28, 367–379. [Google Scholar] [CrossRef]
  44. Kanawade, V.P.; Tripathi, S.N.; Chakraborty, A.; Yu, H. Chemical characterization of sub-micron aerosols during new particle formation in an urban atmosphere. Aerosol Air Qual. Res. 2020, 20, 1294–1305. [Google Scholar] [CrossRef]
  45. Ghude, S.D.; Chate, D.M.; Jena, C.; Beig, G.; Kumar, R.; Barth, M.C.; Pfister, G.G.; Fadnavis, S.; Pithani, P. Premature mortality in India due to PM2.5 and ozone exposure. Geophys. Res. Lett. 2016, 43, 4650–4658. [Google Scholar] [CrossRef]
  46. Prasad, A.K.; Singh, R.P. Changes in aerosol parameters during major dust storm events (2001–2005) over the Indo-Gangetic Plains using AERONET and MODIS data. J. Geophys. Res. Atmos. 2007, 112, D9. [Google Scholar] [CrossRef]
  47. Ramachandran, S.; Rupakheti, M. Trends in the types and absorption characteristics of ambient aerosols over the Indo-Gangetic Plain and North China Plain in last two decades. Sci. Total Environ. 2022, 831, 154867. [Google Scholar] [CrossRef]
  48. Nair, M.; Dey, S.; Bherwani, H.; Ghosh, A.K. Long-term changes in aerosol loading over the ‘BIHAR’ State of India using nineteen years (2001–2019) of high-resolution satellite data (1 × 1 km2). Atmos. Pollut. Res. 2022, 13, 101259. [Google Scholar] [CrossRef]
  49. Kaskaoutis, D.G.; Singh, R.P.; Gautam, R.; Sharma, M.; Kosmopoulos, P.G.; Tripathi, S.N. Variability and trends of aerosol properties over Kanpur, northern India using AERONET data (2001–2010). Environ. Res. Lett. 2012, 7, 024003. [Google Scholar] [CrossRef]
  50. Bibi, H.; Alam, K.; Blaschke, T.; Bibi, S.; Iqbal, M.J. Long-term (2007–2013) analysis of aerosol optical properties over four locations in the Indo-Gangetic plains. Appl. Opt. 2016, 55, 6199–6211. [Google Scholar] [CrossRef]
  51. Choudhry, P.; Misra, A.; Tripathi, S.N. Study of MODIS derived AOD at three different locations in the Indo Gangetic Plain: Kanpur, Gandhi College and Nainital. Ann. Geophys. 2012, 30, 1479–1493. [Google Scholar] [CrossRef]
  52. Varpe, S.R.; Kolhe, A.R.; Kutal, G.C.; Pawar, G.V.; Payra, S.; Budhavant, K.B.; Aher, G.R.; Devara, P.C.S. Heterogeneity in aerosol characteristics at the semi-arid and island AERONET observing sites in India and Maldives. Int. J. Remote Sens. 2018, 39, 6137–6169. [Google Scholar] [CrossRef]
  53. Dubovik, O.; Smirnov, A.; Holben, B.N.; King, M.D.; Kaufman, Y.J.; Eck, T.F.; Slutsker, I. Accuracy assessments of aerosol properties retrieved from Aerosol Robotic Network (AERONET) sun and sky radiance measurements. J. Geophys. Res. 2000, 105, 9791–9806. [Google Scholar] [CrossRef]
  54. Eck, T.F.; Holben, B.N.; Reid, J.S.; Dubovik, O.; Smirnov, A.; O’Neill, N.T.; Slutsker, I.; Kinne, S. Wavelength dependence of the optical depth of biomass burning, urban, and desert dust aerosols. J. Geophys. Res. Atmos. 1999, 104, 31333–31349. [Google Scholar]
  55. Smirnov, A.; Holben, B.N.; Eck, T.F.; Dubovik, O.; Slutsker, I. Cloud screening and quality control algorithms for the AERONET database. Remote Sens. Environ. 2000, 73, 337–349. [Google Scholar] [CrossRef]
  56. Draxler, R.R. Measuring and modeling the transport and dispersion of krypton-85 1500 km from a point source. Atmos. Environ. 1982, 16, 2763–2776. [Google Scholar] [CrossRef]
  57. Kulshrestha, U.; Kumar, B. Air mass trajectories and long-range transport of pollutants: Review of wet deposition scenario in South Asia. Adv. Meteorol. 2014, 2014, 596041. [Google Scholar] [CrossRef]
  58. Bella, D.; Culpepper, J.; Khaimova, J.; Ahmed, N.; Belkalai, A.; Arroyo, I.; Andrews, J.; Gentle, S.; Emmanuel, S.; Lahmouh, M.; et al. Characterization of pollution transport into Texas using OMI and TES satellite, GIS, in situ data, and HYSPLIT back trajectory analyses: Implications for TCEQ State Implementation Plans. Air Qual. Atmos. Health 2016, 9, 569–588. [Google Scholar] [CrossRef]
  59. Ma, Y.; Wang, M.; Wang, S.; Wang, Y.; Feng, L.; Wu, K. Air pollutant emission characteristics and HYSPLIT model analysis during the heating period in Shenyang, China. Environ. Monit. Assess. 2021, 193, 1–14. [Google Scholar] [CrossRef]
  60. Shan, M.; Wang, Y.; Lu, Y.; Liang, C.; Wang, T.; Li, L.; Li, R.Y.M. Uncovering PM2.5 transport trajectories and sources at district within city scale. J. Clean. Prod. 2023, 423, 138608. [Google Scholar] [CrossRef]
  61. Whitaker, J.S.; Hamill, T.M.; Wei, X.; Song, Y.; Toth, Z. Ensemble data assimilation with the NCEP global forecast system. Mon. Weather Rev. 2008, 136, 463–482. [Google Scholar] [CrossRef]
  62. Mann, H.B. Nonparametric tests against trend. Econom. J. Econom. Soc. 1945, 13, 245–259. [Google Scholar] [CrossRef]
  63. Kendall, M.G. Rank Correlation Methods, 4th ed.; Charles Griffin: London, UK, 1975. [Google Scholar]
  64. Srivastava, A.; Saran, S. Comprehensive study on AOD trends over the Indian subcontinent: A statistical approach. Int. J. Remote Sens. 2017, 38, 5127–5149. [Google Scholar] [CrossRef]
  65. Sayer, A.M.; Hsu, N.C.; Bettenhausen, C.; Jeong, M.J.; Meister, G. Effect of MODIS Terra radiometric calibration improvements on Collection 6 Deep Blue aerosol products: Validation and Terra/Aqua consistency. J. Geophys. Res. Atmos. 2015, 120, 12–157. [Google Scholar] [CrossRef]
  66. Filonchyk, M.; Yan, H.; Zhang, Z. Analysis of spatial and temporal variability of aerosol optical depth over China using MODIS combined Dark Target and Deep Blue product. Theor. Appl. Climatol. 2019, 137, 2271–2288. [Google Scholar] [CrossRef]
  67. Wang, Y.; Yuan, Q.; Li, T.; Shen, H.; Zheng, L.; Zhang, L. Evaluation and comparison of MODIS Collection 6.1 aerosol optical depth against AERONET over regions in China with multifarious underlying surfaces. Atmos. Environ. 2019, 200, 280–301. [Google Scholar] [CrossRef]
  68. Holben, B.N.; Tanré, D.; Smirnov, A.; Eck, T.F.; Slutsker, I.; Abuhassan, N.; Newcomb, W.W.; Schafer, J.S.; Chatenet, B.; Lavenu, F. An emerging ground-based aerosol climatology: Aerosol optical depth from AERONET. J. Geophys. Res. Atmos. 2001, 106, 12067–12097. [Google Scholar] [CrossRef]
  69. Kumar, K.R.; Narasimhulu, K.; Reddy, R.R.; Gopal, K.R.; Reddy, L.S.S.; Balakrishnaiah, G.; Moorthy, K.K.; Babu, S.S. Temporal and spectral characteristics of aerosol optical depths in a semi-arid region of southern India. Sci. Total Environ. 2009, 407, 2673–2688. [Google Scholar] [CrossRef]
  70. American Meteorological Society. Precipitable Water Vapor, Glossary of Meteorology. 2014. Available online: http://glossary.ametsoc.org/wiki/term (accessed on 8 November 2024).
  71. Khan, A.A.; Garsa, K.; Jindal, P.; Devara, P.C.S.; Tiwari, S.; Sharma, P.B. Demographic evaluation and parametric assessment of air pollutants over Delhi NCR. Atmosphere 2023, 14, 1390. [Google Scholar] [CrossRef]
  72. Saha, A.; Krishna Moorthy, K. Impact of precipitation on aerosol spectral optical depth and retrieved size distributions: A case study. J. Appl. Meteorol. 2004, 43, 902–914. [Google Scholar] [CrossRef]
  73. Garsa, K.; Khan, A.A.; Jindal, P.; Middey, A.; Luqman, N.; Mohanty, H.; Tiwari, S. Assessment of meteorological parameters on air pollution variability over Delhi. Environ. Monit. Assess. 2023, 195, 1315. [Google Scholar] [CrossRef]
  74. Kedia, S.; Ramachandran, S.; Holben, B.N.; Tripathi, S.N. Quantification of aerosol type, and sources of aerosols over the Indo-Gangetic Plain. Atmos. Environ. 2014, 98, 607–619. [Google Scholar] [CrossRef]
  75. Sarkar, S.; Kuttippurath, J.; Patel, V.K. Long-term changes in precipitable water vapour over India derived from satellite and reanalysis data for the past four decades (1980–2020). Environ. Sci. Atmos. 2023, 3, 749–759. [Google Scholar] [CrossRef]
  76. Singh, A.; Rastogi, N.; Sharma, D.; Singh, D. Inter and intra-annual variability in aerosol characteristics over northwestern Indo-Gangetic Plain. Aerosol. Air Qual. Res. 2015, 15, 376–386. [Google Scholar] [CrossRef]
  77. Ramachandran, S.; Srivastava, R.; Kedia, S.; Rajesh, T.A. Contribution of natural and anthropogenic aerosols to optical properties and radiative effects over an urban location. Environ. Res. Lett. 2012, 7, 034028. [Google Scholar] [CrossRef]
Figure 1. Map of the study area showing two sites in India: Kanpur (26.51° N, 80.23° E), marked with a red asterisk, and Gandhi College (25.87° N, 84.13° E), marked with a yellow asterisk.
Atmosphere 16 00321 g001
Figure 2. Boxplots displaying monthly mean AOD (500 nm) (a) at Kanpur and (b) at Gandhi College, and α440–870 at (c) Kanpur and (d) Gandhi College. The horizontal line within each box represents the monthly average values. Colors represent different seasons: red for summer, green for pre-monsoon, blue for monsoon, yellow for post-monsoon, and black for winter.
Atmosphere 16 00321 g002
Figure 3. Spectral variation of AOD (Avg. ± S.E) across different seasons and months at (a) Kanpur and (b) Gandhi College during the study period.
Atmosphere 16 00321 g003
Figure 4. Seasonal frequency distribution of AOD500 over Kanpur for (a) winter, (b) summer, (c) pre-monsoon, (d) monsoon, and (e) post-monsoon seasons.
Atmosphere 16 00321 g004
Figure 5. Seasonal frequency distribution of AOD500 over Gandhi College for (a) winter, (b) summer, (c) pre-monsoon, (d) monsoon, and (e) post-monsoon seasons.
Atmosphere 16 00321 g005
Figure 6. Seasonal frequency distribution of α440-870 over Kanpur for (a) winter, (b) summer, (c) pre-monsoon, (d) monsoon, and (e) post-monsoon seasons.
Atmosphere 16 00321 g006
Figure 7. Seasonal frequency distribution of α440-870 over Gandhi College for (a) winter, (b) summer, (c) pre-monsoon, (d) monsoon, and (e) post-monsoon seasons.
Atmosphere 16 00321 g007
Figure 8. Spectral variation of SSA (Mean. ± S.E) across different seasons at Kanpur and Gandhi College sites during the study period: (a) winter, (b) summer, (c) pre-monsoon, (d) monsoon, and (e) post-monsoon.
Atmosphere 16 00321 g008
Figure 9. Boxplots displaying monthly mean PW at (a) Kanpur and (b) Gandhi College. The horizontal line within each box represents the monthly average values. Colors represent different seasons: red for summer, green for pre-monsoon, blue for monsoon, yellow for post-monsoon, and black for winter.3.5. Long-Term Annual Trend Analysis.
Atmosphere 16 00321 g009
Table 1. Statistical parameters for regression analysis of annual and daily trends in aerosol properties at Kanpur (2001–2022) and Gandhi College (2006–2023). Statistically significant trends at the 95% confidence level (p < 0.05) are highlighted.
Kanpur (2001–2022)Gandhi College (2006–2023)
Mean ± S.ETrend/Year(%)pMean ± S.ETrend/Year(%)p
AOD
(500 nm)
0.67 ± 0.010.005677618.620.0010.72 ± 0.230.012321828.930.002
AE
(440–870 nm)
1.03 ± 0.020.009356320.060.00021.12 ± 0.020.009770014.410.025
PW2.60 ± 0.060.015639513.240.1043.30 ± 0.15−0.0484076−24.950.093
Kanpur (2001–2022)Gandhi College (2006–2023)
Mean ± S.E (N)Trend/Day(%)pMean ± S.E (N)Trend/Day(%)p
AOD
(500 nm)
0.67 ± 0.005 (5208)0.00002317.830.00000.74 ± 0.01 (3051)0.000064426.730.0000
AE
(440–870 nm)
1.03 ± 0.01 (5208)0.000029414.860.00001.15 ± 0.01 (3051)0.000061116.180.0000
PW2.61 ± 0.02 (5208)0.000052810.510.00003.31 ± 0.03 (3051)−0.000163−15.010.0000
SSA
(440 nm)
0.91 ± 0.001 (3916)0.00001225.280.00000.91 ± 0.001 (2193)0.00000872.100.0000
SSA
(675 nm)
0.92 ± 0.001 (3916)0.00001154.880.00000.92 ± 0.001 (2193)0.00000370.880.001
SSA
(870 nm)
0.92 ± 0.001 (3916)0.00001014.320.00000.92 ± 0.001 (2193)−0.0000039−0.930.004
SSA
(1020 nm)
0.92 ± 0.001 (3916)0.00000672.870.00000.91 ± 0.001 (2193)−0.000011−2.640.0000
Table 2. Statistical parameters for regression analysis of seasonal mean aerosol properties at Kanpur (2001–2022) and Gandhi College (2006–2023). Statistically significant trends at the 95% confidence level (p < 0.05) are highlighted. (N = number of available observation days during the study period).
Kanpur (2001–2022)
Winter
Gandhi College (2006–2023)
Winter
Mean ± S.E (N)Trend/Day(%)pMean ± S.E (N)Trend/Day(%)p
AOD
(500 nm)
0.74 ± 0.014
(1382)
0.000176833.150.0010.95 ± 0.02
(630)
0.000271918.100.0021
AE
(440–870 nm)
1.25 ± 0.009
(1382)
0.00002983.290.411.30 ± 0.01
(630)
−0.0000522−2.530.15
PW1.30 ± 0.019
(1382)
−0.0000746−7.960.451.44 ± 0.02
(630)
0.00018718.170.09
SSA
(440 nm)
0.91 ± 0.001
(1096)
0.00004705.660.00000.91 ± 0.001
(499)
0.00001140.620.20
SSA
(675 nm)
0.91 ± 0.001
(1096)
0.00006307.570.00000.92 ± 0.001
(499)
0.00001040.560.28
SSA
(870 nm)
0.89 ± 0.001
(1096)
0.00006407.850.00000.90 ± 0.002
(499)
−0.0000113−0.620.30
SSA
(1020 nm)
0.89 ± 0.002
(1096)
0.00005466.740.00000.89 ± 0.002
(499)
−0.0000385−2.140.002
SummerSummer
Mean ± S.E (N)Trend/Day(%)pMean ± S.E (N)Trend/Day(%)p
AOD
(500 nm)
0.50 ± 0.01
(972)
0.000071113.800.00080.59 ± 0.01
(628)
0.000154816.50<0.0022
AE
(440–870 nm)
0.76 ± 0.01
(972)
0.000187923.900.00000.97 ± 0.01
(628)
0.000315320.490.0000
PW1.82 ± 0.02
(972)
0.000314616.760.00002.13 ± 0.03
(628)
0.00001770.590.92
SSA
(440 nm)
0.88 ± 0.001
(827)
0.00003903.650.00000.87 ± 0.002
(541)
0.00002511.550.01
SSA
(675 nm)
0.92 ± 0.001
(827)
0.00004203.790.00000.90 ± 0.002
(541)
0.00003752.240.0000
SSA
(870 nm)
0.92 ± 0.001
(827)
0.00003803.420.00000.91 ± 0.002
(541)
0.00002741.630.006
SSA
(1020 nm)
0.92 ± 0.001
(827)
0.0000232.060.00000.91 ± 0.002
(541)
0.00001781.160.11
Pre-MonsoonPre-Monsoon
Mean (N) ± S.ETrend/Day(%)pMean ± S.E (N)Trend/Day(%)p
AOD
(500 nm)
0.72 ± 0.01
(957)
0.00001011.34 0.720.78 ± 0.01
(711)
0.000182716.750.0009
AE
(440–870 nm)
0.64 ± 0.01
(957)
0.000580086.430.00000.95 ± 0.01
(711)
0.000434932.570.0000
PW3.47 ± 0.04
(957)
0.00033909.360.0184.12 ± 0.04
(711)
0.00007861.350.71
SSA
(440 nm)
0.89 ± 0.001
(739)
0.0000504.120.00000.89 ± 0.002
(548)
0.00002831.720.001
SSA
(675 nm)
0.93 ± 0.001
(739)
0.00001000.790.0530.92 ± 0.002
(548)
0.00000510.300.56
SSA
(870 nm)
0.94 ± 0.001
(739)
−0.0000030−0.240.0540.92 ± 0.002
(548)
−0.0000103−0.610.28
SSA
(1020 nm)
0.95 ± 0.001
(739)
−0.0000178−1.390.00040.93 ± 0.002
(548)
−0.0000323−1.910.0007
MonsoonMonsoon
Mean ± S.E (N)Trend/Day(%)pMean ± S.E (N)Trend/Day(%)p
AOD
(500 nm)
0.57 ± 0.01
(940)
0.000084013.870.0130.58 ± 0.01
(684)
0.000327938.750.0000
AE
(440–870 nm)
1.12 ± 0.01
(940)
0.000306725.830.00001.28 ± 0.01
(684)
0.00011276.040.01
PW5.14 ± 0.03
(940)
0.00058879.360.00005.71 ± 0.03
(684)
−0.0004171−4.990.0003
SSA
(440 nm)
0.94 ± 0.002
(442)
0.0001376.420.00000.95 ± 0.002
(295)
0.00000290.090.85
SSA
(675 nm)
0.95 ± 0.002
(442)
0.0001034.810.00000.94 ± 0.003
(295)
0.00000930.290.63
SSA
(870 nm)
0.94 ± 0.002
(442)
0.0000602.810.00000.94 ± 0.004
(295)
−0.0000035−0.110.86
SSA
(1020 nm)
0.94 ± 0.003
(442)
0.0000291.360.010.94 ± 0.004
(295)
−0.0000203−0.640.32
Post-MonsoonPost-Monsoon
Mean ± S.E (N)Trend/Day(%)pMean ± S.E (N)Trend/Day(%)p
AOD
(500 nm)
0.80 ± 0.01
(957)
0.000228927.320.00000.84 ± 0.02
(406)
0.00055626.900.0032
AE
(440–870 nm)
1.29 ± 0.01
(957)
0.00007885.860.00001.35 ± 0.01
(406)
0.0001344.040.021
PW1.99 ± 0.03
(957)
−0.0001243−5.990.162.55 ± 0.06
(406)
−0.001283−20.410.002
SSA
(440 nm)
0.90 ± 0.001
(812)
0.0000504.470.00000.91 ± 0.002
(310)
0.00003651.240.026
SSA
(675 nm)
0.91 ± 0.001
(812)
0.00005705.060.00000.92 ± 0.002
(310)
0.00002580.870.067
SSA
(870 nm)
0.90 ± 0.001
(812)
0.00004103.680.00000.90 ± 0.002
(310)
−0.0000361−1.240.039
SSA
(1020 nm)
0.90 ± 0.001
(812)
0.00001861.680.00020.89 ± 0.002
(310)
−0.0001081−3.740.0000
Table 3. Statistical parameters for regression analysis of daily mean aerosol properties at Kanpur (2001–2011, 2012–2022) and Gandhi College (2006–2014, 2015–2023). Statistically significant trends at the 95% confidence level (p < 0.05) are highlighted. (N denotes the number of available observation days during the study period).
Kanpur (2001–2011)Kanpur (2012–2022)
Mean ± S.E (N)Trend/Day(%)pMean ± S.E (N)Trend/Day(%)p
AOD
(500 nm)
0.64 ± 0.01
(2536)
0.000040416.080.00000.70 ± 0.01
(2672)
0.00001355.120.084
AE
(440–870 nm)
0.98 ± 0.01
(2536)
0.00003448.930.00031.08 ± 0.01
(2672)
0.000044911.090.0000
PW2.55 ± 0.03
(2536)
0.0000919.050.0052.68 ± 0.03
(2672)
0.000158415.820.00000
SSA
(440 nm)
0.89 ± 0.001
(1638)
0.00002594.760.00000.92 ± 0.001
(2278)
0.0000081.990.0000
SSA
(675 nm)
0.91 ± 0.001
(1638)
0.00003446.200.00000.93 ± 0.001
(2278)
0.00000711.740.0000
SSA
(870 nm)
0.90 ± 0.001
(1638)
0.00003115.630.00000.93 ± 0.001
(2278)
0.00000711.750.0000
SSA
(1020 nm)
0.91 ± 0.001
(1638)
0.00002314.170.00000.92 ± 0.001
(2278)
0.00000621.530.0000
Gandhi College (2006–2014)Gandhi College (2015–2023)
Mean ± S.E (N)Trend/Day(%)pMean ± S.E (N)Trend/Day(%)p
AOD
(500 nm)
0.68 ± 0.01
(1258)
0.000080514.980.0080.78 ± 0.01
(1793)
0.000072316.700.0000
AE
(440–870 nm)
1.08 ± 0.01
(1258)
0.00001962.290.431.20 ± 0.01
(1793)
0.00005317.900.0000
PW3.47 ± 0.05
(1258)
−0.0008584−31.090.00003.20 ± 0.04
(1793)
0.00000730.410.91
SSA
(440 nm)
0.90 ± 0.002
(764)
0.00001271.080.030.91 ± 0.001
(1429)
0.00000010.020.97
SSA
(675 nm)
0.91 ± 0.001
(764)
0.00001271.060.030.92 ± 0.001
(1429)
−0.0000079−1.220.0002
SSA
(870 nm)
0.92 ± 0.002
(764)
0.00001511.260.020.92 ± 0.001
(1429)
−0.0000154−2.400.0000
SSA
(1020 nm)
0.92 ± 0.002
(764)
0.00000460.380.500.91 ± 0.001
(1429)
−0.0000231−3.630.0000
Disclaimer/Publisher’s Note: The statements, opinions and data contained in all publications are solely those of the individual author(s) and contributor(s) and not of MDPI and/or the editor(s). MDPI and/or the editor(s) disclaim responsibility for any injury to people or property resulting from any ideas, methods, instructions or products referred to in the content.

