Article

How Have Emissions and Weather Patterns Contributed to Air Pollution in Lanzhou, China?

Key Laboratory for Semi-Arid Climate Change of the Ministry of Education, College of Atmospheric Sciences, Lanzhou University, Lanzhou 730000, China
*
Author to whom correspondence should be addressed.
Atmosphere 2025, 16(3), 314; https://doi.org/10.3390/atmos16030314
Submission received: 19 January 2025 / Revised: 16 February 2025 / Accepted: 7 March 2025 / Published: 10 March 2025
(This article belongs to the Section Air Quality)

Abstract

:
Air quality is predominantly influenced by two factors: emission sources and meteorological conditions. Understanding their relative contribution is essential for developing effective air pollution control strategies. Two rounds of lockdown measures in Lanzhou during the winter of 2021 and 2022 offered a valuable opportunity to reveal the impact of pollutant emissions and meteorological conditions on air pollution events. The reduction in emissions during the pandemic lockdown period (2021–2022) resulted in a 36.05% decrease in PM2.5 concentrations compared to the historical period of 2014–2020. Using ERA5 reanalysis meteorological data and principal component analysis, weather patterns were classified into three distinct types: favorable for pollutant accumulation (FPA), unfavorable for pollutant accumulation (NFP), and neutral condition (NTL). A comparative analysis of pollutant concentrations, frequency, and duration of each weather type during the lockdown and historical periods revealed that weather types had a minimal impact on pollutant levels, with emissions serving as the dominant factor. Nevertheless, the occurrence of FPA was often linked to severe pollution events, suggesting a positive feedback loop between severe pollution and FPA weather type. This indicated that FPA can lead to severe pollution events and more severe pollution may be associated with prolonged FPA durations. These findings suggest that identifying FPA weather patterns can significantly inform the implementation of air pollution control measures to mitigate air pollution levels.

1. Introduction

Air pollution poses significant risks not only to human health [1,2], but also to ecosystems [3] and climate systems [4,5]. Two primary factors contribute to the occurrence of air pollution: emissions from various sources and the atmospheric ‘self-cleaning’ ability [6,7]. Emissions arise from industrial activities, transportation methods like motor vehicles and airplanes, and any other combustion of fossil fuels, all of which result in the release of significant pollutants, including carbon monoxide, nitrogen oxides, sulfur oxides, and volatile organic compounds. Meteorological conditions can also influence the dispersion and removal of air pollution. Under stable atmospheric conditions, pollutants may be trapped close to the surface, thereby increasing pollution levels [8]. Accurate assessment of the contributions from both emission sources and meteorological factors is crucial. The lockdown measures implemented during the COVID-19 pandemic provide a unique opportunity to gain insights into this complex issue.
The COVID-19 pandemic triggered lockdown measures globally, leading to significant changes in the atmospheric environment. These lockdown measures restricted human activities and industrial production, resulting in a reduction in pollutant concentrations during the lockdown period [9,10]. Notably, pollutant concentrations significantly decreased in various regions of China, including Guangzhou, Wuhan, and northern China [11,12,13]. Bao [14] further pointed out that during the 2021 COVID-19 lockdown, human activities in 44 Chinese cities decreased by 69.85%, leading to a reduction in multiple pollutant concentrations. This was not only the case in China; similar reductions in pollutant concentrations and surface temperatures were observed in India and other regions during the lockdown [15,16,17,18]. In addition to ground-based observations, Marlier [19] confirmed the declines in concentrations of multiple pollutants during the lockdown period using a combination of satellite data, ground-based observations, and modeling. Although lockdowns led to a reduction in some pollutants, this did not mean that all pollutants decreased. Research has found that in some areas, ozone concentrations actually increased during the lockdown period [20,21]. While pollutant concentrations declined in the short term during the lockdown, the long-term effects need further investigation [22]. The reduction in pollutant concentrations also had certain effects on people’s health [23]. Moreover, the lockdown measures during the pandemic had an impact on other diseases as well [24,25].
The relationship between meteorological conditions and air pollutions is a hot topic that has been extensively studied. Chambers [26] revealed a strong correlation between increased pollutant concentrations in central Poland and weather conditions characterized by a stable nocturnal boundary layer. Similarly, in central China, the presence of high-pressure systems and southwestern low-pressure troughs leads to a relatively stable weather pattern, which impedes the dispersion of local pollutant concentrations [27]. This suggests that meteorological conditions can be categorized into distinct weather patterns. Zhang [28] employed principal component analysis (PCA) to examine variations in atmospheric visibility and pollutant concentrations under different weather patterns in Beijing and identified the weather patterns that promote the dispersion of pollutants. Similarly, Li [29] employed PCA to categorize five typical weather patterns in the Beijing–Tianjin–Hebei and Yangtze River Delta regions, finding that cold high-pressure systems originating from Xinjiang and Mongolia significantly affect local air quality. Miao [30] also adopted PCA, considering the structure of the planetary boundary layer, to analyze changes in pollutant concentrations under varying weather conditions. PCA has been extended to explore the circulation patterns that promote particulate pollution in North China and the Yangtze River Delta [29,31].
Lanzhou, an industrial metropolis in northwestern China, is located within a narrow and elongated river valley in the Yellow River basin. This particular geographical configuration enhances the likelihood of the formation of inversion layers, especially under clear and windless weather conditions, thereby creating obstacles for the dispersion of pollutants [32,33]. In response to the COVID-19 pandemics, Lanzhou implemented a series of lockdowns from early 2020 to the end of 2022, aimed at curbing the spread of the virus. These lockdown measures included traffic control, restriction on the entry and exit of vehicles from residential areas, and a limitation on the number of vehicles on the roads. Wang [34] reported that these traffic control strategies led to a more than 25% reduction in PM2.5 concentrations in Lanzhou during the pandemic. The study also revealed an obvious reduction in aerosol concentrations and an overall alleviation of atmospheric pollution during the lockdown periods. Furthermore, Lanzhou experienced two distinct lockdown periods: the first was from 22 October 2021 to 4 November 2021 and the second was from 1 October 2022 to 31 November 2022. The similarity in timing for these lockdowns within the calendar year provides a sufficient sample size for comparative analysis between lockdown and non-lockdown conditions, while controlling for similar meteorological conditions. Overall, the unique geographical configuration of Lanzhou and the resultant changes in air quality due to the pandemic-related lockdowns present an ideal scenario for evaluating the relative contributions of emission sources and meteorological factors to air pollution. This assessment is particularly relevant in light of the marked improvements in air quality observed during the pandemic’s restrictions, which were substantial and noteworthy.
In this study, we assessed the impact of pandemic-induced lockdowns on air pollution by comparing the pollutant concentrations during periods with and without lockdown alongside the prevailing weather conditions. First, we classified the weather patterns based on the wind fields and corresponding geopotential heights. Second, we examined the effect of each weather pattern on air quality and elucidated the role of lockdown measures in mitigating air pollution under similar meteorological conditions. Finally, we explored the interaction between weather conditions and air pollution. Section 2 outlines the data and method employed in this study. Section 3 presents the results along with comprehensive discussions. Section 4 concludes the study.

2. Data and Method

2.1. Air Quality Data

The air quality data applied here were sourced from the Ministry of Environmental Protection (MEP) of China, which are accessible through the following link: https://quotsoft.net/air/ (accessed on 8 March 2024). The MEP has been releasing hourly concentrations of six key pollutants since January 2013, including sulfur dioxide (SO2), nitrogen dioxide (NO2), fine particulate matter with a diameter of 2.5 μm or less (PM2.5), particulate matter with a diameter of 10 μm or less (PM10), carbon monoxide (CO), and ozone (O3). These data have been widely utilized in previous studies [29]. PM2.5 concentrations are measured using both the micro-oscillating balance and the β absorption method. The observational network, which initially covered 74 Chinese cities in 2013, expanded to 190 cities in 2014, and has consistently covered 367 cities since 2015. Each city within this network consists of multiple monitoring sites, with a majority of the sites situated in urban areas.
Lanzhou, encompassing five districts and three counties, is monitored by a network of five atmospheric environmental observation stations strategically located within the urban and rural population centers. Specifically, a station is located in Xigu District of Lanzhou, where influenced predominantly by emissions from the Lanzhou Petrochemical Company, including volatile organic compounds (VOCs), sulfur dioxide (SO2), benzene derivatives, and nitrogen oxides (NOx). Anning District, a hub of high-tech industry, mainly emits VOCs and dust from metro and road construction activities. The station in Qilihe District is influenced by diesel truck emissions (black carbon, NOx) and emissions from some chemical industries. The station in Chengguan District, the urban core, is impacted by high vehicle density, which generates significant amounts of NOx and PM2.5. Lastly, Heping County, which has absorbed part of the city’s industrial relocation, is home to industries such as building materials (cement, concrete), biomedicine, and food processing. These industries contribute to dust, VOCs, wastewater, and seasonal PM2.5 and CO emissions, exacerbated by rural activities like straw burning and livestock farming (ammonia emissions).
The surrounding areas of Lanzhou have fewer industrial activities and less anthropogenic pollution. The primary external pollution sources come from long-distance dust storms in the northwest, including regions like the Tarim Basin in Xinjiang, the deserts of Inner Mongolia, the Qaidam Basin in Qinghai, and southwestern Mongolia. In winter, dust storms are less frequent due to snowfall and frozen soil, which reduces the impact of dust from surrounding areas [35]. Our research mainly focuses on particulate matter, specifically PM2.5, and its relationship with meteorological factors. Atmospheric stability directly affects the diffusion efficiency of PM2.5 by controlling the intensity of vertical turbulence. Unstable stratification promotes the dilution of pollutants, while stable stratification leads to severe pollution. Ozone and other nitrogen oxides participate in photochemical reactions; they are not solely influenced by meteorological factors. Therefore, PM2.5 is considered to be more representative, and we primarily discuss the relationship between PM2.5 and weather conditions.
Centralized heating is the primary heating method in Lanzhou, accounting for approximately 82% of the total heating area. The area served by combined heat and power (CHP) is about 53 million square meters, accounting for around 37%; the area served by natural gas central heating is about 67 million square meters, accounting for 47%. Clean energy heating, including efficient coal powder, geothermal sources, air sources, and electric heating, accounts for approximately 16%. In recent years, Lanzhou has fully promoted a “clean heating” policy, with over 98% of coal-fired boilers eliminated in the urban area, being replaced by natural gas, combined heat and power, and waste heat utilization. Chengguan, Qilihe, and Anning districts mainly rely on natural gas, while Xigu District uses waste heat from Lanzhou Petrochemical and the Fanjiaoping Combined Heat and Power Plant. However, in some remote areas, such as Heping Town, dispersed coal heating is still used.
In this study, hourly pollution concentration data for PM2.5 and PM10 in Lanzhou were used during the months of October and November from 2014 to 2022. The pollution concentration data were averaged on a daily basis so as to be consistent with the temporal scale of weather pattern classification.

2.2. Meteorological Data

The fifth-generation ECMWF (European Centre for Medium-Range Weather Forecasts) atmospheric reanalysis (ERA5) was used herein for meteorological analysis (ERA5 provides hourly real-time atmospheric reanalysis data, including both pressure and single-layer meteorological variables, such as temperature, precipitation, wind speed, humidity, cloud cover, and atmospheric pressure, among other parameters). The horizontal spatial resolution of ERA5 is 0.25° × 0.25°, accompanied by a vertical distribution of 37 pressure layers. We utilized the geopotential height, meridional wind, zonal wind, temperature, specific humidity, and relative humidity at multiple vertical levels to categorize the weather patterns and to analyze their impacts on the dispersion of pollutants.

2.3. Weather Pattern Classification

To evaluate the contribution of meteorological conditions on air pollution, we utilized Principal Components Analysis (PCA) to categorize weather patterns in Lanzhou into distinct types and to identify conditions that are conducive to or inhibit the accumulation of pollutants. Huth et al. [36] compared various objective weather classification methods and pointed out that the T-mode principal component analysis (PCA) method can accurately reflect the characteristics of the original circulation field, without significant changes due to adjustments in the classification objects, thereby obtaining a stable spatiotemporal circulation field. Therefore, this study uses the weather objective classification software developed by the EU COST 733 project (https://git.rz.uni-augsburg.de/philipan/cost733class-1.4.git, accessed on 8 March 2025), which is based on the T-mode principal component analysis method. This method decomposes the 850 hPa geopotential height field and horizontal wind (U and V) using multivariate oblique rotation. In this study, we utilized the obliquely rotated Principal Components in T-mode (T-PCA) method from the cost733class software package, designed for creating, comparing, and evaluating classifications in several variants. The input data are spatially standardized in accordance with the methodology described by Li et al. [29].

3. Results

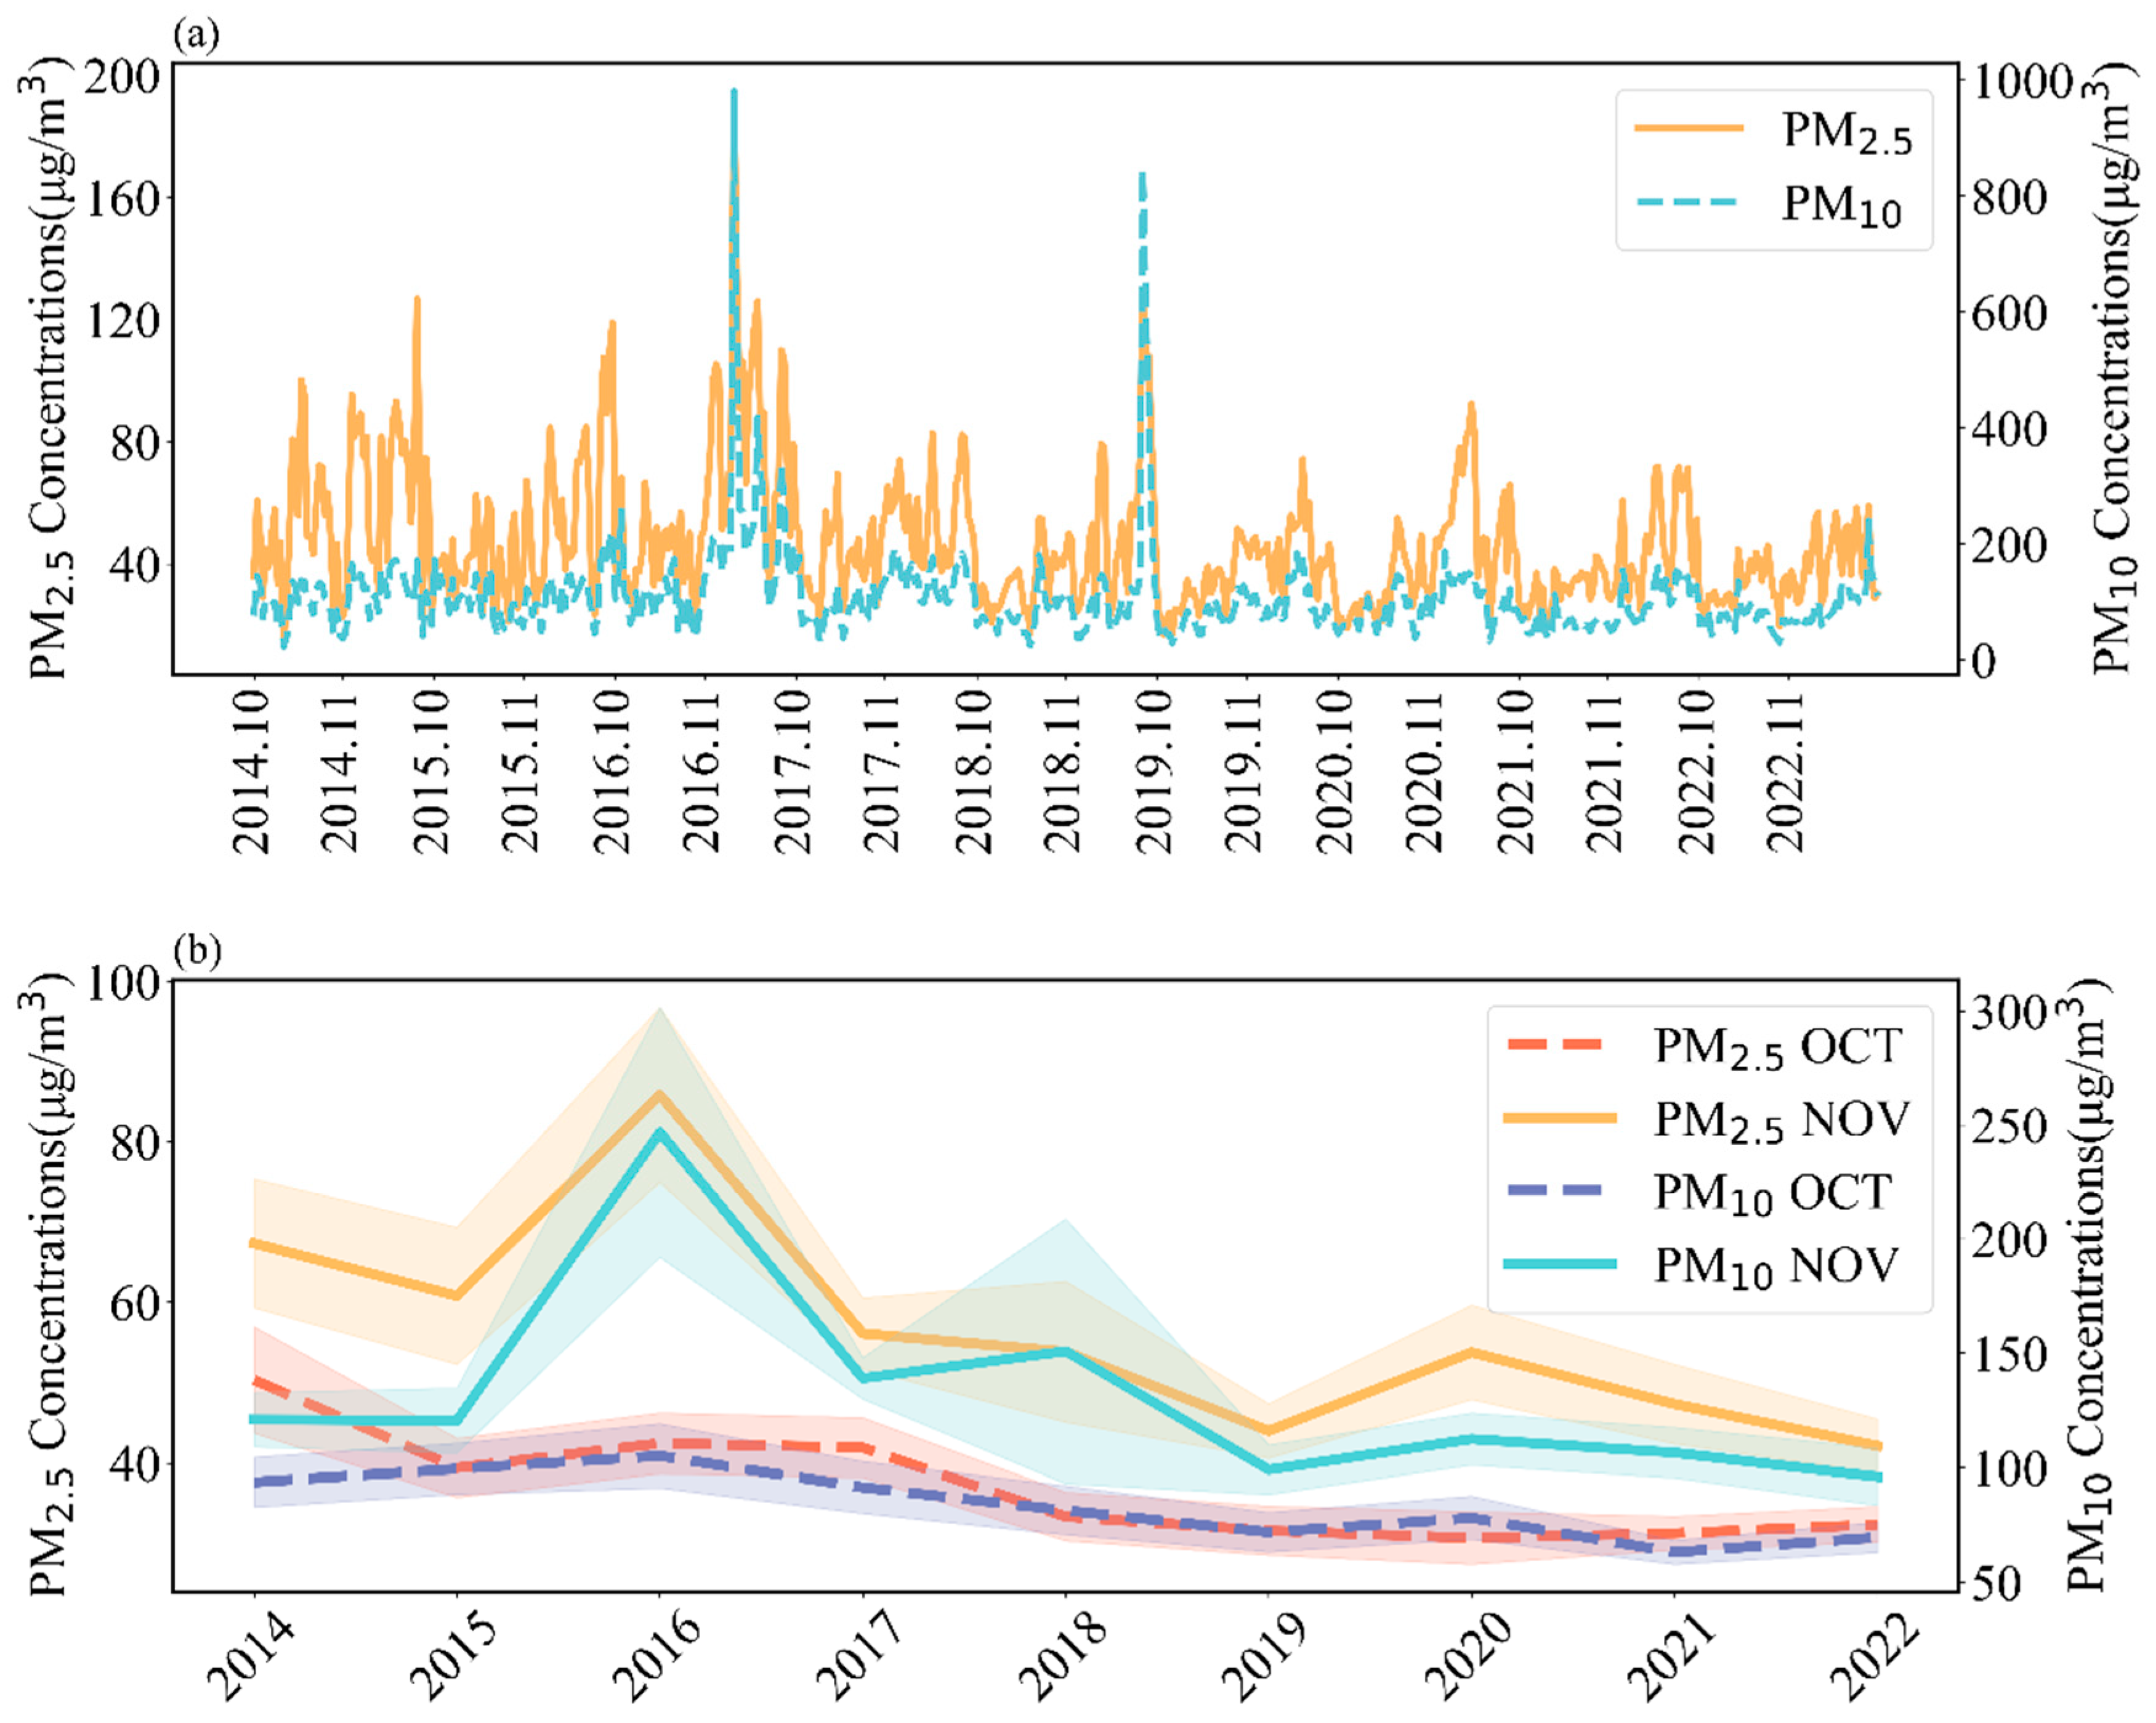
3.1. Long-Term Variation in Air Pollution

Figure 1a,b present the time series of PM2.5 and PM10 concentrations in Lanzhou from 2014 to 2022, displayed on a daily and monthly basis, respectively. The blue and orange lines denote PM10 and PM2.5, respectively. The daily mean concentrations of PM10 and PM2.5 are 107.735 μg/m3 and 46.771 μg/m3, respectively, with similar daily variation. It suggests that both PM10 and PM2.5 are influenced by consistent emission sources and meteorological conditions. Notably, two exceptional peaks in PM10 (>800 μg/m3) can be attributed to extraordinary dust storms, as confirmed by data from ground-based meteorological stations. A close examination reveals that the daily variations of PM10 and PM2.5 in November were consistently higher than those in October each year, which correlates with the onset of comprehensive heating in Lanzhou starting in November [37]. During the heating period, residents use large amounts of coal as a heating fuel, directly emitting a significant amount of particulate matter. Additionally, the frequent occurrence of temperature inversion in winter makes it difficult for pollutants to disperse vertically [38]. Figure 1b further reveals that concentrations in November were generally higher than those in October, with increasing trends observed prior to 2016, followed by a decrease in both months. This turning point may result from a series of environmental protection measures implemented during this period [39]. The decline in air quality starting from 2016 was mainly due to the city’s full implementation of the “clean heating” policy, with over 98% of coal-fired boilers in the urban area eliminated and replaced by natural gas, combined heat and power, and waste heat utilization [38]. During the winter of 2020, as no confirmed cases of COVID-19 were reported, Lanzhou did not implement a city-wide lockdown. Thus, the high values in November 2020 are understandable. The stringent implementation of various aerosol pollution control policies has rendered the reduction in aerosol optical thickness in the Lanzhou region foreseeable.
During the pandemic, Lanzhou implemented strict lockdown, control, and low-risk area management measures in the main urban areas of Chengguan, Qilihe, Xigu, and Anning districts. High-risk areas followed a “stay-at-home” policy, medium-risk areas enforced “no one leaves the area” regulations, and low-risk areas allowed only one entrance per residential community, with strict entry and exit pass management. Public buses and rail transit adjusted their departure frequencies, reduced operating loops, and suspended certain routes. In medium-risk areas, some bus routes bypassed stations, cross-regional bus lines were suspended, and rail transit schedules were adjusted. Educational institutions, including universities, vocational schools, primary and secondary schools, and kindergartens, were under closed management, with no unrelated personnel allowed on campus. Residential communities citywide were under closed management, unnecessary entry and exit points were closed, and all persons entering or leaving had to wear masks and register.
The lockdown measures implemented during the COVID-19 pandemic also played a significant role in the decline of pollutant levels from 2020 to 2022. Compared to 2020, the concentrations of PM10 in October 2021 and 2022 decreased by 14.98 μg/m3 and 8.50 μg/m3, respectively. Similarly, in November 2021 and 2022, PM2.5 (PM10) concentrations decreased by 6.43 μg/m3 (5.92 μg/m3) and 11.64 μg/m3 (16.37 μg/m3), respectively. This pronounced decline indicates that, regardless of the implementation of centralized heating, pandemic-related lockdown measures will result in a significant reduction in the concentration of atmospheric pollutants [40]. In addition, to ensure that pollutant concentrations during the pandemic were indeed lower compared to historical periods, we performed a t-test on the PM10 and PM2.5 pollutant data, and both passed the significance test at the 0.01 level.

3.2. Classification of Weather Patterns

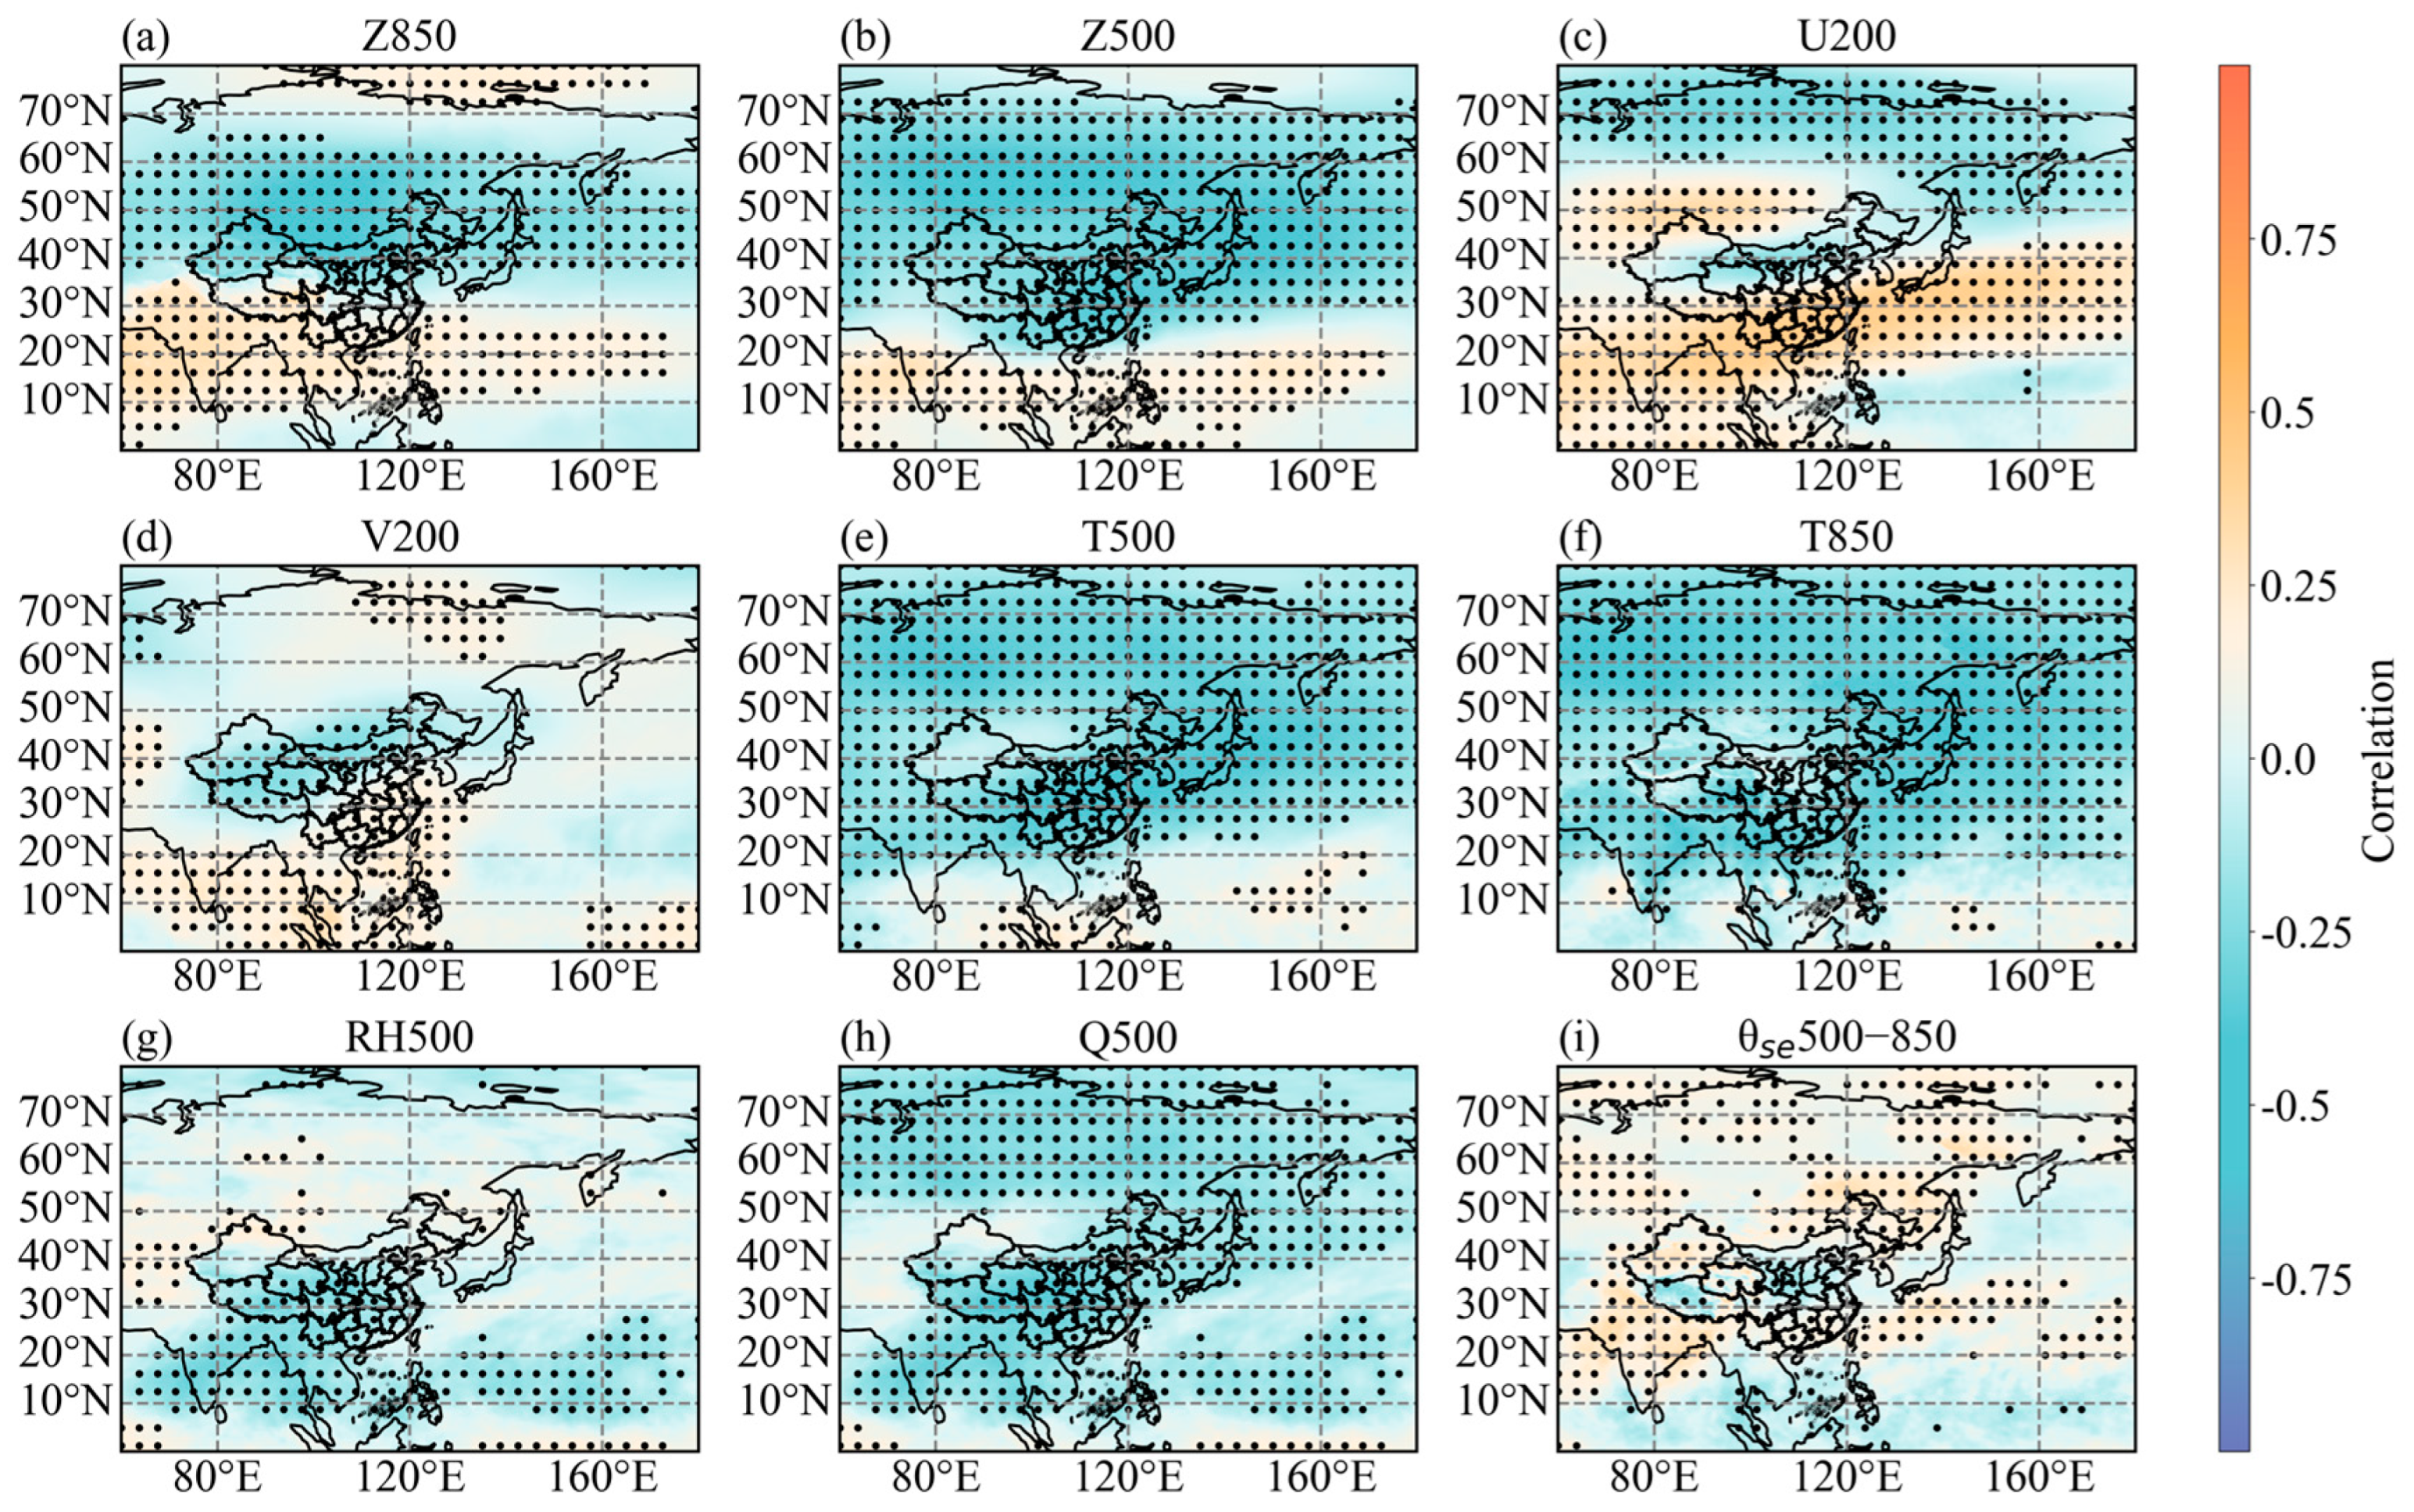
3.2.1. Meteorological Fields

Except for the emission from diverse sources, air pollution is significantly modulated by synoptic conditions, which are typically characterized by parameters such as geopotential heights (Z), temperature (T), and relative humidity (RH). Li et al. [31] identified strong correlations between air pollution in North China and synoptic parameters, including the zonal flow of the upper troposphere at 200 hPa, the geopotential heights at 500 hPa and 850 hPa, the meridional low at 850 hPa, the vertical difference in the temperature anomalies between 850 hPa and 250 hPa, and the relative humidity at 1000 hPa. To elucidate the relationship between synoptic patterns and PM2.5 concentrations in the Lanzhou region, dynamical meteorological fields derived from the ERA5 reanalysis were employed. This analysis aims to isolate meteorological variables that exhibit a robust correlation with PM2.5 levels in Lanzhou. The correlation between meteorological factors and pollutants is a common approach, but the meteorological factors that are significantly related to pollutants vary across different regions. Therefore, we used the same approach and selected meteorological parameters based on Lanzhou’s specific conditions. Ultimately, the meteorological parameters we chose were different from those in Li et al. [31]. Others have used different methods, such as creating a composite index from various meteorological parameters [41] to represent whether the current weather corresponds to FPA or not. We believe that the meteorological fields provide more detailed information than weather indices, and they are better at indicating whether the weather type favors pollutant accumulation or not.
The geopotential heights at 500 hPa (Z500) and 850 hPa (Z850) illustrate fundamental atmospheric circulation patterns that are closely linked to the weather systems affecting pollutant accumulation. For both Z850 and Z500, a significant positive correlation (0.30~0.37) with PM2.5 concentrations was observed in southern China, while a pronounced negative correlation (−0.48~−0.46) was found in northern China. The transition boundaries between positive and negative correlation coefficients are different, with Z850’s boundary at approximately 35° N and Z500’s at around 20° N (Figure 2a,b).
The zonal (U200) and meridional (V200) winds at 200 hPa show the position and strength of East Asia Jet, which is closely associated with the synoptic systems influencing pollutant accumulation. The correlation between U200 and PM2.5 concentrations at Lanzhou shows a pattern of alternating positive and negative correlations from the south to the north. There is a broad positive correlation (~0.44) to the south of 30° N, followed by a significant negative correlation between 30° N and 45° N, transitioning to a positive correlation in the northwest of China at about 45–55° N, and finally a broad negative correlation to the north of 60° N. Similarly, the correlation coefficients between V200 and PM2.5 concentrations at Lanzhou show a positive and negative alternating pattern from the south to north in the region west of 130° E. This includes a broad positive correlation (~0.34) in the southeast of China and then a significant negative correlation from the west to the northeast of China, as well as a broad positive correlation to the north of 60° N.
The temperature at 500 hPa (T500) and 850 hPa (T850) exhibited a pronounced negative correlation with PM2.5 concentrations across the entire study region, with only slight positive correlations over marine areas (Figure 2e,f). Both the relative humidity (RH850) and specific humidity at 850 hPa (Q850) presented a similar pattern, which is also a marked negative correlation across the entire region, with only slight positive correlations noted in a few localized areas (Figure 2h,g).
The vertical difference in equivalent potential temperature between 500 and 850 hPa, denoted as θse500–850, is a measure of the atmospheric stability and has a great impact on the diffusion and dispersion of air pollutants. It presented a significant positive correlation with PM2.5 across the majority of regions, with some spots of negative coefficients in the inland regions of China (Figure 2i).
The analysis above indicates a strong correlation between several variables and PM2.5 concentrations. Notably, U200, V200, Z500, and Z850 displayed pronounced positive and negative fluctuations in their correlation with PM2.5. While other variables also displayed a correlation with PM2.5, their fluctuations were less pronounced. This indicates that the meteorological factors influence air quality in Lanzhou by changing large-scale circulations. In light of previous research that used U200, Z500, and V850 for weather pattern classification action, albeit in different regions, these variables serve as a relevant benchmark [31]. Therefore, we ultimately selected U200, V200, Z500, and Z850 as the four variables for weather pattern classification. We also examined the correlation between PM10 and meteorological variables, and since the results were similar, we limited our presentation to the results related to PM2.5.

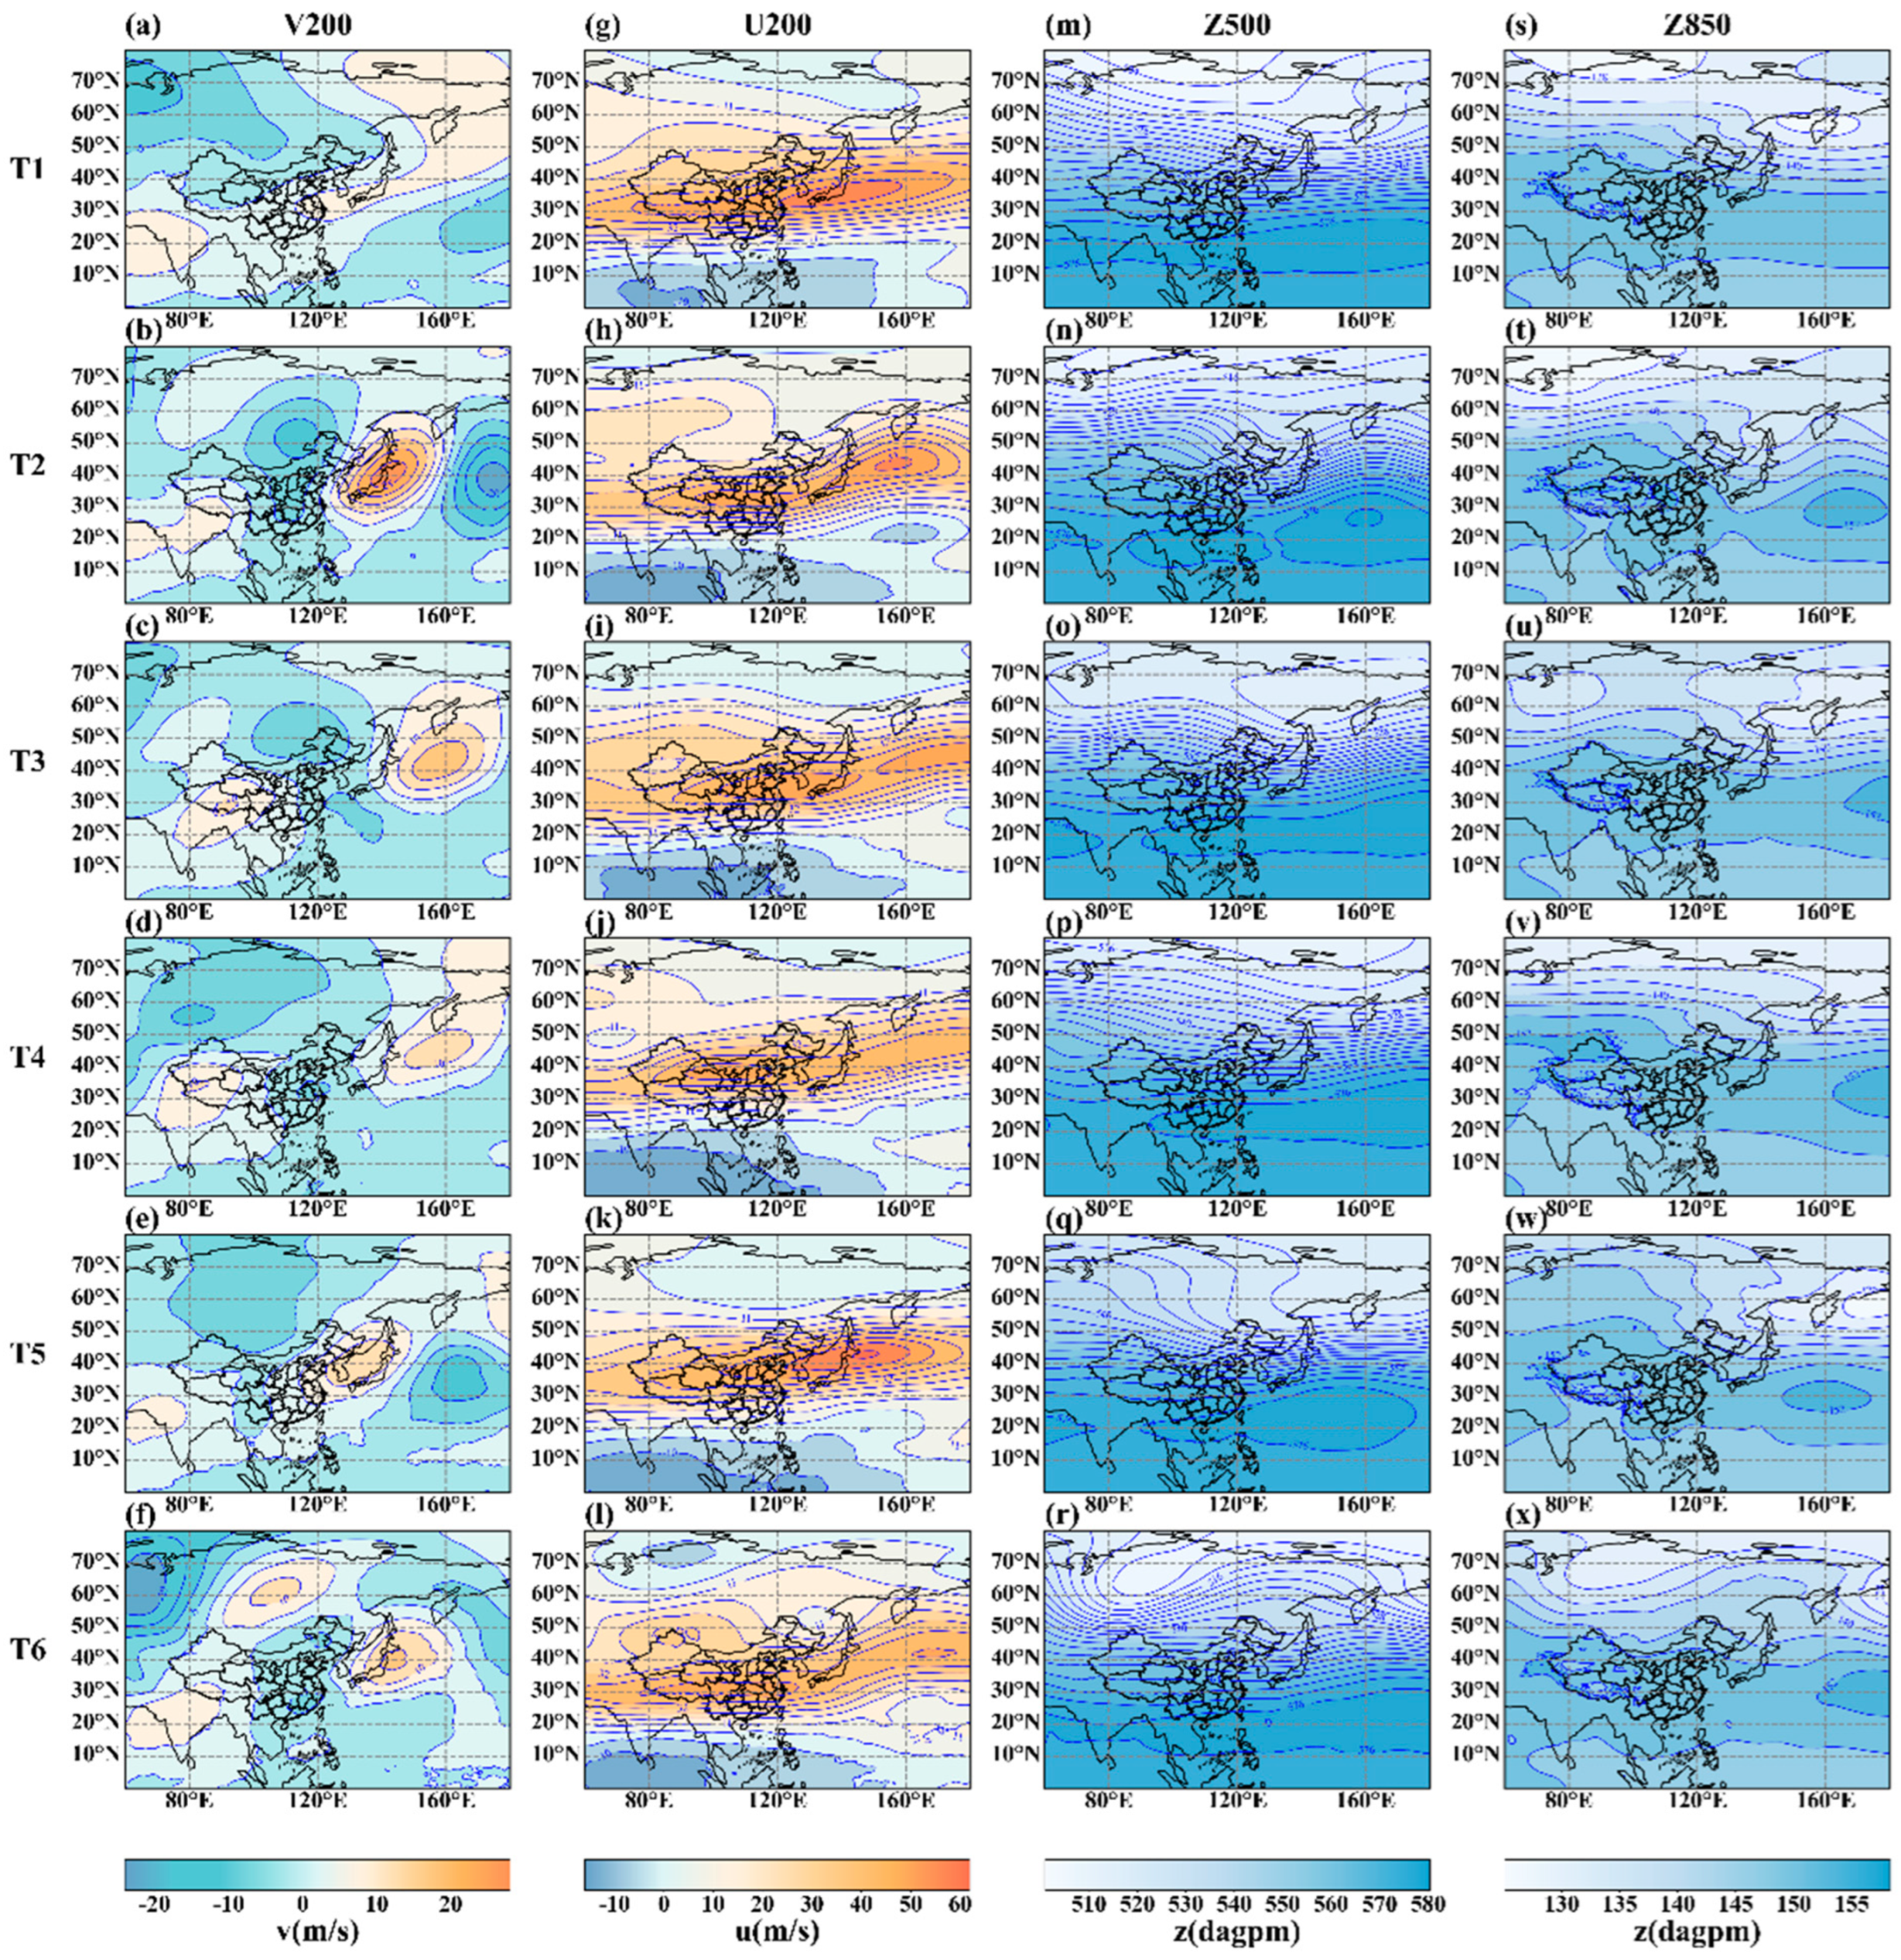
3.2.2. Weather Patterns

Principal component analysis, described in Section 2.3, was utilized to classify weather patterns in October and November from 2014 to 2022 into six types (T1–T6) using the meteorological parameters U200, V200, Z500, and Z850. The total number of patterns analyzed was 549, with T1, T2, T3, T4, T5, and T6 occurring 226, 89, 88, 73, 56, and 17 times, respectively. Under T1 and T3 conditions, PM 2.5 presents significant positive anomalies of 7.74 μg/m3 and 10.95 μg/m3, respectively. Conversely, T4 displayed a significant negative anomaly of −16.2 μg/m3. T2, T5, and T6 had smaller anomalies, ranging from −6.4 μg/m3 to −5.8 μg/m3 (Figure 3). The two weather patterns with highly positive anomalies, T1 and T3, were identified as favorable for pollutant accumulation (FPA). T4, with its highly negative anomaly, was defined as unfavorable for pollutant accumulation (NFP). The neutral impact on pollutant levels by T2, T5, and T6 was attributed to their minimal anomalies, collectively referred to as the neutral condition (NTL).
Following the identification of weather patterns favorable or unfavorable for pollutant accumulation, the associated meteorological fields were examined. Figure 4 illustrates the meteorological fields for each weather pattern, employing standardized conventions for isopleth representation, including contour intervals and central values, as well as recognized guidelines for identifying areas based on troughs, ridges, and other relevant meteorological features. The predominant weather systems affecting Lanzhou during winter include northwesterly airflow from cold Siberia and warm, moist airflow from the south. The northwesterly airflow brings arid and cold air, resulting in decreased temperatures and windy conditions in Lanzhou. When the southern airflow meets the cold air in Lanzhou, it results in snowy or rainy weather. Both northwesterly and southern airflow contribute to air cleaning in Lanzhou. However, the robust Siberian High over Lanzhou brings stable, clear weather, albeit at the cost of lower temperatures and phenomena such as smog.
T1 and T3 weather patterns are classified as FPA (favorable for pollutant accumulation). For both T1 and T3, anomalies in Z500 and Z850 are predominantly negative across most of China, with T1 exhibiting particularly negative values (Figure 4m,s). This indicates a stable air mass from the north, potentially influenced by the Siberian High, which controls the region and brings stable weather conditions to Lanzhou. Given Lanzhou’s basin topography, the boundary layer is prone to trapping pollutants. U200 and V200, which indicate the position and intensity of the subtropical jet stream, can transport momentum from the upper layer to the surface layer, potentially leading to weather events. For T1, the jet stream center is located in the East Sea of China, and for T3, the jet stream strength is weak (Figure 4a,g). Consequently, wind in the boundary layer of Lanzhou is minimal, facilitating pollutant accumulation. Under these conditions of weak upper-level winds and stable geopotential heights, along with the valley terrain, pollutants in Lanzhou were difficult to disperse, exacerbating pollution levels in the city.
In contrast, for the T4 weather pattern, anomalies of Z500 and Z850 are positive across most of China, suggesting a warm and moist air mass from the south that controls the region and transports water vapor over Lanzhou (Figure 4n,t). U200 and V200 show a significant wind shear at about 35°N, just above Lanzhou. The T4 weather pattern can lead to significant weather events at Lanzhou, aiding in the removing of pollutants (Figure 4b,h).

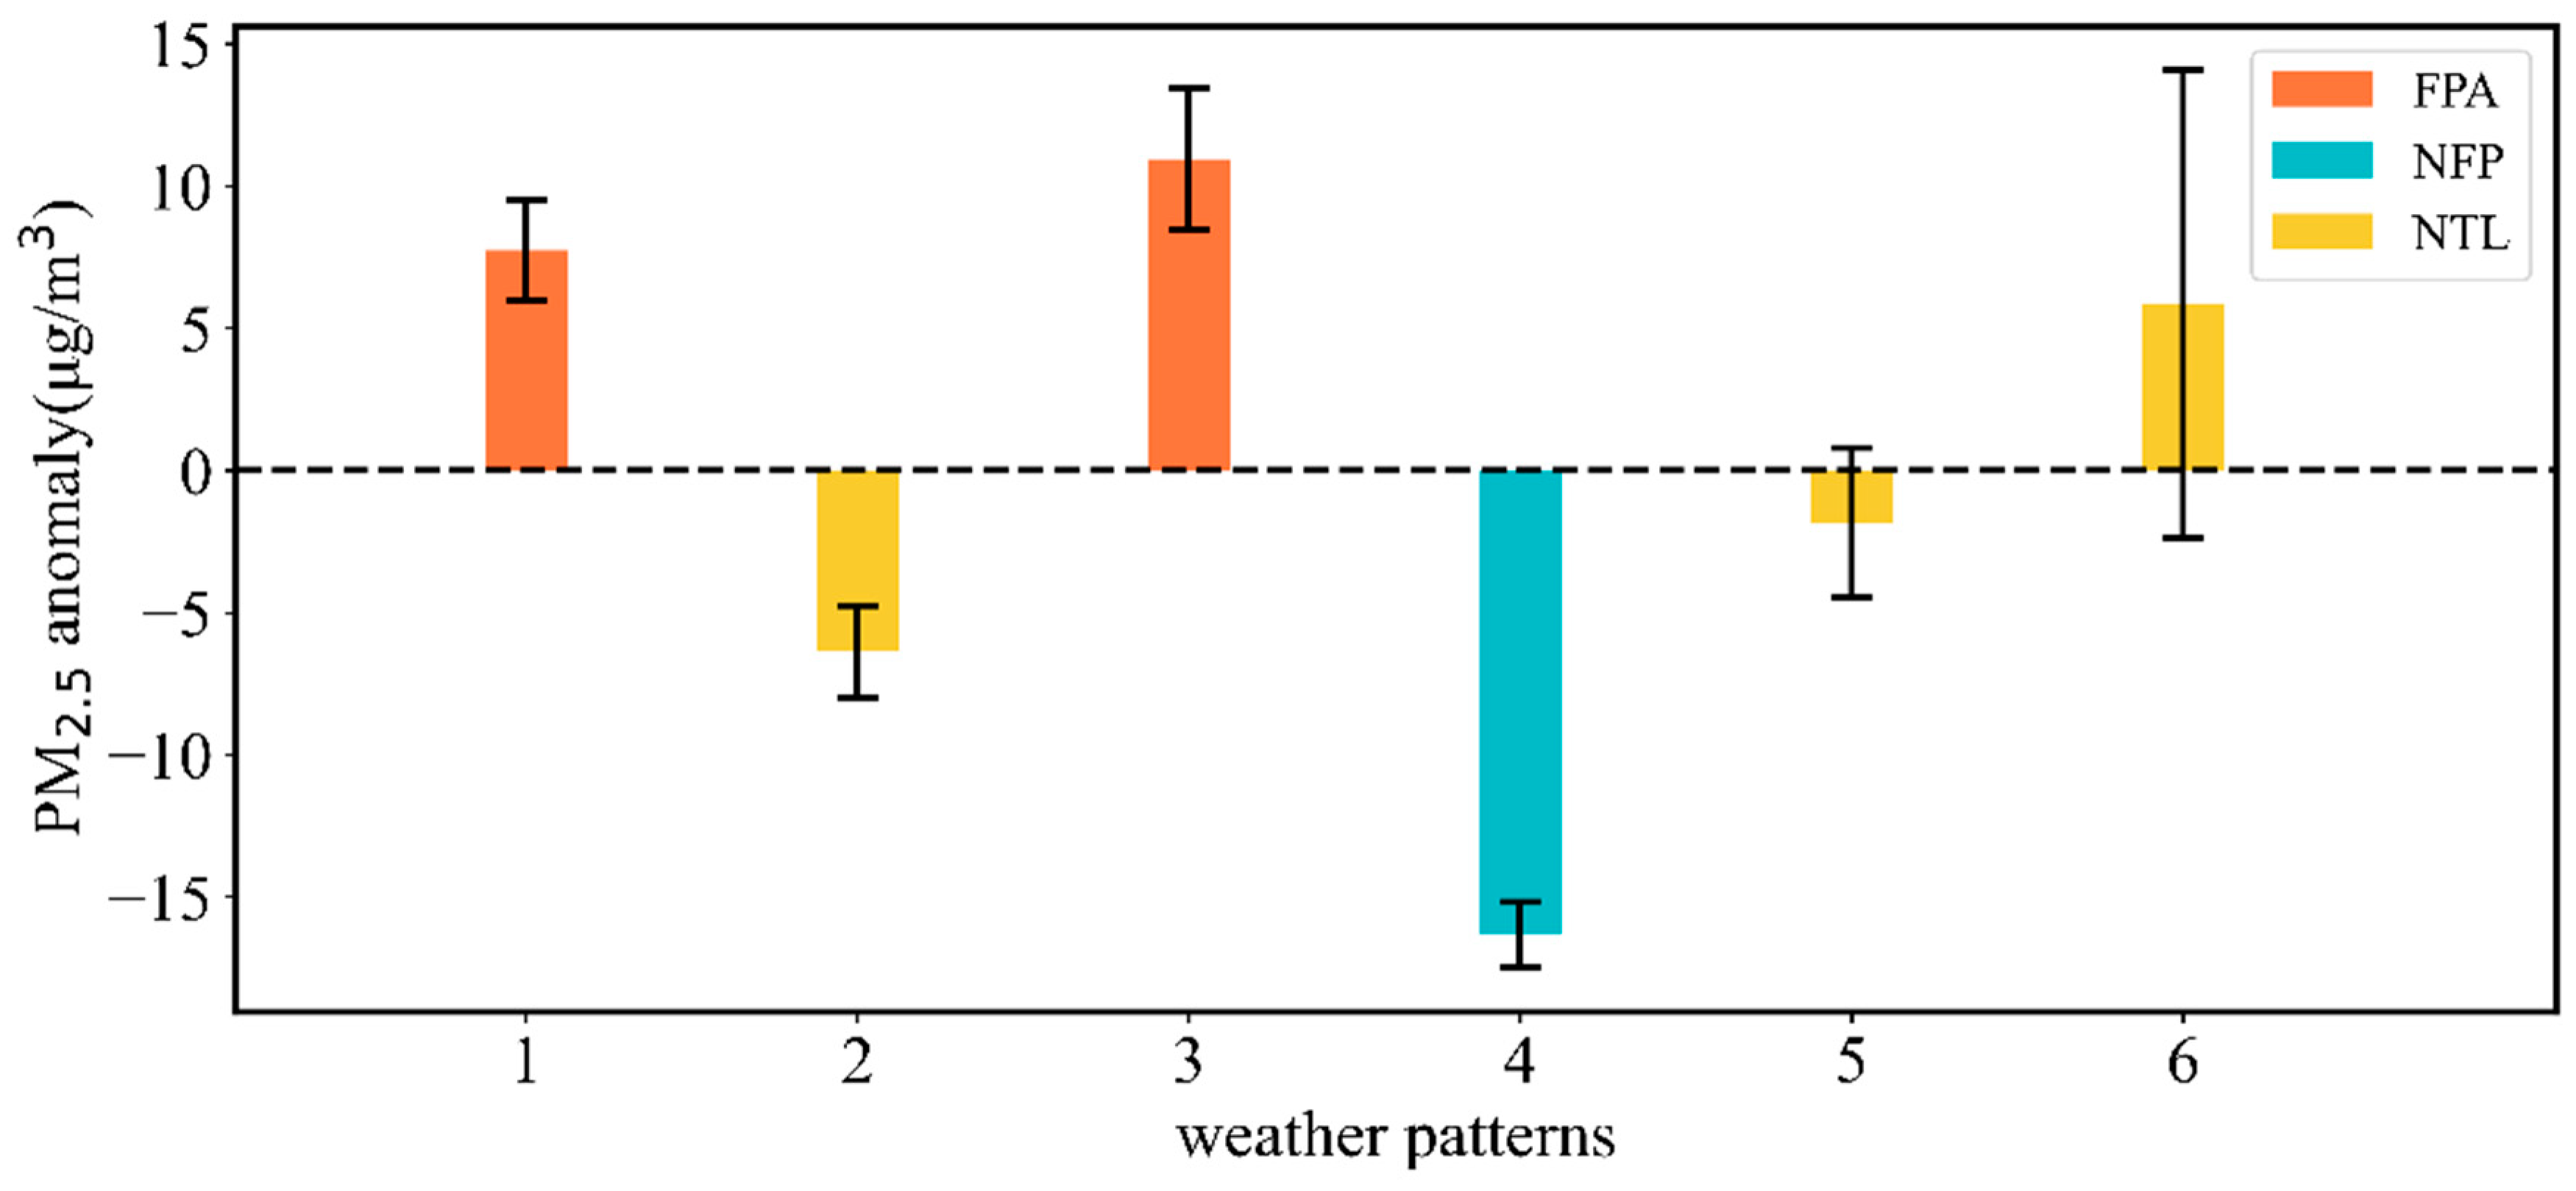
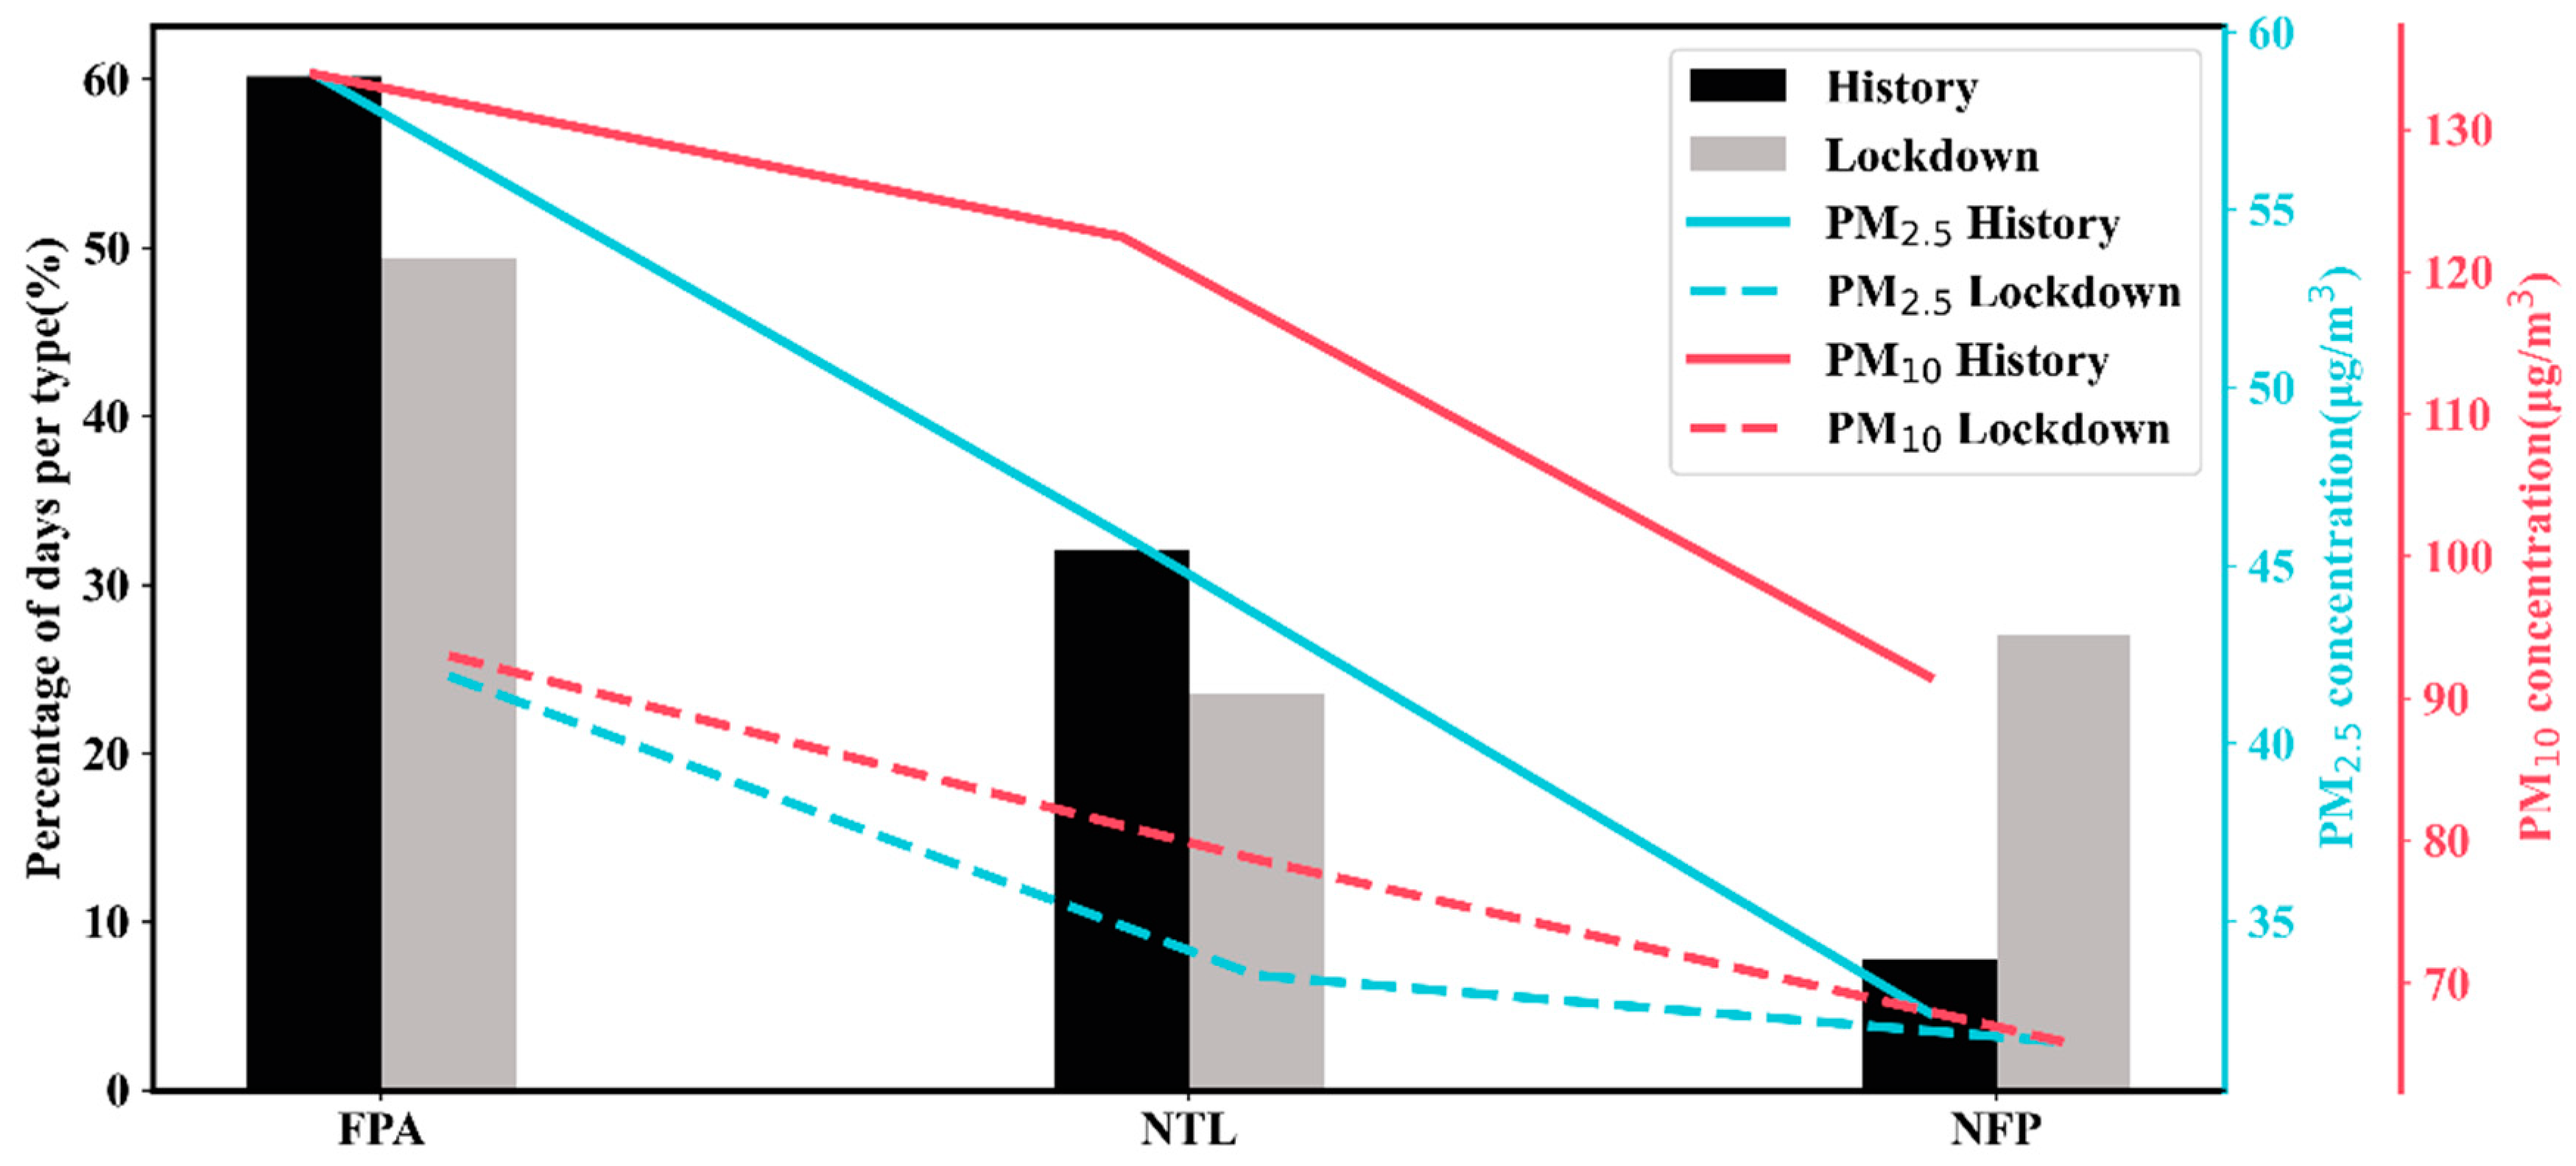
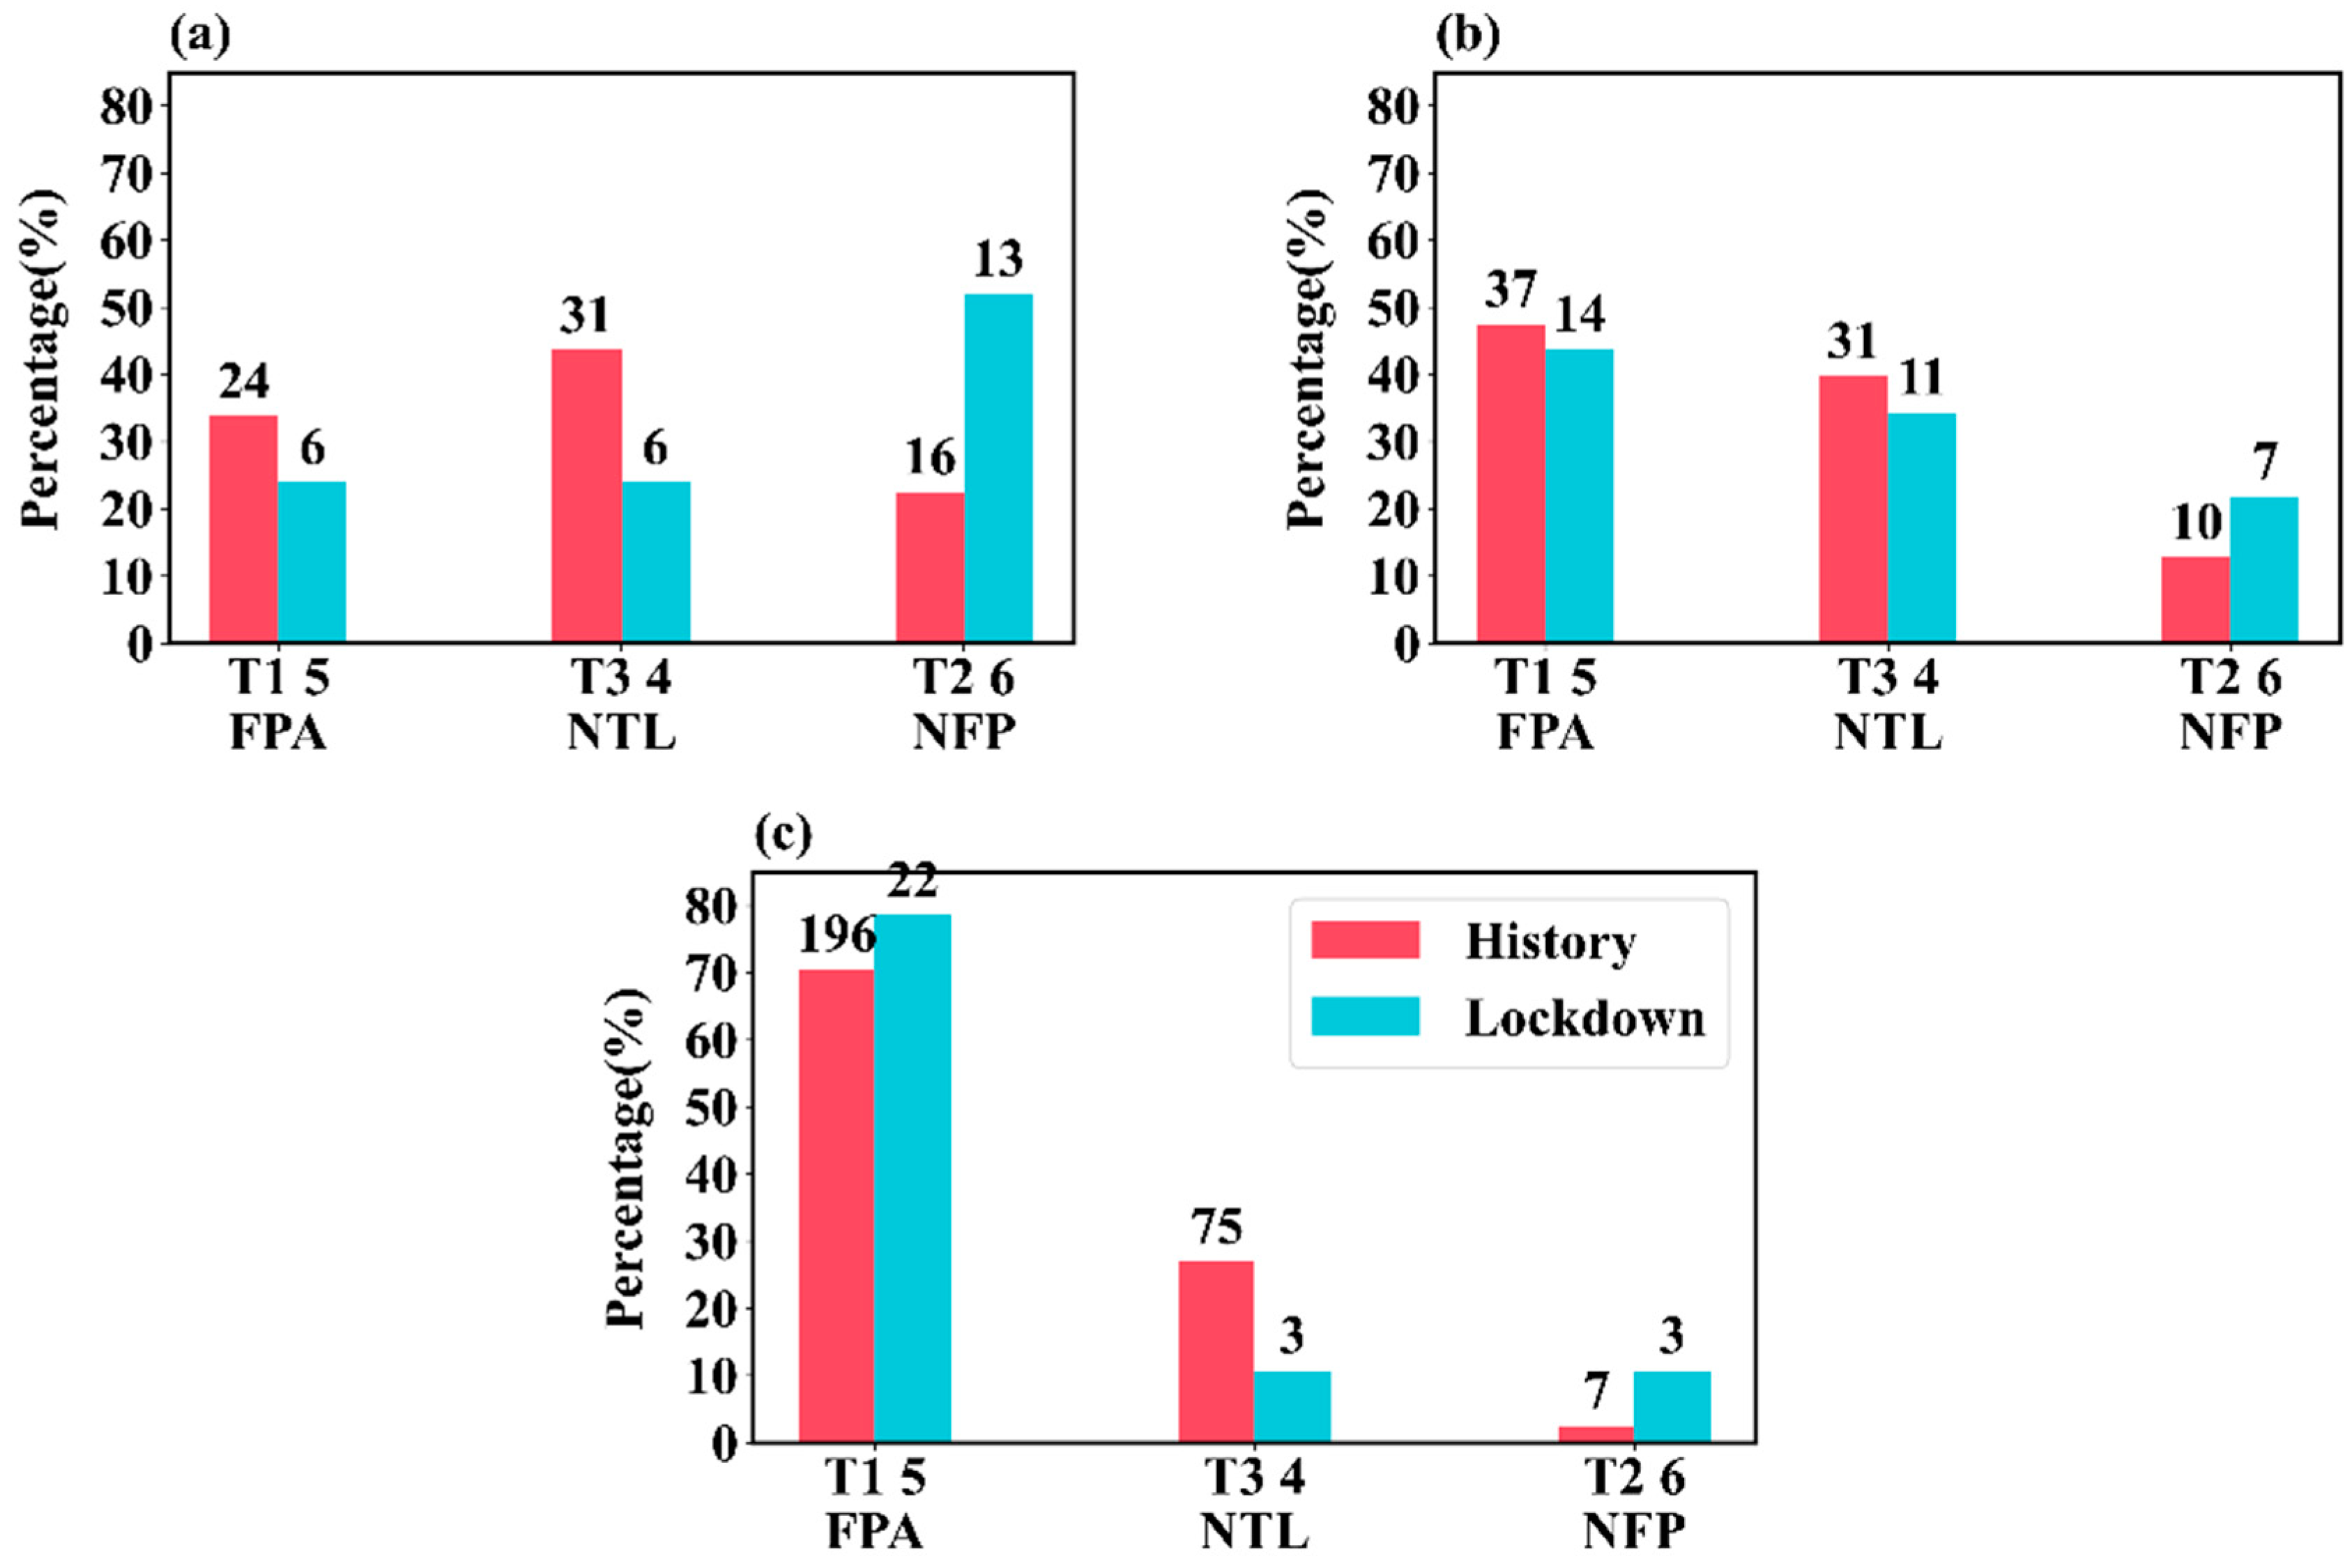
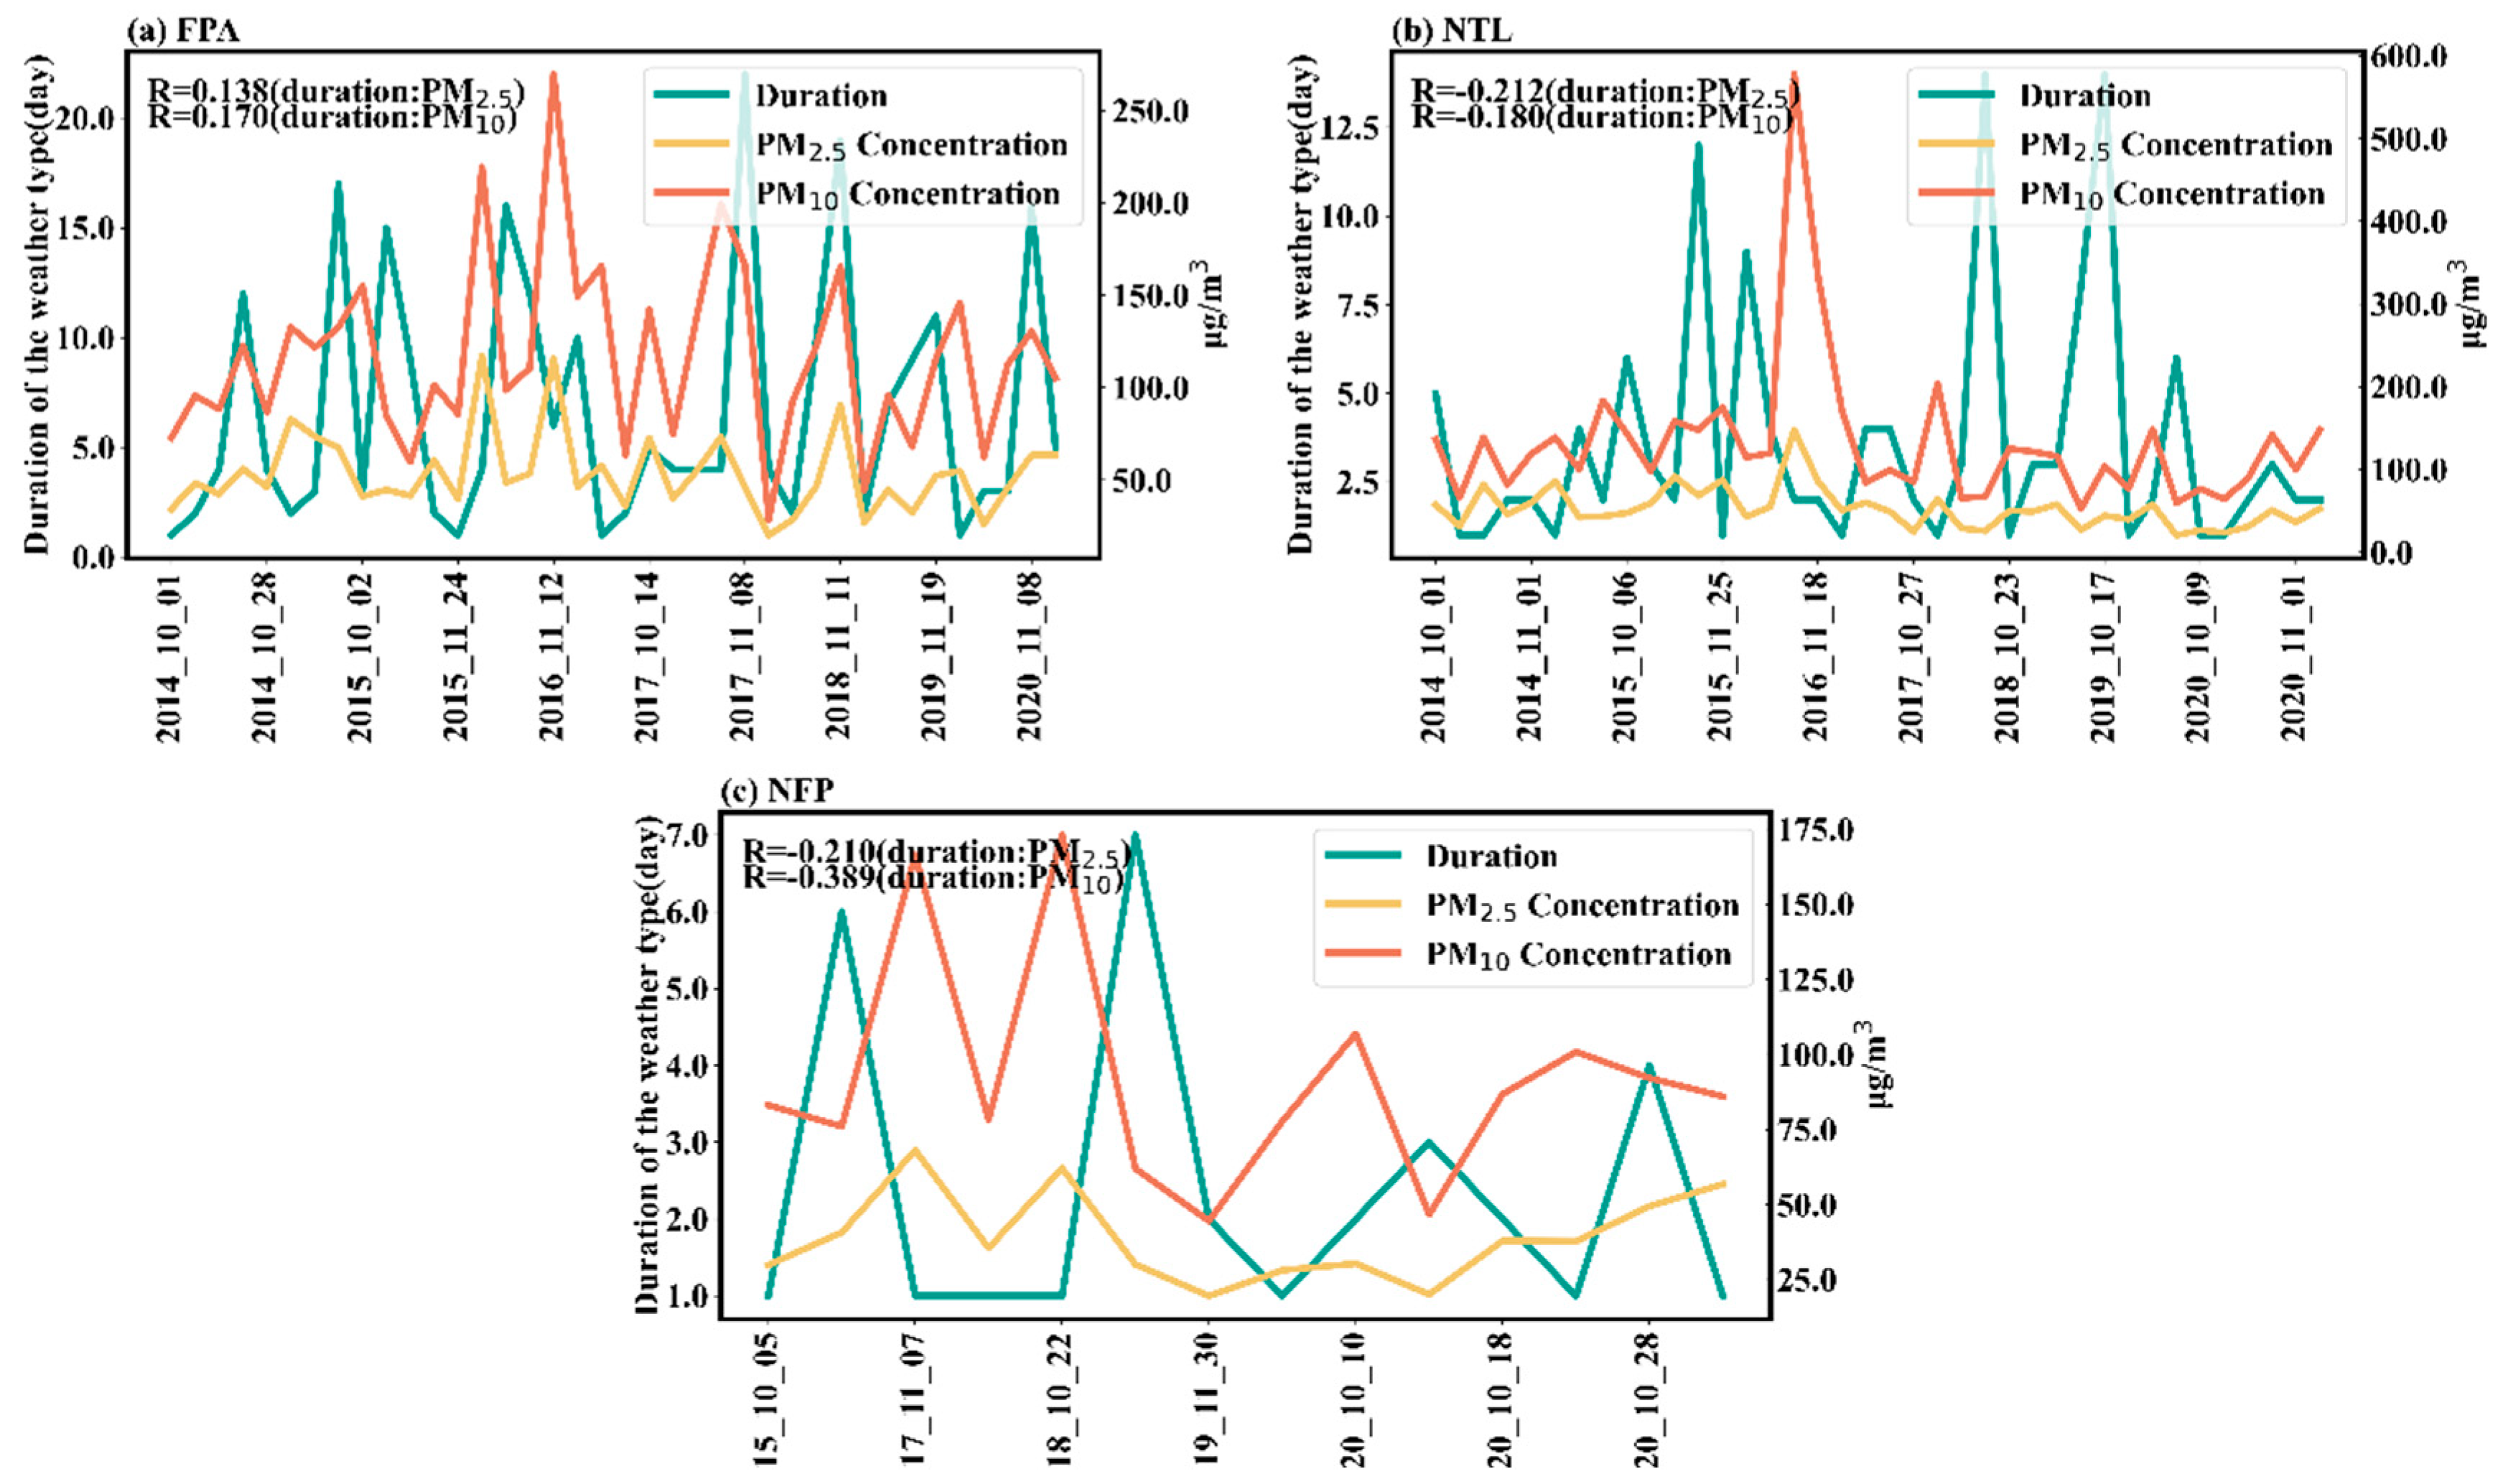
3.3. The Impact of Weather Conditions and Emission Control on Pollution

Categorizing the six weather patterns into three distinct types (FPA, NTL, NFP), we compared the average concentrations of PM2.5 and PM10, as well as the proportions of days for each weather type during historical and lockdown periods (Figure 5). Across all weather types, PM2.5 and PM10 concentrations were consistently higher during the historical period compared to the lockdown period (Figure 5). Taking PM2.5 as an example, the concentration during the historical periods is 36.05% higher for FPA, 36.70% higher for NTL, and 2.59% higher for NFP than during the lockdown period. This indicates that source emissions are the primary driver of air quality in Lanzhou in most conditions, as seen through the higher emissions during the historical period.
Furthermore, the average concentration of PM2.5 and PM10 associated with the three weather types exhibited a clear pattern: highest under FPA, middle under NTL, and lowest under NFP. This suggests that meteorological conditions also have a great impact on pollutant levels [42,43]. Pollutant concentrations rise when meteorological conditions are favorable for pollutant accumulation, whereas they decrease when conditions are favorable for dispersion. Under the NFP condition, PM2.5 concentrations during the historical period were nearly equivalent to those during the lockdown period, while PM10 concentration remained 91.53 μg/m3 higher during the historical period. The sources of PM2.5 and PM10 are particles from anthropogenic activities and dust from natural sources, respectively. The heavy wind under the NFP condition may clean the air in Lanzhou by dispersing pollutants, but also carry dust to Lanzhou, which exacerbates PM10 levels. PM2.5, therefore, serves as a more sensitive indicator of local air quality. Despite the significant reduction in anthropogenic activities during the lockdown period, the similarity in PM2.5 concentrations between historical and lockdown periods indicates that meteorological factors can surpass emission sources in influencing air quality in Lanzhou under NFP conditions. It is true that the 2022 PM10 levels appear to be at the same levels as in 2019. As we know, the value of PM10 is influenced not only by emissions, but also by the meteorological condition. To explain this phenomenon, we analyzed the number of days in October 2022 and October 2019 that were unfavorable for pollutant dispersion. The analysis showed that in October 2022, the number of days unfavorable for pollutant dispersion (7 days) was much higher than in October 2019 (2 days). This increase in unfavorable weather conditions during the pandemic may have contributed to the fact that the 2022 PM10 levels appear to be at the same level as in 2019.
During both the historical and lockdown periods, the proportion of days classified as FPA, NTL, and NFP weather types were about 60.12%, 32.08%, and 7.73% and 49.41%, 23.53%, and 27.06%, respectively. These findings imply that FPA is the predominant weather type, with NFP being relatively uncommon. The main reason is due to Lanzhou Valley’s topography, where it is easy to form a stable, windless meteorological condition. Furthermore, the frequency of FPA and NTL was lower during lockdown periods compared to the historical periods, whereas the occurrence of NFP increased during the lockdown periods. Studies have demonstrated an interaction relationship between pollutants and the meteorological conditions [44,45,46,47]. When a lot of pollutants accumulate in the boundary layer, they will absorb solar radiation, heating the atmosphere, but blocking solar radiation from reaching the surface and cooling it. Consequently, this leads to more stable meteorological conditions, which in turn increases the likelihood of the FPA weather type occurring, particularly with increased pollutant loading. Pollutant concentrations are not only related to weather types but also to human health [48]. To better reflect the linear relationship between pollutant concentrations and weather types, we conducted a Pearson correlation analysis. The results show that, whether during historical periods or the pandemic, pollutant concentrations have a strong linear relationship with weather types. Specifically, the correlation coefficients between PM2.5, PM10, and weather types during the historical period were −0.99 and −0.96, while during the lockdown period, the correlation coefficients between PM2.5, PM10, and weather types were −0.93 and −0.99.
Figure 6 presents the probability distribution of PM2.5 concentrations during periods with and without lockdown, under three different weather types. Each distribution exhibits a unimodal shape, but the magnitude of their peaks and the width of distributions are different. Under the FPA weather type, the peak of PM2.5 concentrations is 40.00 μg/m3 during the lockdown period, which is significantly smaller than the 60.00 μg/m3 peak during the historical period (Figure 6a). And the width of the distribution during the lockdown period (ranging from 20 to 120 μg/m3) was much narrower than that during the historical period (ranging from 20 to 60 μg/m3). However, under the NFP weather type, the distribution of PM2.5 concentrations during both the historical and lockdown periods almost overlapped (Figure 6c). The peak concentrations during the lockdown period matched those of the historical period at 20 μg/m3, with a similar width ranging from 10 to 50 μg/m3. The distribution under the NTL weather type is in an intermediate condition between FPA and NFP. The differences in the distribution of PM2.5 concentrations among FPA, NTL, and NFP highlight the influence of meteorological conditions. Within the same weather type, the differences between the historical and lockdown periods can be attributed to the variations in pollutant emissions. Under the FPA weather type, the contribution from emission sources is amplified, whereas under the NFP weather type, the contribution of emission is minimized. To further investigate the interaction between pollutants and the meteorological conditions, the proportion of the three weather types was examined across varying pollution levels: PM2.5 ≤ 30 μg/m3 for light pollution, 30 μg/m3 < PM2.5 ≤ 40 μg/m3 for moderate pollution, and PM2.5 > 40 μg/m3 for severe pollution. In the case of moderate pollution (Figure 7b), the proportions of the three weather types were comparable to the overall conditions (Figure 5), with FPA being the most frequent (60.12% for historical and 49.41% for lockdown), followed by NTL (32.08% for historical and 23.53% for lockdown), and NFP being the least frequent (7.73% for historical and 27.06% for lockdown).
In severe pollution conditions (Figure 7c), the frequency of weather types was more concentrated to FPA, with only a few occurrences of NTL and NFP. The highest pollution levels aligning with FPA weather types indicates a strong interaction between pollutants and meteorological conditions. The FPA weather type, which is conducive to the pollutant accumulation, can lead to an increase in accumulated pollutants, thus making the occurrence of FPA weather type more likely. This indicates that under moderate and severe pollution conditions, meteorological factors began to play a significant role in influencing pollutant dispersion, which in turn elevates pollutant concentrations.
However, for light pollution conditions (Figure 7a), the distribution of FPA, NTL, and NFP weather types was relatively balanced, with percentages recorded at 33.8%, 43.66%, and 22.54% during the historical period and 24.00%, 24.00%, and 52.00% during the lockdown period. This suggests that under light pollution conditions, the impact of weather types on pollutant concentrations was limited, with pollution levels primarily driven by emissions. It also implies that the pollutants have a minimal impact on weather types under the light pollution conditions.
Many studies have shown that there is a positive feedback relationship between high pollutant concentrations and meteorological conditions. For example, Malek et al. found that the high concentration of PM2.5 (particulate matter with a diameter smaller than 2.5 microns) in the air was caused by a combination of the geographical, meteorological, and environmental factors in Cache Valley. The strong inversion (increase in temperature with height) and light precipitation and/or wind were the main factors trapping pollutants in the air [49]. Silva et al. found that the high particulate matter concentration load in the Cache Valley region of Utah was the result of a combination of unfavorable meteorological conditions (primarily severe cold-temperature inversions), mixed urban and rural emission sources, and a confined geographical environment [50].
To explore the interaction between pollutants and meteorological conditions in more depth, the duration of each weather type and its corresponding PM2.5 concentration were illustrated in Figure 8. A physical feedback mechanism exists between pollutants and the FPA weather type. Pollutants can heat the atmosphere and cool the ground by absorbing and scattering solar radiation. If pollutants are mainly concentrated within the boundary layer, this can exacerbate the boundary layer inversion, making it more difficult for pollutants to disperse and prolonging pollution events. Thus, the FPA weather type will lead to severe pollution events, and more severe pollution may be associated with a longer duration of FPA.
Under the FPA condition, both PM2.5 and PM10 concentrations were positively correlated with FPA duration, with correlation coefficients of 0.138 for PM2.5 and 0.170 for PM10 (Figure 8a). The correlations are not statistically significant at the 95% confidence level. This might be due to the influence of other factors affecting the duration of FPA and pollutant concentration, such as the atmospheric circulation, emission by anthropogenic activities, and so on.
In contrast, under NTL and NFV conditions (Figure 8b,c), the correlation coefficients for both PM2.5 and PM10 were negative. The results may be due to lower pollutant concentrations having a less significant impact on boundary layer inversion.

4. Conclusions

Lanzhou, a city situated at the geographical center of China, often endures air pollution issues, primarily due to its distinctive basin topography and the prevalence of heavy industrial activities. The air quality in Lanzhou is primarily influenced by two factors: emission sources and meteorological conditions. To curb the spread of the COVID-19 virus, Lanzhou implemented two rounds of lockdown measures during the winter of 2021 and 2022. This action provided a comparative case study between periods with and without significant anthropogenic pollution emissions by extending the historical period from 2014 to 2020. Pollutant concentrations in Lanzhou from 2014 to 2022 showed a decreasing trend with both PM2.5 and PM10, which were both 40% and 44% lower during the pandemic lockdown period compared to historical periods, which is attributed to the reduction in emissions due to lockdown measures.
Utilizing the T-PCA method, we classified weather patterns into three categories: favorable for pollutant accumulation (FPA), unfavorable for pollutant accumulation (NFP), and neutral for pollutant accumulation (NTL). FPA is the most frequent (57.79%) weather type in winter at Lanzhou, which might be due to its basin topography. When comparing pollutant concentrations under the three weather types, it was observed that different weather patterns had varying impacts on pollutant concentrations. Under FPA conditions, PM2.5 concentrations can reach 52.82 μg/m3, with pollutants being difficult to disperse. FPA occurrence is usually accompanied by severe pollution events.
To further demonstrate the interaction between weather types and pollution levels, PM2.5 concentrations were categorized into light, moderate, and severe pollution levels. For light pollution, weather types had a minimal impact on local pollutant concentrations, with emissions being the primary determinant. In contrast, for severe pollution, weather patterns significantly impacted local air quality. Our research further revealed a positive correlation between the duration of FPA and PM2.5 concentrations, suggesting a positive feedback loop between severe pollution and FPA weather type, where FPA can lead to severe pollution events and more severe pollution may be associated with prolonged FPA durations. These findings inspire us as we conclude that, upon identifying FPA weather patterns, the implementation of pollution control measures can significantly mitigate air pollution levels. Moreover, the complexity of factors influences the relationship between weather types and pollution levels, necessitating a more comprehensive and in-depth study in future research.

Author Contributions

Methodology, H.Y.; Investigation, Y.M.; Writing—original draft, Y.M.; Writing—review and editing, Y.M. and H.Y.; Visualization, Y.M. and M.Z. All authors have read and agreed to the published version of the manuscript.

Funding

National Natural Science Foundation of China under grant no. 42275073.

Institutional Review Board Statement

Not applicable.

Informed Consent Statement

Not applicable.

Data Availability Statement

The raw data supporting the conclusions of this article will be made available by the authors on request.

Acknowledgments

This work was supported by the National Natural Science Foundation of China under grant no. 42275073.

Conflicts of Interest

The authors declare no conflicts of interest.

References

  1. Maté, T.; Guaita, R.; Pichiule, M.; Linares, C.; Díaz, J. Short-term effect of fine particulate matter (PM2.5) on daily mortality due to diseases of the circulatory system in Madrid (Spain). Sci. Total Environ. 2010, 408, 5750–5757. [Google Scholar] [CrossRef] [PubMed]
  2. Samoli, E.; Analitis, A.; Touloumi, G.; Schwartz, J.; Anderson, H.R.; Sunyer, J.; Bisanti, L.; Zmirou, D.; Vonk, J.M.; Pekkanen, J.; et al. Estimating the exposure–response relationships between particulate matter and mortality within the APHEA multicity project. Environ. Health Perspect. 2005, 113, 88–95. [Google Scholar] [CrossRef] [PubMed]
  3. Deng, X.; Tie, X.; Wu, D.; Zhou, X.; Bi, X.; Tan, H.; Li, F.; Jiang, C. Long-term trend of visibility and its characterizations in the Pearl River Delta (PRD) region, China. Atmos. Environ. 2008, 42, 1424–1435. [Google Scholar] [CrossRef]
  4. Niu, F.; Li, Z.; Li, C.; Lee, K.H.; Wang, M. Increase of wintertime fog in China: Potential impacts of weakening of the Eastern Asian monsoon circulation and increasing aerosol loading. J. Geophys. Res. Atmos. 2010, 115, D00K20. [Google Scholar] [CrossRef]
  5. Qian, Y.; Kaiser, D.P.; Leung, L.R.; Leung, L.R.; Xu, M. More frequent cloud-free sky and less surface solar radiation in China from 1955 to 2000. Geophys. Res. Lett. 2006, 33, L01812. [Google Scholar] [CrossRef]
  6. Zhou, J.; Zhao, X.; Yin, T. Research on the Impact of Atmospheric Self-Purification Capacity on Environmental Pollution: Based on the Threshold Effect of Environmental Regulation. Appl. Sci. 2023, 13, 2495. [Google Scholar] [CrossRef]
  7. Bespalov, V.; Gurova, O.; Samarskaya, N.; Paramonova, O. Classification of air pollution criteria for the improvement of methodical approaches to ensure the environmental safety of major cities. EDP Sci. 2019, 135, 01033. [Google Scholar] [CrossRef]
  8. Ding, A.J.; Huang, X.; Nie, W.; Sun, J.N.; Kerminen, V.-M.; Petäjä, T.; Su, H.; Cheng, Y.F.; Yang, X.-Q.; Wang, M.H.; et al. Enhanced haze pollution by black carbon in megacities in China. Geophys. Res. Lett. 2016, 43, 2873–2879. [Google Scholar] [CrossRef]
  9. Kraemer, M.U.; Yang, C.H.; Gutierrez, B.; Wu, C.H.; Klein, B.; Pigott, D.M.; Open COVID-19 Data Working Group; Plessis, L.D.; Faria, N.R.; Li, R.; et al. The effect of human mobility and control measures on the COVID-19 epidemic in China. Science 2020, 368, 493–497. [Google Scholar] [CrossRef]
  10. Le, T.; Wang, Y.; Liu, L.; Yang, J.; Yung, Y.L.; Li, G.; Seinfeld, J.H. Unexpected air pollution with marked emission reductions during the COVID-19 outbreak in China. Science 2020, 369, 702–706. [Google Scholar] [CrossRef]
  11. Shi, X.; Brasseur, G.P. The response in air quality to the reduction of Chinese economic activities during the COVID-19 outbreak. Geophys. Res. Lett. 2020, 47, e2020GL088070. [Google Scholar] [CrossRef]
  12. Wang, Y.; Yuan, Y.; Wang, Q.; Liu, C.; Zhi, Q.; Cao, J. Changes in air quality related to the control of coronavirus in China: Implications for traffic and industrial emissions. Sci. Total Environ. 2020, 731, 139133. [Google Scholar] [CrossRef] [PubMed]
  13. Wang, M.; Liu, F.; Zheng, M. Air quality improvement from COVID-19 lockdown: Evidence from China. Air Qual. Atmos. Health 2021, 14, 591–604. [Google Scholar] [CrossRef] [PubMed]
  14. Bao, R.; Zhang, A. Does lockdown reduce air pollution? Evidence from 44 cities in northern China. Sci. Total Environ. 2020, 731, 139052. [Google Scholar] [CrossRef] [PubMed]
  15. Jain, S.; Sharma, T. Social and travel lockdown impact considering coronavirus disease (COVID-19) on air quality in megacities of India: Present benefits, future challenges and way forward. Aerosol Air Qual. Res. 2020, 20, 1222–1236. [Google Scholar] [CrossRef]
  16. Mahato, S.; Pal, S.; Ghosh, K.G. Effect of lockdown amid COVID-19 pandemic on air quality of the megacity Delhi, India. Sci. Total Environ. 2020, 730, 139086. [Google Scholar] [CrossRef]
  17. Kumar, P.; Hama, S.; Omidvarborna, H.; Sharma, A.; Sahani, J.; Abhijith, K.V.; Debele, S.E.; Zavala-Reyes, J.C.; Barwise, Y.; Tiwari, A. Temporary reduction in fine particulate matter due to ‘anthropogenic emissions switch-off’ during COVID-19 lockdown in Indian cities. Sustain. Cities Soc. 2020, 62, 102382. [Google Scholar] [CrossRef]
  18. Sharma, S.; Zhang, M.; Gao, J.; Zhang, H.; Kota, S.H. Effect of restricted emissions during COVID-19 on air quality in India. Sci. Total Environ. 2020, 728, 138878. [Google Scholar] [CrossRef]
  19. Marlier, M.E.; Xing, J.; Zhu, Y.; Wang, S. Impacts of COVID-19 response actions on air quality in China. Environ. Res. Commun. 2020, 2, 075003. [Google Scholar] [CrossRef]
  20. Gao, H.; Wang, J.; Li, T.; Fang, C. Analysis of air quality changes and influencing factors in Changchun during the COVID-19 pandemic in 2020. Aerosol Air Qual. Res. 2021, 21, 210055. [Google Scholar] [CrossRef]
  21. Roy, S.; Singha, N.; Majumdar, N.; Roy, B. Lockdown due to COVID-19 pandemic improves overall air quality: An evidence based study from Siliguri Metropolitan, West Bengal, India. Curr. World Environ. 2020, 15, 574–587. [Google Scholar] [CrossRef]
  22. Giani, P.; Castruccio, S.; Anav, A.; Howard, D.; Hu, W.; Crippa, P. Short-term and long-term health impacts of air pollution reductions from COVID-19 lockdowns in China and Europe: A modelling study. Lancet Planet. Health 2020, 4, e474–e482. [Google Scholar] [CrossRef] [PubMed]
  23. Schikowski, T.; Ranft, U.; Sugiri, D.; Vierkötter, A.; Brüning, T.; Harth, V.; Krämer, U. Decline in air pollution and change in prevalence in respiratory symptoms and chronic obstructive pulmonary disease in elderly women. Respir. Res. 2010, 11, 113. [Google Scholar] [CrossRef]
  24. Soo, R.J.J.; Chiew, C.J.; Ma, S.; Pung, R.; Lee, V. Decreased influenza incidence under COVID-19 control measures, Singapore. Emerg. Infect. Dis. 2020, 26, 1933. [Google Scholar] [CrossRef]
  25. Olsen, S.J. Decreased influenza activity during the covid-19 pandemic—United States, Australia, Chile, and South Africa, 2020. MMWR Morb. Mortal. Wkly. Rep. 2020, 69, 1305–1309. [Google Scholar] [CrossRef] [PubMed]
  26. Chambers, S.D.; Podstawczyńska, A. Improved method for characterising temporal variability in urban air quality part II: Particulate matter and precursors in central Poland. Atmos. Environ. 2019, 219, 117040. [Google Scholar] [CrossRef]
  27. Yan, Y.; Zhou, Y.; Kong, S.; Lin, J.; Wu, J.; Zheng, H.; Zhang, Z.; Song, A.; Bai, Y.; Ling, Z.; et al. Effectiveness of emission control in reducing PM 2.5 pollution in central China during winter haze episodes under various potential synoptic controls. Atmos. Chem. Phys. 2021, 21, 3143–3162. [Google Scholar] [CrossRef]
  28. Zhang, J.P.; Zhu, T.; Zhang, Q.H.; Li, C.C.; Shu, H.L.; Ying, Y.; Dai, Z.P.; Wang, X.; Liu, X.Y.; Liang, A.M.; et al. The impact of circulation patterns on regional transport pathways and air quality over Beijing and its surroundings. Atmos. Chem. Phys. 2012, 12, 5031–5053. [Google Scholar] [CrossRef]
  29. Li, J.; Liao, H.; Hu, J.; Li, N. Severe particulate pollution days in China during 2013–2018 and the associated typical weather patterns in Beijing-Tianjin-Hebei and the Yangtze River Delta regions. Environ. Pollut. 2019, 248, 74–81. [Google Scholar] [CrossRef]
  30. Miao, Y.; Guo, J.; Liu, S.; Liu, H.; Li, Z.; Zhang, W.; Zhai, P. Classification of summertime synoptic patterns in Beijing and their associations with boundary layer structure affecting aerosol pollution. Atmos. Chem. Phys. 2017, 17, 3097–3110. [Google Scholar] [CrossRef]
  31. Li, J.; Hao, X.; Liao, H.; Wang, Y.; Cai, W.; Li, K.; Yue, X.; Yang, Y.; Chen, H.; Mao, Y.; et al. Winter particulate pollution severity in North China driven by atmospheric teleconnections. Nat. Geosci. 2022, 15, 349–355. [Google Scholar] [CrossRef]
  32. Chai, G.; He, H.; Sha, Y.; Zhai, G.; Zong, S. Effect of PM2.5 on daily outpatient visits for respiratory diseases in Lanzhou China. Sci. Total Environ. 2018, 649, 1563–1572. [Google Scholar] [CrossRef] [PubMed]
  33. He, D.; Hou, K.; Wen, J.F.; Wu, S.Q.; Wu, Z.P. A coupled study of ecological security and land use change based on GIS and entropy method—A typical region in Northwest China, Lanzhou. Environ. Sci. Pollut. Res. 2022, 29, 6347–6359. [Google Scholar] [CrossRef]
  34. Wang, H.; Lyu, B.; Liu, H.; Li, Y.; Lu, H. Air quality improvement during the COVID-19 lockdown in Lanzhou, China: A comprehensive study using satellite data, ground observations, and machine learning. Sci. Total Environ. 2020, 757, 143723. [Google Scholar]
  35. Liu, X.; Yin, Z.Y.; Zhang, X.; Yang, X. Analyses of the spring dust storm frequency of northern China in relation to antecedent and concurrent wind, precipitation, vegetation, and soil moisture conditions. J. Geophys. Res. Atmos. 2004, 109, D16210. [Google Scholar] [CrossRef]
  36. Huth, R.; Beck, C.; Philipp, A.; Demuzere, M.; Ustrnul, Z.; Cahynová, M.; Kyselý, J.; Tveito, O.E. Classifications of atmospheric circulation patterns: Recent advances and applications. Ann. N. Y. Acad. Sci. 2008, 1146, 105–152. [Google Scholar] [CrossRef]
  37. Ma, S.; Li, Z.Q.; Chen, H.; Liu, H.; Yang, F.; Zhou, Q.; Xia, D.S. Analysis of air quality characteristics and sources of pollution during heating period in Lanzhou. Environ. Chem. 2019, 38, 344–353. [Google Scholar]
  38. Chen, T.T.; Li, Z.Q.; Zhou, X.; Wang, F.L.; Zhang, X.; Wang, F.T. Air pollution characteristics, source analysis and cause of formation under the background of “Lanzhou blue”. Acta Sci. Circumstantiae 2020, 40, 1361–1373. [Google Scholar]
  39. Yu, C.; Morotomi, T. The effect of the revision and implementation for environmental protection law on ambient air quality in China. J. Environ. Manag. 2022, 306, 114437. [Google Scholar] [CrossRef]
  40. Qin, M.; Xiao, M.; Xie, Y. Spatial-temporal changes of air pollution in Lanzhou during the outbreak of COVID-19. Environ. Chem. 2023, 42, 1844–1855. [Google Scholar]
  41. Cai, W.; Li, K.; Liao, H.; Wang, H.; Wu, L. Weather conditions conducive to Beijing severe haze more frequent under climate change. Nat. Clim. Change 2017, 7, 257–262. [Google Scholar] [CrossRef]
  42. Zeng, S.; Zhang, Y. The effect of meteorological elements on continuing heavy air pollution: A case study in the Chengdu area during the 2014 spring festival. Atmosphere 2017, 8, 71. [Google Scholar] [CrossRef]
  43. Wang, J.; Shi, W.; Xue, K.; Wu, T.; Fang, C. Analysis of the impact of meteorological factors on ambient air quality during the COVID-19 lockdown in Jilin City in 2022. Atmosphere 2023, 14, 400. [Google Scholar] [CrossRef]
  44. Zhao, C.; Garrett, T.J. Effects of Arctic haze on surface cloud radiative forcing. Geophys. Res. Lett. 2015, 42, 557–564. [Google Scholar] [CrossRef]
  45. Yang, X.; Dong, W.; Liu, F. Impact of air pollution on summer surface winds in Xi’an. Acta Meteorol. Sin. 2011, 25, 527–533. [Google Scholar] [CrossRef]
  46. Yang, X.; Zhao, C.; Guo, J.; Wang, Y. Intensification of aerosol pollution associated with its feedback with surface solar radiation and winds in Beijing. J. Geophys. Res. Atmos. 2016, 121, 4093–4099. [Google Scholar] [CrossRef]
  47. Li, Z.; Lau, W.K.-M.; Ramanathan, V.; Wu, G.; Ding, Y.; Manoj, M.G.; Liu, J.; Qian, Y.; Li, J.; Zhou, T.; et al. Aerosol and monsoon climate interactions over Asia. Rev. Geophys. 2016, 54, 866–929. [Google Scholar] [CrossRef]
  48. Santana, J.C.C.; Miranda, A.C.; Yamamura, C.L.K.; Silva Filho, S.C.d.; Tambourgi, E.B.; Lee Ho, L.; Berssaneti, F.T. Effects of air pollution on human health and costs: Current situation in São Paulo, Brazil. Sustainability 2020, 12, 4875. [Google Scholar] [CrossRef]
  49. Malek, E.; Davis, T.; Martin, R.S.; Silva, P.J. Meteorological and environmental aspects of one of the worst national air pollution episodes (January, 2004) in Logan, Cache Valley, Utah, USA. Atmos. Res. 2006, 79, 108–122. [Google Scholar] [CrossRef]
  50. Silva, P.J.; Vawdrey, E.L.; Corbett, M.; Erupe, M. Fine particle concentrations and composition during wintertime inversions in Logan, Utah, USA. Atmos. Environ. 2007, 41, 5410–5422. [Google Scholar] [CrossRef]
Figure 1. Time series of (a) daily and (b) monthly concentrations of PM10 and PM2.5 in Lanzhou during October and November from 2014 to 2022. The shaded areas denote the standard error.
Atmosphere 16 00314 g001
Figure 2. Correlations between Lanzhou PM2.5 concentration and various atmospheric parameters: (a) geopotential height at 850 hPa, (b) geopotential height at 500 hPa, (c) zonal wind at 200 hPa, (d) meridional wind at 200 hPa, (e) temperature at 500 hPa, (f) temperature at 850 hPa, (g) relative humidity at 500 hPa, (h) specific humidity at 500 hPa, and (i) differences in equivalent potential temperature between 500 and 850 hPa. The dots indicate statistical significance at the 95% confidence level.
Atmosphere 16 00314 g002
Figure 3. PM2.5 anomalies under six weather patterns, which are classified into three types: favorable for pollutant accumulation (FPA), unfavorable for pollutant accumulation (NFP), and neutral condition (NTL).
Atmosphere 16 00314 g003
Figure 4. Meteorological fields for the six weather patterns (T1–T6): (af) V200 (units: m s−1), (gl) U200 (units: m s−1), (mr) Z500 (units: dagpm), (sx) Z850 (units: dagpm).
Atmosphere 16 00314 g004
Figure 5. Percentages of days and the average concentration of PM10 and PM2.5 for FPA, NFP, and NTL for three weather types during historical (black histogram and solid lines) and lockdown (gray histogram and dashed lines) periods.
Atmosphere 16 00314 g005
Figure 6. Probability distributions of PM2.5 concentrations under three weather types: (a) FPA, (b) NTL, and (c) NFP during historical and lockdown periods.
Atmosphere 16 00314 g006
Figure 7. Percentages of three weather types during historical and lockdown periods for (a) light pollution condition (PM2.5 ≤ 30 μg/m3), (b) moderate pollution conditions (30 μg/m3 < PM2.5 < 40 μg/m3), and (c) severe pollution condition (PM2.5 ≥ 40 μg/m3), respectively. The numbers above each histogram show their corresponding sample sizes.
Atmosphere 16 00314 g007
Figure 8. Time series of duration days of each weather type and corresponding PM2.5 and PM10 concentrations under three weather types for (a) FPA, (b) NTL, and (c) NFP, respectively. R is the correlation coefficient between duration of weather type and pollutant concentration.
Atmosphere 16 00314 g008
Disclaimer/Publisher’s Note: The statements, opinions and data contained in all publications are solely those of the individual author(s) and contributor(s) and not of MDPI and/or the editor(s). MDPI and/or the editor(s) disclaim responsibility for any injury to people or property resulting from any ideas, methods, instructions or products referred to in the content.

