Article

Lightning Return Stroke Positioning Method Based on CWT Narrowband Feature Extraction

National Key Laboratory of Electromagnetic Environmental Effects and Optoelectronic Engineering, Army Engineering University of PLA, Nanjing 210007, China
*
Author to whom correspondence should be addressed.
Atmosphere 2025, 16(3), 302; https://doi.org/10.3390/atmos16030302
Submission received: 29 November 2024 / Revised: 12 February 2025 / Accepted: 27 February 2025 / Published: 5 March 2025
(This article belongs to the Section Atmospheric Techniques, Instruments, and Modeling)

Abstract

:
Time of arrival (TOA) is a widely utilized method for positioning lightning return strokes, with its accuracy contingent upon the arrival times of signals from different detection sites. Typically, the peak value method is employed to directly extract the peak times of lightning electromagnetic pulse (LEMP) waveforms. By correlating these peak times with the coordinates of the sites, the spatiotemporal parameters of the LEMP can be determined. However, due to the dispersion phenomenon of broadband LEMP signals during propagation, the positioning accuracy of the peak method is relatively low. This paper introduces a novel lightning positioning technique that leverages continuous wavelet transform (CWT) for narrowband feature extraction. Specifically, narrowband signal characteristics were derived through CWT applied to simulation and measured data obtained from six detection sites. Subsequently, positional analysis was performed on both datasets. The results demonstrate that compared to traditional peak value methods, the proposed approach significantly enhances horizontal positioning accuracy for lightning; specifically, positioning error for simulation data decreased from 94.7 m to 5.6 m, while it reduced from 121 m to 9.2 m for practical measured data.

1. Introduction

Lightning return stroke represents the most intense discharge process in cloud-to-ground lightning, typically characterized by discharge currents ranging from tens to hundreds of kiloamps, a rapid current change rate, and significant electromagnetic radiation. The spatiotemporal development patterns of this phenomenon are a prominent topic within meteorology and atmospheric sciences research. Accurate localization of lightning return strokes is crucial for enhancing our understanding of the physical mechanisms underlying lightning.
To accurately position lightning return stroke, an electric field sensor network is commonly used to detect lightning return stroke signals, then a system of equations is set up according to the time differences between the arrival times of signal waves and the spatial location of each detection site, and then the spatial and temporal parameters (lightning discharge time and three-dimensional coordinates) of lightning discharges are acquired by solving equations [1,2,3]. Due to the dispersion phenomenon of broadband LEMP signals during propagation, the lightning electromagnetic pulse (LEMP) peaks extracted directly by the peak value method have large errors. Hence, accurately extracting the arrival times of signal waves at each site becomes a key issue to improve the positioning accuracy of lightning [4,5].
By exploiting the band-pass characteristics of continuous wavelet transform (CWT), the narrowband features of broadband continuous signals can be extracted, which can preserve the local information near a certain frequency and filter out the interference from out-of-band signals [2].
This data preprocessing technique can substantially enhance the accuracy of signal feature recognition, which has garnered considerable attention in the domain of mechanical and electrical system fault diagnosis, and it holds significant implications for the precise extraction of lightning peak times [6,7,8].
Liu et al. applied CWT to extract the Lamb wavelet coefficient envelopes at the sweep frequency points, and then the results were compared with frequency dispersion curves to obtain Lamb wave modes for detecting the circumferential defects of the back wall pipeline, and the imaging results exhibited a high degree of focus, demonstrating significantly improved capabilities for signal detection and defect recognition [9]; Gong et al. used CWT to extract stable narrowband response information from broadband unstable acoustic emission signals to accurately position acoustic emission sources, which reduced the positioning error from 15 m to 4.9 m [10]; Yao Z.F., J used complex Gaussian wavelet as the wavelet basis function, and made use of the wavelet transform coefficient to characterize the similarity between the measured signal and the basis function of HTS cable at room temperature, and then obtained the position of the signal reflection point and the short-circuit position with an absolute error of less than 2% [11]; Hui et al. effectively extracted the characteristic periods associated with bearing defects using the time-scale spectrum of Morlet wavelets, thereby enabling the detection of localized faults in rolling bearings [12]; M.S. Priyadarshini employed CWT to rapidly determine voltage disturbance signal types such as voltage transient, sag, interruption, and voltage imbalance, so as to visualize disturbance types and manage power quality problems [13]; Rong Q.Z. proposed a continuous wavelet transform method to analyze the stator current signal of asynchronous motor, which can effectively detect the rotor shaft failure [14]; In the case that there is no boundary effect in continuous data flow, T.H. Tran introduced CWT to biomedical signal processing. On the basis of the wavelet transform algorithm, the complex pulse signal standard point detection method of electrocardio signals are presented [15]; Zhang C.J. carried out one-dimensional CWT on the image curve of an original typhoon cloud image in Taiwan. The gray value of the matching peak value in all scales is considered the segmentation threshold, and the gray value of the peak-to-peak valley is considered the quantity gray value. The optimal segmentation scale is obtained by using the cost criterion. Experimental results show that the proposed method can effectively segment the main body of typhoon from the complex background in the typhoon cloud image [16].

2. Methods

2.1. Fundamental Theories of CWT

The mutual influence of different frequency components of signals can be suppressed by extracting the narrowband signals at a specific frequency band, and CWT provides an effective method to achieve this. CWT is the inner product of the analyzed function f(t) and a kernel function ψ(t) called wavelet function, which is represented as follows:
W ψ f ( a , b ) = 1 a + f ( t ) φ ( t b a ) d t
where a is the scale parameter, which controls the widening or narrowing of the wavelet function in both time and frequency; b is the translation parameter, which controls the shifting of the wavelet function in time; and φ(t) is the complex conjugate of wavelet function ψ(t). By changing the original wavelet function,
g a ( t ) = 1 a φ ( t )
CWT can be expressed as follows:
W g f ( a , b ) = + f ( t ) g ( b t a ) d t = f ( t ) × g a ( t )
As indicated above, CWT can be realized by convolution. The essence of CWT is to pass signals through a filter with the impact response of ga(t). In this paper, the Morlet wavelet is employed as the wavelet function, whose expression is as follows:
g ( t ) = e c t 2 cos ( ω t )
The Morlet wavelet can be represented as the product of a Gaussian function and a cosine function, which determines the oscillation frequency of the wavelet. The parameter c is employed to adjust the width of the Gaussian window function, thereby facilitating both frequency modulation and amplitude modulation of the wavelet function to effectively capture local features in time and frequency within the signal.

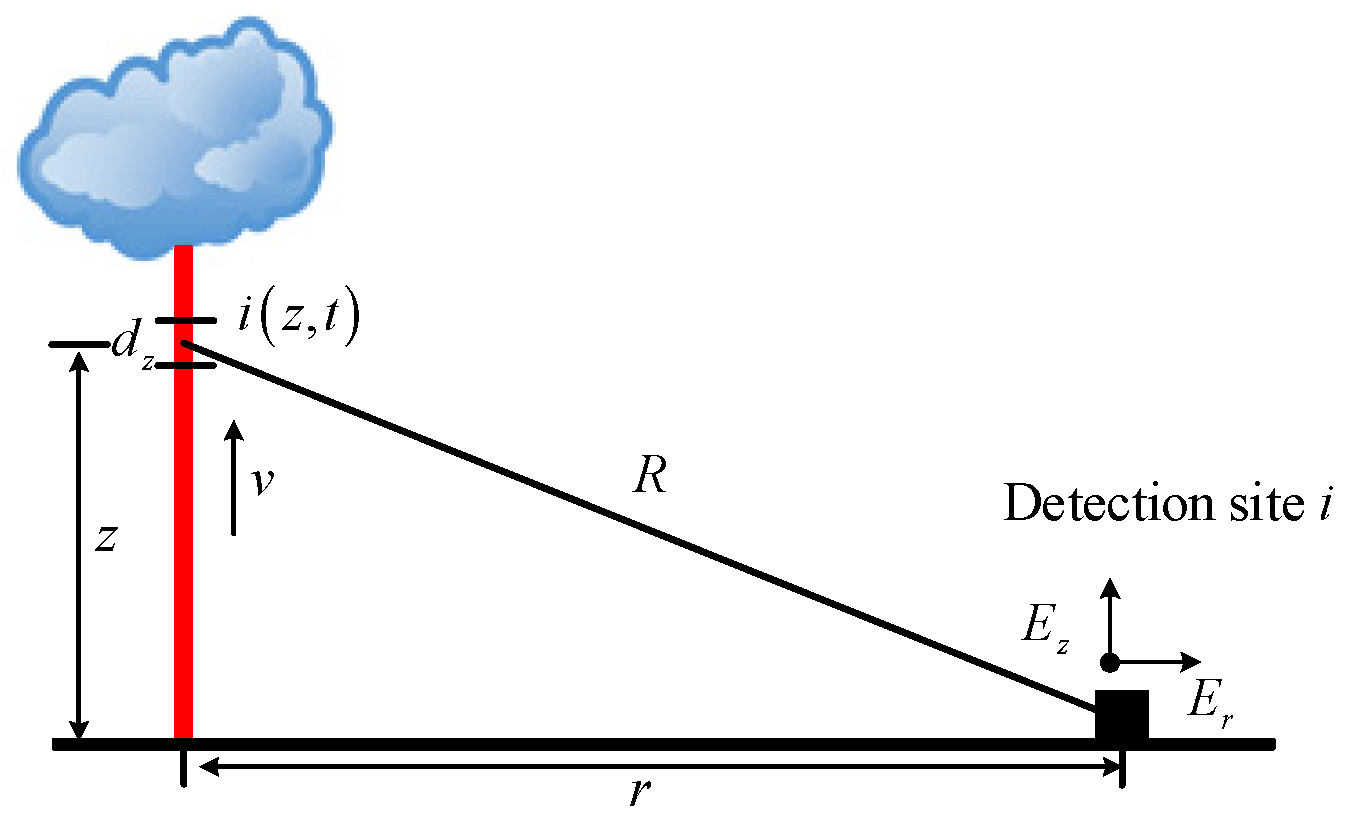
2.2. Lightning Positioning by the TOA Method

The TOA method is adopted to position the radiation source of lightning signals. The time ti for an electromagnetic pulse from a lightning radiation source to arrive at site i and the distance from the site satisfy the relationship given in Equation (5). Herein, t is the moment when the lightning radiation source occurs at location (x, y, z) in the space, (xi, yi, zi) is the location of site i, and ti is the moment when the lightning electromagnetic wave arrives at site i, and c is the speed of light. By using more than five sites to observe the same lightning radiation source, a system of equations can be set up according to Equation (5), and the parameters x, y, z, and i can be solved by using a nonlinear least-squares fitting method.
t i = t + ( x i x ) 2 + ( y i y ) 2 + ( z i z ) 2 c
The minimum value of χ 2 in Equation (6) is used to investigate the degree of fit, where t i o b s is the arrival time observed by site i, and t i f i t is the arrival time obtained by each attempt to solve Equation (5), N is the number of sites participating in the solution, Δ t r m s is the root-mean-square error of timing, v = N − 4 is the degree of freedom of the equation solution. The chi-square is normalized in the following calculation:
χ v 2 = 1 v i = 1 N ( t i o b s t i f i t ) 2 Δ t r m s 2

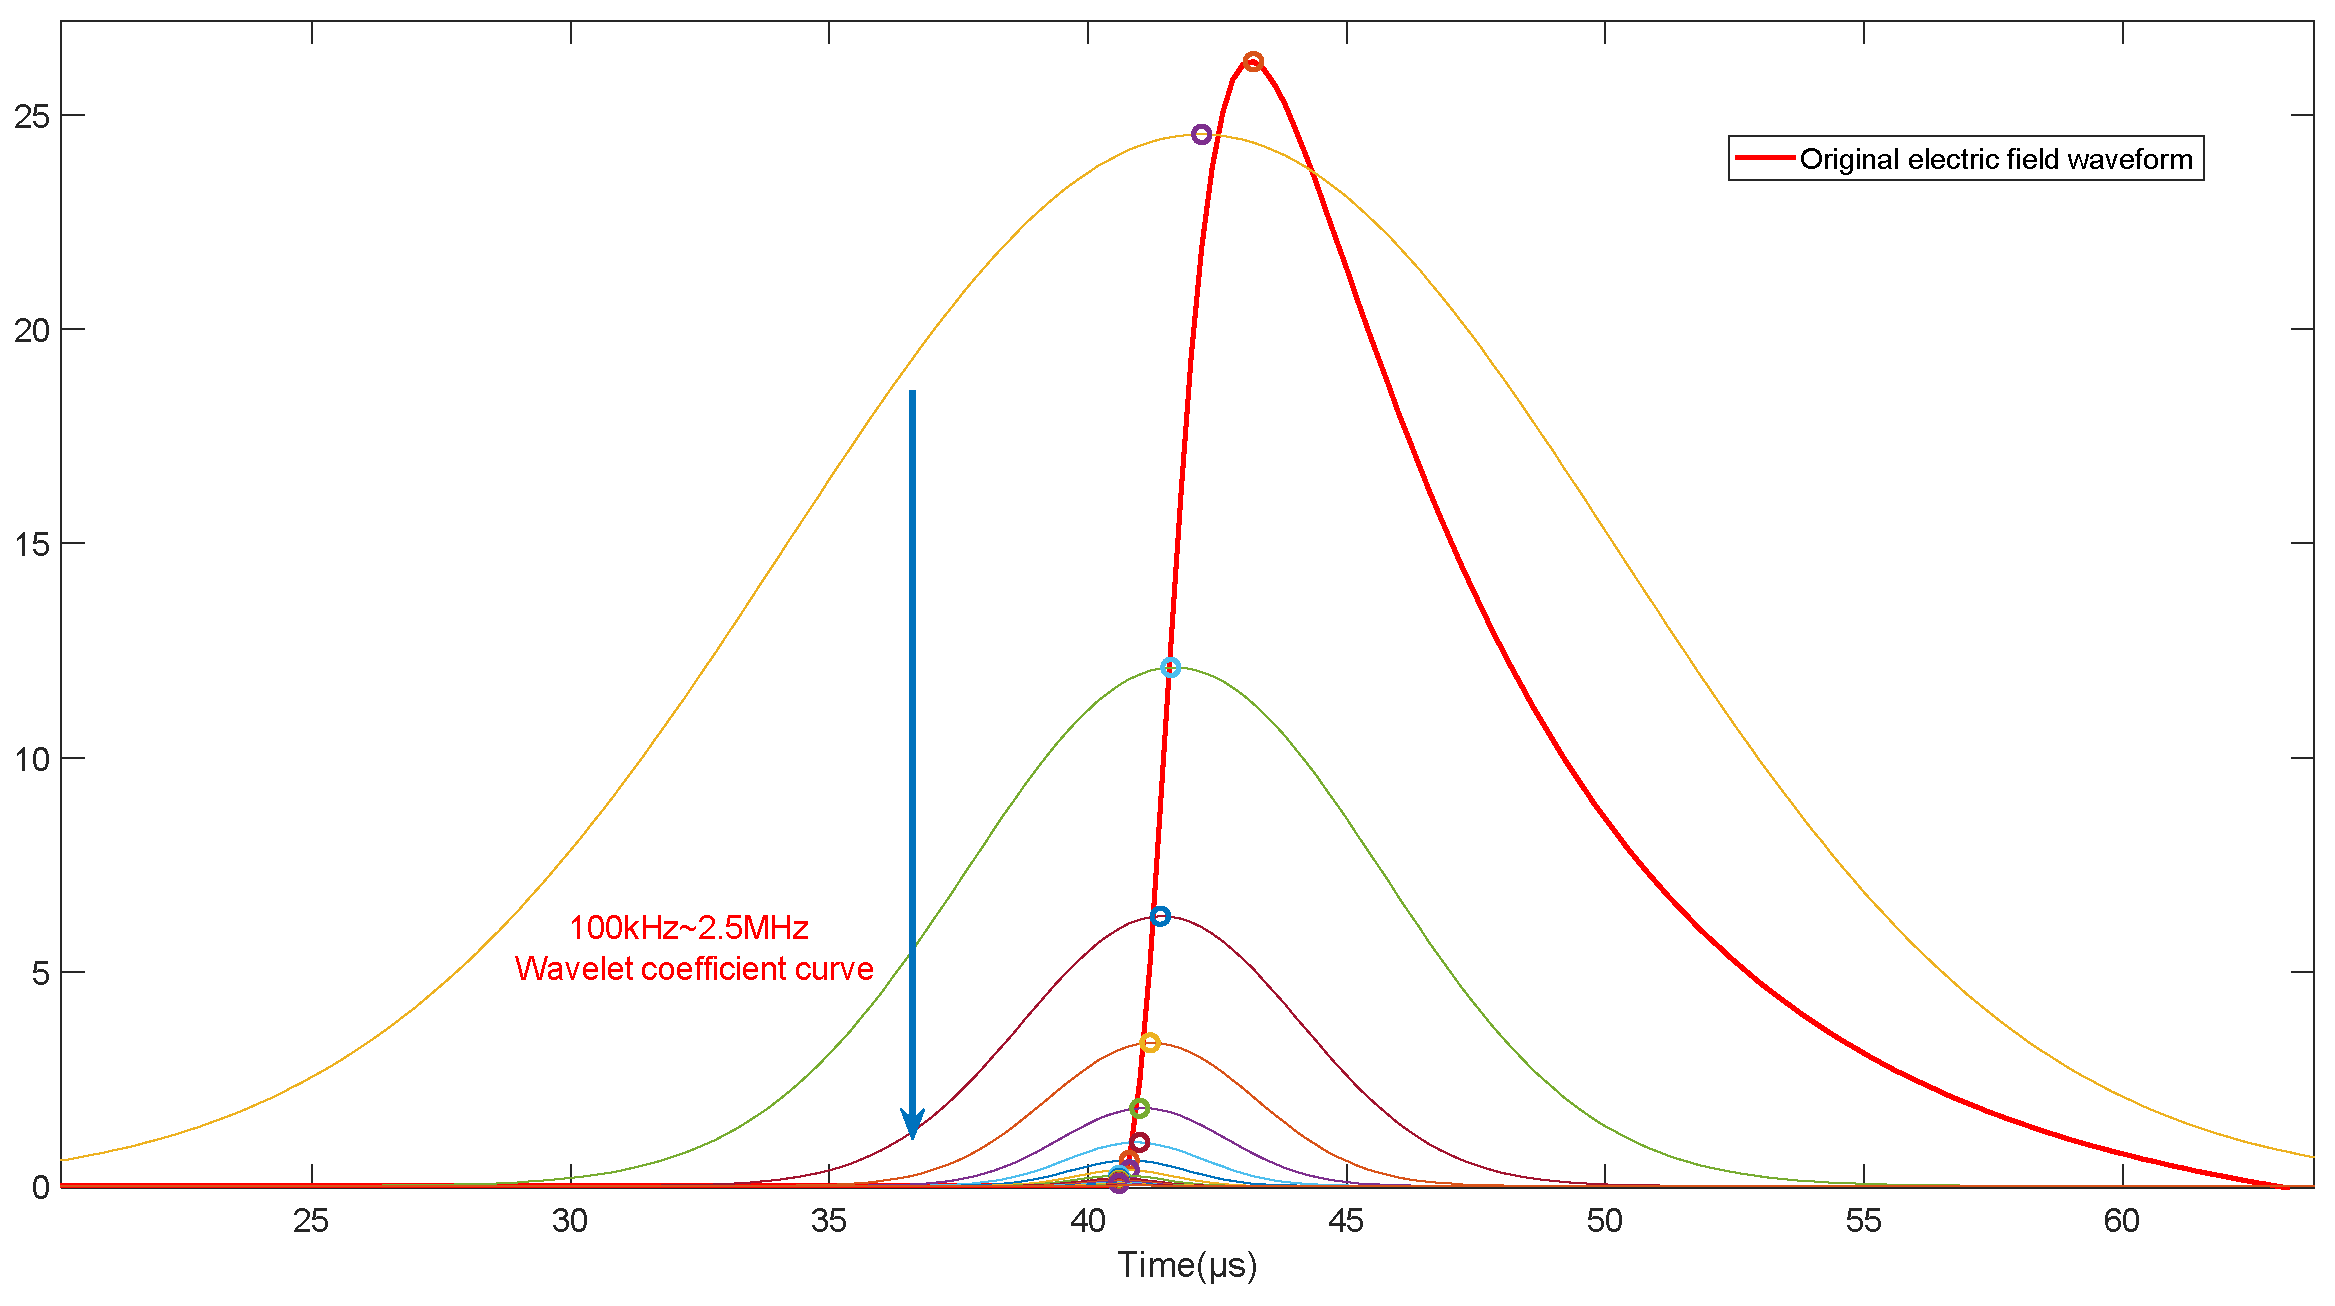
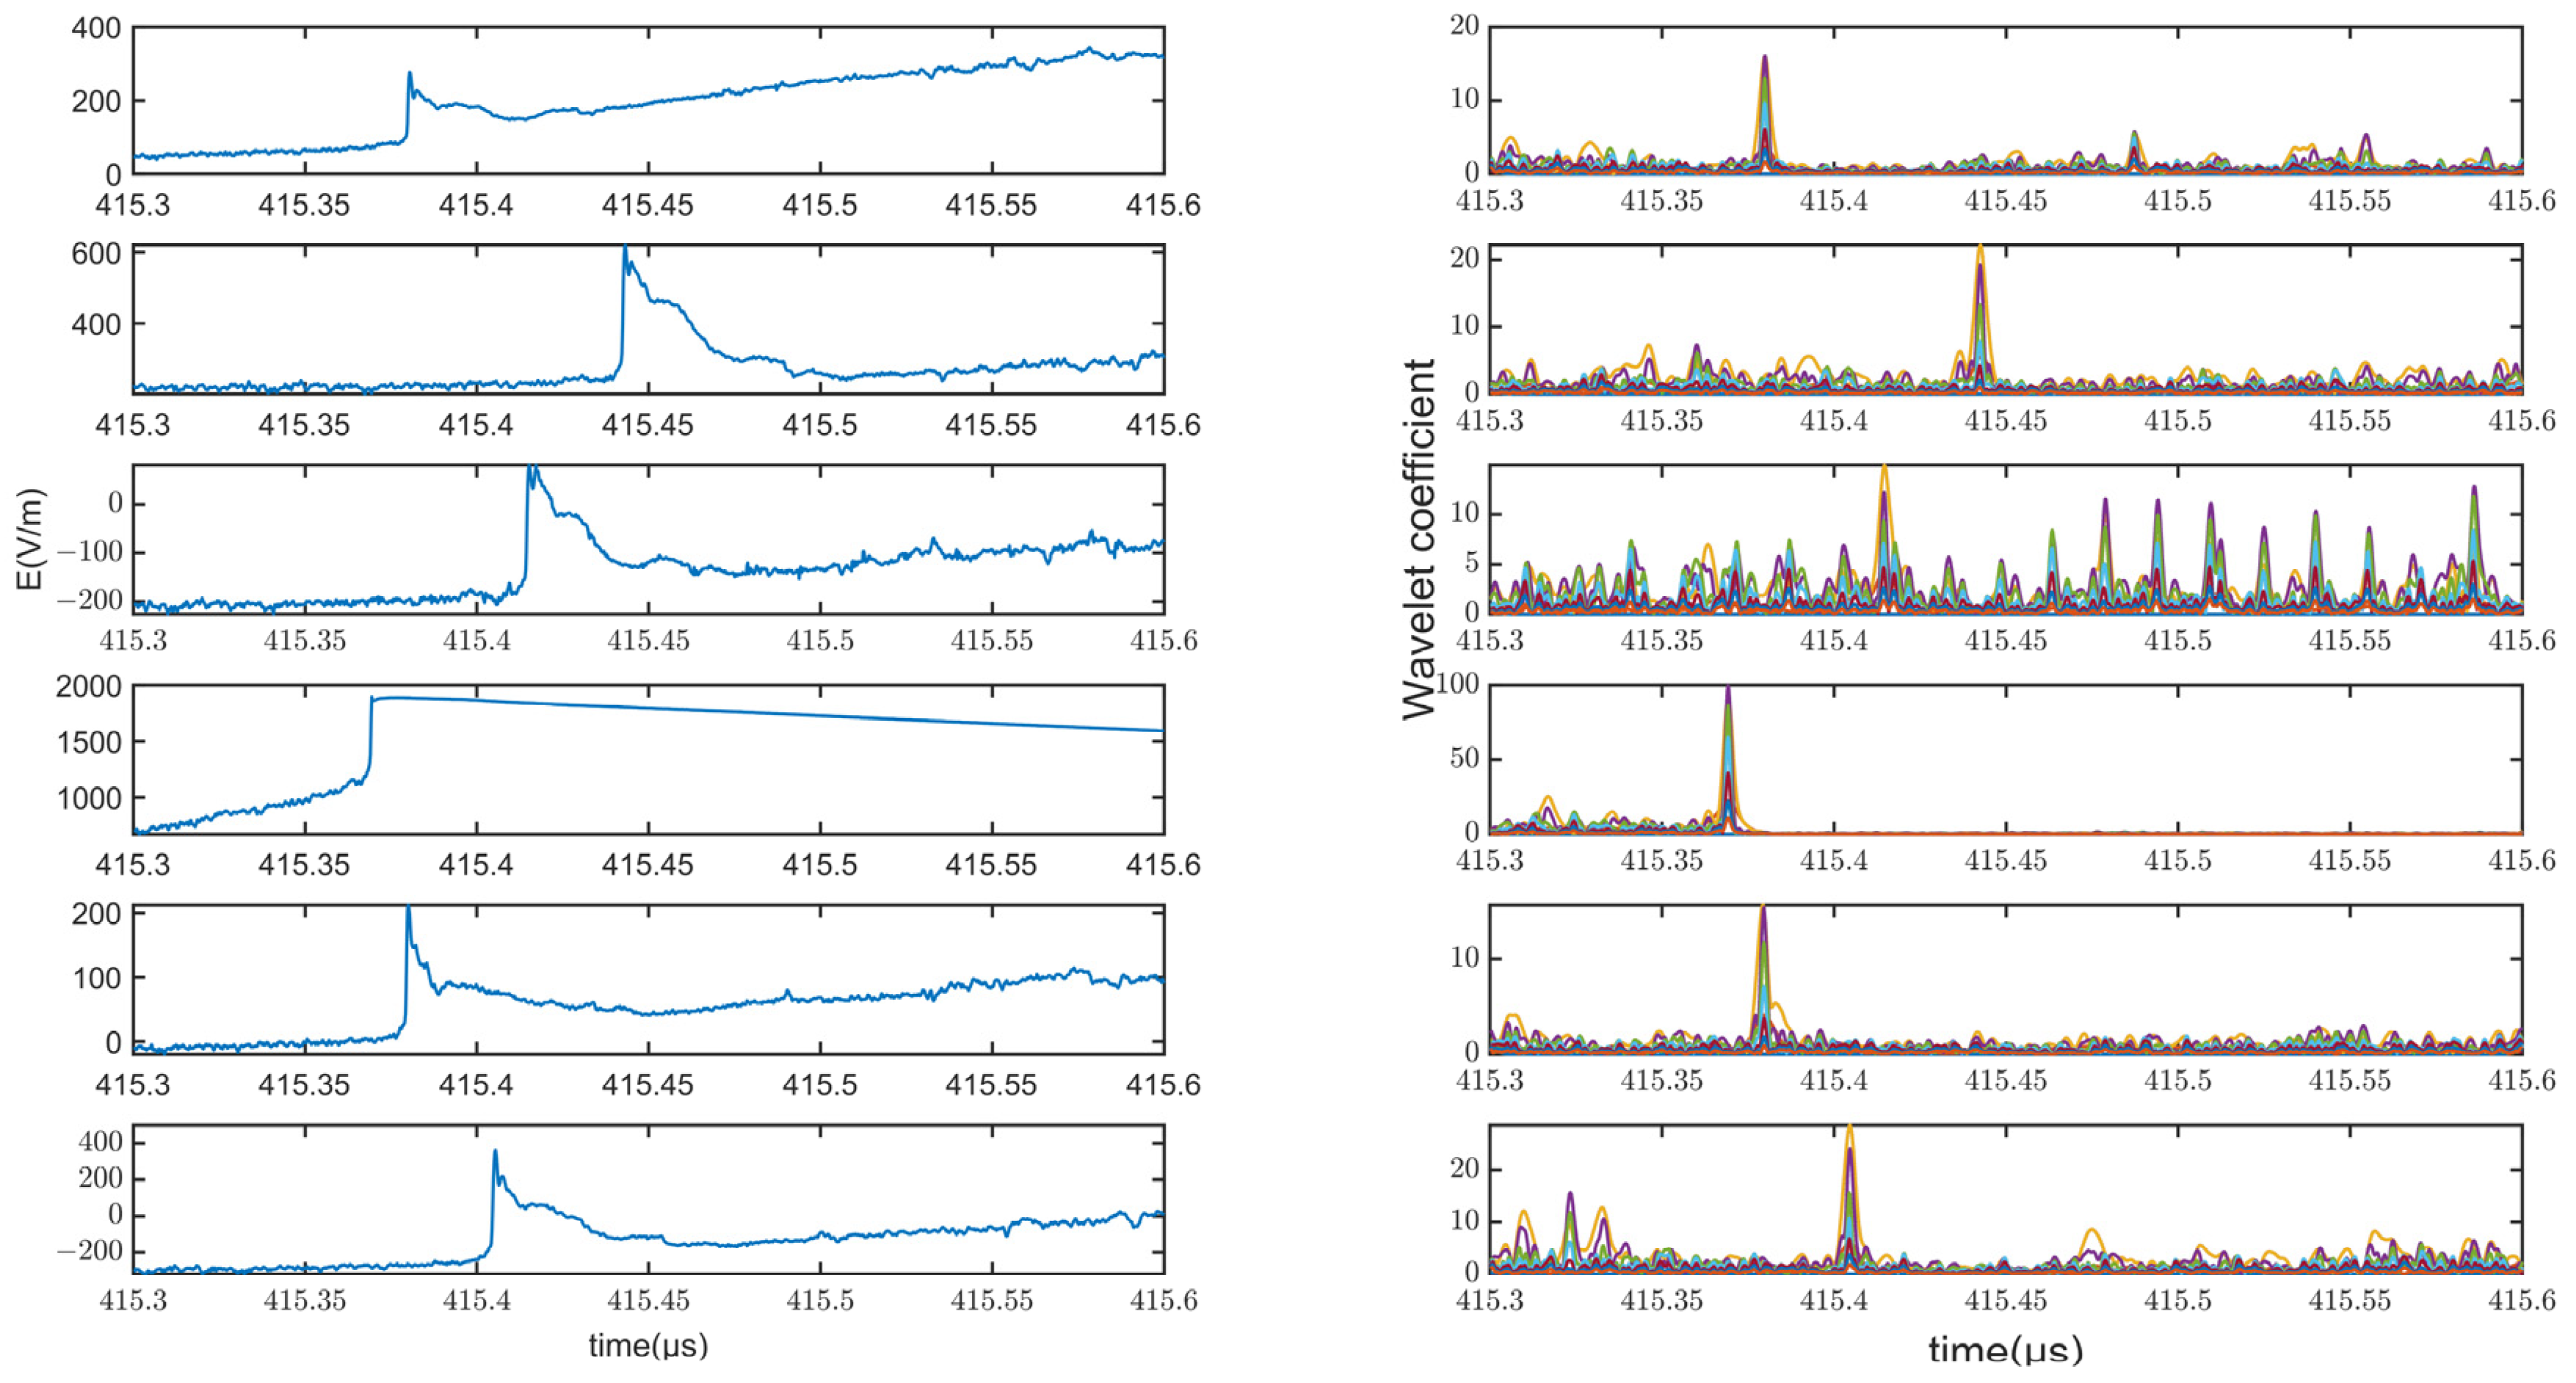
2.3. Extraction of Arrival Times of Lightning Pulses by CWT
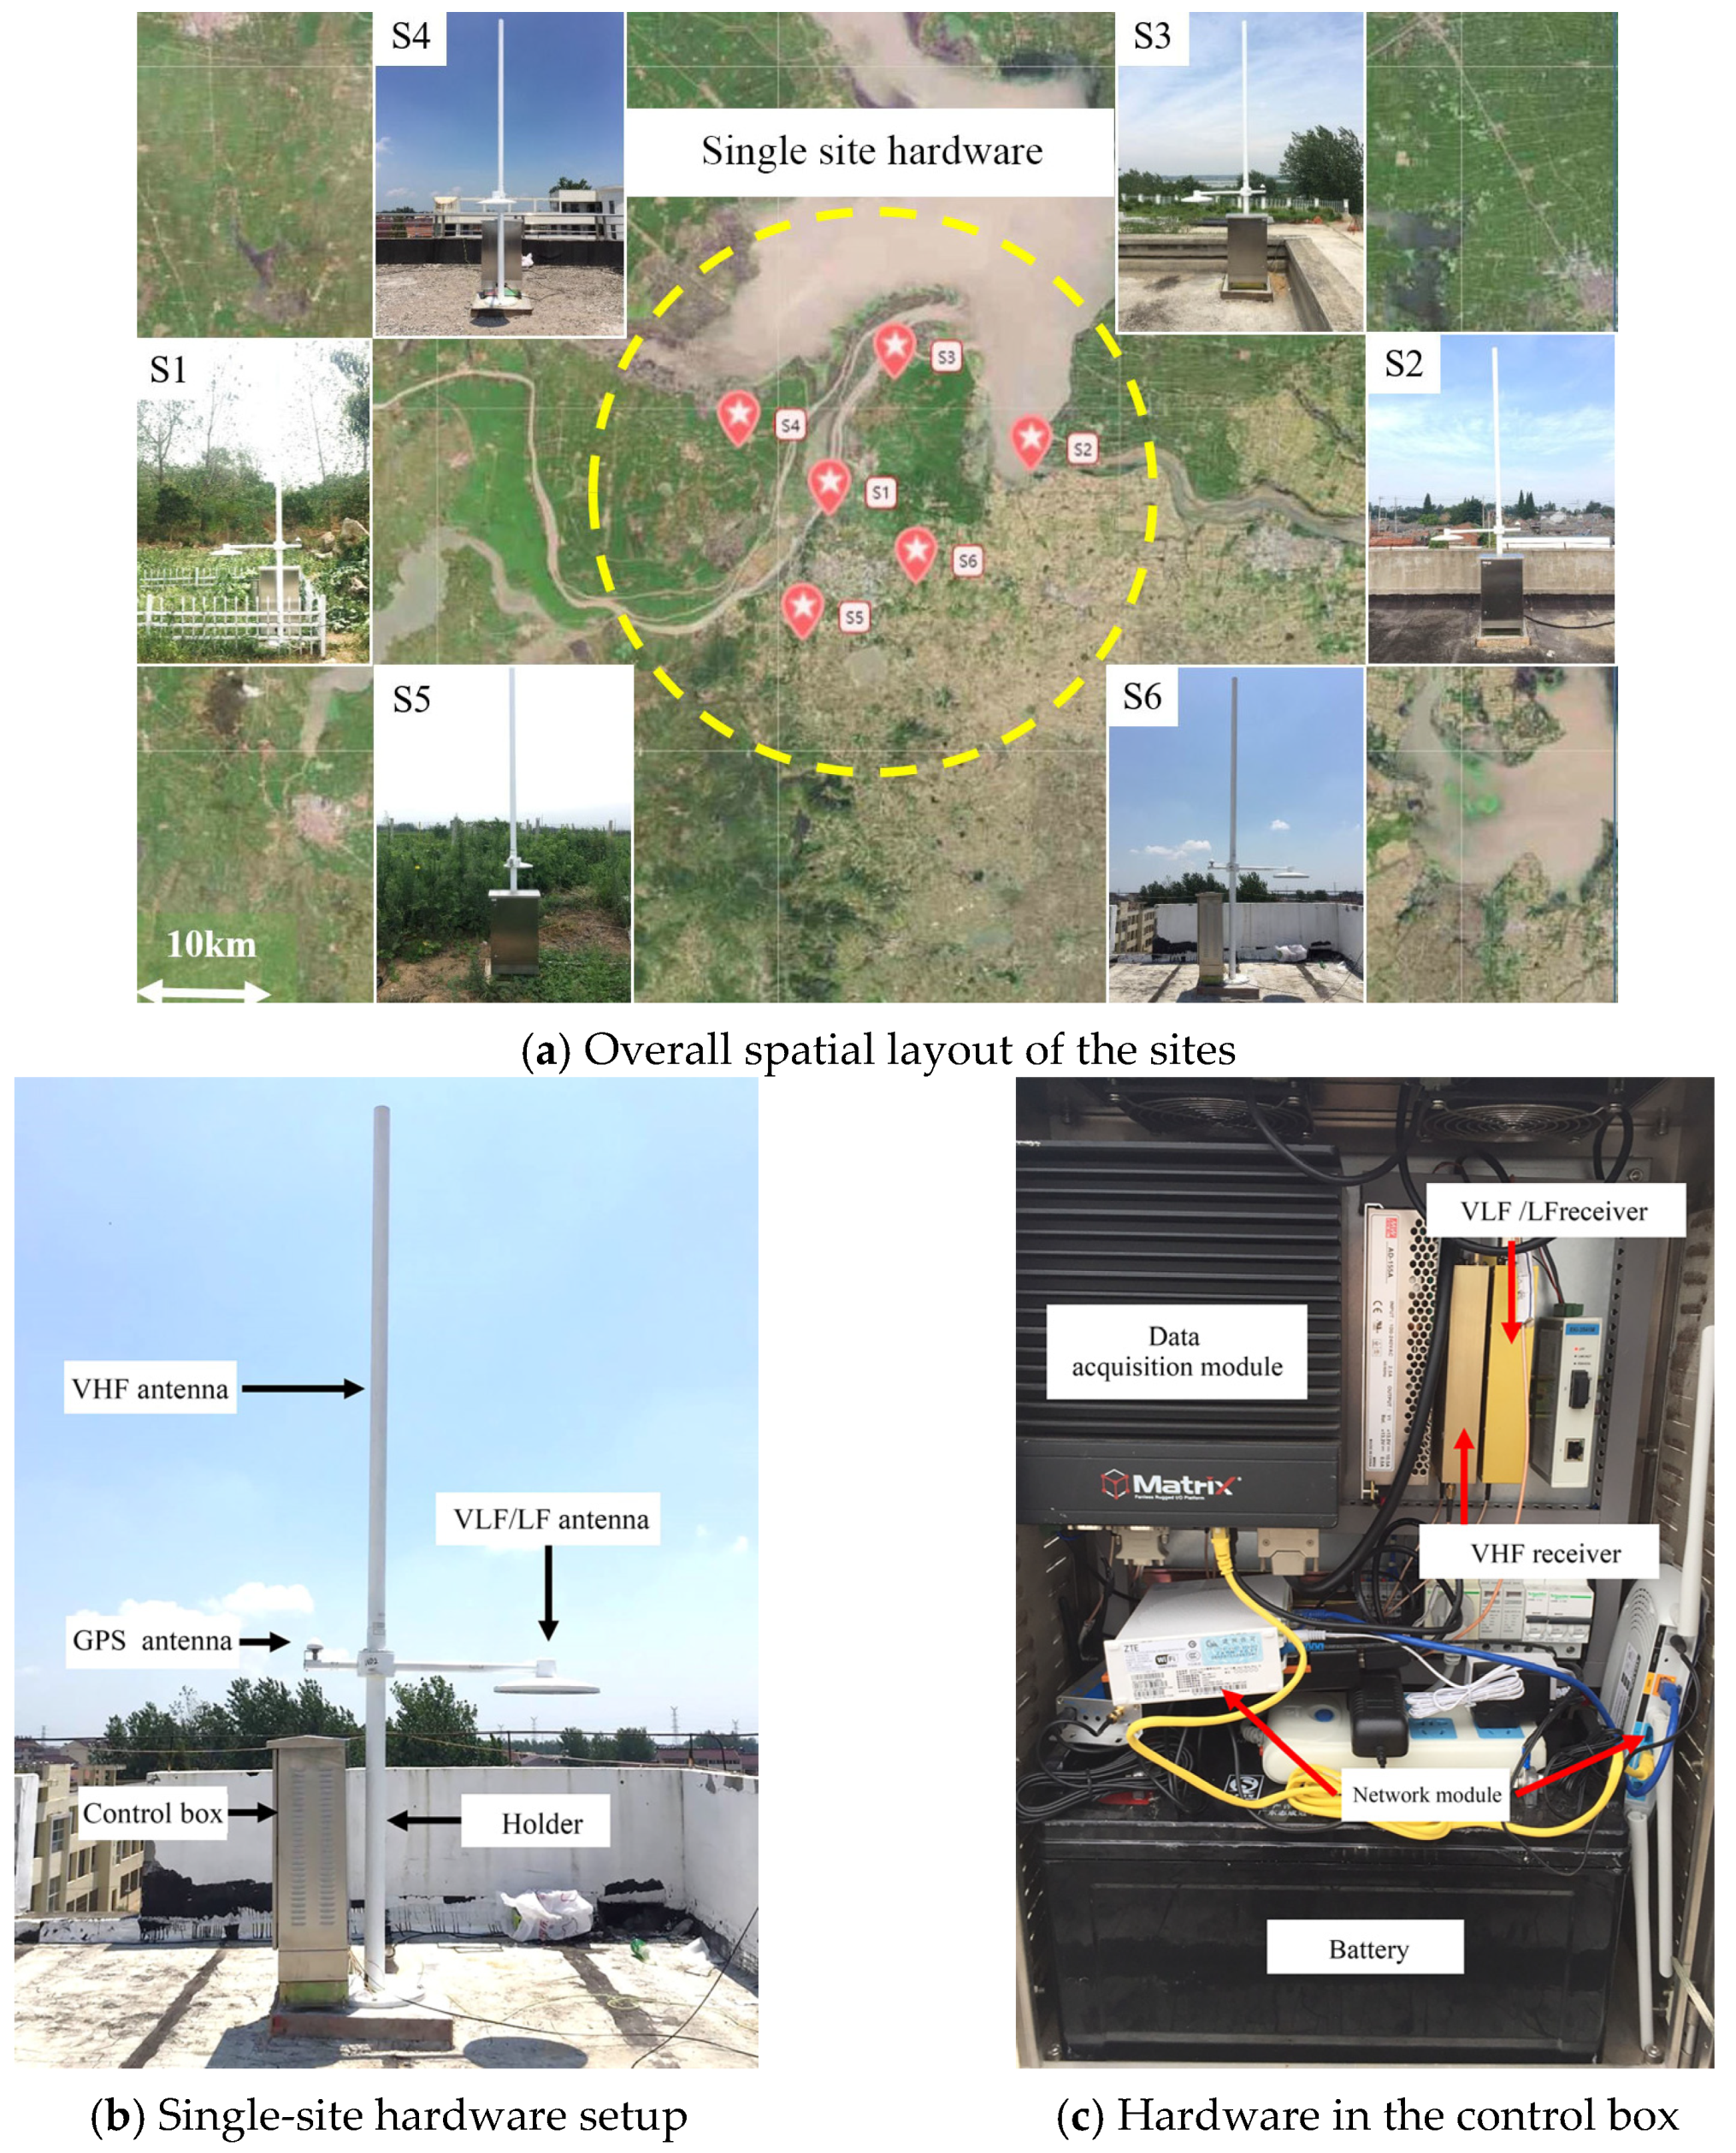
Based on the band-pass characteristics of the wavelet function, the signals of each site can be convolved with the wavelet function to filter out the direct current and low-frequency components of the signals while retaining the narrowband information near a specific frequency. By changing the scale factor a, the center frequency of the filter can be adjusted to ω/a.
The practical measured data are broadband signals, and the component signals of different frequencies have varying propagation speeds in the propagation path. Therefore, the peak time of different frequency components is inconsistent, so the superimposed peak positions have a certain deviation, resulting in a positioning error. Therefore, CWT is utilized to extract stable narrowband signals from the broadband non-stationary signals for peak positioning, which can avoid the interference of other frequency components and improve interference resistance, thereby enhancing positioning accuracy.
In the CWT method, the wavelet scale can be obtained by Equation (7), which can be used to convert different frequencies into different wavelet scales and characterize the degree of compression or stretching of the wavelet-based function. Herein, fs denotes the sampling frequency, wcf denotes the dimensionless wavelet central frequency determined by a wavelet-based function. This can be defined as the frequency at which energy is most concentrated within the spectrum, specifically, the frequency exhibiting maximum amplitude in the frequency domain. In practical applications, the center frequency facilitates the analysis of signal characteristics across different frequency bands; particularly when addressing non-stationary or complex signals, it provides more nuanced information, and fx denotes the selected frequency, which determines the size of wavelet scale. Specifically, the larger the fx, the smaller the scal, and the higher the oscillation frequency of the wavelet function. An appropriate wavelet frequency should be selected to maximize the waveform similarity between the wavelet function and the original signals, thereby improving positioning accuracy.
s c a l = f s × w c f f x
By performing convolution for original signals and the wavelet function, the wavelet similarity coefficient is obtained. Then, the time of arrival (TOA) positioning is calculated with the peaks of the similarity coefficient envelope curve as the arrival times of lightning pulses. This method can effectively improve positioning accuracy; filter out the influences of external noise, near-zone electrostatic field, and induction field; and enhance noise resistance.
The chromatic dispersion during the propagation of the LEMP waveform will result in the deceleration of the leading edge of the detected waveform, leading to an inaccurate peak arrival time. Figure 1 depicts the continuous wavelet transform of an original LEMP waveform within the range from 100 kHz to 2.5 MHz with an interval of 100 kHz. As the wavelet frequency increases, the wavelet coefficient curves at each frequency point gradually become sharper, the peak point position gradually shifts forward, and it becomes significantly dissimilar from the peak time of the pulse time-domain waveform.
The CWT method treats the peak of the wavelet coefficient curve as the arrival time of a single frequency component and inputs it into Equation (5) to solve for localization. It utilizes the narrowband feature extraction function of the CWT to treat a single frequency component as the localization object, rather than the full wave localization of the peak value method, thereby achieving higher localization accuracy.

2.4. Sites and Data

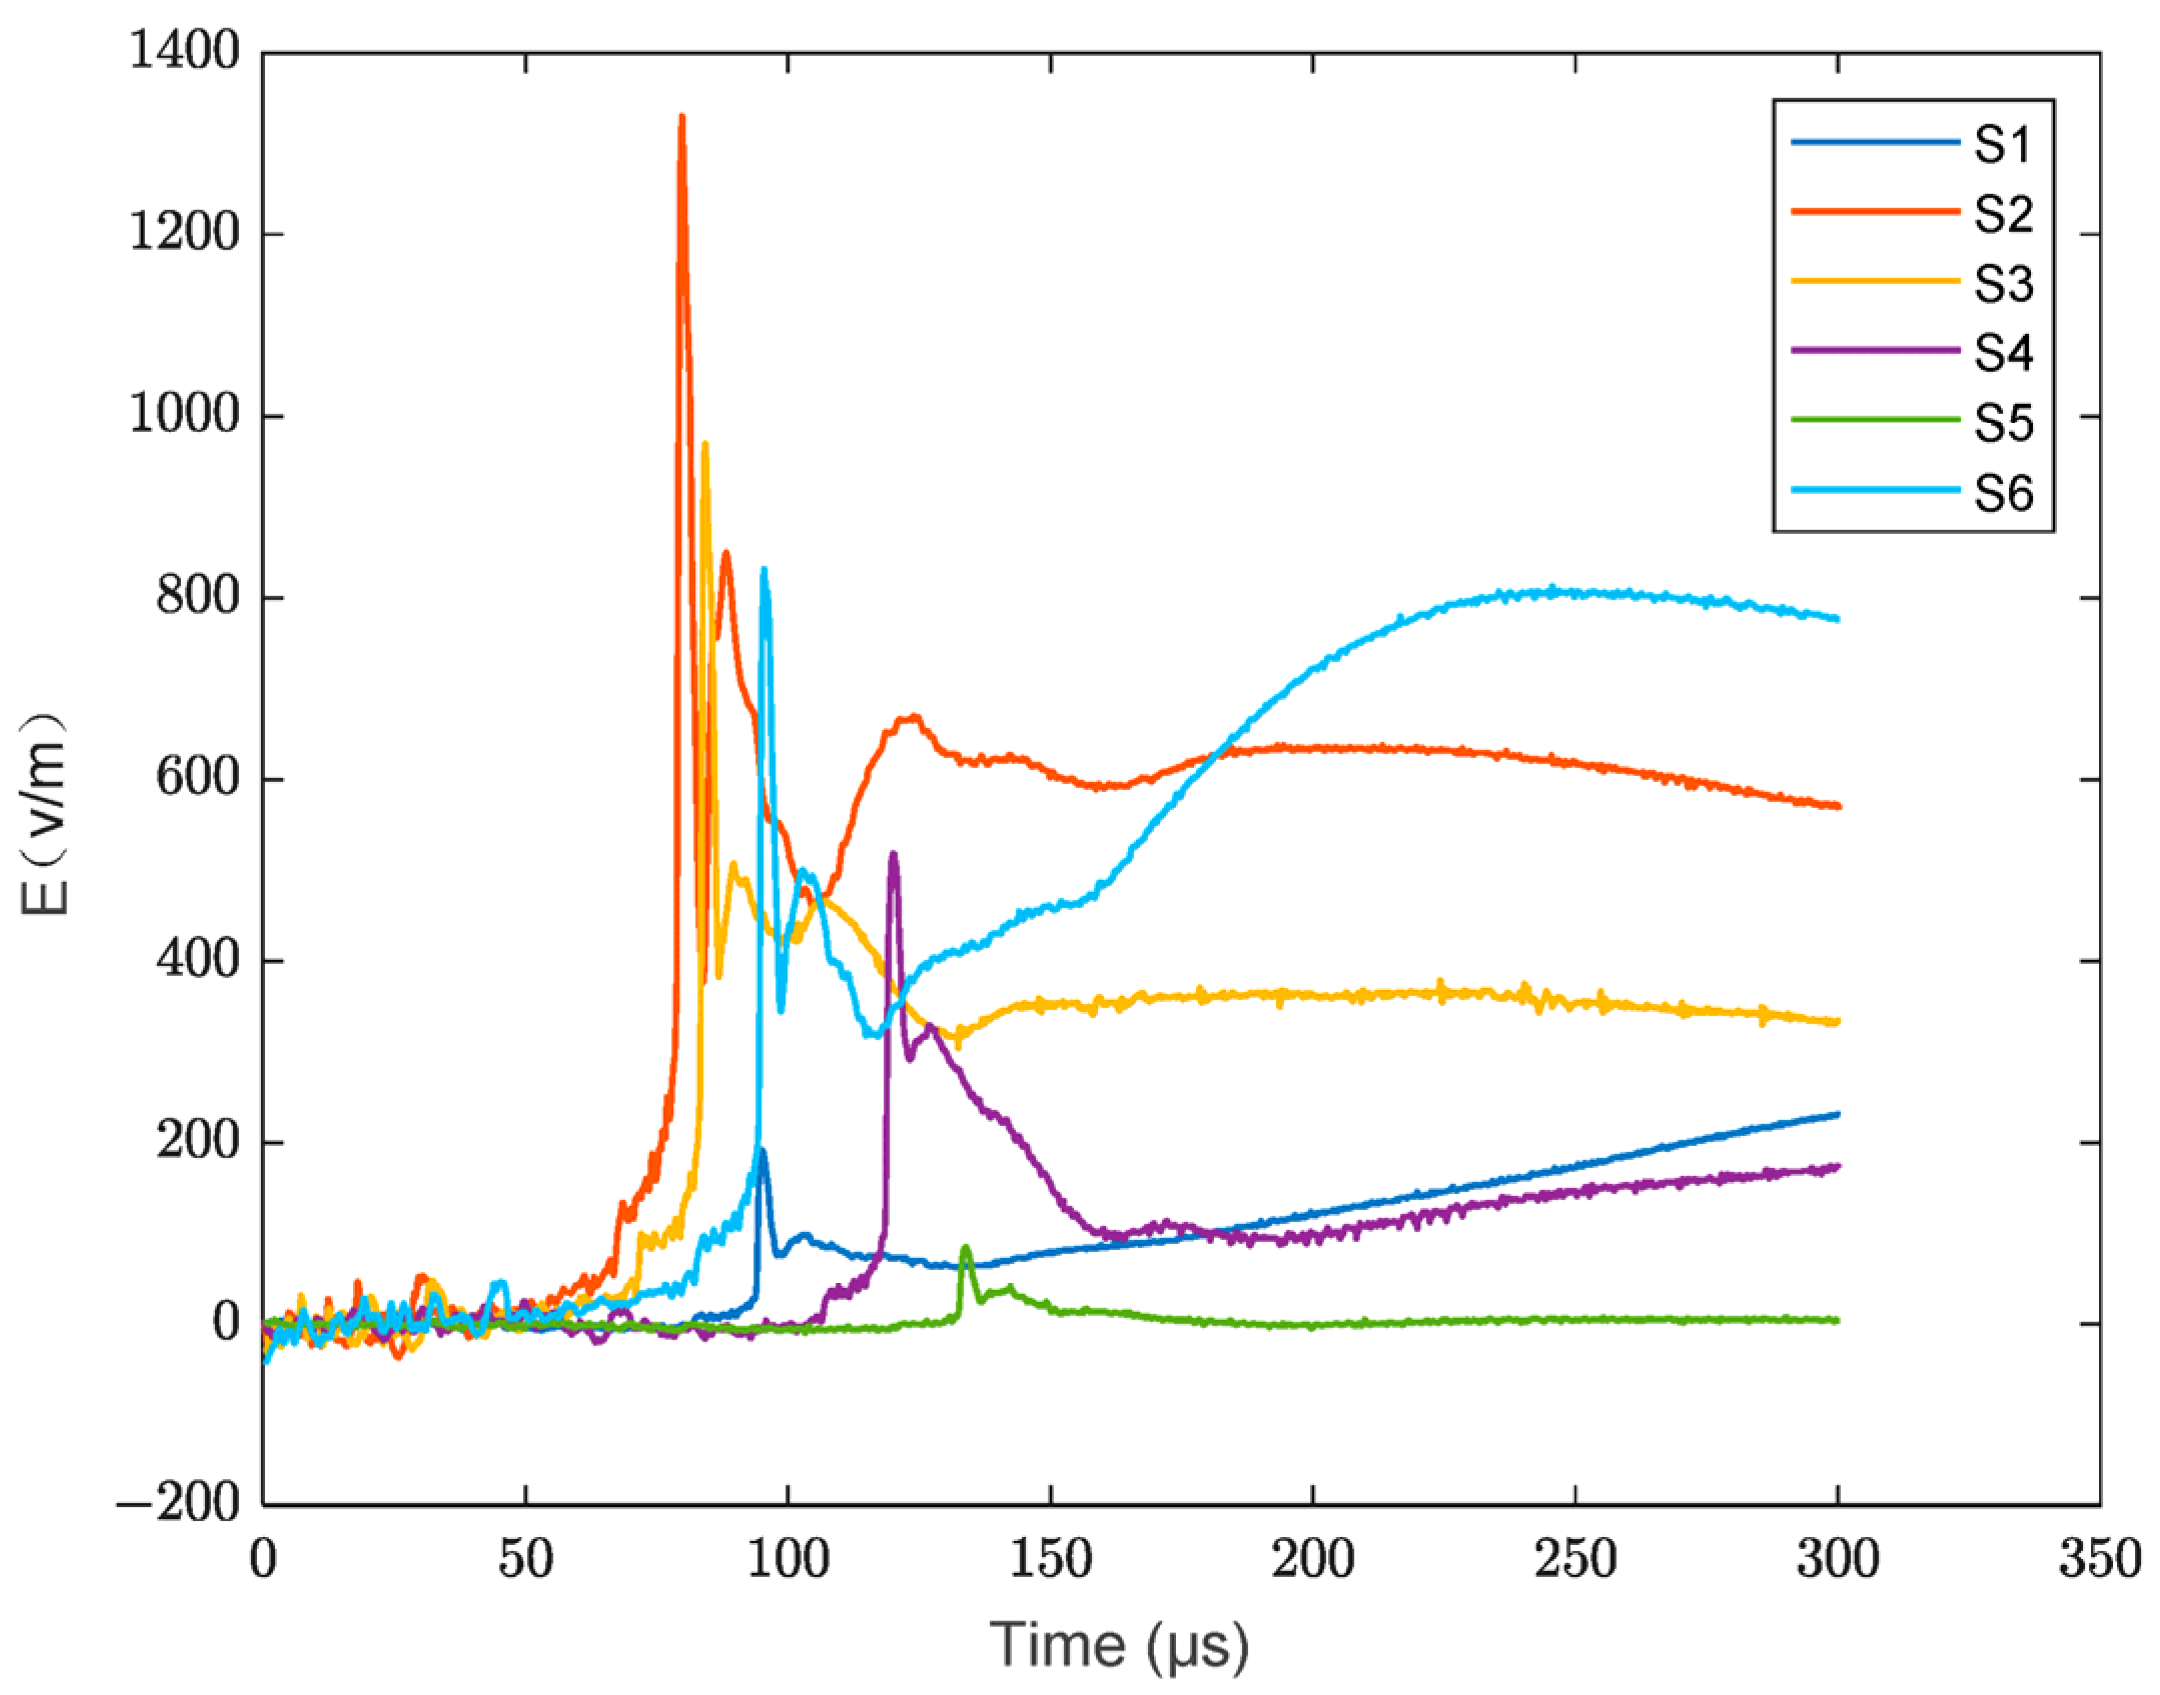
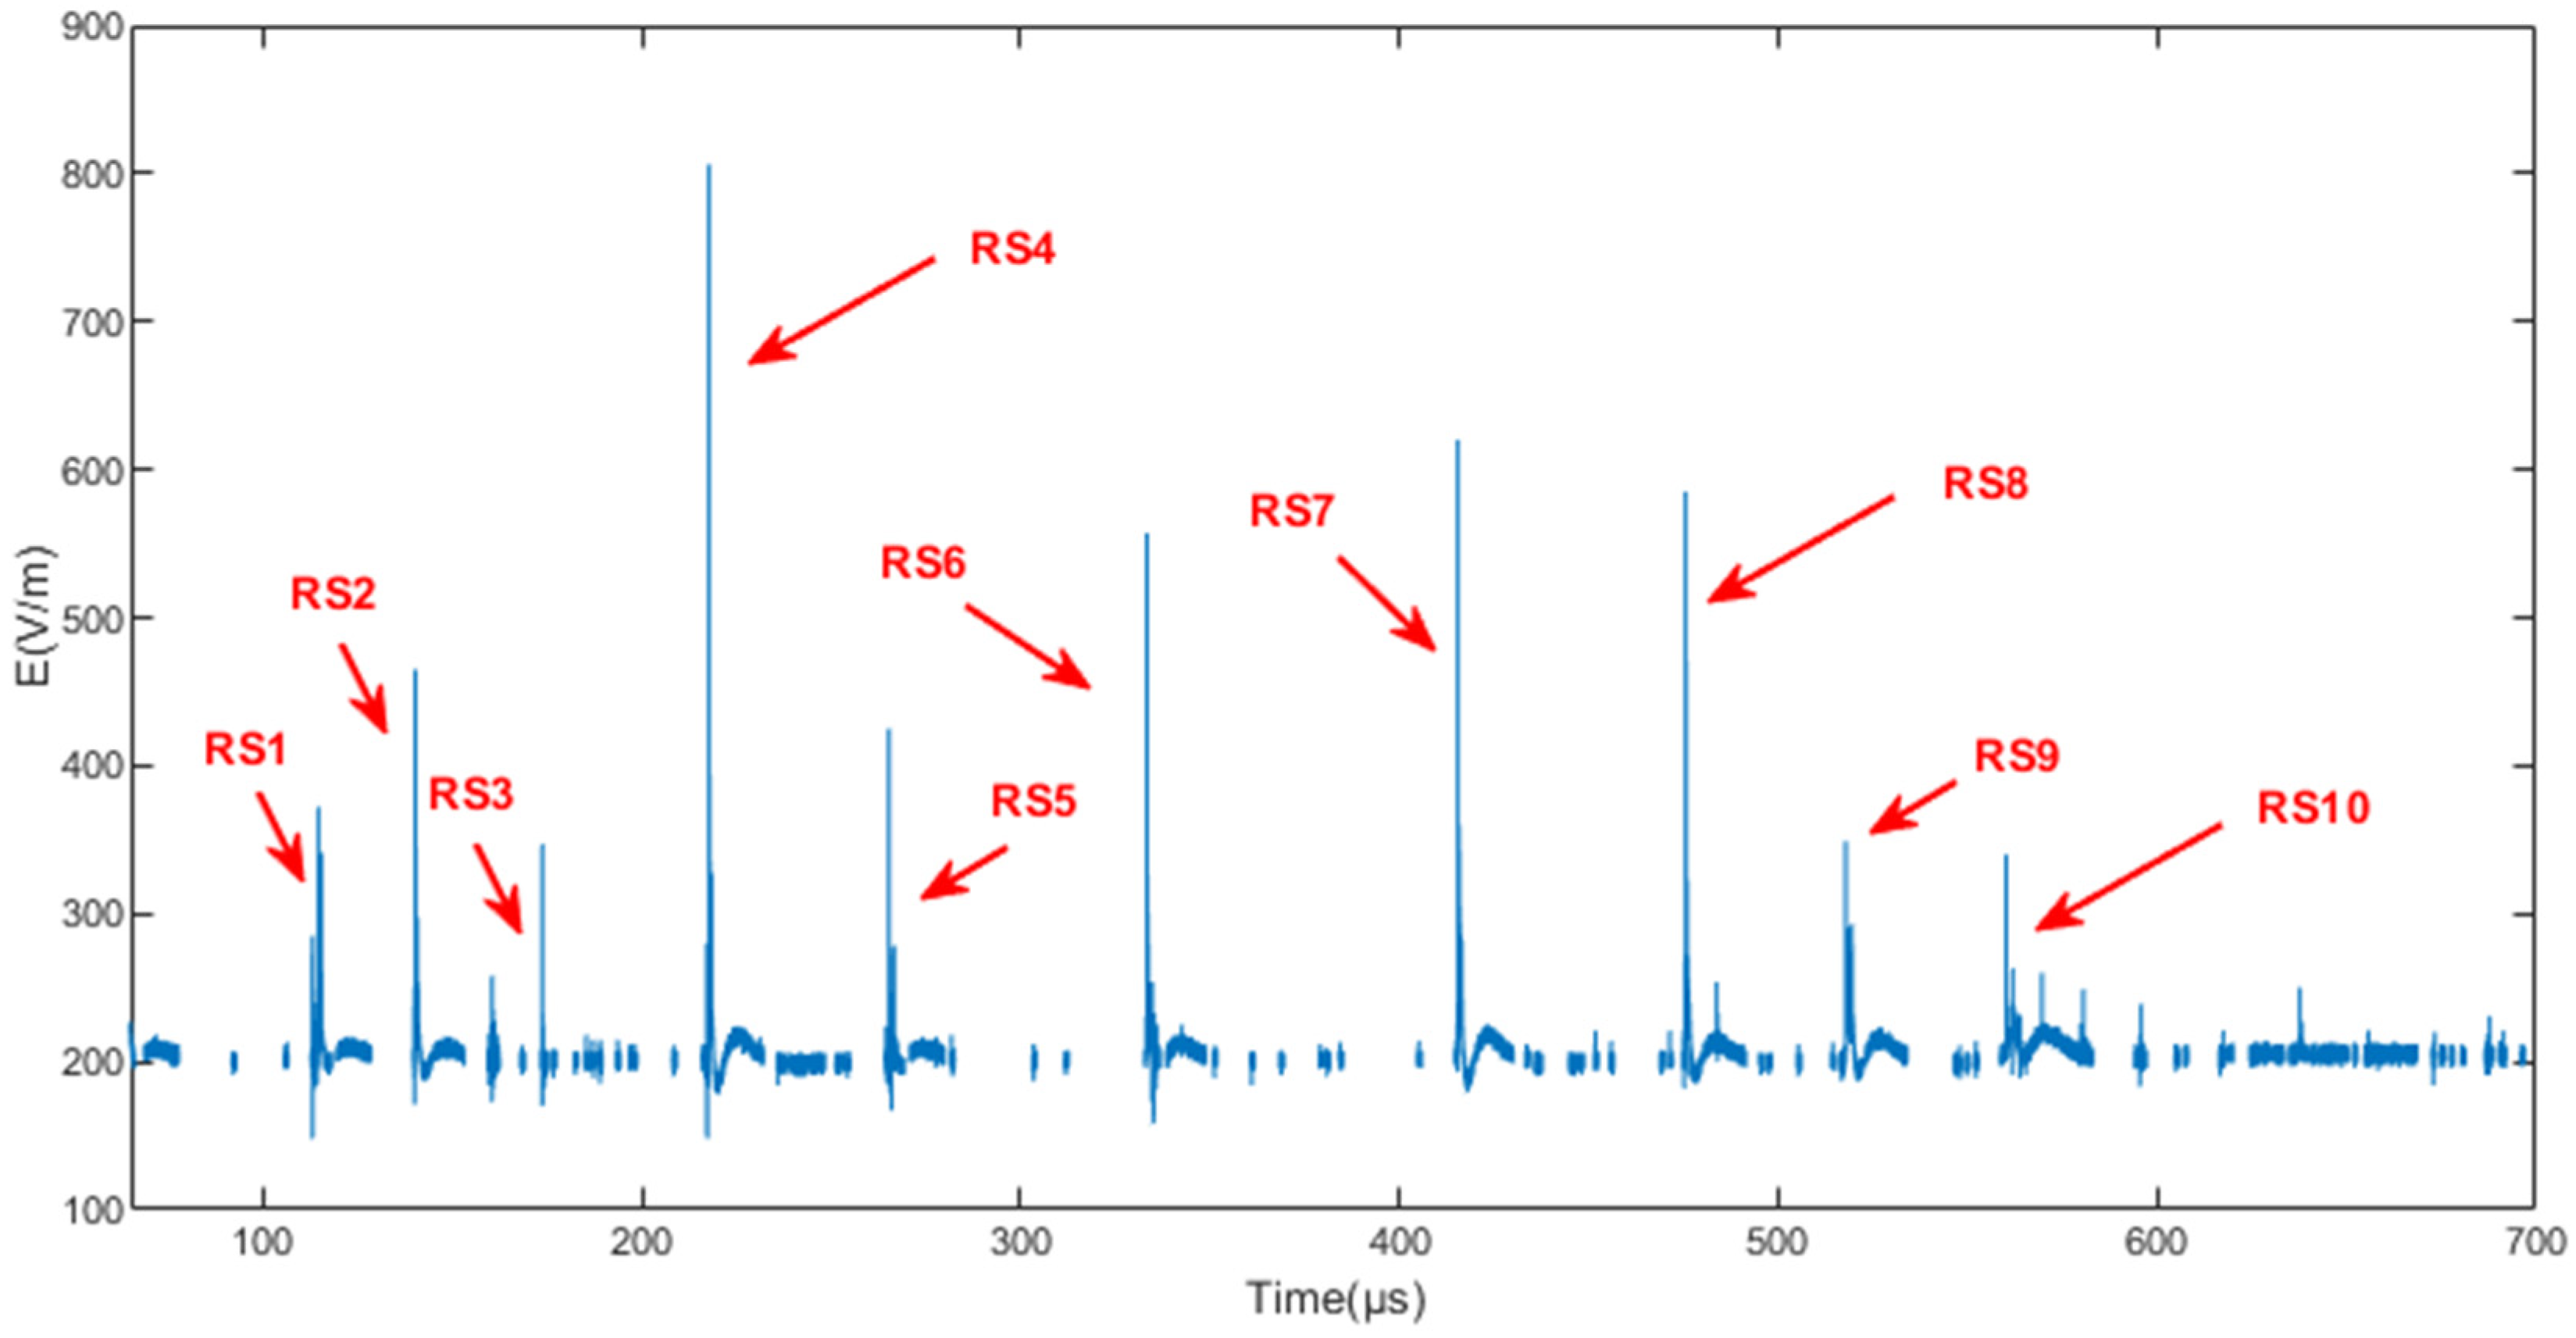
2.4.1. Practical Measured Data

A six-site network (S1–S6, as illustrated in Figure 2) of very high frequency (VHF) and very low frequency/low frequency (VLF/LF) dual-band 3D lightning positioning system was built around the triggered lightning testing field in Huai’an, Jiangsu Province, China. The spacing of the sites ranged from 10 to 30 km so that the lightning activities in the surrounding areas can be effectively detected. The coordinate origin of the detection network is determined based on the average of the longitude and latitude of six detection sites (S1 to S6).
Each detection site is composed of a VHF antenna, VLF/LF antenna, global positioning system (GPS) antenna, data acquisition module, and network module. The operating mode of the system is similar to that of the Chongqing site network [17,18]. The VHF module and VLF/LF module measure the vertical electric field generated by lightning radiation signals in different frequency bands, respectively.
The system extracts pulse peak parameters, including peak amplitude and peak time, from the VLF/LF waveform within a 1-ms time window, subsequently transmitting the data to the central site server to enable real-time positioning. The TOA method is employed for lightning localization, while lightning type classification is based on the characteristics of the VLF/LF waveforms. The VLF/LF receiver utilizes a fast electric field antenna with a time constant of 1 ms and a sampling rate of 5 MHz. After experimental calibration, the 3 dB bandwidth of the VLF/LF receiver is 200 Hz~800 kHz.
The data acquisition module implements a floating trigger threshold for waveform data storage. The resolution of the acquisition card is set at 12 bits, with record sampling lengths configurable at either 1 ms or 10 ms. The data acquisition card operates in pre-trigger mode, wherein it stores a specified amount of data in its buffer prior to the occurrence of a trigger event. This functionality allows for the capture of relevant information that precedes the triggering event.
The data acquisition module employs a floating trigger threshold to capture waveform data. The floating trigger threshold refers to the dynamic adjustment of triggering conditions based on the real-time characteristics of the signal. Compared to fixed trigger thresholds, this approach offers improved adaptability to signal variations and reduces instances of false triggers and missed detections. The resolution of the data acquisition card is 12 bits, allowing it to discern 1/4096 of the full-scale analog signals being collected. Each recording has a sampling duration of either 1 ms or 10 ms, with a pre-trigger setting configured at 30%, ensuring that the data acquisition card begins recording prior to detecting discharge events, thereby enhancing signal integrity. Additionally, GPS timing accuracy exceeds 50 ns to ensure the synchronization of data at each site.The detailed parameters of the data acquisition system are shown in Table 1.
In this study, the practical measured data were derived from results obtained during an artificially triggered lightning experiment using the VLF/LF receiver. A lightning discharge event was induced by the artificially triggered lightning rockets, during which the 6 VLF/LF antennas of the lightning positioning system independently recorded the LEMP waveforms of the return signal, as illustrated in Figure 3.

2.4.2. Simulation Data

The lightning current waveform defined by IEC 62305-1 (International Electro Technical Commission 62305-1) serves as the reference current for the lightning channel, from which the electromagnetic field generated by this current is calculated using the engineering models. The Wait formula is employed to assess the attenuation of the electromagnetic field during its propagation, resulting in electric field waveforms obtained at the six detection sites. These waveforms are used as simulation data for both peak method analysis and CWT calculations.
The engineering model is founded on physical parameters, including the amplitude and velocity of the current at the channel’s bottom, and it computes the electromagnetic field generated by the current utilizing Maxwell’s equations, as shown in Figure 4.
The model posits that the return stroke channel is perpendicular to the ground and devoid of branches, treating the channel as an ideal transmission line, with the ground acting as an infinite ideal conductor. Additionally, it assumes that the return stroke current propagates upward along the channel at a constant velocity c. In cylindrical coordinates, the vertical electric field at ground level can be expressed as follows:
E z r , t = 1 2 π ε 0 0 H t 2 3 sin 2 θ z R 3 z 0 t i z , τ R z / c d τ d z + 0 H t 2 3 sin 2 θ z c R 2 z i z , t R z / c d z 0 H t sin 2 θ z c 2 R z i z , t R z / c t d z
In this expression, the first term on the right represents the electrostatic field component, the second term denotes the induction field component, and the third term corresponds to the radiation field component [5].
r represents the horizontal distance from the radiation source to the detection site, while z denotes the height of the radiation source. Additionally, R = r 2 + z 2 represents the distance between the radiation source and the detection site. c denotes the propagation speed of electromagnetic waves, which is equivalent to the speed of light. The height of the discharge channel is set at H = 3 km, with a maximum propagation time of t = 300 μs.
The lightning current waveform of discharge channel adopts the model defined by IEC62305-1, that is, a double exponential function is added on the basis of the Heidler function. The expression is as follows:
i 0 , t = I 01 t / τ 1 2 1 + t / τ 1 2 e t / τ 2 + I 02 e t / τ 3 e t / τ 4
Among these parameters, I01 and I02 influence the peak value of the lightning current pulse, whereas τ1 and τ2 primarily govern the rising edge of the pulse, while τ3 and τ4 predominantly determine its falling edge.
Assuming that the attenuation of lightning current within the channel is negligible, the current waveform at any given height can be represented as follows:
i z , t = i 0 , t R / c
The current parameters are as follows: I01 = 11 kA, I02 = 7.5 kA, τ1 = 0.2 μs, τ2 = 5.212 μs, τ3 = 100 μs, and τ4 = 6 μs. Figure 5 shows the current profile defined by these parameters.
The engineering model presumes that the earth is an ideal conductor and disregards the attenuation of the high-frequency component of the electric field resulting from the propagation path. Hence, it is requisite to comprehensively contemplate the issue of electric field dispersion and rectify the calculation results of the electromagnetic field of the engineering model. As shown in Figure 6, a non-ideal earth transmission model is adopted, and the vertical electric field at the location of the detection site subsequent to the attenuation of the propagation is computed using the Wait formula, The expression is presented in Equation (11).
At a distance r from the location where artificial lightning was initiated, the expression of the time-domain vertical electric field can be presented as follows by means of a convolution integral:
E z a ( r , t ) = 0 t E z ( r , τ ) f a ( r , t τ ) d τ
In Equation (11), Ez is the vertical electric field before attenuation, Eza is the vertical electric field after attenuation, fa is the time-domain form of the attenuation function, and Fa(p) is the frequency-domain form of the attenuation function. In the multi-station system being considered in this paper, the expression of the attenuation function Fa(p) is as follows:
F a p = 1 j π p e p erfc j p
where erfc is the complementary error function, and p is called the numerical distance and is defined as:
p = 0.5 γ 0 ρ Δ str 2
In the equation, γ0 is the free space wavenumber, which is expressed as
γ 0 = j ω μ 0 ε 0
Δstr is the normalized surface impedance, which is expressed as
Δ str = ε 0 μ 0 K 1
Among them, h1 represents the thickness of the soil, and the expressions of the remaining parameters are as follows:
K 1 = u 1 σ 1 + j ω ε 0 ε r 1 ,   u 1 = γ 1 2 γ 0 2 ,   γ 1 = j ω μ 0 σ 1 + j ω ε 0 ε r 1
In this paper, the earth is regarded as a medium with the same transmission parameters and with the following values for each parameter:
ε 0 = 8.854187817 × 10 12 ,   ε r 1 = 10 ,   μ 0 = 1.257 × 10 6 ,   σ 1 = 0.005 .
As illustrated in Equation (8), the total field comprises three components: the electrostatic field, the induction field, and the radiation field. Taking into account the attenuation of LEMP during propagation, it is evident that the electrostatic and induction field components exert a significant influence at close range, whereas the radiation field component becomes predominant at greater distances. The low-frequency characteristics of the slowly varying electrostatic and induction fields (as depicted in Figure 7c) lead to a lack of distinct pulsatile behavior, complicating direct and accurate extraction of lightning arrival times. Consequently, for lightning TOA positioning, either the total field (as depicted in Figure 7a) or the radiation field (as depicted in Figure 7b) is typically employed.

3. Results

3.1. Horizontal Positioning Results of Simulation Data

The peak value method was employed to directly extract the peak times from six sets of total field data, with these peak times serving as the arrival times of lightning. The six extracted peak times, along with the three-dimensional coordinates of the six detection sites, were input into Equation (5) to determine the spatial coordinates of the lightning channel. The calculated horizontal coordinates for the lightning were (7.5820, 5.3915), while the actual horizontal coordinates for the artificially triggered lightning point were (7.51, 5.33). Consequently, the spatial distance between these two points—representing the positioning error—was found to be 94.7 m.
The sampling rate of the simulation data is set at 5 MHz. According to Shannon’s sampling law, the frequency limit of the effective component in the signal is 2.5 MHz. Cyclic convolution is performed within the band of 0:1: 2500 kHz, and the peak point of the wavelet coefficient curve (as depicted in Figure 8) is taken as the lightning arrival time, the wavelet coefficient curves are arranged from top to bottom in descending order of wavelet frequency. As shown in Figure 9, except for the initial and terminal parts, the positioning accuracy of the CWT method in most frequency bands (100 kHz to 2.2 MHz) is significantly superior to that of the peak method, and the optimal positioning accuracy reaches 5.6 m.

3.2. Horizontal Positioning Results of Practical Artificially Triggered Lightning Data

The wavelet frequency is scanned within the range of 0~2.5 MHz, and the wavelet coefficient envelope of the measured signal is used for TOA positioning to find the optimal positioning accuracy of the CWT method. As the wavelet frequency increases, the width of the wavelet coefficient curve (as depicted in Figure 10) gradually narrows, and its peak value diminishes.
Using the peak value of the envelope as the arrival time of waves at each frequency point, positioning results are obtained. The positioning errors corresponding to different frequency points are illustrated in Figure 11. The positioning error of the peak value method amounts to 139.5 m in the measured data. Within most of the analyzed frequency bands (300 kHz:100 kHz:2.5 MHz), the horizontal positioning error of the CWT method is conspicuously lower than that of the peak value method, with the minimum positioning error being 9.2 m.

4. Discussion

4.1. Effects of Three Electric Field Components for Positioning Accuracy on Peak Method

The peak value method is used to perform positioning calculations of simulation data in the total field, radiation field, and synthesis of electrostatic and induction fields, respectively. As indicated by the calculation results, the positioning error of the simulation data in the total field amounts to 94.7 m, that of the simulation data in the radiation field is 71.6 m, and the peaks of the time-domain waveform synthesis of electrostatic and induction fields are not prominent. Meanwhile, the peak value approach can scarcely extract precise arrival times of waves, and it is arduous to obtain a suitable solution by directly applying the TOA method.
By comparing the three sets of time-domain waveforms obtained from the engineering model, it can be easily found that the radiation field has the steepest rising edge and abundant high-frequency components, while the synthesis of electrostatic and induction fields has a relatively flat rising edge and abundant low-frequency components. Since the simulation data in the total field contain the data in the electrostatic field and induction field, the total field has a flatter rising edge and inaccurate peak; due to this, large errors may occur in the case of using the peak value method for positioning at relatively low sampling frequencies. Therefore, the synthesis of electrostatic and induction fields component is stripped, and only the radiation field data are used for calculation, which demonstrates significantly improved positioning accuracy.

4.2. Effects of Three Electric Field Components for Positioning Accuracy on CWT Method

The peak method utilizes the time-domain pulse characteristics of the electric field waveform for positioning. The relatively low-frequency electrostatic and induction fields cause the waveform to flatten and the peaks to become indistinct. Thus, the highest positioning precision is achieved by only utilizing the relatively high-frequency radiation field. The positioning accuracy of the total field is slightly lower. Moreover, the synthesized field of the electrostatic and induction fields has no obvious peaks, and therefore, the positioning result cannot be derived.
Unlike the peak method, the CWT method uses a specific frequency component of the electric field signal for positioning. Figure 12 shows the positioning results of the CWT method for the total field, radiation field, and synthesis of electrostatic and induction fields at intervals from 20 kHz to 0~2.5 MHz. It can be seen that the minimum positioning error for all three components is 5.6 m, which is significantly higher than the positioning results of the peak method, especially for the synthesized electrostatic and induction fields, which can also be positioned.
The disparity in the positioning efficacy of the three components lies in the inconsistent effective frequency range: the radiation field exhibits a favorable positioning effect across almost the entire frequency range (40–2.5 MHz); the total field demonstrates a good effect within the frequency range of 80–2.3 MHz; while the effective frequency range of synthesis of electrostatic and induction fields is the narrowest, and it can merely achieve positioning within the frequency range of 140 kHz~1.5 MHz. According to Formula (7), the wavelet function compresses more at relatively higher frequencies, the compression scale of the wavelet function increases, leading to a more pronounced sharpness in the waveform of the wavelet basis function. However, as illustrated in Figure 7c, the synthesis waveform of the electrostatic and induced fields is relatively smooth, lacking distinct peak features. Consequently, in the high-frequency band, the similarity between this waveform and the wavelet basis function is reduced, resulting in less prominent peaks in the wavelet coefficient curve, which may cause Equation (5) to be unable to obtain precise results, leading to significant positioning errors.

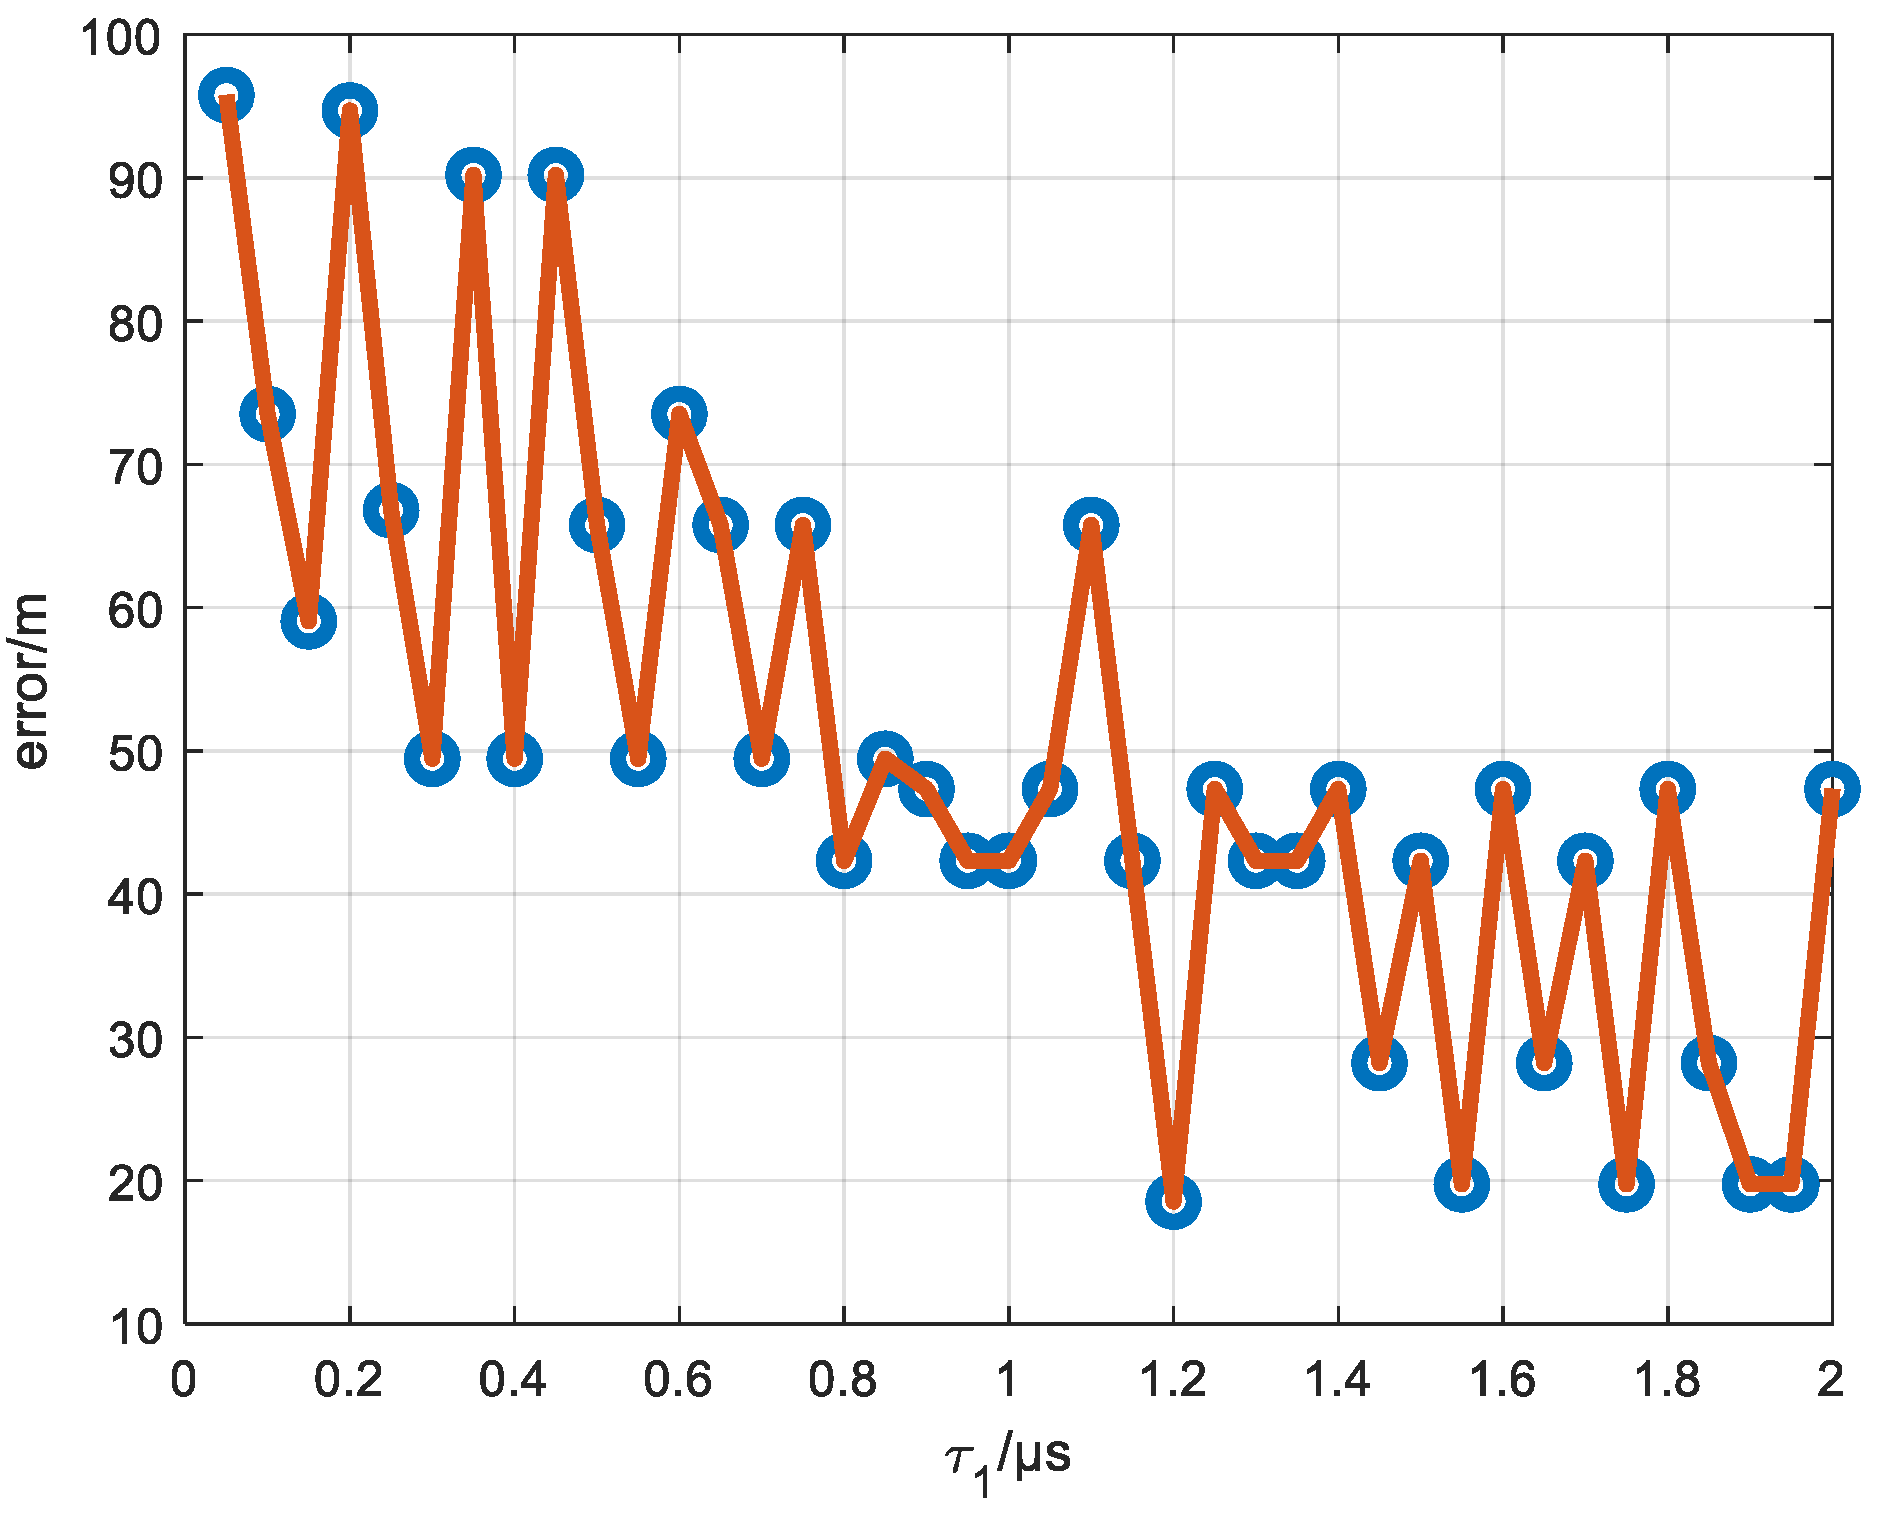
4.3. Effects of Current Waveform Profile on Positioning Accuracy

In order to modify the profile of the lightning current waveform, 40 distinct τ1 values were selected from the range of 0.05–2 μs, resulting in 40 current pulse waveforms characterized by varying degrees of sharpness at both the leading edge and peak, as illustrated in Figure 13, the pulse peak values from top to bottom correspond respectively to τ1 values ranging from 0.05 μs to 0.2 μs.

4.3.1. Effects of Current Waveform Profile on Positioning Accuracy of Peak Value Method

By employing the peak value method to locate the lightning current waveforms for 40 distinct profiles, as presented in Figure 14, the positioning error values are represented by blue circles, while the errors between adjacent τ1 values are connected by red lines to illustrate the trend of error variation. it can be observed that as τ1 is constantly augmented, the current waveform profile gradually turns sharper, and the positioning accuracy is generally enhanced, with the lowest positioning error reaching 20 m.
Nevertheless, there exists an oscillation phenomenon in the positioning error between adjacent profiles. This is because the differences between adjacent current profiles are minor, the peak point positions are relatively close, and the sampling rate of the simulation data is set at 5 MHz, which is not proficient in distinguishing adjacent two peak points. It is prone to treating the adjacent points as the signal arrival time, thereby resulting in an increase in the error.

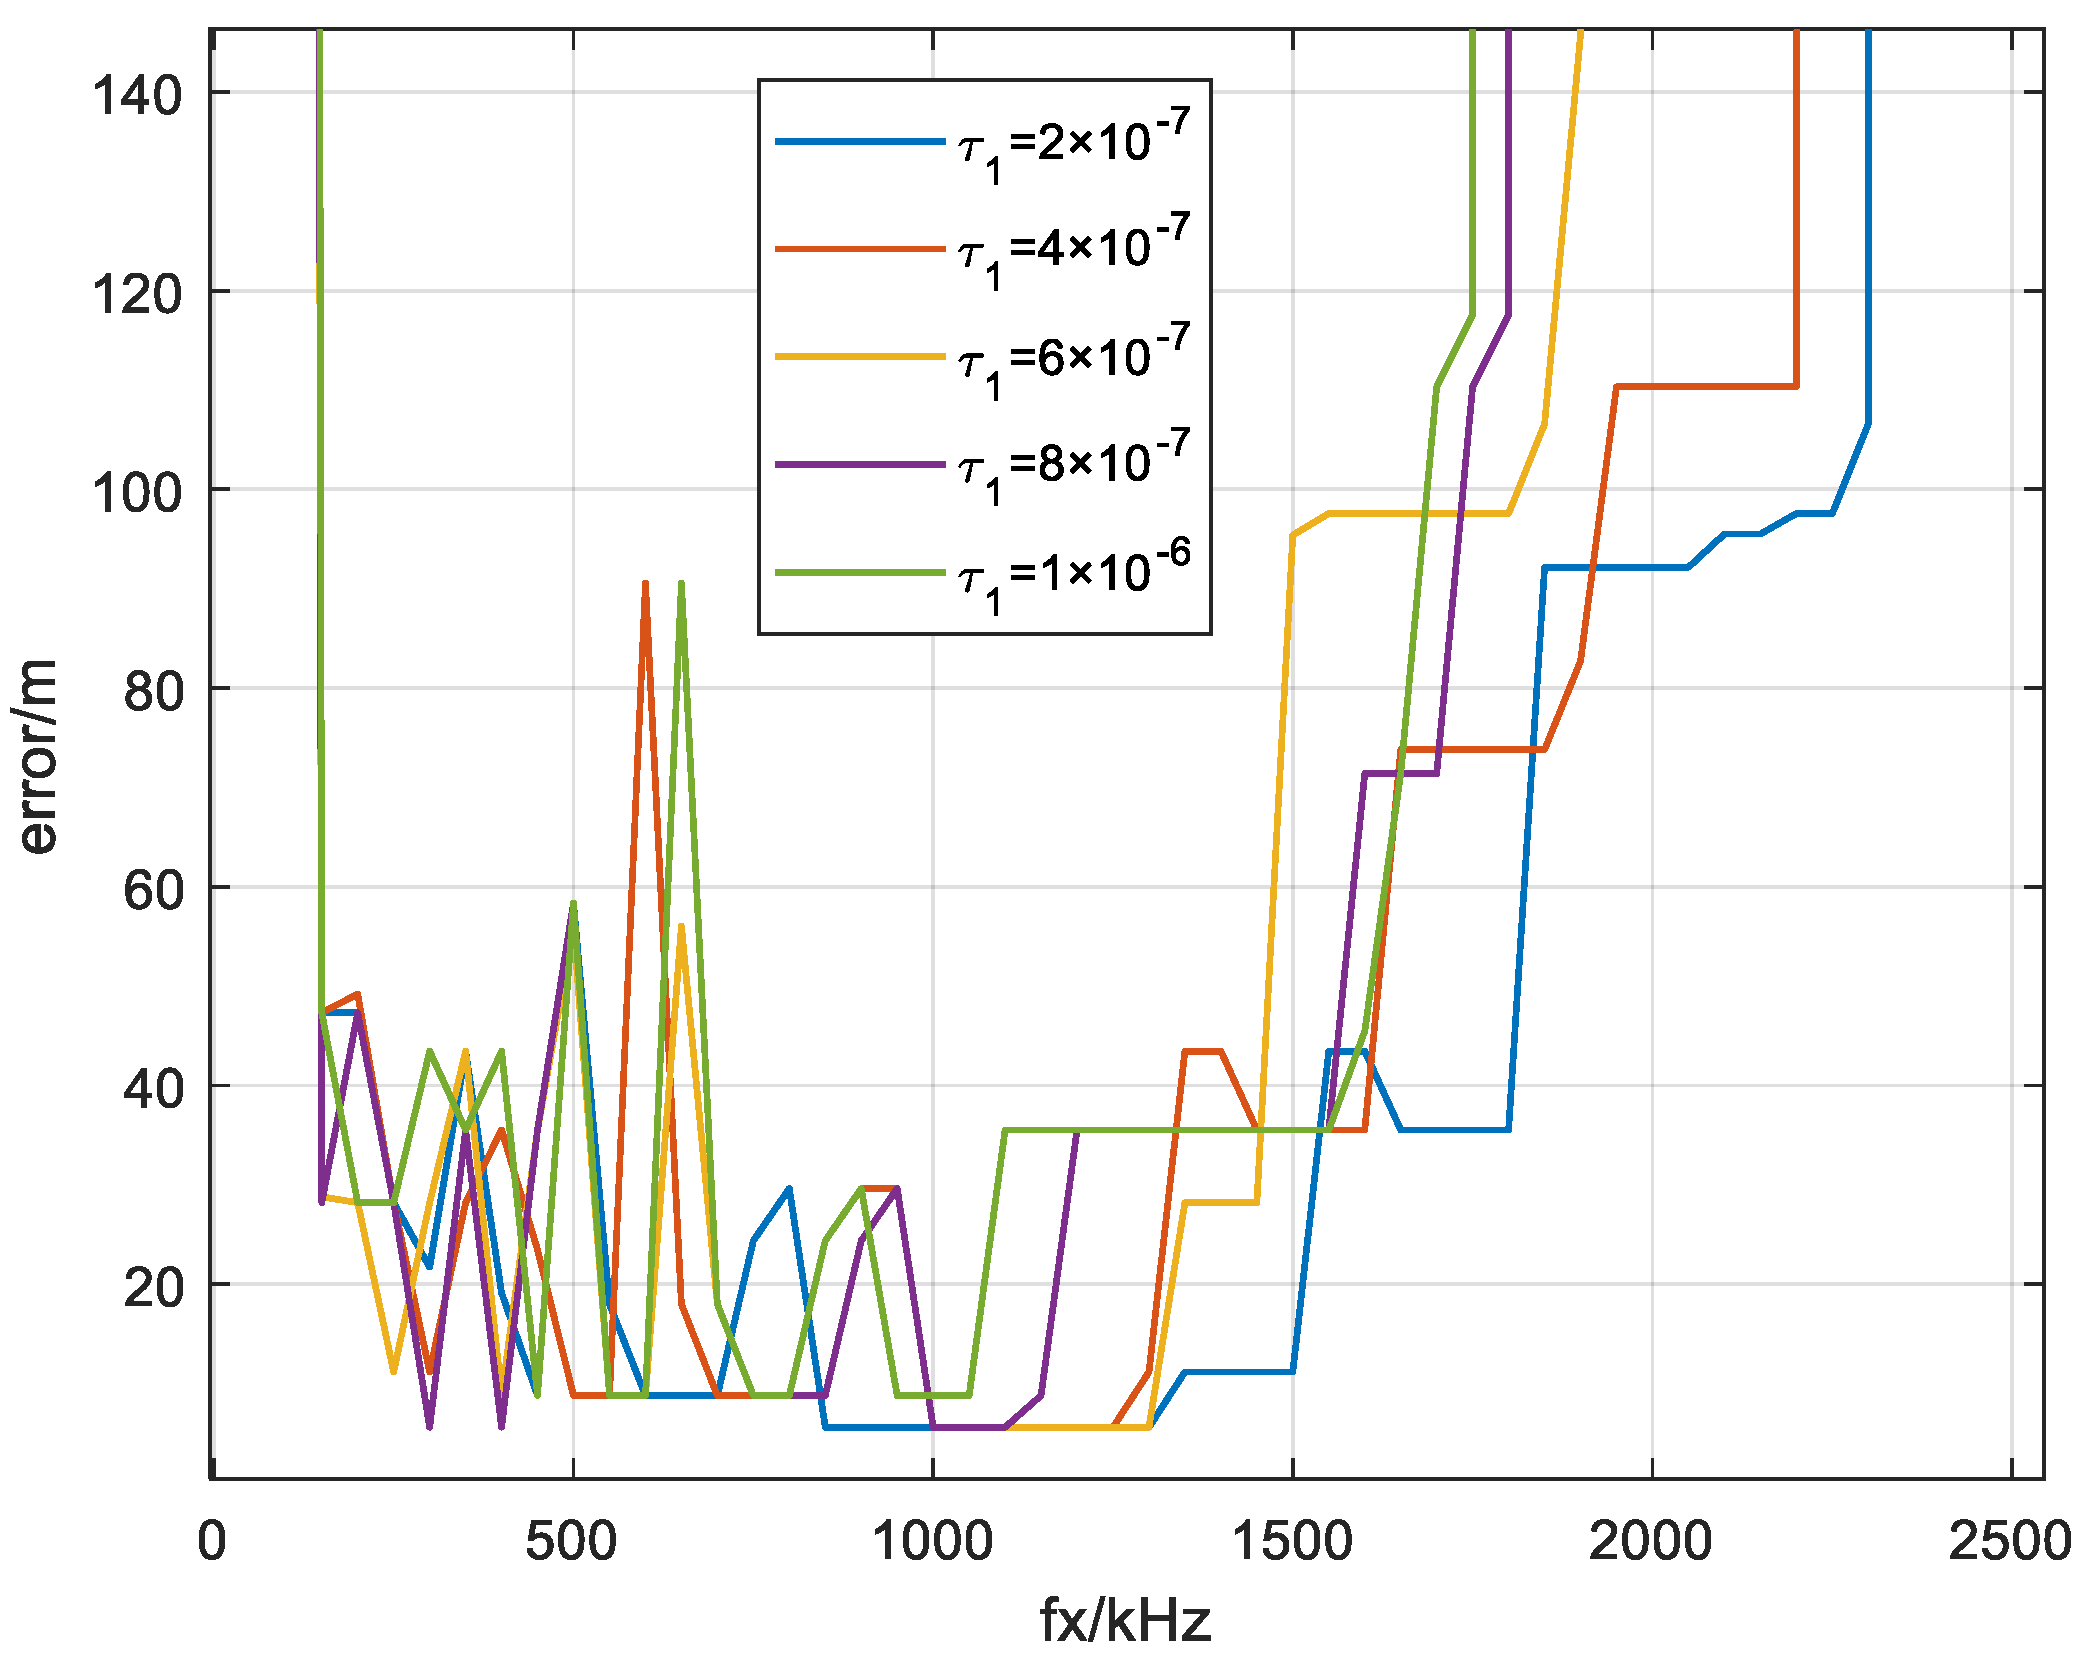
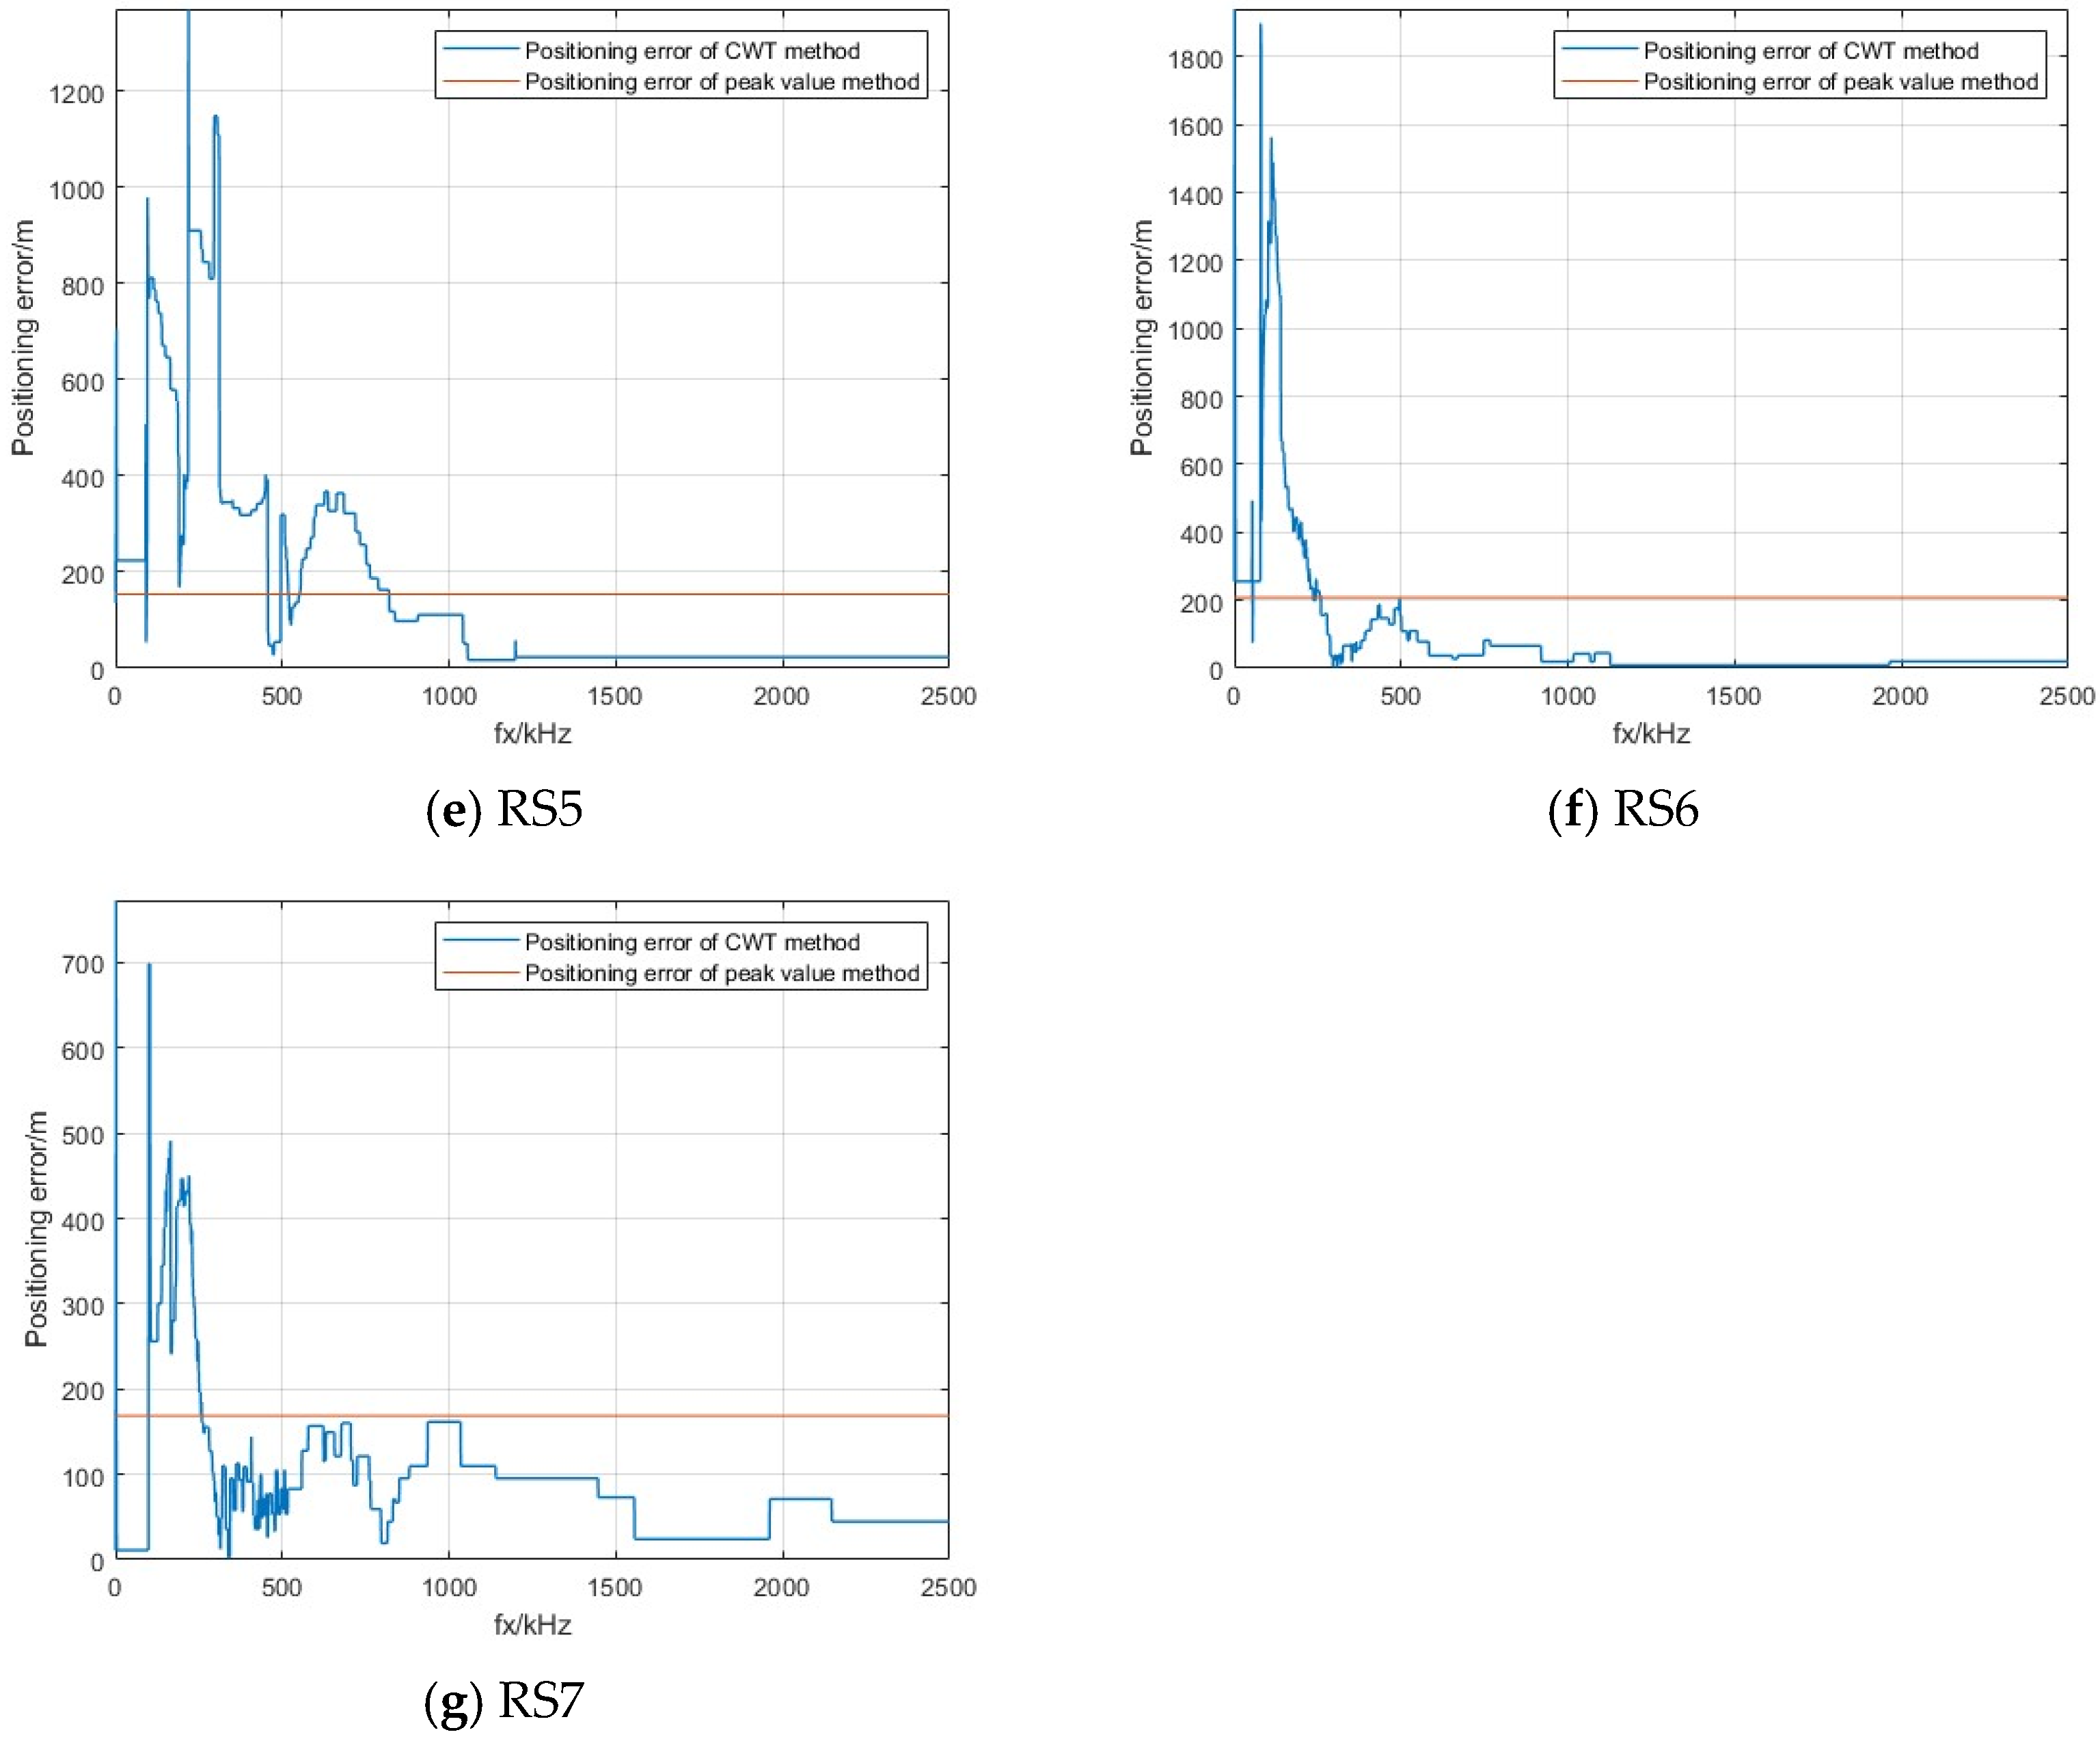
4.3.2. Effects of Current Waveform Profile on Positioning Accuracy of CWT Method

The current waveforms of five sets of simulated data were located by the CWT method, and the error curves within the 0~2.5 MHz frequency range are depicted in Figure 15. It is conspicuously observable that as τ1 increases, the upper limit of the frequency band capable of being effectively localized also escalates. Within the range of 750 kHz~1.5 MHz, the position error lies between 5.60 and 29.63 m, which is significantly superior to that of the peak method (42.33–95.78 m).

4.4. Wavelet Frequency Selection

Upon comparing the positioning outcomes derived from the simulated data and the measured data through the CWT method, it can be perceived that the positioning effect is generally satisfactory within the frequency range of 1~2 MHz, which is notably superior to the peak method. Consequently, it can be inferred that for the typical pulse waveform of LEMP, this frequency band within the range can be chosen as the wavelet frequency for the CWT method. The sampling rate of both types of data is 5 MHz. According to Shannon’s sampling theorem, the upper limit of the effective frequency of the useful component is 2.5 MHz. Hence, 50~80% of this value (e.g., 1~2 MHz) can be selected as the wavelet frequency to achieve high-precision lightning positioning results.

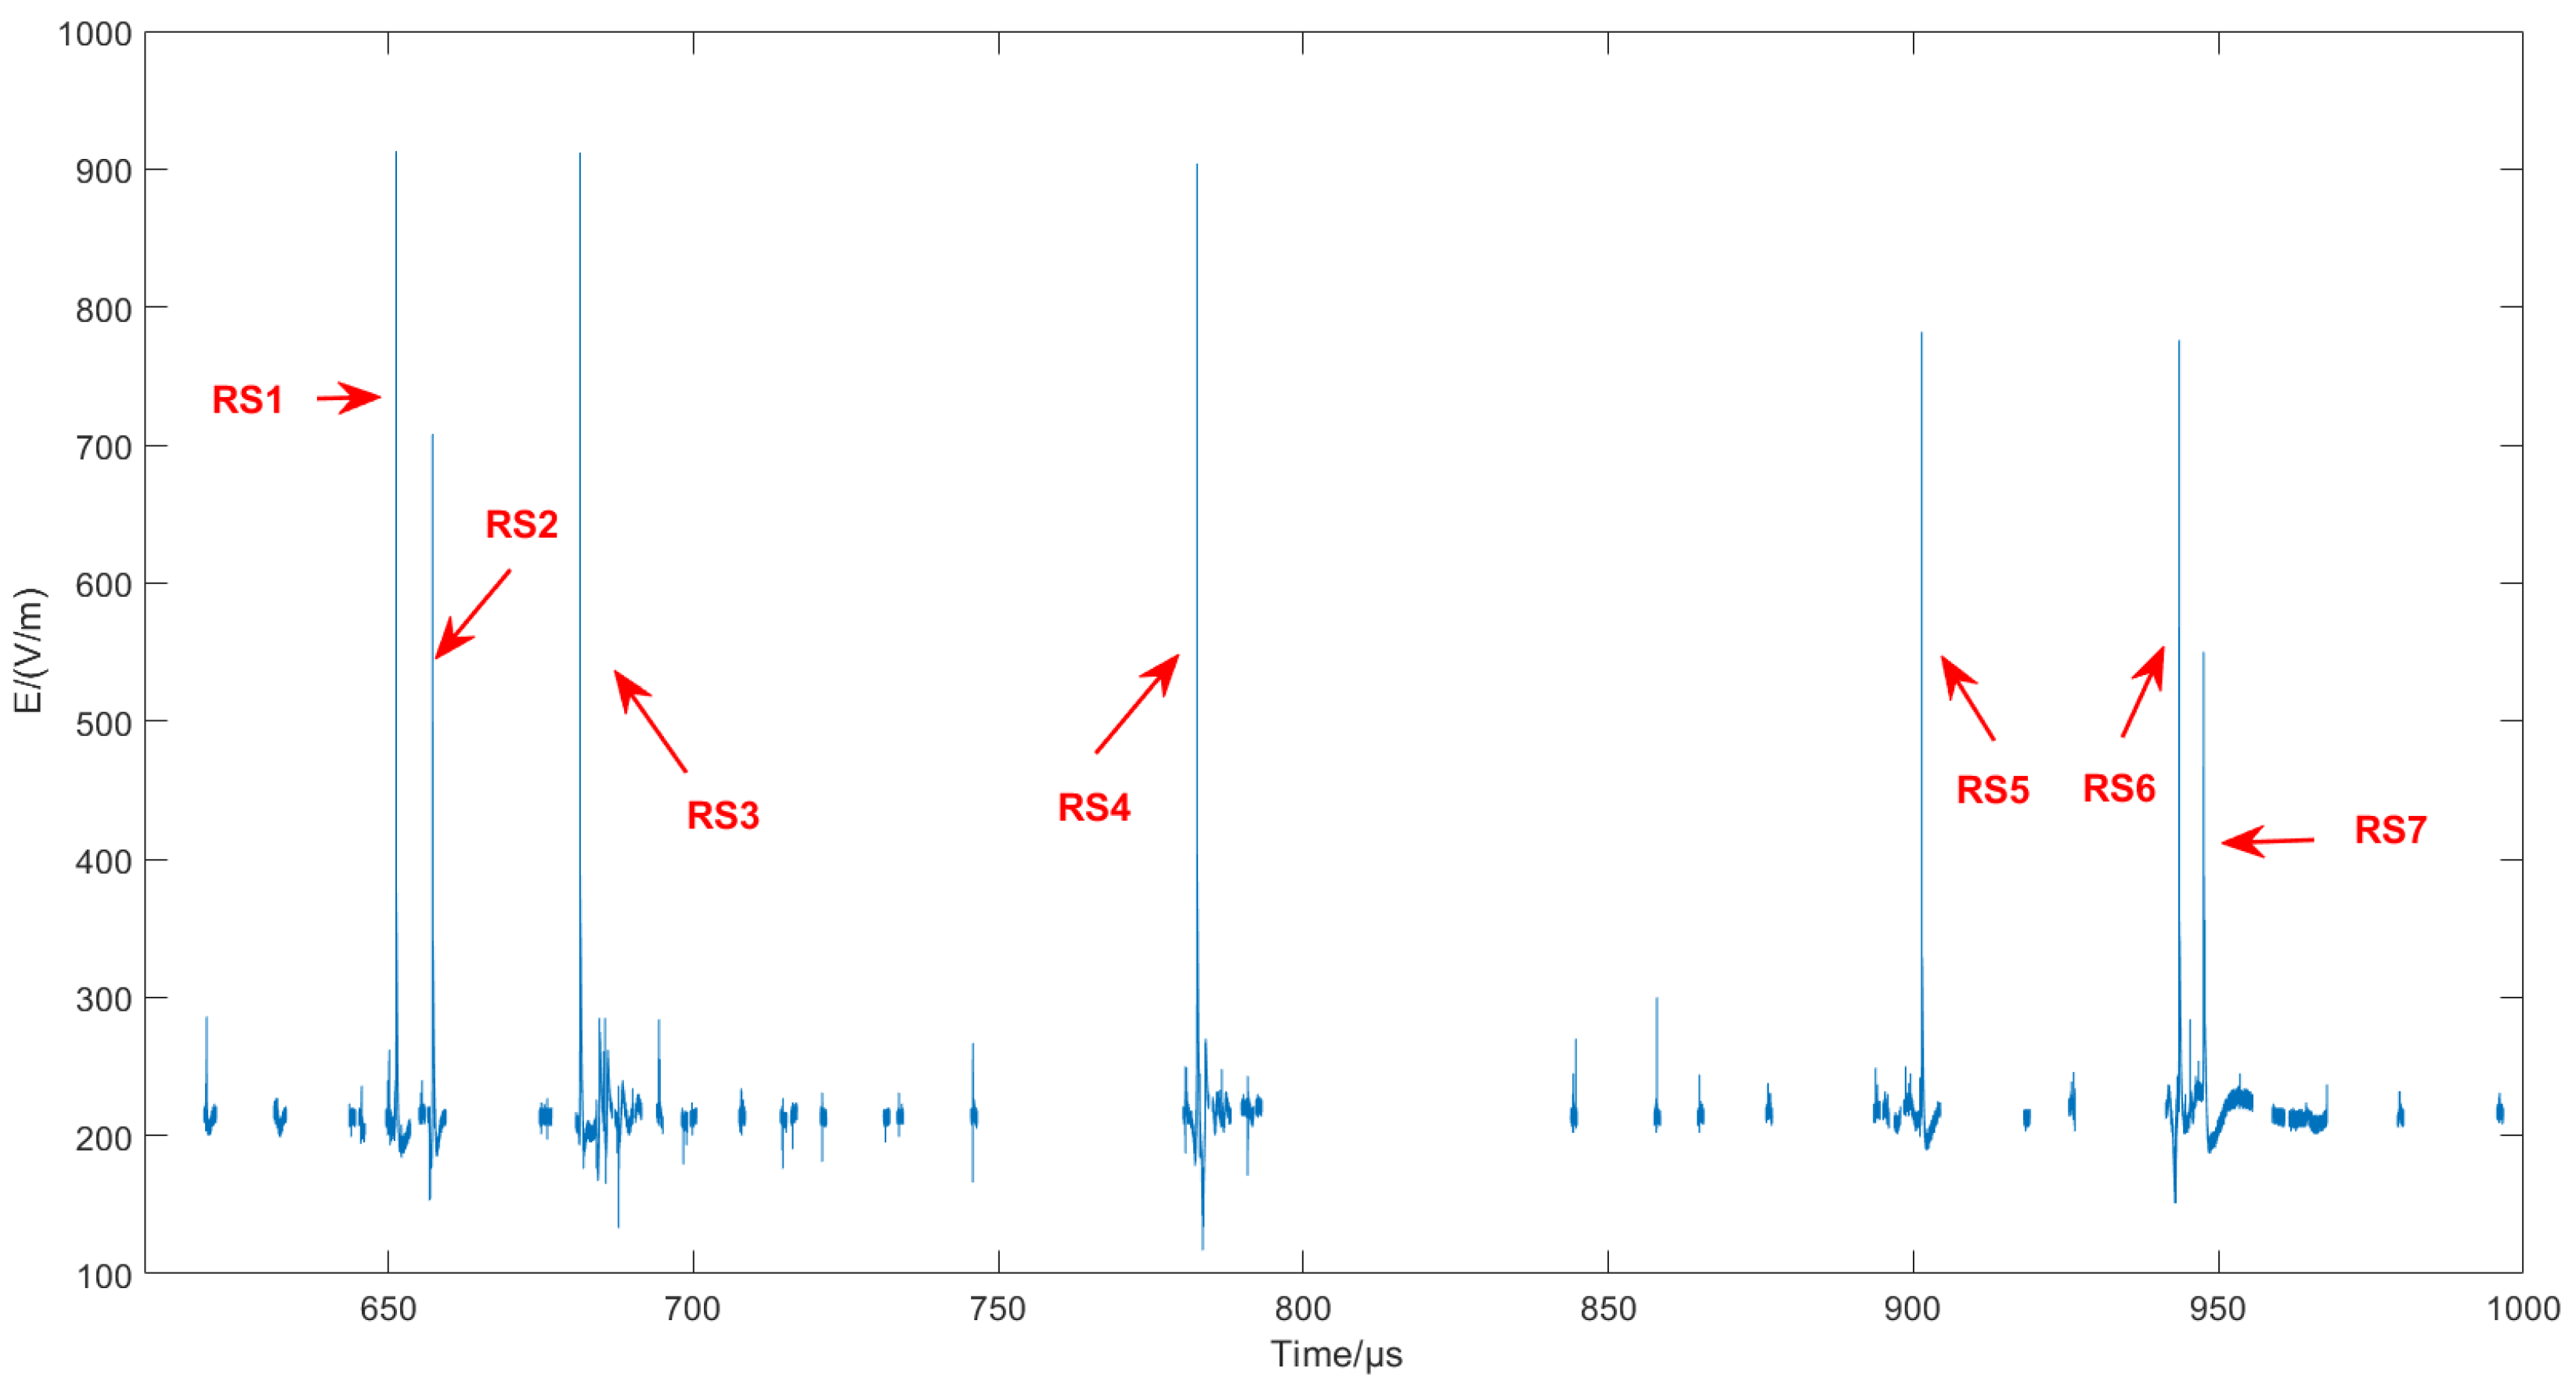
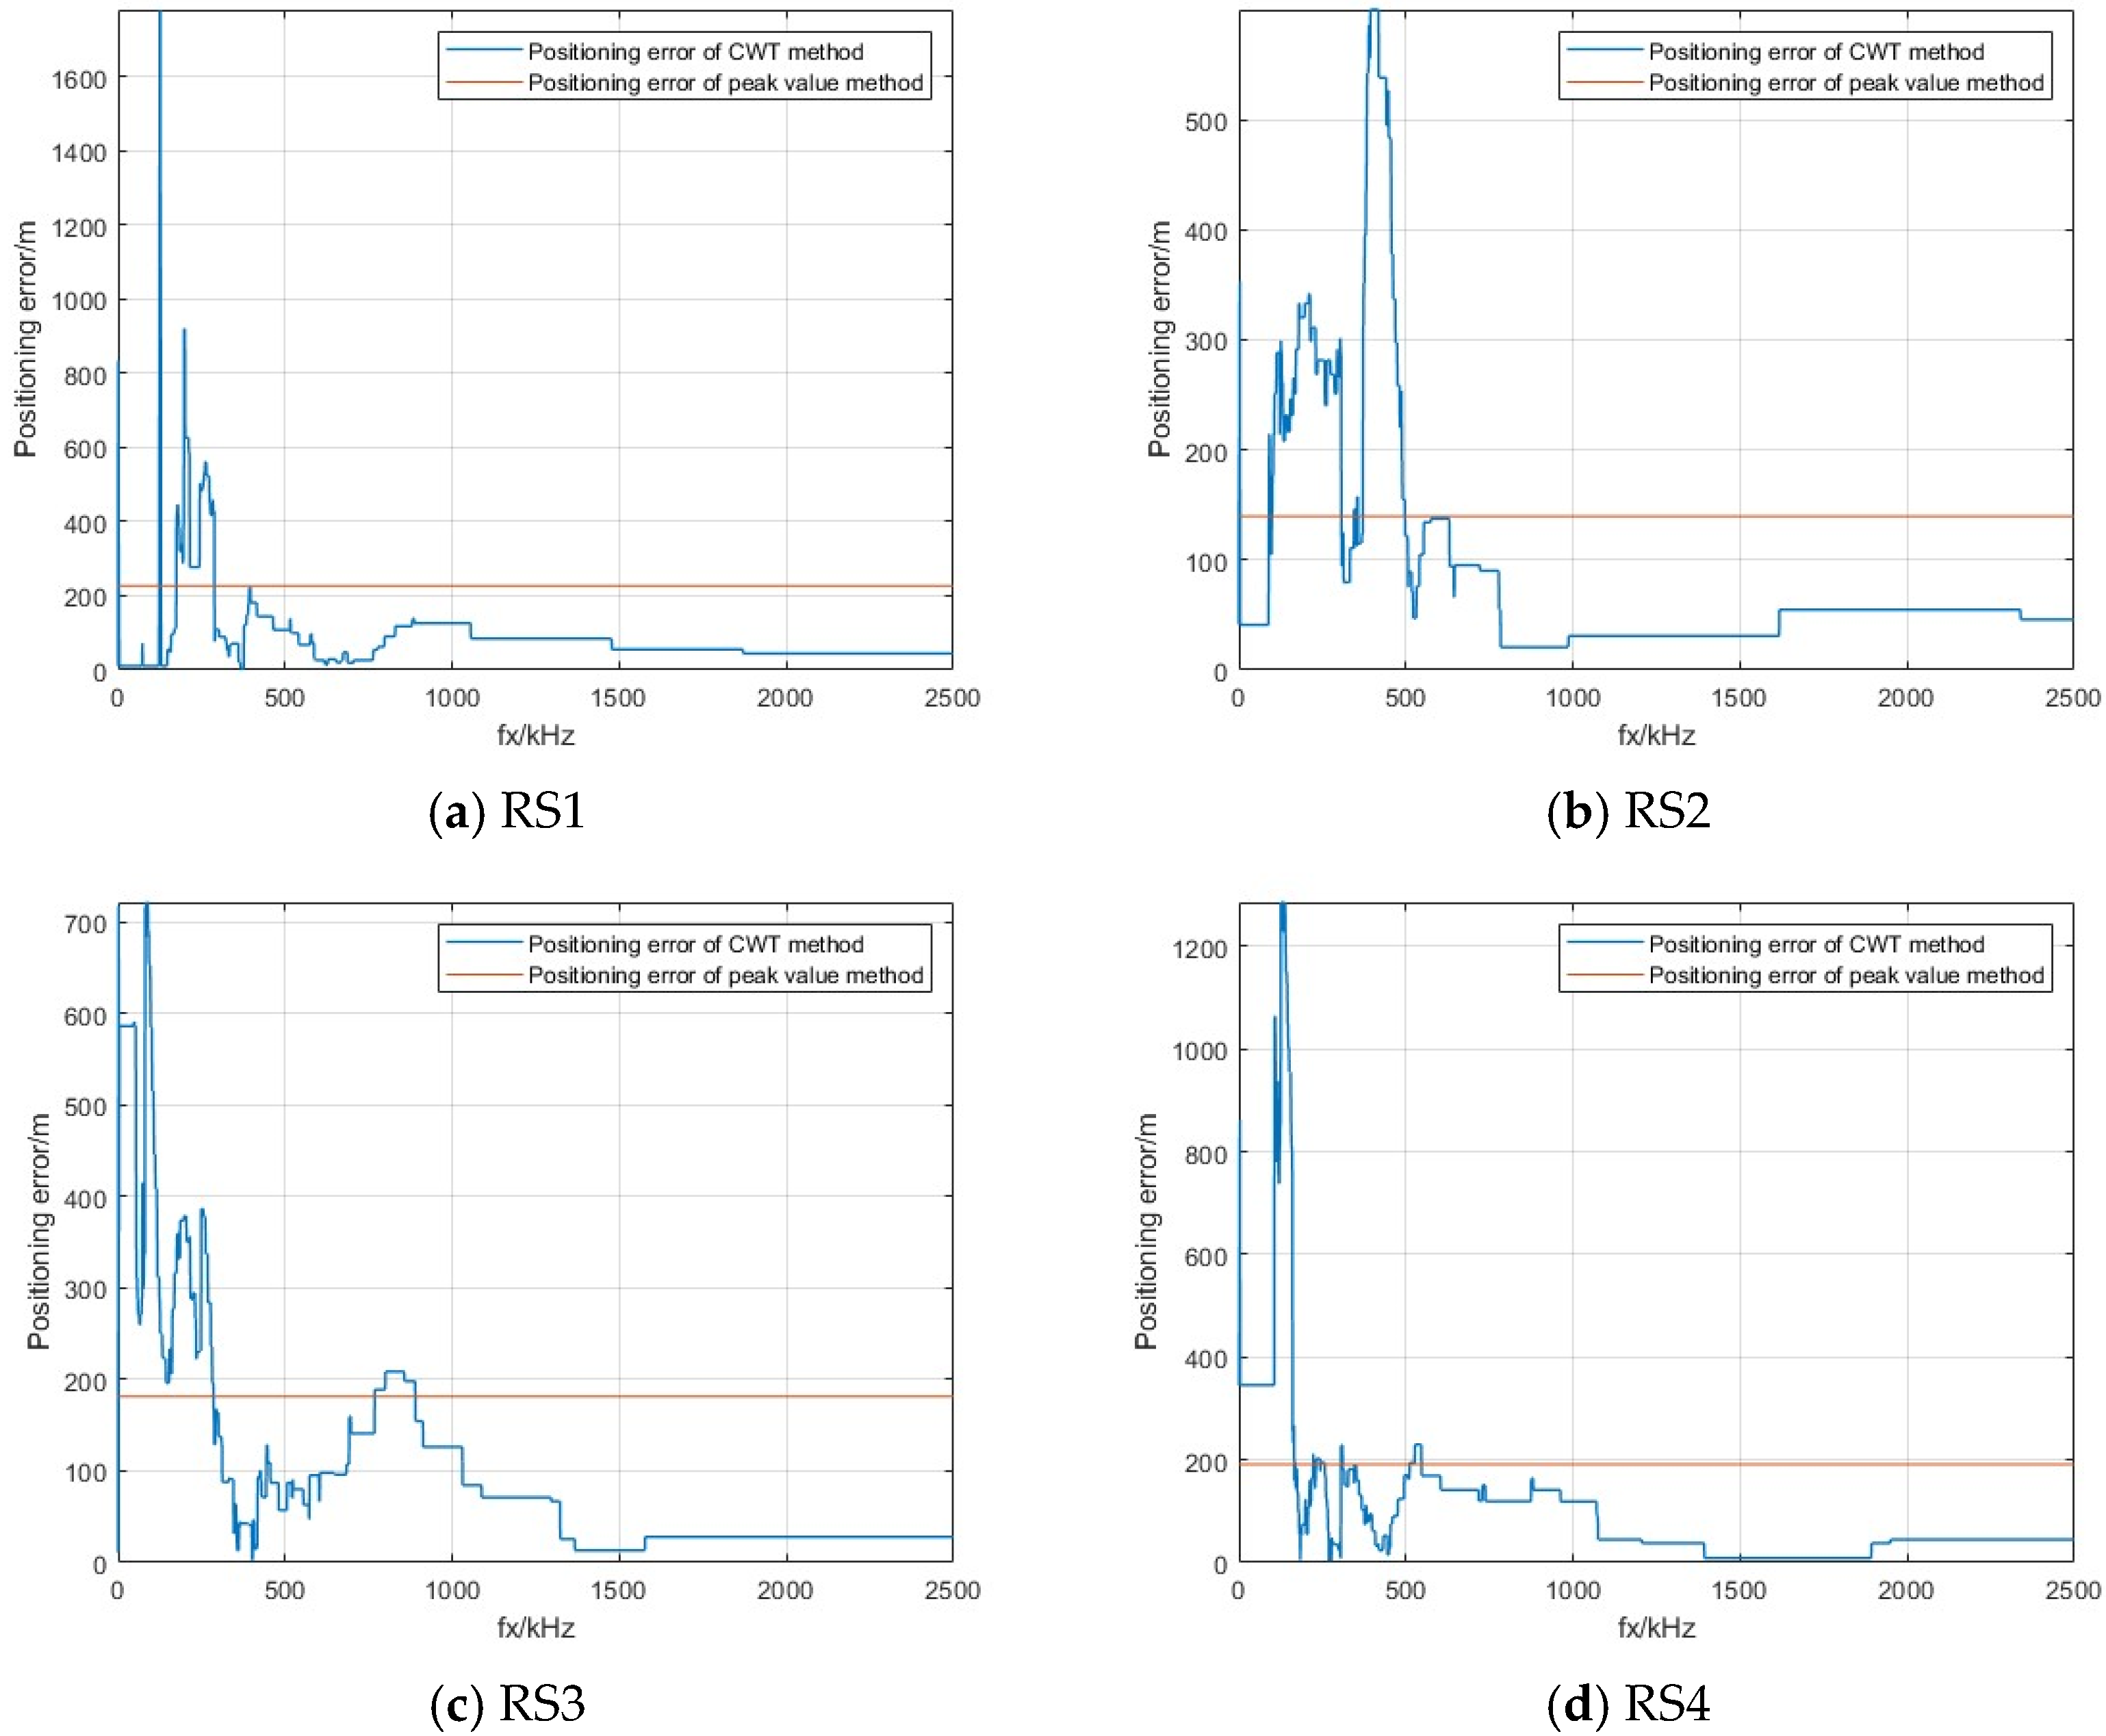
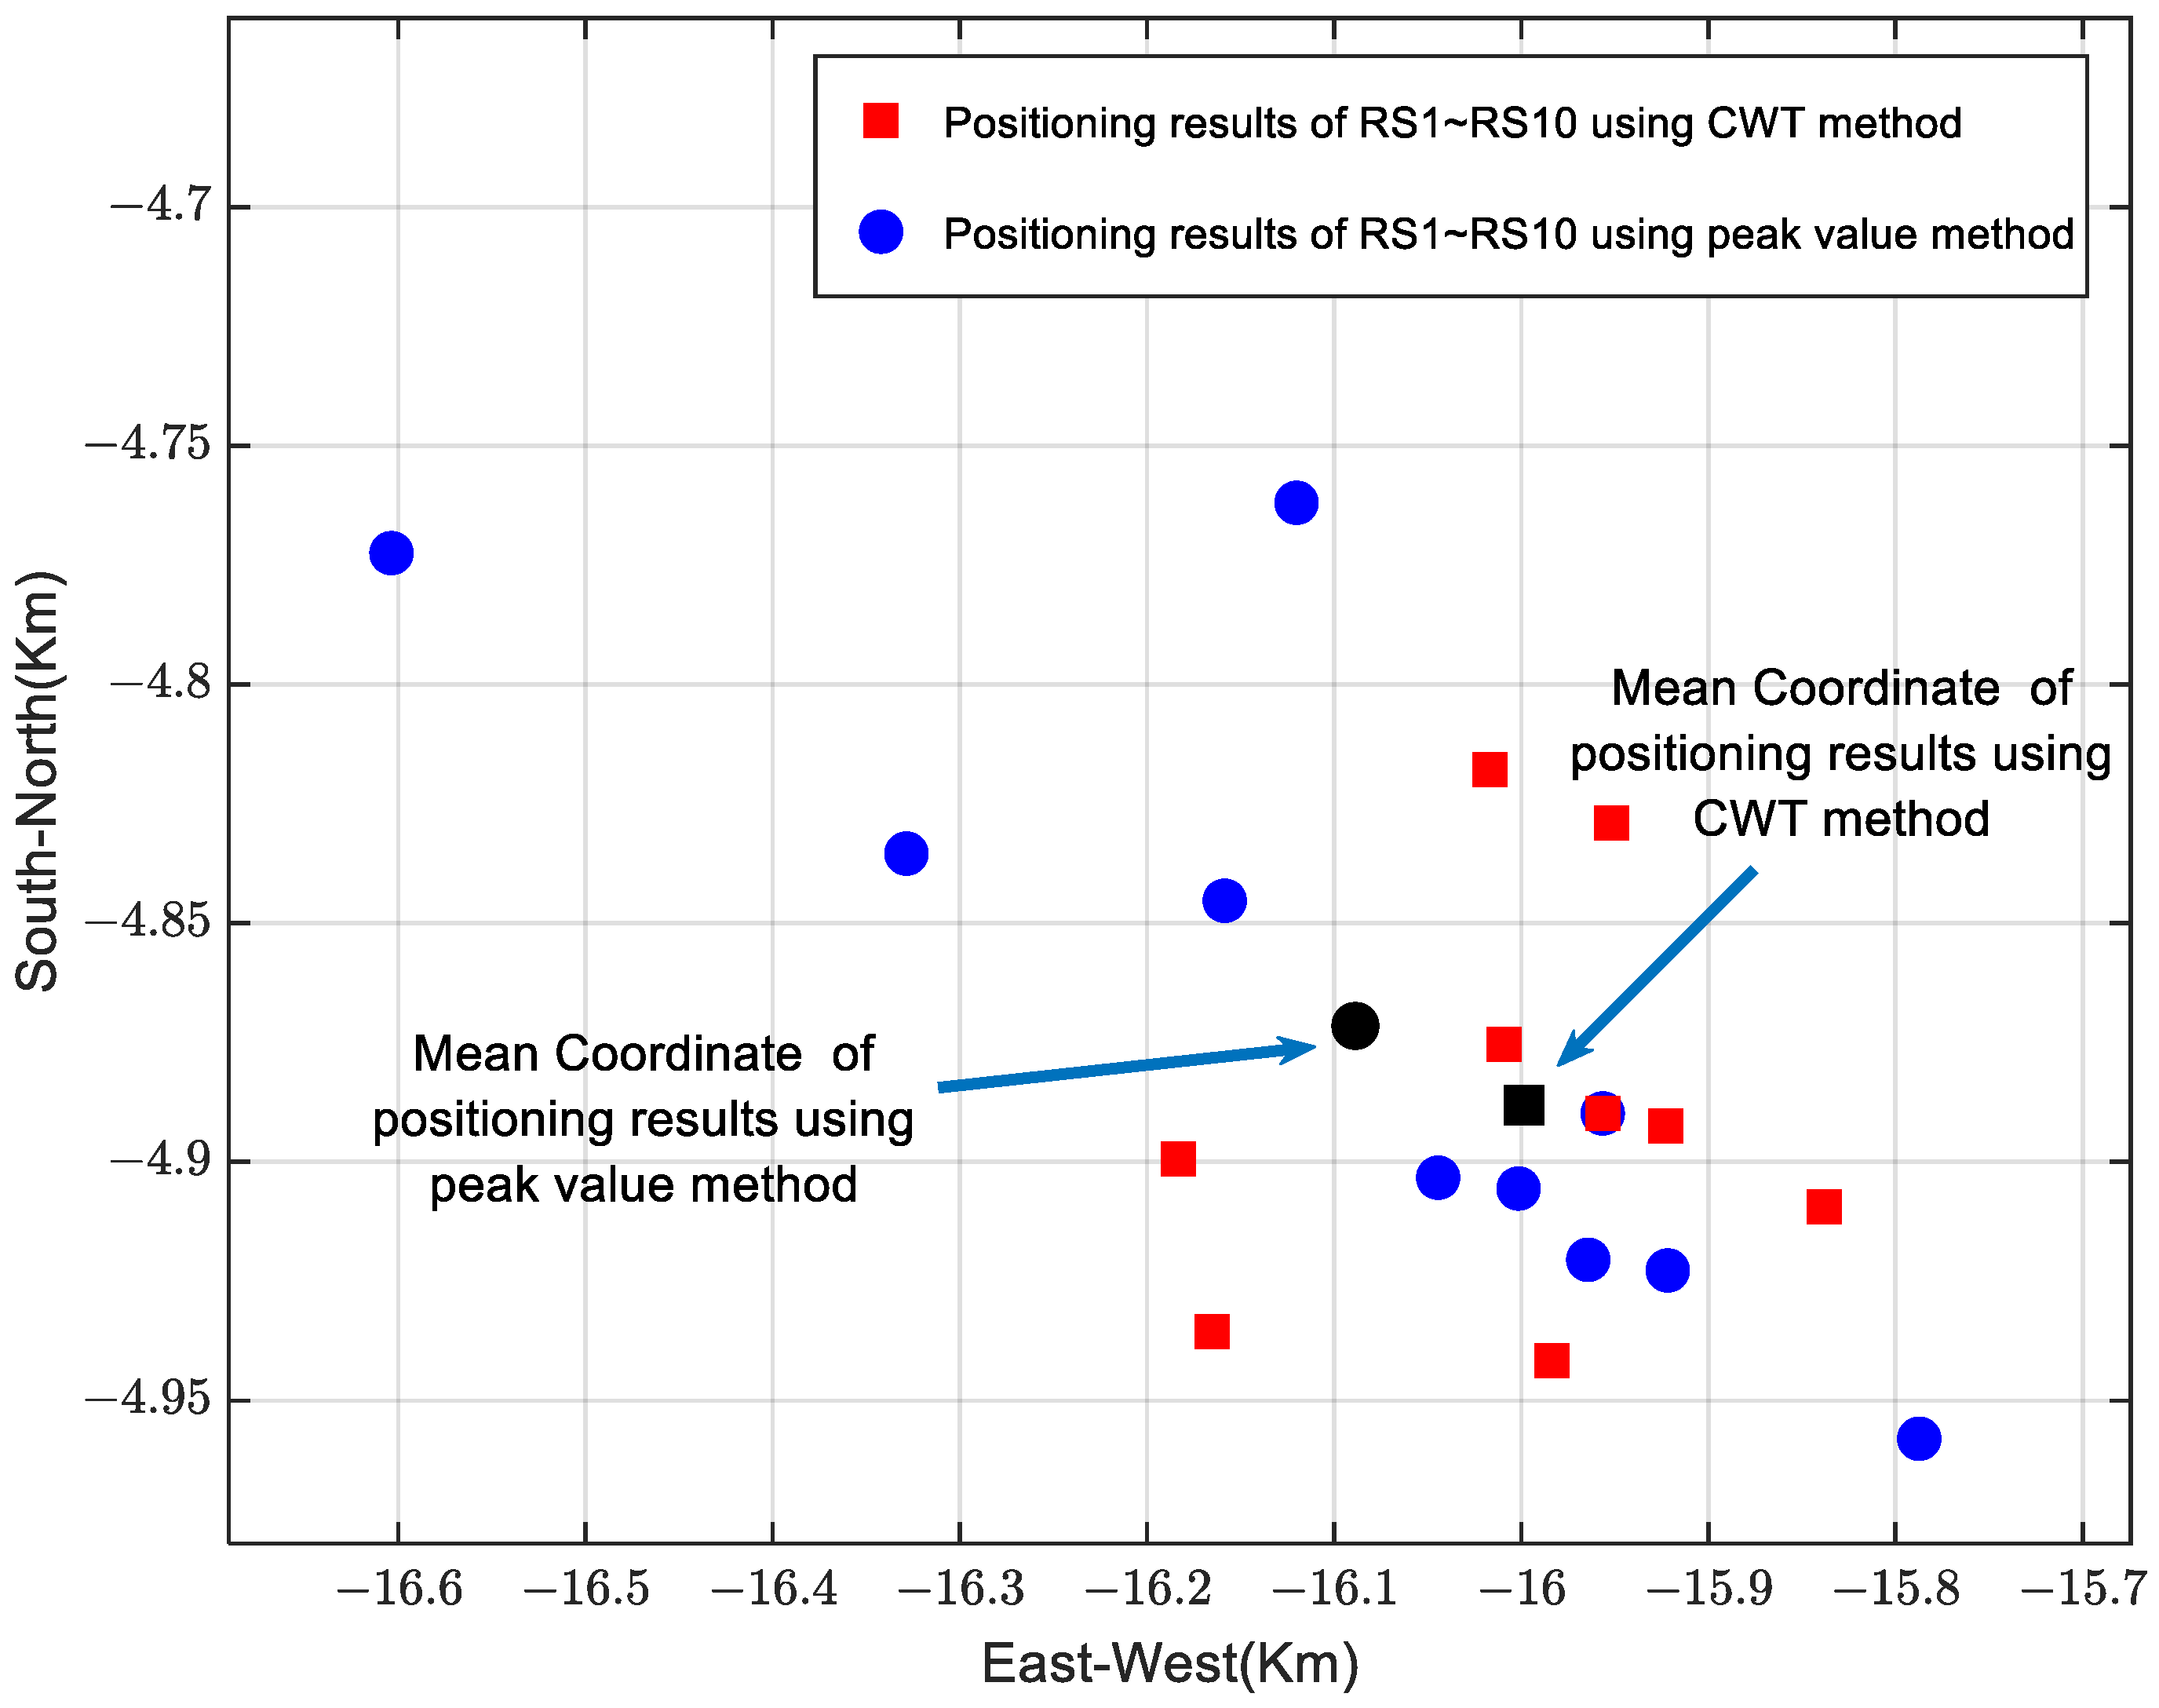
4.5. Comparison of Location Results for Multiple Return Strokes Induced by an Artificial Triggering Lightning

The peak value method and the CWT method were employed to analyze a dataset of an artificially triggered lightning containing seven return strokes. Due to the ineffective triggering at the detection site S3, data from the remaining six sites were utilized for the analysis. The waveform of the data collected by site S2 is presented in Figure 16.
Figure 17a–g show the positioning results during the first to seventh return strokes, respectively. It can be seen that the peak value method’s positioning error range is approximately 153.8 to 208.7 m. The CWT method has a relatively large positioning error in the low-frequency band (0~1 MHz), but its positioning accuracy in other frequency bands is significantly higher than that of the peak value method, with the minimum positioning error usually below 10 m. This result is basically consistent with the positioning results of the simulation data and the single return stroke measurement data, further verifying the effectiveness of the CWT narrowband feature extraction method.

4.6. Comparison of Location Results for Multiple Return Strokes Induced by a Cloud-to-Ground (CG) Lightning Flash

In 2017, Wu et al. established a Fast Antenna Lightning Mapping Array (FALMA) in Gifu, Japan. Utilizing this system, they were able to separately identify and locate the first as well as the subsequent return strokes of the same lightning flash. Results showed that distances between successive RSs are mainly below 25 m, indicating exceptionally high location accuracy of FALMA. This is because, during the same CG lightning flash, the channels of the first and subsequent return strokes are nearly coincident in spatial position [19].
Following this approach, a 10-RS CG lightning flash was selected as the analysis object (as shown in Figure 18). The traditional peak value method and the CWT method proposed in this study were employed for location calculations. This comparison aims to further validate the effectiveness of the CWT method in accurately locating real lightning events with more complex waveform characteristics.
Figure 19 presents waveforms of the seventh return stroke recorded by the six detection sites, along with the wavelet coefficient curves calculated within the frequency range of 100:100:2500 kHz. It is evident that the wavelet coefficient curves exhibit more pronounced pulse peaks at the moment of the return stroke. Based on the frequency selection method outlined in Section 4.4, a wavelet frequency of 1.8 MHz was chosen for performing location calculations for the 10 return strokes. The distribution of the resulting location points is illustrated in Figure 20 and summarized in Table 2. By computing the average coordinates (centroid) of the results obtained from both methods and using them as a reference for determining the actual return stroke position.
Subsequently, the errors between each return stroke’s location and the mean coordinates were calculated. The results indicate that the CWT method yields more spatially concentrated location results, with a mean error of 90.0 m, significantly outperforming the peak value method’s mean error of 185.9 m.
It can be observed that the positioning error for real lightning is higher than that for artificially triggered lightning data, primarily due to several factors: Firstly, the launch site coordinates for artificial lightning rockets are typically chosen at locations convenient for signal acquisition by various detection sites, resulting in higher quality collected signals. Secondly, artificially triggered lightning resembles subsequent return strokes in real lightning, which exhibit more ideal waveforms and are thus easier to locate compared to the first return stroke (both methods show that the positioning error for the first return stroke is the largest). Thirdly, in multi-stroke CG lighting flashes, the channels of the first and subsequent return strokes are not entirely consistent and may have multiple branches, potentially introducing errors on the order of tens of meters [19].

5. Conclusions

In this study, the CWT method is utilized to pre-process the LEMP data at each site and extract narrowband signal characteristics as the arrival time of lightning. Subsequently, the TOA method is employed to determine the horizontal positions of lightning. Combined with the artificially triggered lightning experiment, both simulation and practical data are used for validation. The results indicate that the proposed method significantly enhances lightning positioning accuracy; specifically, the positioning accuracy of the simulation data improves from 94.7 m to 5.6 m, while that for the practical measured data increases from 121 m to 9.2 m.
To further validate the effectiveness of the proposed method, we analyzed two datasets: one consisting of artificially triggered lightning with seven return strokes and another comprising real CG lightning flash with ten return strokes. The results confirmed that the CWT method exhibits significantly higher positioning accuracy compared to the traditional peak value method. Typically, the wavelet frequency should be set between 25% and 40% of the data acquisition system’s sampling rate. For instance, in the system described herein, which has a sampling rate of 5 MHz, a wavelet frequency range of 1 to 2 MHz yields optimal positioning performance.

Author Contributions

Conceptualization, J.S. and J.G.; methodology, D.Z.; software, J.S.; validation, J.G.; formal analysis, J.S.; investigation, J.S.; resources, J.S.; data curation, J.G.; writing—original draft preparation, J.S.; writing—review and editing, J.G.; visualization, J.G.; supervision, J.S.; project administration, J.S. All authors have read and agreed to the published version of the manuscript.

Funding

This research received no external funding.

Institutional Review Board Statement

Not applicable.

Informed Consent Statement

Not applicable.

Data Availability Statement

Data openly available in a public repository.

Conflicts of Interest

The authors declare no conflicts of interest.

References

  1. Fan, X.P.; Zhang, Y.J.; Zheng, D.; Zhang, Y.; Lyu, W.T.; Liu, H.Y.; Xu, L.T. A New Method of Three-Dimensional Location for Low-Frequency Electric Field Detection Array. J. Geophys. Res. Atmos. 2018, 123, 8792–8812. [Google Scholar] [CrossRef]
  2. Liu, B. Positioning Algorithm and Observation Application of Dual Frequency Band Lightning Positioning System. Ph.D. Thesis, Army Engineering University of PLA, Nanjing, China, 2019. [Google Scholar]
  3. Wang, T. Research on Imaging Method of Broadband Lightning VHF Array. Ph.D. Thesis, Army Engineering University of PLA, Nanjing, China, 2018. [Google Scholar]
  4. Rison, W.; Thomas, R.J.; Krehbiel, P.R.; Hamlin, T.; Harlin, J. A GPS-based Three-Dimensional Lightning Mapping System Initial Observations in Central New Mexico. Geophys. Res. Lett. 1999, 23, 3573–3576. [Google Scholar] [CrossRef]
  5. Nucci, C.A.; Diendorfer, G.; Uman, M.A.; Rachidi, F.; Ianoz, M.; Mazzetti, C. Lightning return stroke current models with specified channel-base current: A review and comparison. J. Geophys. Res. Atmos. 1990, 95, 20395–20408. [Google Scholar] [CrossRef]
  6. Hui, P. Research on texture Feature Extraction based on Wavelet Transform Technology. Master’s Thesis, Shenyang Institute of Aeronautical Engineering, Shenyang, China, 2010. [Google Scholar]
  7. Nichoga, V.; Pavlysh, V.; Romanyshyn, Y. Features of Use Wavelet Transforms for Processing and Analysis of Rail Fault Detection Signals. In Proceedings of the 2010 International Conference on Modern Problems of Radio Engineering, Telecommunications and Computer Science (TCSET), Lviv, Ukraine, 23–27 February 2010. [Google Scholar]
  8. Lei, W.T.; Junjie, C. Air coupled Lamb wave imaging detection of thin plate damage based on continuous wavelet transform. Nondestruct. Test. 2019, 41, 43–47. [Google Scholar]
  9. Liu, Z. Experimental study of circumferential guided wave scanning imaging of back wall pipes based on CWT. J. Mech. Eng. 2013, 49, 14. [Google Scholar] [CrossRef]
  10. Gong, C.; Shi, L.; Li, G. Improving acoustic emission source location accuracy by narrow-band feature extraction. Piezoelectr. Acousto-Opt. 2009, 31, 292–295. [Google Scholar]
  11. Yao, Z.; Yang, J.; Zheng, J.; Li, Y.; Xie, D.; Wu, J. Cable Fault Location and Signal Separation Based on Continuous Wavelet Transform. In Proceedings of the 4th International Conference on Electrical Materials and Power Equipment (ICEMPE), Shanghai, China, 7–10 May 2023. [Google Scholar] [CrossRef]
  12. Li, H. Bearing Fault Diagnosis Based on Time Scale Spectrum of Continuous Wavelet Transform. In Proceedings of the Eighth International Conference on Fuzzy Systems and Knowledge Discovery (FSKD), Bento Gonçalves, Brazil, 26–28 July 2011. [Google Scholar] [CrossRef]
  13. Priyadarshini, M.S.; Krishna, D.; Reddy, M.B.; Bhatt, A.; Bajaj, M.; Mahmoud, M.M. Continuous Wavelet Transform Based Visualization of Transient and Short Duration Voltage Variations. In Proceedings of the 4th IEEE Global Conference for Advancement in Technology (GCAT), Bangalore, India, 6–8 October 2023. [Google Scholar] [CrossRef]
  14. Rong, Q.; Zhang, Y. Fault Detection of Marine Propulsion Motor Rotor Broken Bar Based on Continuous Wavelet Transform. In Proceedings of the PELS Students and Young Professionals Symposium (SYPS), Shanghai, China, 27–29 August 2023. [Google Scholar] [CrossRef]
  15. Tran, T.H. Improvement of Methods for Detection of Characteristic Points of Biomedical Signals Based on Continuous Wavelet Transformation in the Continuous Flow of Data. In Proceedings of the Third International Conference on Human Factors in Complex Technical Systems and Environments (ERGO)s and Environments (ERGO), Saint Petersburg, Russia, 4–7 July 2018. [Google Scholar] [CrossRef]
  16. Zhang, C.-J.; Duanmu, C.-J.; Chen, H.-Y. Typhoon Image Segmentation by Combining Curvelet Transform with Continuous Wavelet Transform. In Proceedings of the 2007 International Conference on Wavelet Analysis and Pattern Recognition, Beijing, China, 2–4 November 2007. [Google Scholar] [CrossRef]
  17. Jiang, R.-J.; Dong, W.-S.; Liu, H.-Y.; Lei, Y. Location and radiation intensity of bipolar narrow pulse events in thunderstorms. J. Appl. Meteorol. 2018, 29, 177–187. [Google Scholar]
  18. Liu, H.-Y.; Dong, W.S.; Li, C.; Li, L.-F.; Qin, B.-Q.; Lei, Y. A dual-band three-dimensional all-lightning positioning system and its preliminary observation results. In Proceedings of the CSEE, Rome, Italy, 7–9 April 2019; Volume 39, pp. 3561–3569. [Google Scholar] [CrossRef]
  19. Wu, T.; Wang, D.; Takagi, N. Lightning Mapping with an Array of Fast Antennas. Geophys. Res. Lett. 2018, 45, 3698–3705. [Google Scholar] [CrossRef]
Figure 1. Extraction of Arrival Time of Lightning Pulse by CWT.
Atmosphere 16 00302 g001
Figure 2. The six-site network of the lightning positioning system.
Atmosphere 16 00302 g002
Figure 3. The measured signal of artificially triggered lightning pulses.
Atmosphere 16 00302 g003
Figure 4. Ideal soil engineering model.
Atmosphere 16 00302 g004
Figure 5. Lightning current waveforms defined by IEC 62305-1.
Atmosphere 16 00302 g005
Figure 6. Non-ideal soil engineering model.
Atmosphere 16 00302 g006
Figure 7. The time-domain waveforms of the simulation data.
Atmosphere 16 00302 g007
Figure 8. Wavelet coefficient curves of six-site simulation waveforms.
Atmosphere 16 00302 g008
Figure 9. Engineering model simulation data positioning results.
Atmosphere 16 00302 g009
Figure 10. Wavelet coefficient curves of six-site measured waveforms.
Atmosphere 16 00302 g010
Figure 11. Positioning results of CWT method in the frequency range of 0~2.5 MHz.
Atmosphere 16 00302 g011
Figure 12. Positioning errors of three electric field components on CWT method.
Atmosphere 16 00302 g012
Figure 13. Lightning current waveforms with different profiles (τ1 = 0.05~2 μs).
Atmosphere 16 00302 g013
Figure 14. Positioning results of different current profiles on peak value method.
Atmosphere 16 00302 g014
Figure 15. Positioning results of different current profiles on CWT method.
Atmosphere 16 00302 g015
Figure 16. Waveform of artificially triggered lightning containing seven return strokes (at site S2).
Atmosphere 16 00302 g016
Figure 17. Comparison of location results for the first to seventh return strokes by peak value and CWT method.
Atmosphere 16 00302 g017aAtmosphere 16 00302 g017b
Figure 18. Waveform of CG lightning flash containing 10 return strokes (at site S2).
Atmosphere 16 00302 g018
Figure 19. Waveforms and wavelet coefficient curves of RS7 calculated at the frequency of 100~2500 KHz.
Atmosphere 16 00302 g019
Figure 20. Positioning results of CWT method and peak value method.
Atmosphere 16 00302 g020
Table 1. Six-site network performance parameters.
PerformanceUnitValue
Number of sites6
Distance between siteskm10~30
Time constantms1
Sampling frequencyMHz5
Resolution of data acquisition cardbit12
Record lengthms1/10
GPS timing accuracyns≤50
VLF/LF receiver 3 dB bandwidthkHz0.2~800
Table 2. Comparison of positioning results of RS1 to RS10.
RSPositioning Results (Km)Mean Coordinate (Km)Mean Error (m)
CWT MethodPeak Value MethodCWT MethodPeak Value MethodCWT MethodPeak Value Method
RS1−16.1650, −4.9355−16.6037, −4.7725−15.9983,
−4.8880
−16.0886,
−4.8715
90.0185.9
RS216.0092, −4.8754−16.1584, −4.8453
RS316.0169, −4.8178−16.1200, −4.7619
RS415.9229, −4.8925−15.7873, −4.9580
RS516.1832, −4.8994−16.0444, −4.9033
RS615.9564, −4.8898−16.3285, −4.8354
RS715.8381, −4.9095−15.9642, −4.9205
RS815.9518, −4.8291−15.9564, −4.8898
RS915.9835, −4.9417−15.9217, −4.9227
RS1015.9564, −4.8898−16.0014, −4.9056
Disclaimer/Publisher’s Note: The statements, opinions and data contained in all publications are solely those of the individual author(s) and contributor(s) and not of MDPI and/or the editor(s). MDPI and/or the editor(s) disclaim responsibility for any injury to people or property resulting from any ideas, methods, instructions or products referred to in the content.

