Abstract
In recent years, rainfall in the Jazan region of southwest Saudi Arabia has significantly increased, setting new records for monthly and daily rainfall in 2024 and leading to natural disasters. The distribution of monthly rainfall in Jazan and its variations over recent decades have not been analyzed yet. This study examines the changes in seasonal rainfall patterns in the Jazan region utilizing observational and reanalysis datasets from 1978 to 2024. The rescaled adjusted partial sums technique is used to detect breaks in the rainfall time series, while statistical methods are applied to analyze rainfall extremes and their trends. The average annual rainfall for the period 1978–2024 is 149.4 mm, which has increased from 131.9 mm during the earlier decades (1978–2000) to 166.2 mm in recent decades (2001–2024), reflecting an increase of 34.3 mm. The annual rainfall has been increasing significantly at a rate of 92.9 mm/decade in recent decades, compared to 74.3 mm/decade in the previous decades. There has been a marked shift in the peak rainfall season from autumn to summer, in particular moving from October to August in recent decades. The highest monthly rainfall recorded in August, reached 54.9 mm in recent decades, compared to just 15.4 mm in earlier decades. In contrast, the peak rainfall in October was 19.9 mm in previous decades, which decreased to 18.7 mm in recent decades. Notably, August 2024 marked a record-breaking rainfall of 414.8 mm, surpassing the previous high of 157.5 mm set in October 1997. These data show clear evidence of the changing climate in the region. Moreover, the number of heavy rainfall days has risen, with a total of 608 wet days documented throughout the entire period, alongside a significant increase in light, heavy, and extremely heavy rainfall days in recent decades compared to earlier ones. Hence, the region has seen a rise in heavy to extremely heavy rainfall days, including a daily record of 113.7 mm on 23 August 2024, compared to 90.0 mm on 22 October 1997. Additionally, there has been a rise in the maximum consecutive 5-day rainfall compared to the maximum 1-day rainfall. Overall, these findings show substantial changes in rainfall patterns in the Jazan region, suggesting notable climatic shifts that warrant further investigation using the automatic weather stations, radar and satellite data, as well as climate model simulations.
1. Introduction
Climate change represents a significant threat to both humans and wildlife, impacting ecosystems, biodiversity, and migration patterns essential for life on Earth [1,2]. Its effects are not uniform and differ from region to region. The Kingdom of Saudi Arabia, the largest country in the Arabian Peninsula (~80–85% area of the Peninsula), experiences a wide range of climates due to its geographical location and extensive latitudinal and longitudinal spread from north to south and east to west [3,4,5]. In general, the Kingdom of Saudi Arabia is characterized by a semi-arid to arid climate with extreme heat, especially in the daytime, and an infrequent low amount of annual rainfall [6,7]. Under the Koeppen–Geiger classification [8], the climate of Saudi Arabia is classified as a hot desert climate (BWh). In addition, the aridity index classifies Saudi Arabia in a desert condition and a water deficit, with exceptions in some mountainous areas that are semi-arid [9]. Although Saudi Arabia has an arid and desert climate, heavy precipitation can lead to flooding, landslides, and other disruptions that affect daily life in the region [10]. This is primarily due to mesoscale convective systems, which contribute significantly to the observed annual rainfall [11] and are associated with heavy rainfall in arid areas [12].
Numerous studies have examined rainfall and temperature extremes in the region [13,14,15,16,17]. From 1979 to 2009, Saudi Arabia averaged 93.5 mm of rainfall, with significant variation: as low as 25.3 mm in northwest Wejah (26.20° N, 36.47° E) and as high as 230.3 mm in southwest Abha (18.23° N, 42.66° E) [18]. The peak rainfall typically occurs in spring across the southwest, central, and eastern regions, while a secondary peak is observed in winter in the east and northeast [19]. Climatologically, the southwest region of Saudi Arabia experiences its maximum rainfall in spring, whereas the northeast and northwest receive minimal rainfall during summer [20]. A recent study [21] found a significant decreasing trend in the mean rainfall in Saudi Arabia, with a decline of 0.6 mm/decade from 1985 to 2019. Specifically, the winter and spring rainfall decreased by 0.8 and 1.5 mm/decade, respectively. Notably, the rainfall increased by 4.4 mm and 7.1 mm/decade during the periods 1985–1996 and 2009–2019, respectively, while it decreased by 9.2 mm/decade from 1997 to 2008. This trend suggests a recent increase in rainfall across the country. Similarly, one study [18] indicated that the rainfall significantly increased from 1979 to 1993 but decreased from 1994 to 2009, although they did not analyze data for the recent decade. In general, annual thunderstorms are most frequent over the southwestern parts of Saudi Arabia and decrease towards the west and east [22]. The southern region has shown greater numbers of thunderstorm days around the year and thunderstorms associated with heavy rain [7]. Therefore, throughout the year, the southwest of the Arabian Peninsula receives relatively heavy rainfall, and in recent years, convective activity has increased in the region.
To our knowledge, the southwestern coastal region of Jazan receives rainfall during specific months, and the temperatures and rainfall are on an upward trend [23]. However, a review of climatic data reveals that Jazan has experienced rainfall throughout the year, suggesting potential climate changes. Climate change can impact rainfall patterns, causing significant changes in rainfall extremes in the Jazan region through increased rainfall variability, altered rainfall patterns, shifting climate drivers, and effects on various sectors, with local communities being particularly vulnerable. To understand the relationship between climate change and rainfall extremes in Jazan, it is crucial to detect first these extremes and their seasonal shifts in the changing climate. In recent years, both the annual rainfall totals and the frequency of extreme rainfall events along with their intensity in Jazan have increased, particularly noted in the summer of 2024, causing remarkable natural disasters in the region. Therefore, it is essential to examine changes in Jazan’s rainfall patterns by analyzing historical data to identify any evidence of changes in recent decades. This study, however, does not focus on the impacts of climate change or the mechanisms behind the shift. The key question is whether there has been any change in rainfall patterns in the Jazan region over the past few decades, and whether a shift in the rainfall season is evident. Therefore, this study seeks to address the scientific question: Has the rainfall seasonal pattern in Jazan truly changed? To achieve this, surface rainfall data from the Jazan meteorological station, along with reanalysis datasets, are analyzed to obtain changes in rainfall seasonality, variability, and extremes from 1978 to 2024.
2. Materials and Methods
To address the scientific question of whether there has been a shift in the rainfall season in the Jazan region, this section provides a detailed description of the study area, the data utilized, and the methods of analysis employed.
2.1. Study Area
The Jazan region, covering an area of 13,457 km2, is located in the southwest of Saudi Arabia and is characterized by its distinct geographical, environmental, and cultural diversity (Figure 1). It is one of the most densely populated provinces in Saudi Arabia [24]. Geographically, Jazan has the Al-Sawawat Mountains inland, the Alhazoun forest district, and the plains [25,26,27]. The mountainous areas experience a relatively wetter climate, while the coastal regions are among the hottest in the country, with temperatures ranging from 31 °C in January to 40 °C in July (https://en.wikipedia.org/wiki/Jazan_Province, accessed on 4 February 2025). Despite this, Jazan has a low annual rainfall (https://weather-and-climate.com/average-monthly-Rainfall-Temperature-Sunshine,j-z-n,Saudi-Arabia, accessed on 4 February 2025), averaging about 162 mm. Agriculture is a key component of the region’s economy, with Jazan known for producing high-quality tropical fruits such as apples, figs, mangoes, bananas, grapes, papayas, plums, and various citrus varieties. The region also cultivates coffee beans and cereal crops, including barley, millet, and wheat [28]. Jazan consists of 16 governorates and over 100 islands in the Red Sea, offering a variety of tourism opportunities, including historical monuments. In addition, the Saudi government has launched several major economic projects in Jazan to promote regional economic development. Given Jazan’s importance within Saudi Arabia, it is crucial to investigate the observed changes in seasonal rainfall in the region over recent years.
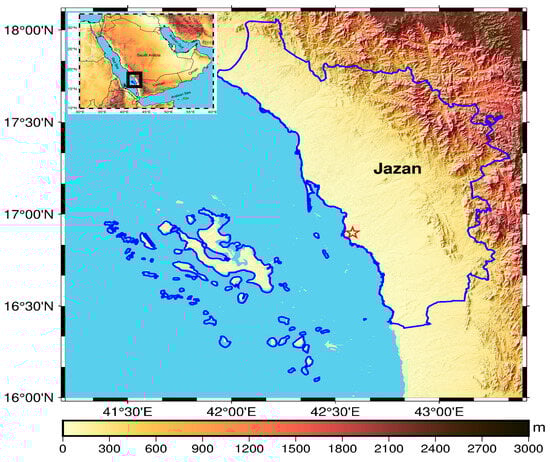
Figure 1.
Regional elevation map (inset) with Jazan province in southwest Saudi Arabia. The red star indicates the location of the surface observation station at Jazan (42.58° E and 16.90° N, ICAO code OEGN, WMO code 41140). The Farasan Islands are a small group of coral islands ~40 km off the coast of Jazan in the Red Sea.
2.2. Data
The daily rainfall data were obtained from the National Center for Meteorology (NCM) surface observation station in Jazan. This station is located at coordinates 42.58° E and 16.90° N, with an elevation of just 4 m above sea level, covering the period from 1978 to 2024. Additionally, high-resolution (0.05 degrees) Climate Hazards Group InfraRed Precipitation with Station data (CHIRPS, [29]) were utilized for spatial rainfall plots in and around Jazan, available from 1981 to the present. The fifth generation ECMWF (ERA5, [30,31] atmospheric reanalysis provides global climate data for synoptic conditions in and around the Jazan region, available from January 1940 to the present. The use of gridded data allows for a better understanding of the spatial distribution of rainfall and climatic conditions along with their changes in and around Jazan, which is not possible with observational point data alone. A comparison of CHIRPS data extracted from the Jazan station location is also conducted against observations for the analysis period.
2.3. Analysis
The rainfall data for the Jazan region were based on daily precipitation records from 1978 to 2024. However, the analysis of rainfall extremes such as heavy, very heavy, and extremely heavy with maximum 1-day and 5-day rainfall was conducted using specific indices. Daily surface observational data were aggregated into monthly and annual averages for the period of 1978–2024 to identify climatological patterns in rainfall. The rainfall extreme indices at the Jazan station were calculated using Climpact2 software, which utilizes daily rainfall, maximum temperature, and minimum temperature as inputs. Climpact is a modern software tool developed by the Expert Team on Sector-Specific Climate Indices (ET-SCI) specifically for calculating climate indices relevant to sectors such as health, agriculture, and water management.
Regression analysis was applied to determine trends in the time series data, helping to understand the patterns of increase or decrease in rainfall and its extremes. The significance of these trends was assessed using the F-test [32] and Mann Kendall trend test [33,34] for understanding their levels of confidence. To examine changes in both climate and climate extreme indices, the total historical dataset covering 47 years (1978–2024) was divided into two halves using the rescaled adjusted partial sums (RAPS) process. The difference between the second and first half was regarded as the change for a variable. Furthermore, RAPS was applied for analyzing the time series data, particularly in the context of testing changes in structural breaks or shifts in the underlying data-generating process. Note that RAPS is typically used for the analysis of time series in hydrology, regardless of the quality and quantity of the time series [35,36,37,38]. The RAPS is calculated using the following expression:
where Rt is the individual value of the analyzed member of the analyzed time series, is the average value of all members, StD is the standard deviation of all members, and t = 1, 2, 3 …, k, the count during the summation process [39].
It is important to note that a rainy day or wet day is defined as any day with rainfall (RF) of at least 1 mm or more. Additionally, rainfall classifications for light, heavy, very heavy, and extremely heavy rainfall are defined as shown in Table 1. The monthly maximum 1-day rainfall (RX1day) refers to the total rain that falls in a single day, while the monthly maximum consecutive 5-day rainfall (RX5day) indicates the total rain that falls over five consecutive days, both of which were also analyzed.

Table 1.
The rainfall class with rainfall extremes in Jazan.
3. Results
This section describes the analyzed results of the rainfall and its extreme indices from surface observations datasets. Spatial distributions and their changes were also obtained from gridded datasets and are discussed.
3.1. Rainfall Climatology
Observational rainfall at the Jazan meteorological station for the available period 1978–2024 indicates an interannual variation ranging from the lowest, at 5.2 mm (in 1984), to the highest, at 505.9 mm (in 2024). The RAPS analysis indicates that the time series has two phases or cycles (Figure 2). The two phases in the annual rainfall belong to two time slots: one for recent decades (2001–2024) and the other for previous decades (1978–2000). Observational rainfall at the Jazan meteorological station averaged over the period from 1978 to 2024 shows that the annual rainfall was 149.4 mm, with a monthly peak of 35.5 mm occurring in August and a low of just 1.2 mm in June (Figure 3). In recent decades, the annual average rainfall increased to 166.2 mm, compared to 131.9 mm in the earlier period, indicating a total increase of 34.3 mm. Notably, the recent peak rainfall recorded in August was 54.9 mm, while the previous peak in October was only 19.9 mm. Hence, the August rainfall increased from 15.4 mm to 54.9 mm, while the October rainfall decreased from 19.9 mm to 18.7 mm in recent decades. This shift indicates a clear transition of the rainfall peak from autumn to summer, especially from October to August in the Jazan region. The October rainfall peak (~19 mm) in Jazan for the period 1970–2003 was also reported [19]. There was a significant increase in rainfall during July, August, and December and a notable decrease in March, May, and September, with minimal changes in the remaining months. The significant increase in rainfall during July and August is in line with the possibility of the reported [20] large increase in the Jazan rainfall.
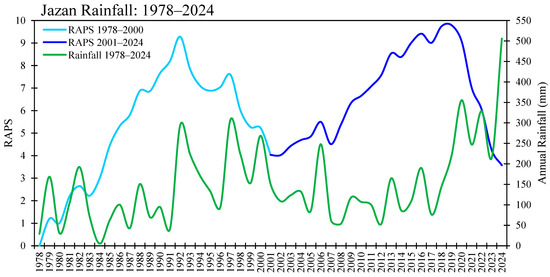
Figure 2.
Annual rainfall (mm) with RAPS for the period 1978–2024.
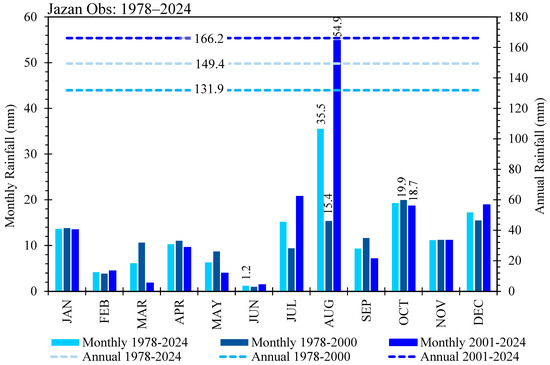
Figure 3.
Annual cycle of rainfall (mm/month) for observations for the period 1978–2024. The annual averages for different time slots are shown in dashed horizontal lines.
Figure 4 exhibits the temporal patterns of monthly, seasonal, and annual rainfall in the Jazan region, highlighting both intra- and inter-annual variations. The full bar indicates the annual total rainfall in each year including different months (Figure 4a) and seasons (Figure 4b). As mentioned earlier, the average annual rainfall for Jazan is 149.7 mm, with notable peaks in 1979 (168.7 mm), 1982 (192.14 mm), 1992 (294.3 mm), 1997 (307.8 mm), 2000 (268.8 mm), 2006 (248.0 mm), 2016 (189.8 mm), 2019 (220.2 mm), 2020 (355.5 mm), 2022 (328.7 mm), and 2024 (493.9 mm). This indicates a clear increase in annual rainfall over the recent decade, growing at a rate of 92.9 (Mann Kendall 34.1) mm/decade, compared to 74.3 (Mann Kendall 38.3) mm/decade in the previous decade. Overall, the rate of increase in annual rainfall for the entire period was 31.8 (Mann Kendall 26.5) mm/decade. This is in line with the positive trend of Jazan rainfall for the period 1970–2003 [19]. All trends are significant at the 95% confidence level. While the rainfall was increasing in most months, decreases were observed in January, March, April, and September.
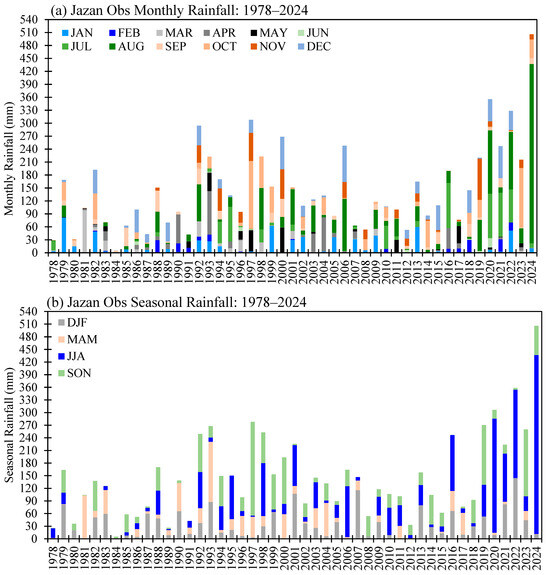
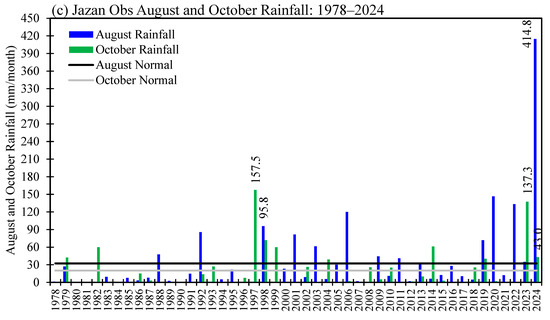
Figure 4.
(a) Monthly, (b) seasonal, and (c) August and October rainfall for the period 1978–2024. The horizontal lines indicate normal (1991–2020) rainfall.
Seasonally, summer (JJA) experienced the highest average rainfall at 51.9 mm followed by 39.5 mm in autumn (SON) and 35.7 mm in winter (DJF), while spring (MAM) recorded the lowest at 22.7 mm. These seasonal patterns are similar to the findings of Mashat and Basset [19] for the Jazan region. For the entire period, the linear regression (Mann Kendall) rainfall trends indicated an insignificant increase of 2.9 (0.69) mm/decade in winter, a significant (95% level) increase of 28.1 (3.3) mm/decade in summer, and an insignificant increase of 5.5 (1.3) mm/decade in autumn, with an insignificant decrease of 4.5 (1.1) mm/decade in spring. Importantly, the significant increase rate of summer rainfall rose up to 70.0 (24.6) mm/decade (95% level) in recent decades from 20.5 (2.5) mm/decade (95% level) in previous decades, while it fell in autumn at 22.6 (3.4) mm/decade (95% level) from 39.1 (2.1) mm/decade (95% level). This is an indication of the shift in the rainfall season from autumn to summer in the region.
August was identified as the month with the highest rainfall, influenced by high rainfall in 1988 (47.6 mm), 1992 (85.7 mm), 1998 (95.8 mm), 2001 (81.7 mm), 2006 (120.0 mm), 2020 (146.5 mm), 2022 (133.3 mm), and 2024 (414.8 mm) (Figure 4c). October followed as the second-wettest month, primarily due to notable high rainfall in 1982 (59.8 mm), 1997 (157.5 mm), 1998 (71.9 mm), 1999 (60.0 mm), 2014 (31.2 mm), and 2023 (137.3 mm). Remarkably, August 2024 saw an unprecedented rainfall total of 414.8 mm, marking the highest amount in recorded history, which was previously 157.5 mm in October 1997 (Figure 4c). Additionally, in recent decades, rainfall in August insignificantly increased at a higher rate of 46.7 (1.5) mm/decade as compared to an insignificant increase at the rate of 11.1 (0.08) mm/decade in previous decades, according to linear regression (Mann Kendall). On the other hand, the insignificant increase rate of the October rainfall dropped to 14.2 (1.1) mm/decade in recent decades as compared to 17.9 (1.6) mm/decade in previous decades, according to linear regression (Mann Kendall). Hence, the August rainfall increase rate became faster, while the October rainfall increase rate became slower in recent decades. There is a difference between the linear regression coefficient and the Mann Kendall tau in magnitude, but both provide a similar sign of trend.
3.2. Rainfall Extremes
During the study period from 1978 to 2024, the highest daily rainfall recorded was 113.7 mm on 23 August 2024, followed by 90.0 mm on 22 October 1997 and 83.8 mm on 3 August 2020 (Figure 5a). The threshold for each category indicates that in the region, heavy to extremely heavy rainfall occurred, which was more frequent in the 1990s and 2010s. There has been a significant increase in wet days (rainfall ≥ 1 mm/day) daily rainfall in the Jazan region in August and a decrease in October (Figure 5b,c). The daily rainfall insignificant increase rate in August was ~0.68 (Mann Kendall 0.45) mm per day per decade, whereas its insignificant decrease rate in October was ~0.79 (Mann Kendall −0.68) mm per day per decade. At Jazan station, a total of 608 wet days were recorded from 1978 to 2024 (Figure 5a and Figure 6). Among these, light, heavy, very heavy, and extremely heavy rainfall days accounted for 391 (64% of wet days), 108 (18%), 48 (8%), and 61 (10%), respectively (Figure 6). Thus, there were a total of 216 days (36%) classified as heavy to extremely heavy rainfall days during the study period, while the remaining 64% were light rainfall days. This means that heavy to extremely heavy rainfall days occur approximately 6 days per year, while light rainfall days occur about 10 days annually. In recent decades (2001–2024), the frequency of light, heavy, and extremely heavy rainfall days increased by 133, 13, and 7 days, respectively, while the number of very heavy rainfall days decreased by 4 days compared to the previous decades (1978–2000).
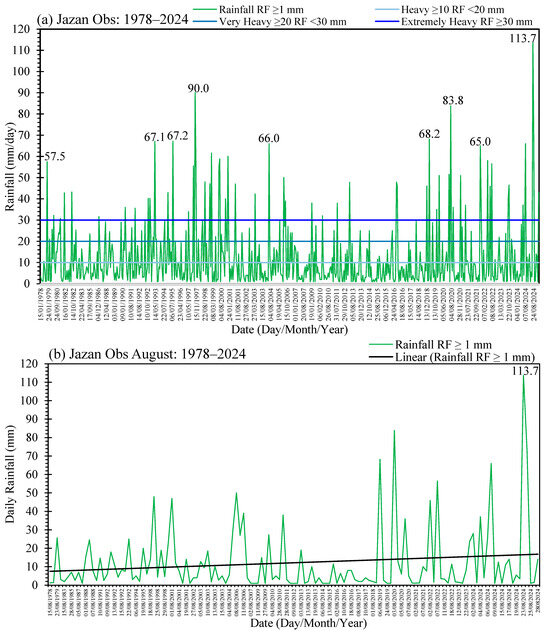
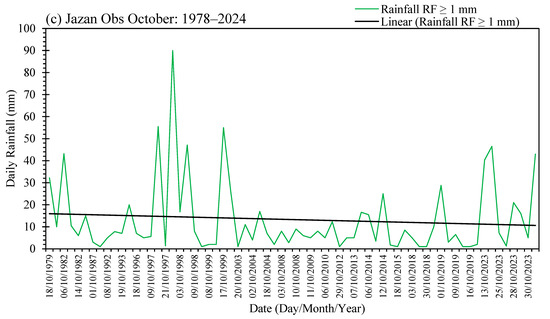
Figure 5.
Time sequences of wet days of rainfall (mm/day) across the year along with the absolute thresholds for heavy, very heavy, and extremely heavy rainfall (a), in August (b), and in October (c) for the period 1978–2024.
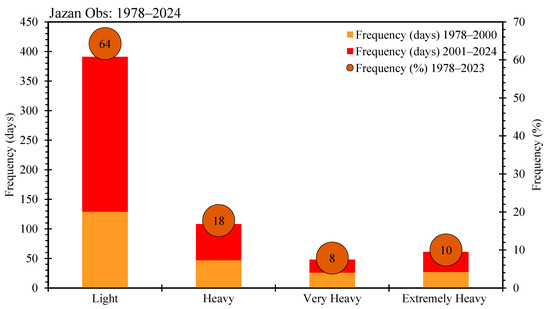
Figure 6.
Frequency of light, heavy, very heavy, and extremely heavy rainfall days for the period 1978–2024. The entire period is divided into two periods: 1978–2000 and 2001–2024.
Figure 7 displays the maximum amounts of short-spell rain (maximum 1-day, RX1day) and long-spell rain (consecutive 5-day, RX5day) in Jazan for the months of August and October. The maximum amount of long-spell rain significantly exceeds that of short-spell rain in both August and October, highlighting the prevalence of prolonged rainfall events in Jazan. However, in recent decades, both the RX1day and RX5day rainfall have been higher in August than in October. This suggests that both short- and long-spell rainfall occurrences have switched from October to August in the Jazan region, correlating with the overall shift in peak rainfall from October to August.
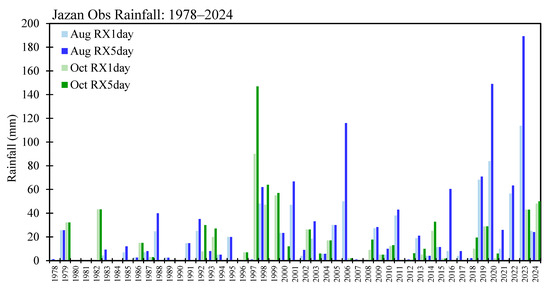
Figure 7.
Time sequences of annual maximum amount of rainfall in 1 day (RX1day) and maximum amount of rainfall in 5 consecutive days (RX5day) for August and October obtained from observations at Jazan station for the period 1978–2024.
Observations of wet days (R1mm), heavy rainfall (R10mm), very heavy rainfall (R20mm), and extremely heavy rainfall (R30mm) in August and October reveal significant changes in Jazan rainfall. Extremely heavy rainfall has been recorded in certain years, while heavy rainfall has become quite common in recent decades (Figure 8). According to linear regression (Mann Kendall), the frequency of R1mm is increasing significantly (at a 95% confidence level) at a rate of 1.3 (2.6) days/decade in August, compared to just 0.5 (0.02) days/decade in the earlier period. Additionally, R20mm and R30mm events are increasing at rates of 0.3 (1.8) and 0.5 (1.5) days/decade, respectively, with a significant level of 95%, which also surpasses the rates observed in previous decades. In October, the insignificant increase rate of R1mm and R10mm is 0.4 (0.9) and 0.2 (0.5) days/decade, respectively, in recent decades, while it was 0.5 (0.2) and 0.1 (1.0) days/decade, respectively, in previous decades, according to linear regression (Mann Kendall). Hence, these increase rates are higher in August than in October.
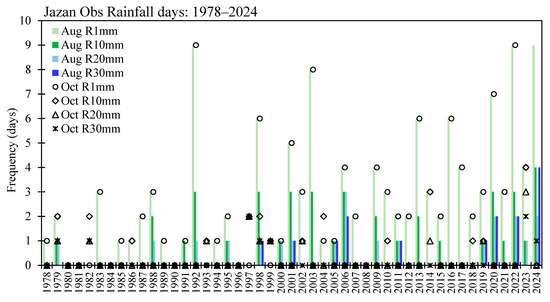
Figure 8.
Time sequences of wet (R1mm), heavy (R10mm), very heavy (R20mm), and extremely heavy (R30mm) rainfall frequency (days) for August and October obtained from surface observations at Jazan station for the period 1978–2024.
On average, the frequency of rainy, heavy, very heavy, and extremely heavy rainfall days in August (October) for the recent decades is 3.9 (1.5), 1.2 (0.5), 0.6 (0.3), and 0.6 (0.1) days, respectively. This indicates that the rainfall in Jazan is primarily due to wet days, with additional contributions from heavy rainfall. Furthermore, there has been a notably larger number of rainy days in August compared to October in recent decades. Notably, August 2024 recorded an unprecedented total of 19 rainy days, while in October 2024, it was only one. Overall, the rainfall activity in August has been more pronounced than in October in recent decades.
3.3. Spatial Distribution of Rainfall in and Around Jazan Region
In the Jazan region, there has been an increase in rainfall in recent decades compared to earlier periods. This increase is evident, with particularly significant rises observed over central, eastern, and southern parts of the region. The annual rainfall is generally lower in the central to western coastal areas of the Jazan region, while it is relatively higher in the eastern mountainous regions, mostly contributed by the summer season (Figure 9). In some areas, the highest increases in summer rainfall have exceeded 44 mm in recent decades, compared to previous decades. Seasonal rainfall in summer and autumn indicates a significant increase in summer rainfall, especially in August, while autumn shows little to no increase, and October has nominal rise. The observed data showed a decrease in October rainfall in recent decades as compared to previous ones, while the summer rainfall increased at a faster rate. Hence, the reanalysis data showed a large rise in summer rainfall, as compared to a small rise in autumn (and a slower increase from observational data). Consequently, the overall increase in annual rainfall is primarily driven by August (18–32 mm), followed by July and May, with decreases observed in January, March, April, and November, while the remaining months show minimal change. Seasonally, summer experiences a considerable surplus of 24–44 mm, there is a small deficit/surplus (±2 mm) in spring, and the other two seasons remain relatively unchanged. This reanalysis data also support the results of observations that the rainfall pattern in Jazan has shifted from autumn to summer in recent decades, with the peak now occurring in August instead of October.
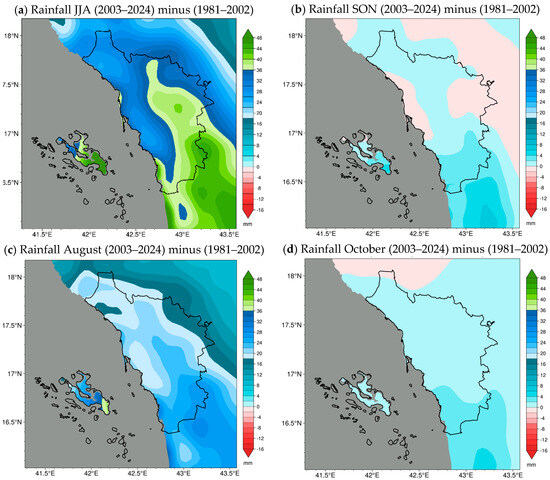
Figure 9.
Spatial distribution of changes in seasonal rainfall in and around Jazan region obtained from CHIRPS reanalysis datasets for the period 1981–2024. Changes in rainfall are the average of 2003–2024 minus the average of 1981–2002 for (a) summer, (b) autumn, (c) August, and (d) October.
In general, CHIRPS reanalysis data tended to report lower rainfall compared to the surface observations, as shown in Figure 10. While both datasets exhibited similar patterns and variations at the annual scale, with a correlation of 0.72, CHIRPS values were generally lower than the observed rainfall for most years, except for a few years, when they were slightly higher. The average rainfall for the common period of 1981–2024 was 98.8 mm for CHIRPS and 154.4 mm for observations. Therefore, CHIRPS is useful for understanding spatial distribution, which point data cannot provide, but it is not reliable for actual rainfall values or extreme calculations.
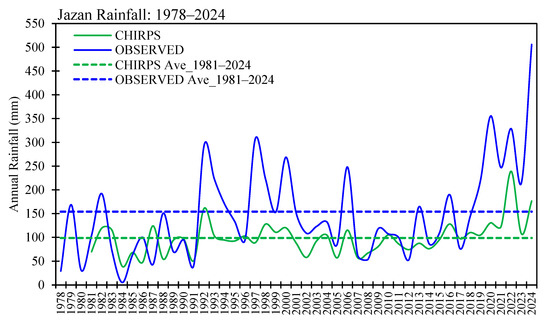
Figure 10.
Time sequences of annual rainfall in Jazan region obtained from observations for the period 1978–2024 and CHIRPS reanalysis datasets for the period 1981–2024. The dashed lines represent the average rainfall for the common period 1981–2024.
4. Discussion and Conclusions
This study analyzed the rainfall conditions in the Jazan region of southwest Saudi Arabia from 1978 to 2024, using surface observations and reanalysis gridded datasets. By comparing recent decades (2001–2024) to earlier ones (1978–2000), the study evaluated changes in rainfall patterns in the region. The findings indicate significant shifts in the rainfall season in the Jazan region, particularly a transition of the peak rainfall from autumn to summer, with a notable shift from October to August. The August rainfall has shown a substantial increase in recent decades, averaging 54.9 mm, compared to 15.4 mm in previous decades. Remarkably, the August 2024 rainfall set a new historical record of 414.8 mm, up from 95.8 mm in 1998 in the region. The October average rainfall dropped from 19.9 mm to 18.7 mm in recent decades and reached the highest amount of 157.5 in 1997, with 137.3 mm in 2023 and 43.0 mm in 2024. Overall, there has been an increase of 34.3 mm in the annual rainfall in recent decades compared to previous periods, with a clear upward trend in the observed rainfall. The increase in the rainfall in Jazan is in line with the significant positive trend mention in earlier study [15]. This provides compelling scientific evidence of changing rainfall patterns in the region, with the peak now occurring in the summer month of August instead of the autumn month of October, as occurred in earlier decades. The high August rainfall is in line with the findings of [40], who analyzed 45 years (1965–2010) of rainfall data for surface water sources in the region and reported relatively high rain in August and April. The increase in the rainfall in recent decades is supportive of the reduction in the scarcity of available groundwater resources in the region [41]. The seasonal shift in rainfall will aid Jazan’s long-term planning for water availability and the development of stormwater infrastructure [42]. Projections for Jazan’s rainfall under different climate change scenarios have been made for the near (2025–2044), mid (2045–2064), and far (2065–2084) future [23]. These projections indicate that rainfall in the near future will increase by 38.1, 12.7, and 25.4 mm/year compared to the base period (1986–2005) under RCP2.6, RCP6.0, and RCP8.5, respectively. In the mid future, rainfall is expected to decrease by 22.9 mm/year under RCP2.6, but it will increase by 25.4 mm/year under RCP6.0 and 111.8 mm/year under RCP8.5. In the far future, rainfall will generally increase under all scenarios, with the most significant increase of 152.4 mm/year projected under RCP8.5 during 2065–2084. Temperature increases are also projected, ranging from 1.3 to 1.9 °C in the near future, 1.7 to 2.1 °C in the mid future, and 2.6 to 3.2 °C in the far future, relative to the base period, under RCP8.5. The combined rise in temperature and rainfall could lead to more climate extremes in the Jazan region. However, a detailed study on climate extremes, including heavy rainfall in different seasons and months, is needed for the future period using high-resolution climate models simulations. It is important to note that the shift in rainfall seasons is a complex process influenced by a combination of advanced technologies (e.g., satellite data, climate models), ground-based observations (meteorological data, phenology), and long-term historical records. By integrating these diverse tools, more accurate predictions and strategies can be developed to address the changing rainfall patterns increasingly impacted by climate change. Therefore, to enhance understanding of rainfall conditions and inform long-term planning for the economic sustainability of the Jazan region, further investigation is recommended, including the use of automatic weather stations and remote sensing data along with high-resolution climate model simulations under various climate change scenarios. Furthermore, it is recommended to investigate the shifting rainfall season in other semi-arid to arid regions to determine whether they align with the findings of the current study.
Author Contributions
M.N.I., methodology and original draft preparation; A.O.Z. and M.I., data collection and formal analysis; T.M.A.H. and A.S.G., data curation, resources, review and editing. All authors have read and agreed to the published version of the manuscript.
Funding
This research received no external funding.
Institutional Review Board Statement
Not applicable.
Informed Consent Statement
Not applicable.
Data Availability Statement
Data are available upon request.
Acknowledgments
The authors acknowledge the National Center for Meteorology (NCM) for providing surface observations, and the CHIRPS and ERA5 are acknowledged for synoptic and rainfall data through their websites.
Conflicts of Interest
The authors declare no conflicts of interest.
References
- Weiskopf, S.R.; Rubenstein, M.A.; Crozier, L.G.; Gaichas, S.; Griffis, R.; Halofsky, J.E.; Hyde, K.J.W.; Morelli, T.L.; Morisette, J.T.; Muñoz, R.C.; et al. Climate change effects on biodiversity, ecosystems, ecosystem services, and natural resource management in the United States. Sci. Tot. Environ. 2020, 733, 137782. [Google Scholar] [CrossRef] [PubMed]
- Shivanna, K.R. Climate change and its impact on biodiversity and human welfare. Proc. Indian Natl. Sci. Acad. USA 2022, 88, 160–171. [Google Scholar] [CrossRef]
- Arabia. In Encyclopedia Britannica 2009. From Encyclopedia Britannica. Available online: http://www.britannica.com/EBchecked/topic/31551/Arabia (accessed on 4 February 2025).
- Suhail, M. Water Resource Management in Saudi Arabia. Ph.D. Thesis, Samarkand State University, Samarkand, Uzbekistan, 2016. [Google Scholar] [CrossRef]
- Alharthi, S.T.; El-Shiekh, M.A.; Alfarhan, A.A. Alien Plant Invasions of the Natural Habitat in the Western Region of Saudi Arabia: Floristic Diversity and Vegetation Structure. Diver 2023, 15, 309. [Google Scholar] [CrossRef]
- Chowdhury, S.; Al-Zahrani, M. Implications of Climate Change on Water Resources in Saudi Arabia. Arab. J. Sci. Eng. 2013, 38, 1959–1971. [Google Scholar]
- Patlakas, P.; Stathopoulos, C.; Flocas, H.; Kalogeri, C.; Kallos, G. Regional Climatic Features of the Arabian Peninsula. Atmosphere 2019, 10, 220. [Google Scholar] [CrossRef]
- Peel, M.C.; Finlayson, B.L.; McMahon, T.A. Updated world map of the Köppen-Geiger climate classification. Hydrol. Earth Syst. Sci. 2007, 11, 1633–1644. [Google Scholar] [CrossRef]
- Subyani, A.M.; Al-Modayan, A.A.; Al-Ahmadi, F.S. Topographic, seasonal and aridity influences on rainfall variability in western Saudi Arabia. J. Environ. Hydrol. 2010, 18, 1–11. [Google Scholar]
- Blaskovic, T. Severe Weather Hits UAE and Oman: Thunderstorms, Large Hail and Severe Flooding. The Watchers—Daily News Service 2016, Watchers. NEWS. Available online: https://watchers.news/2016/03/09/severe-weather-hits-uae-and-oman-thunderstorms-large-hail-and-severe-flooding/ (accessed on 4 February 2025).
- Mathon, V.H.; Laurent, H.; Lebel, T. Mesoscale convective system rainfall in the Sahel. J. Appl. Meteorol. Climatol. 2002, 41, 1081–1092. [Google Scholar] [CrossRef]
- Kumar, K.N.; Entekhabi, D.; Molini, A. Hydrological extremes in hyperarid regions: A diagnostic characterization of intense precipitation over the central Arabian Peninsula. J. Geophys. Res.-Atmos. 2015, 120, 1637–1650. [Google Scholar] [CrossRef]
- AlSarmi, S.H.; Washington, R. Changes in climate extremes in the Arabian Peninsula: Analysis of daily data. Int. J. Climatol. 2014, 34, 1329–1345. [Google Scholar] [CrossRef]
- Almazroui, M.; Islam, M.N.; Dambul, R.; Jones, P.D. Trends of temperature extremes in Saudi Arabia. Int. J. Climatol. 2014, 34, 808–826. [Google Scholar] [CrossRef]
- Almazroui, M. Rainfall Trends and Extremes in Saudi Arabia in Recent Decades. Atmosphere 2020, 11, 964. [Google Scholar] [CrossRef]
- Donat, M.G.; Peterson, T.C.; Brunet, M.; King, A.D.; Almazroui, M.; Kolli, R.K.; Boucherf, D.; Al-Mulla, A.Y.; Nour, A.Y.; Aly, A.A.; et al. Changes in extreme temperature and precipitation in the Arab region: Long-term trends and variability related to ENSO and NAO. Int. J. Climatol. 2014, 34, 581–592. [Google Scholar] [CrossRef]
- Islam, M.N.; Almazroui, M.; Dambul, R.; Jones, P.D.; Alamoudi, A.O. Long-term changes in seasonal temperature extremes over Saudi Arabia during 1981–2010. Int. J. Climatol. 2015, 35, 1579–1592. [Google Scholar] [CrossRef]
- Almazroui, M.; Islam, M.N.; Jones, P.D.; Athar, H.; Rahman, M.A. Recent climate change in the Arabian Peninsula: Seasonal rainfall and temperature climatology of Saudi Arabia for 1979–2009. Atmos. Res. 2012, 111, 29–45. [Google Scholar] [CrossRef]
- Mashat, A.; Basset, H.A. Analysis of Rainfall over Saudi Arabia. JKAU Met. Env. Arid Land Agric. Sci. 2011, 22, 59–78. [Google Scholar] [CrossRef]
- Hasanean, H.; Almazroui, M. Rainfall: Features and Variations over Saudi Arabia. A Review. Climate 2015, 3, 578–626. [Google Scholar] [CrossRef]
- Maghrabi, A.; Alamoudi, H.; Alruhaili, A. Long-Term Rainfall Trends in South West Asia—Saudi Arabia. Amer. J. Clim. Chan. 2023, 12, 204–217. [Google Scholar] [CrossRef]
- Shwehdi, M.H. Thunderstorm distribution and frequency in Saudi Arabia. J. Geophy. Eng. 2005, 2, 252–267. [Google Scholar] [CrossRef]
- Tarawneh, Q.Y.; Chowdhury, S. Trends of Climate Change in Saudi Arabia: Implications on Water Resources. Climate 2018, 6, 8. [Google Scholar] [CrossRef]
- Abuallut, I.I.; Alameer, K.M.; Abuageelah, B.M.; Hurissi, E.; Alqahtani, M.M.; Gosadi, I.M.; Tubaigy, F.M.; Alyami, Y.M. Parents’ Awareness, Knowledge, and Perception of Amblyopia in Children. A Study in Jazan Region, Saudi Arabia. Cureus 2023, 15, e48956. [Google Scholar] [CrossRef] [PubMed]
- Scoville, S.A. Gazetteer of Arabia: A Geographical and Tribal History of the Arabian Peninsula; Akademische Druck- u. Verlagsanstalt: Graz, Austria, 2006; Volume 2, p. 288. ISBN 0-7614-7571-0. [Google Scholar]
- Németh, K.; Moufti, M.R.; El-Masry, N.; Qaddah, A.; Pécskay, Z. Maars over cones: Repeated volcanism in the same location along fissures in western Saudi Arabian volcanic fields. In Proceedings of the IAVCEI—5IMC: 5th International Maar Conference, Querétaro, Mexico, 17–22 November 2014; pp. 2–3. [Google Scholar]
- Zaidi, F.K.; Mukhopadhyay, M. Morphometric analysis of the scoria cones and drainage pattern for the Quaternary and older volcanic fields in parts of the Large Igneous Province, Saudi Arabia. J. African. Earth Sci. 2015, 110, 1–13. [Google Scholar] [CrossRef]
- INVEST SAUDI. Jazan Province 2024. Available online: https://www.investsaudi.sa/en/meetTheKingdom/province/jazan (accessed on 4 February 2025).
- de Sousa, K.; Sparks, A.; Ashmall, W.; van Etten, J.; Solberg, S. chirps: API Client for the CHIRPS Precipitation Data in R. J. Open Sou. Soft. 2020, 5, 2419. [Google Scholar] [CrossRef]
- Schneider, D.P.; Deser, C.; Fasullo, J.; Trenberth, K.E. Climate Data Guide Spurs Discovery and Understanding. Eos Trans. AGU 2013, 94, 121–122. [Google Scholar] [CrossRef]
- Hersbach, H.; Bell, B.; Berrisford, P.; Hirahara, S.; Horányi, A.; Muñoz-Sabater, J.; Nicolas, J.; Peubey, C.; Radu, R.; Schepers, D.; et al. The ERA5 global reanalysis. Q. J. R. Meteorol. Soc. 2020, 146, 1999–2049. [Google Scholar] [CrossRef]
- Siegel, F.A. Chapter 12—Multiple Regression: Predicting One Variable from Several Others. In Practical Business Statistics, 6th ed.; Elsevier: Amsterdam, The Netherlands, 2012. [Google Scholar] [CrossRef]
- Mann, H.B. Non-parametric tests against trend. Econometrica 1945, 13, 163–171. [Google Scholar] [CrossRef]
- Kendall, M.G. Rank Correlation Methods, 4th ed.; Charles Griffin: London, UK, 1975. [Google Scholar]
- Bonacci, T. Analysis ofthe water temperature regime of the Danube and its tributaries in Croatia. Hydrol. Process. 2008, 22, 1014–1021. [Google Scholar] [CrossRef]
- Bonacci, O.; Ðurin, B.; Roje-Bonacci, T.; Bonacci, D. The Influence of reservoirs on water temperature in the down-stream part of an open watercourse: A case study at BotovoStation on the Drava River. Water 2022, 14, 3534. [Google Scholar] [CrossRef]
- Pekárová, P.; Bajtek, Z.; Pekár, J.; Výleta, R.; Bonacci, O.; Miklánek, P.; Belz, J.U.; Gorbatchova, L. Monthly streamtemperatures along the Danube River: Statistical analysis andpredictive modelling with incremental climate change scenarios. J. Hydrol. Hydromech. 2023, 71, 382–398. [Google Scholar] [CrossRef]
- Đurin, B.; Kranjčić, N.; Kanga, S.; Singh, S.K.; Sakač, N.; Pham, Q.B.; Hunt, J.; Dogančić, D.; Di Nunno, F. Application of Rescaled Adjusted Partial Sums (RAPS) method in hydrology—An overview. Advan. Civil Arch. Eng. 2022, 13, 58–72. [Google Scholar] [CrossRef]
- Garbrecht, J.; Fernandez, G.P. Visualization of trends and fluctuations in climatic records. JAWRA J. Amer. Wat. Resour. Asso. 1994, 30, 297–306. [Google Scholar] [CrossRef]
- Al-Zahrani, M.A.; Chowdhury, S.; Abo-Monasar, A. Augmentation of surface water sources from spatially distributed rainfall in Saudi Arabia. J. Wat. Reuse Desal. 2015, 5, 391–406. [Google Scholar] [CrossRef]
- Al-Maliki, S.Q.A.K.; Ahmed, A.A.; Al-Ghobiri, M.A.; Ali Nasr, O. Water Resource Management Using Geographical Information System and Remote Sensing Technologies: A Case of Jazan, Saudi Arabia. In Hydrology–Current Research and Future Directions; InTech Open: Rijeka, Croatia, 2024. [Google Scholar] [CrossRef]
- Ministry of Municipal and Rural Affairs. Jazan City Profile; King Fahd National Library Cataloging-in-Publication Data 2019, United Nations Human Settlements Programme (UN-Habitat); Ministry of Municipal and Rural Affairs: Riyadh, Saudi Arabia, 2019; ISBN 978-603-8279-27-4.
Disclaimer/Publisher’s Note: The statements, opinions and data contained in all publications are solely those of the individual author(s) and contributor(s) and not of MDPI and/or the editor(s). MDPI and/or the editor(s) disclaim responsibility for any injury to people or property resulting from any ideas, methods, instructions or products referred to in the content. |
© 2025 by the authors. Licensee MDPI, Basel, Switzerland. This article is an open access article distributed under the terms and conditions of the Creative Commons Attribution (CC BY) license (https://creativecommons.org/licenses/by/4.0/).