Article

Compound Precipitation and Wind Extremes in the Eastern Part of the Baltic Sea Region

by
Laurynas Klimavičius
,
Egidijus Rimkus
* and
Gintautas Stankūnavičius
Institute of Geosciences, Vilnius University, LT-03225 Vilnius, Lithuania
*
Author to whom correspondence should be addressed.
Atmosphere 2025, 16(3), 276; https://doi.org/10.3390/atmos16030276
Submission received: 28 January 2025 / Revised: 19 February 2025 / Accepted: 24 February 2025 / Published: 26 February 2025
(This article belongs to the Section Climatology)

Abstract

:
Compound wind and precipitation extremes (CPWEs) pose significant threats to infrastructure, economies, the environment, and human lives. In this study, the recurrence, spatial distribution, intensity, and synoptic conditions leading to the formation of CPWEs were assessed in the eastern part of the Baltic Sea region. Using ERA5 reanalysis data, CPWEs were identified when both daily precipitation and maximum wind speed exceeded the 98th percentile thresholds on the same day at the same grid cell. Due to the proximity of the Baltic Sea and the influence of terrain, CPWEs were most frequent on the windward slopes of highlands in the western part of the investigation area. The most severe CPWEs occurred in the second half of summer and early September. Based on data from the Hess–Brezowsky synoptic classification catalogue and various synoptic datasets, the formation of CPWEs during the cold season (October–March) is associated with intense zonal (westerly) flow, while during the warm season (April–September), it is linked to the activity of southern-type cyclones. The number of CPWEs increased across all seasons, with the largest changes observed during the summer. However, the majority of changes are insignificant according to the Mann–Kendall test.

1. Introduction

In recent decades, human-induced climate change has led to increased frequency and intensity of different weather and climate extremes. Particularly notable is the rise in hot extremes and heavy precipitation events, with these trends observed across various regions of the planet [1]. Such extreme events cause significant negative impacts on infrastructure, economies, and natural environments. Between 2000 and 2020, 773 million people were injured during such events, with losses amounting to USD 1.3 trillion [2]. In the European Union alone, weather and climate events caused over 200,000 deaths between 1980 and 2023 [3].
However, the past decade has shown that more significant damage and negative socio-economic impacts occur when two or more weather or climate extremes interact, resulting in a compound climate event [4,5]. Four different types of such events have been distinguished [6], one of which includes compound precipitation and wind speed extremes (CPWEs). These occur when extreme precipitation and wind speed are simultaneously recorded in the same area [6,7].
CPWEs are among the most damaging extreme climate events. They can negatively affect various economic sectors, pose threats to the natural environment, disrupt critical infrastructure, and result in human fatalities [8]. For instance, in January 2018, the storm “Friederike” struck Central Europe, causing traffic disruptions, power outages, building damage due to falling trees, and fatalities. In Germany alone, the storm caused EUR 900 million in damage [9]. CPWEs can also trigger landslides and pose risks from falling trees, which become more vulnerable to wind as soil moisture increases [7,9]. A study in the Czech Republic found that during winter CPWEs, mortality rates increase by 3% within 0–2 days after the event. The mortality rate was higher than that associated with individual precipitation or wind speed extremes [10]. Therefore, understanding CPWEs’ formation, recurrence trends, and associated risks is increasingly critical [7,11].
CPWEs have been studied at both global [7,12,13] and regional scales [8,14,15,16,17,18]. Globally, CPWEs occur most frequently and pose significant risks, including flash floods and storm surges, in coastal regions [7,19,20] and areas prone to tropical cyclones [12]. In Europe, CPWEs are most commonly observed along Norway’s western coastline, the Iberian Peninsula, and Central Europe [14,15]. Over recent decades, their frequency in Europe has remained relatively unchanged [15], but projections suggest that with continued climate warming, CPWEs will become more frequent, particularly in the northern and eastern parts of the continent [13]. Globally, these extremes are expected to shift towards higher latitudes in both hemispheres, with the most significant increases projected for regions above 50° latitude [21].
Investigations of CPWEs have also focused on the factors driving their formation. In mid-latitudes, CPWEs are associated with intense zonal westerly flows [22] and mid-latitude cyclones [7,19,23]. In northwestern and northern Europe, their formation is closely linked to the North Atlantic Oscillation (NAO), with CPWEs being more frequent and intense during a positive NAO phase [24]. Additionally, a strong relationship has been found between CPWEs in Western Europe and cold extremes in eastern North America [24,25]. Finally, the formation of these extremes also depends on local topography. During winter, more CPWEs are observed in the highlands, whereas in summer, they are more common in the lowlands [23].
Despite increasing attention to CPWEs globally and in Europe, no studies have investigated these compound extremes in the eastern part of the Baltic Sea region—this research is the first of its kind. Until now, precipitation and wind speed extremes in the Baltic states have been studied separately, focusing on their historical recurrence and future projections [26,27,28,29,30,31].
The primary goal of this study is to evaluate the recurrence, spatial distribution, intensity, and synoptic processes driving the formation of CPWEs in the eastern part of the Baltic Sea region from 1950 to 2022. The first part of the study assesses precipitation and wind speed extremes separately, determining their spatial distribution and recurrence over the 1950–2022 period. The second part focuses on the recurrence and trends of CPWEs, while the third part evaluates their intensity. Finally, the study concludes with an analysis of the synoptic conditions and factors leading to the formation of those compound extremes.

2. Materials and Methods
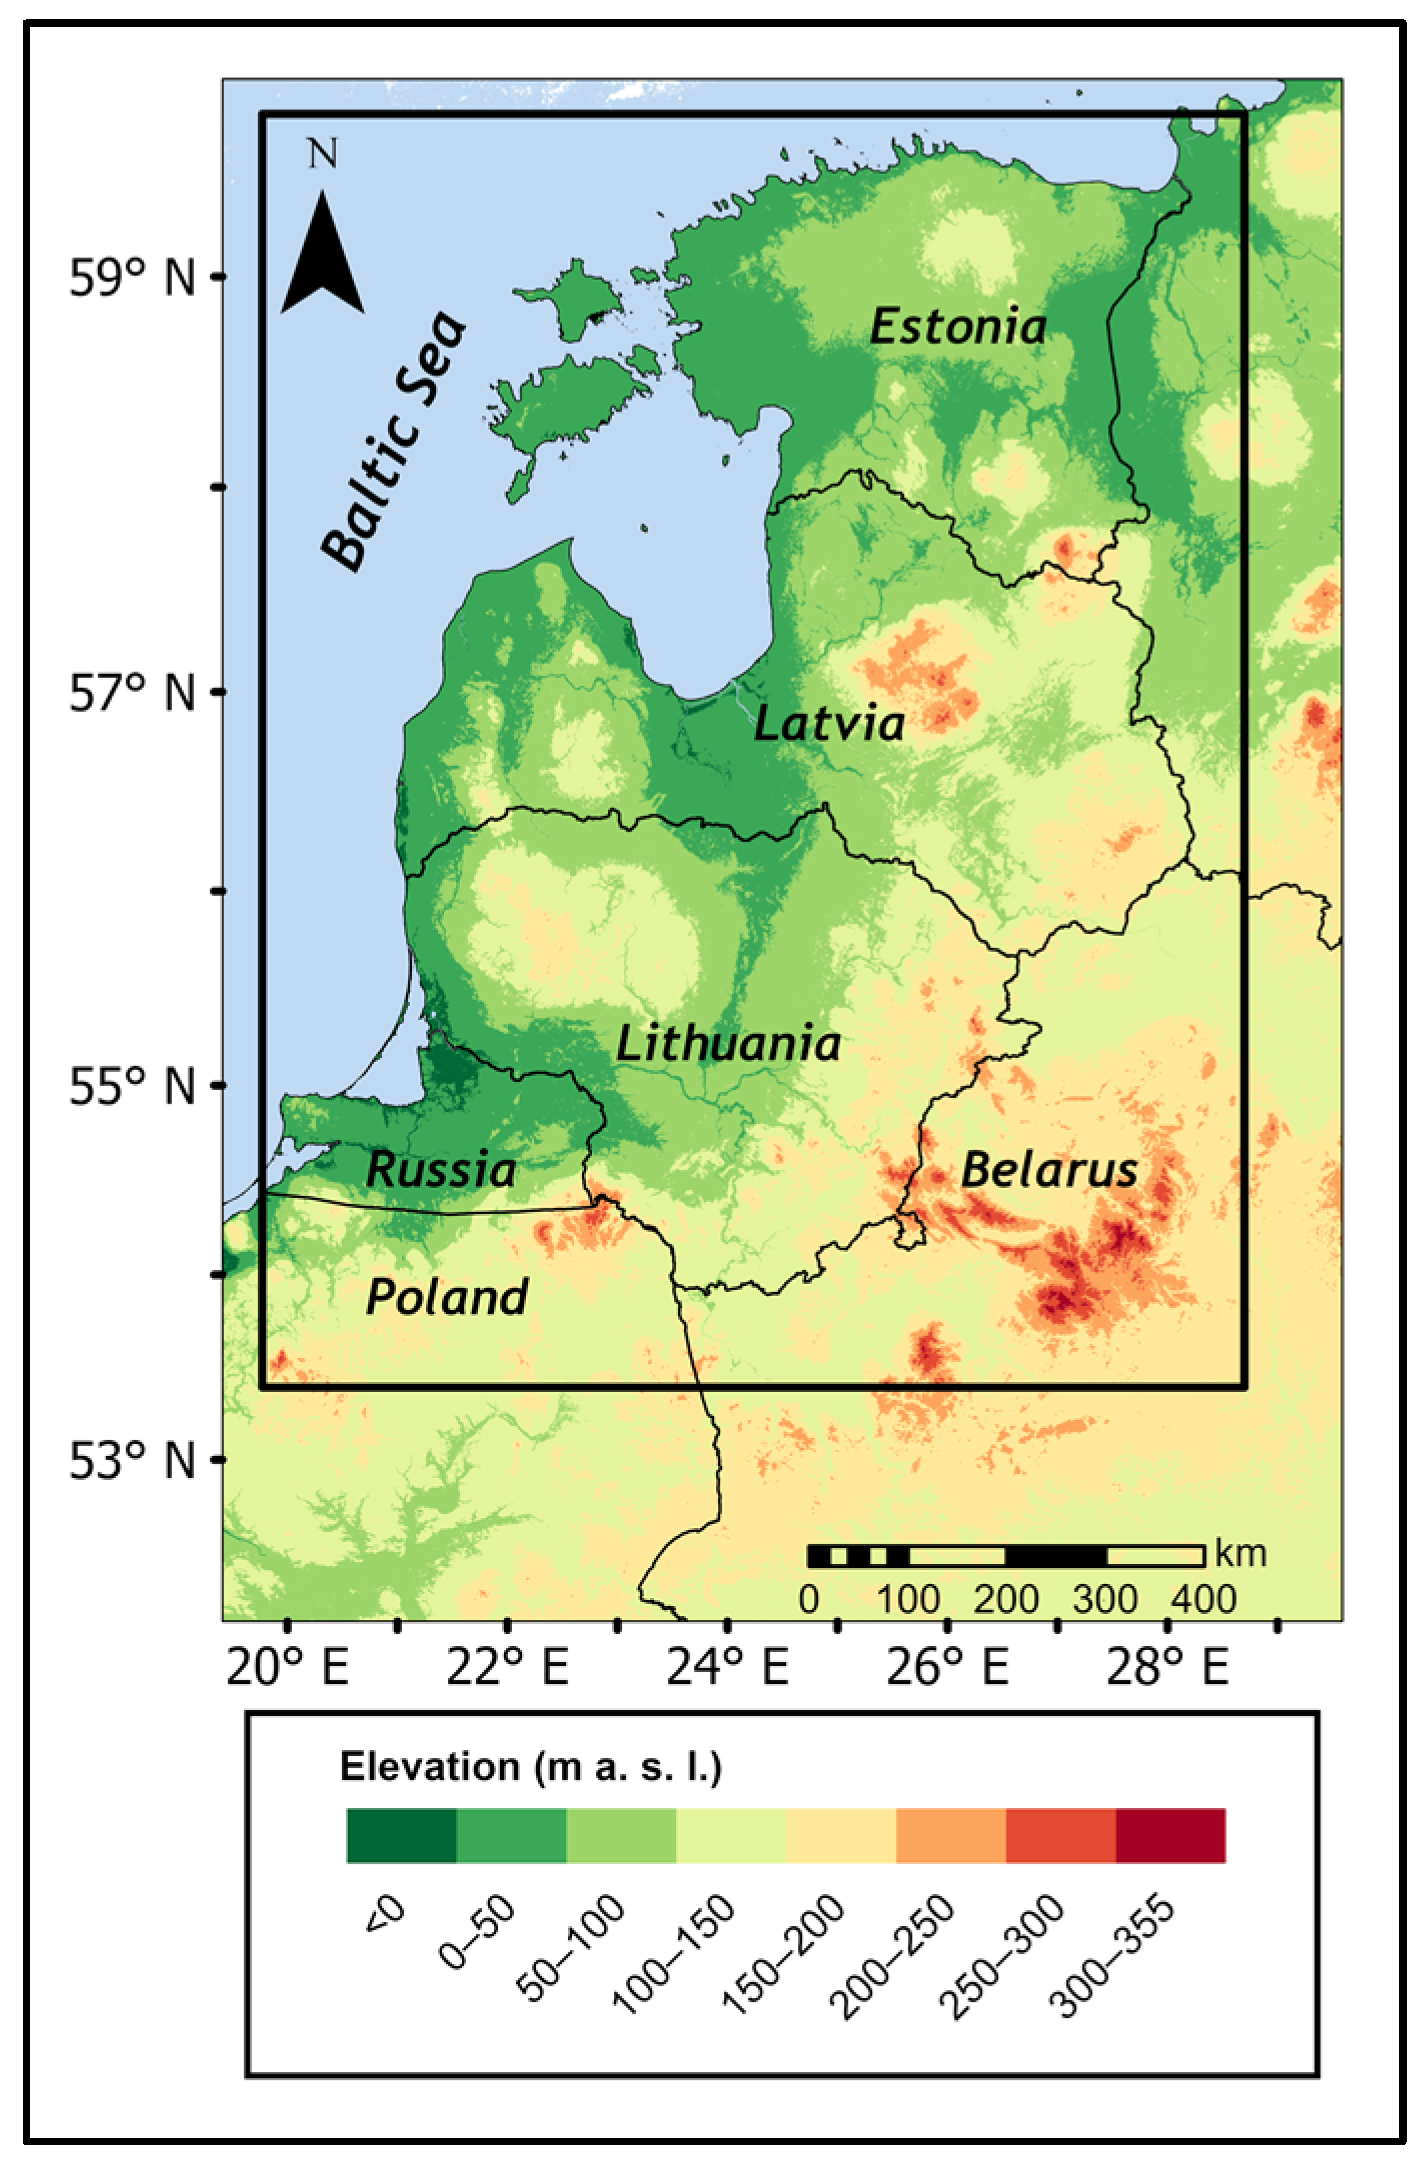
2.1. Study Area

The study focuses on the eastern part of the Baltic Sea region, covering an area between 53.5° and 59.5° N latitude and 20.0° and 28.5° E longitude (Figure 1).
The study area is characterised by lowlands and plains, with the highest point reaching 355 m above sea level (Figure 1). According to the updated Köppen–Geiger climate classification, the eastern part of the Baltic Sea region falls under the Dfb climate type [32,33], where the mean temperature of the warmest month (July) does not exceed 22 °C, but at least four months per year have a daily mean temperature above 10 °C [33].
The average temperature during the warmest summer months is around 16–18 °C, while in winter, it drops to −3 to −6 °C. Along the Baltic Sea coast, the air temperature during winter is close to 0 °C. The region experiences an average annual precipitation ranging from 550 to 800 mm, with the highest amounts recorded in the western part of the study area. The maximum precipitation occurs in July and August, averaging 70–90 mm monthly. The mean annual wind speed ranges from 2 m/s in the eastern part of the study area to 6 m/s on islands in the northeast, with the highest average wind speed observed in December and January.

2.2. Data

To identify CPWEs, daily precipitation (P) data and hourly maximum wind speed at 10 m height data from the European Centre for Medium-Range Weather Forecasts (ERA5) reanalysis were used. The daily maximum wind speed (wmax) at each grid point within the study area was determined from the hourly values. The spatial resolution of the processed data grids is 0.25 × 0.25°. The period from 1950 to 2022 was analysed.
This study focused on land areas only, analysing grids where more than 50% of the area is classified as land. Such grids were selected using the land filter in the KNMI Climate Explorer application (https://climexp.knmi.nl/start.cgi (accessed on 25 February 2024)), which was also used to obtain precipitation data. Hourly maximum wind speed data were retrieved from the Copernicus Climate Data Store (https://cds.climate.copernicus.eu/ (accessed on 25 February 2024)).
ERA5 reanalysis was chosen for this study due to its detailed temporal and spatial resolution and the long time series of its dataset [34]. It was also found that ERA5 reanalysis data for wind speed and precipitation closely align with ground-based observations in mid-latitudes. The accuracy of ERA5 reanalysis data, particularly when assessing extreme values, tends to decrease in mountainous regions and tropical areas [35,36,37]. However, the study area in this research does not exhibit significant variation in altitude (Figure 1), so this issue is avoided. When using ERA5 data for evaluating P and wmax extremes, inaccuracies may arise due to the grid cell size (0.25 × 0.25°). This resolution in some cases might be insufficient for identifying extremes associated with mesoscale processes, such as thermal convection during the summer storms.
The assimilation of satellite, ground station, and radar data during dataset development is also an important factor for the accuracy of ERA5 reanalysis. In Europe, where such data are abundant, ERA5 data closely align with meteorological observations [38]. Finally, comparing precipitation and wind speed data from various widely used reanalysis datasets with ground-based measurements revealed that ERA5 provides the highest accuracy for both variables in Central Europe [38,39].

2.3. Identification of Compound Precipitation and Wind Extremes (CPWEs)

The 98th percentile values of P and wmax were calculated for each grid cell within the study area over the entire analysis period to identify CPWEs. The percentile method is widely used to identify extremes of these variables due to its simplicity and adaptability to various datasets and regions [40]. Different percentiles of P and wmax have been used in CPWE studies across various regions and on a global scale [7,8,11,14,41]. In this study, the 98th percentile values were chosen. To determine the appropriate percentile value for identifying P and wmax extremes, various threshold values (95th, 97th, 98th, and 99th percentiles) were tested. After evaluating the number of extremes identified in each case, it was established that the 98th percentile is optimal. This threshold captures both moderate and severe extremes while providing sufficient data for statistical analysis. At least one of these conditions was not met when using the other percentile values. Similar reasoning for using the 98th percentile was also provided in other studies [7,40].
In this study, P or wmax extremes were identified when the value of a variable at a given grid cell exceeded its 98th percentile value. Changes in such extremes were assessed for each grid cell over the 73-year study period. The statistical significance of these changes was determined using the non-parametric Mann–Kendall test, with results considered significant at p < 0.05.
CPWEs were defined as instances where both P and wmax extremes occurred on the same day at the same grid cell. The recurrence and changes in such compound extremes were assessed from 1950 to 2022. Additionally, the monthly and seasonal recurrence of CPWEs was analysed for the following seasons: December–February (DJF), March–May (MAM), June–August (JJA), and September–November (SON). Finally, the number of CPWEs in each grid cell was determined for the first (1950–1969) and last (2003–2022) 20 years of the study period, and the changes in these compound extremes were evaluated. These two time periods were selected to highlight the changes in the CPWEs under rapidly changing climate conditions. The statistical significance of these changes (p < 0.05) was determined using Student’s t-test.
Once CPWEs were identified, the total number of days with at least one CPWE in any part of the study area was calculated. The recurrence of such days over the study period was evaluated, the season with the highest number of such days was identified, and the days with the most extensive spatial coverage of CPWEs were determined.
To identify the most intense CPWEs, the 99th and 99.9th percentile values of P and wmax were calculated for each grid cell. The frequency of compound extremes where both variables exceeded these percentile thresholds within the same grid cell during the study period was assessed. Similar methodologies have been applied in the analysis of various compound climate events [42,43], including CPWEs [44,45].

2.4. Evaluation of Atmospheric Processes During CPWE Formation

CPWE formation can be explained by the specific atmospheric circulation conditions that have developed in the region or larger area. To accomplish that, several complementary information sources were used to assess atmospheric conditions over Europe:
(a)
Manual classification of daily large-scale circulation patterns by Hess–Brezowsky;
(b)
Freely available synoptic schemes over Europe from three different weather centres—United Kingdom Met Office (available from 1988), German Meteorological Service (available from 2003), and Royal Netherlands Meteorological Institute (available from 2003);
(c)
Global forecast system (GFS) analysis charts (available from 1979) and ERA5 post-processed daily statistics (available from 1940);
(d)
The archive of weather maps from the Lithuanian Hydrometeorological Service under the Ministry of Environment (available from 1946).
The Hess–Brezowsky synoptic classification (GWL) represents 29 typical patterns of the daily synoptic circulation over Central Europe. Four types of them depend on zonal or westerly circulations (WA, WZ, WS, and WW), eight on southerly circulations (SWA, SWZ, SA, SZ, TB, TRW, SEA, and SEZ), eight on northwesterly and northerly circulations (NWA, NWZ, NA, NZ, HNA, HNZ, HB, and TRM), six on northeasterly and easterly circulations (NEA, NEZ, HFA, HFZ, HNFA, and HNFZ) and the last three on the main high/low-pressure area over Central Europe pattern (HM, TM, BM) [46]. These types are widely used in research areas such as synoptic meteorology, applied meteorology, climatology, environmental sciences, etc. The GWL data have been available since 1881, while descriptions of circulation types are provided in many similar studies [46,47,48,49,50,51]. The subjective classification of atmospheric processes by Hess–Brezowsky has a long history. It is widely used in atmospheric, climatic, and interdisciplinary studies, allowing for easier comparison of results across different authors and countries. An objective analysis provides a more precise depiction of atmospheric flow and structure. However, it depends on the selected domain, variables, and classification method, often yielding circulation types that differ from traditional subjective analyses.
Hess and Brezowsky circulation types were useful in determining the general flow pattern over Europe. The synoptic schemes were good for identifying the evolution of frontal systems and surface-pressure gradients within low-pressure fields. GFS analysis charts also allowed the tracking of the progress of surface pressure fields as well as temperature and humidity fields in the lower part of the troposphere. ERA5 daily data were used for similar purposes as GFS analysis, only prior to 1979. Operational (archived) weather maps were very useful in determining the development of the weather systems in Eastern and Central Europe, especially in the period before the 1980s.
The synoptic situation and atmospheric conditions that led to the formation of CPWEs were assessed only on the days within the study period when these compound extremes affected more than one-fifth of the study area. Atmospheric circulation was evaluated on each of these days as a major driving factor, as well as two days before, to determine the conditions for development, and one day after, to observe the decay of the event. The atmospheric conditions that influenced CPWE formation were separately analysed for the cold season (October–March) and the warm season (April–September).

3. Results

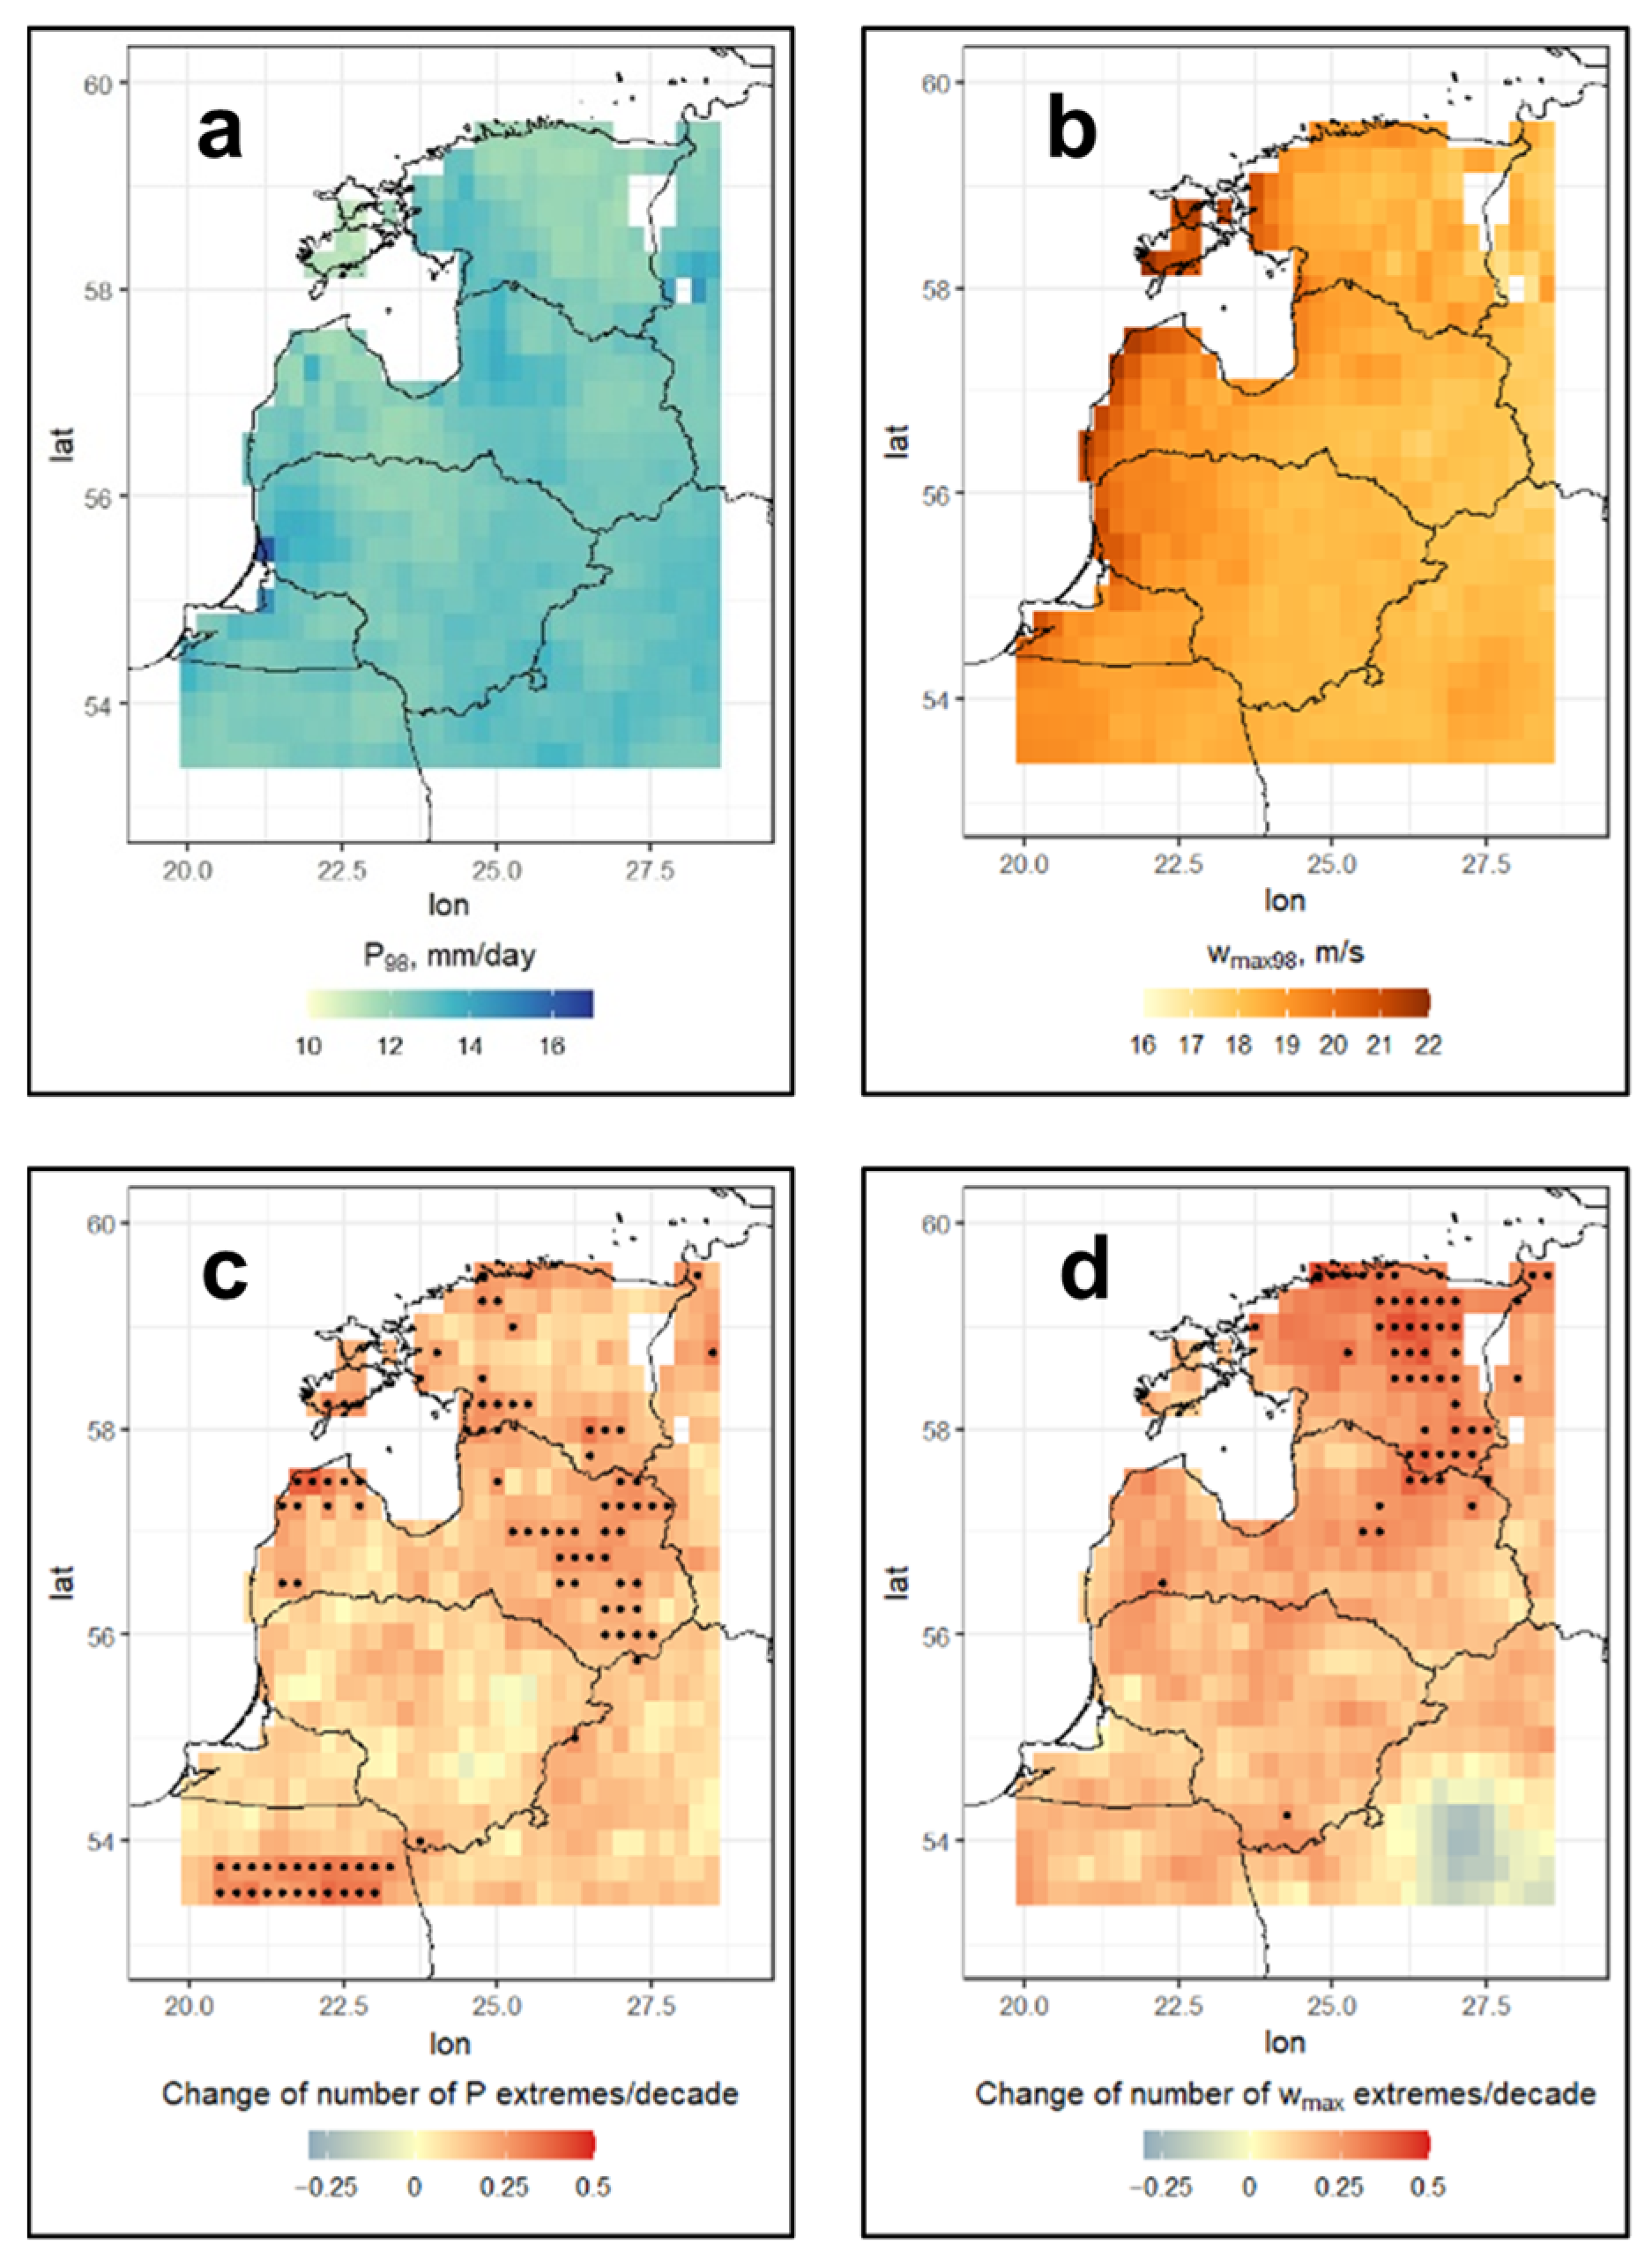
3.1. Extremes of Precipitation and Maximum Wind Speed

The highest 98th percentile daily precipitation (P98) value, reaching 16.2 mm/day, was recorded along the Lithuanian Baltic Sea coast, while the lowest values (11–12 mm/day) were observed in the northern part of the study area and around the Estonian islands (Figure 2a). It is evident that the distribution of these values is influenced by topography. Higher P98 values were found in the uplands of western Lithuania and central Latvia.
The distribution of the 98th percentile maximum daily wind speed (wmax98) across the study area is predominantly affected by the distance from the Baltic Sea (Figure 2b). The highest wmax98 values, ranging from 21 to 22 m/s, were observed along the Baltic Sea coast. In contrast, the lowest wmax98 values (16–17 m/s) were identified in the eastern part of the study area (Figure 2b).
After calculating the P98 and wmax98 values for each grid cell separately, reoccurrence extremes for both P and wmax were assessed for cases when the values exceeded the 98th percentile. The analysis of the recurrence of P extremes in the area revealed that their number has increased (on average across the area), but this change was not significant. The highest number of P extremes occurred in 1998, accounting for 2.2% of all P extremes. When examining the changes in the number of these extremes at each point in the study area, it was found that the number increased in 98.9% of the grid cells. However, statistically significant changes were found in only 13.8% of the points (Figure 2c).
The number of wmax extremes in the eastern Baltic Sea region also increased over the study period. This change was more pronounced compared with P extremes, but it was not statistically significant either. The most frequent wmax extremes occurred in 1990, which accounted for 3.5% of all wmax extremes during the investigation period. The number of wmax extremes increased across almost the entire study area (94% of the grid cells). The largest growth was observed in the northern and northeastern parts of the study area. However, statistically significant changes were found in only 8.1% of the grid cells (Figure 2d).

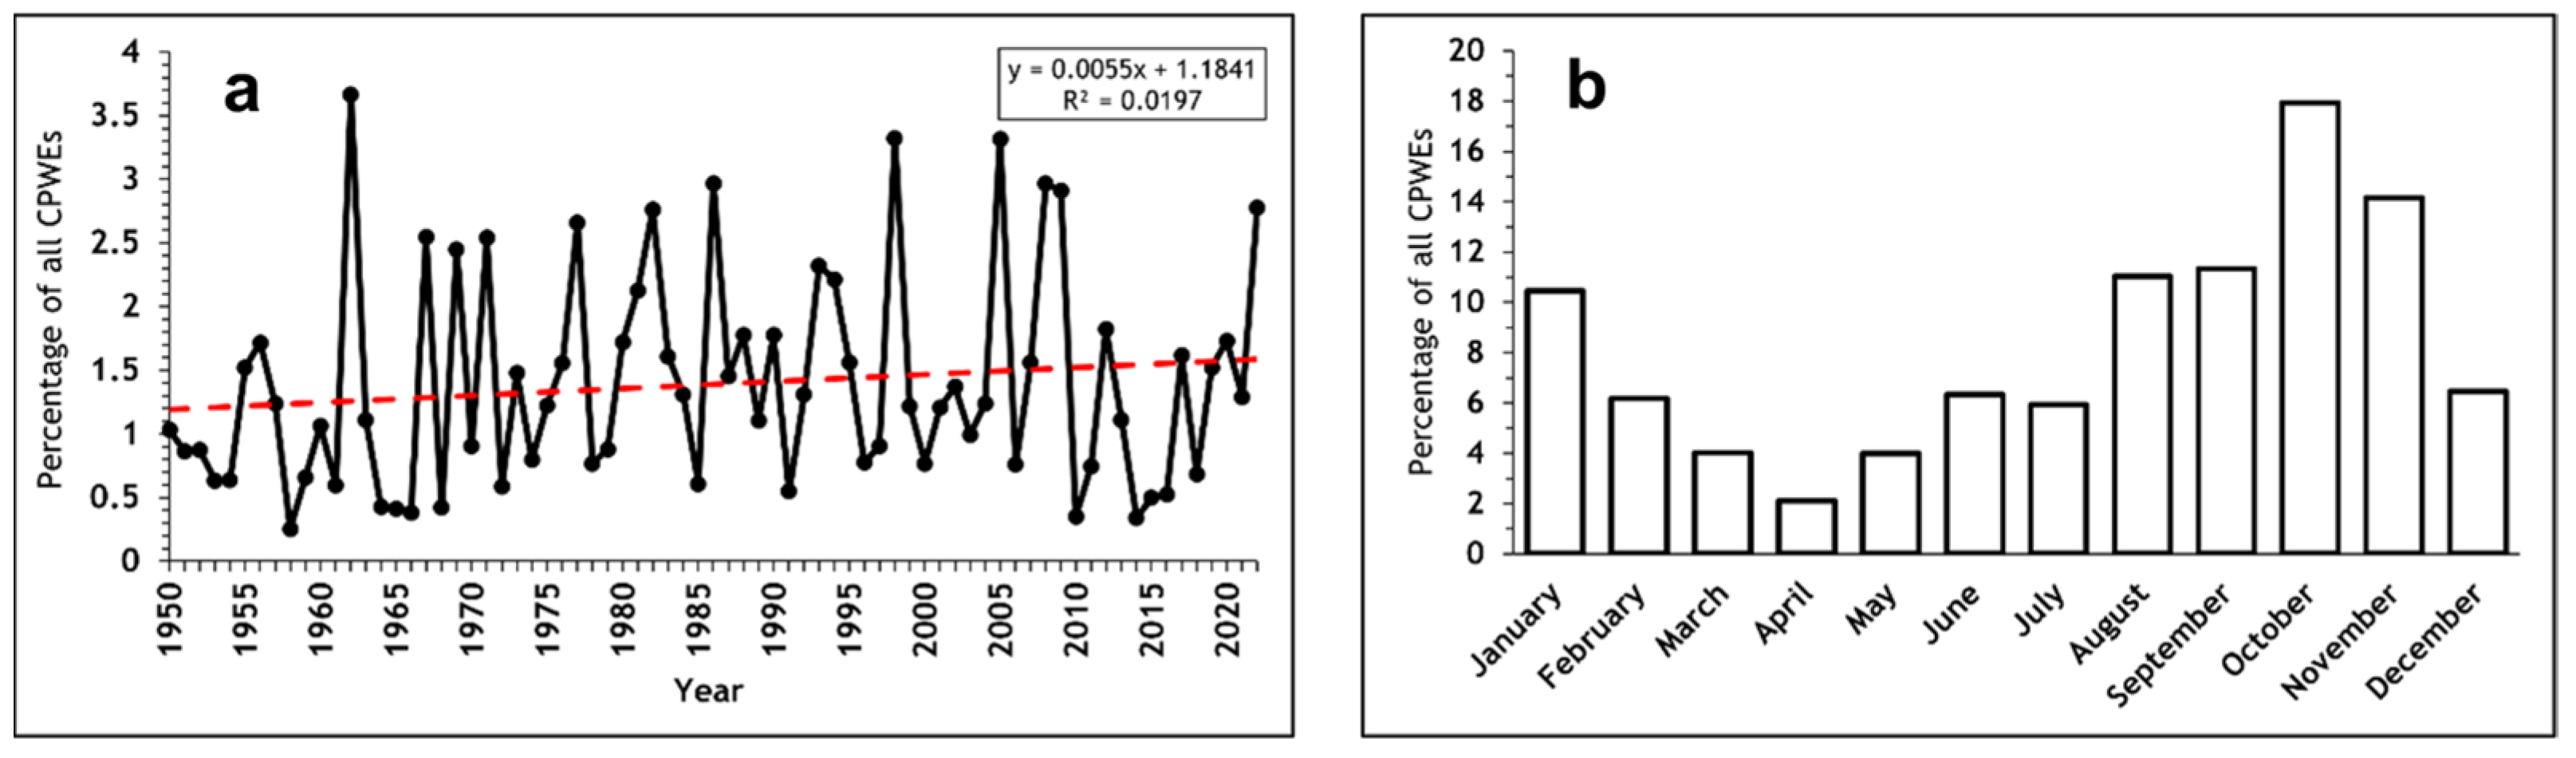
3.2. Compound Precipitation and Wind Extremes (CPWEs)

After evaluating the P and wmax extremes in each grid cell, CPWEs, cases where both extreme values coincided, were identified. The highest number of CPWEs, 3.7% of all cases, occurred in 1962 (Figure 3a). Over the 73-year study period, the number of such extremes in the eastern part of the Baltic Sea region slightly increased, but this change was not statistically significant. When examining the recurrence of CPWEs in different months, the highest occurrence (17.9%) was observed in October, while the lowest was in the spring months (Figure 3b).
An evaluation of CPWE recurrence within each grid cell of the study area revealed that over the entire study period, the highest frequency, 10–11 occurrences per decade, was recorded in western Lithuania (Figure 4a). A similar distribution was observed in winter, with most CPWEs occurring in the western and northeastern parts of the study area during this season (Figure 4b).
The lowest number of CPWEs (no more than 1.5 extremes per decade) was recorded during the spring months (MAM), with a relatively uniform spatial distribution across the study area (Figure 4c). In summer (JJA), the number of CPWEs increased, with the highest frequency (2–2.6 extremes per decade) observed in the southeastern and eastern parts of the study area, which are the furthest from the Baltic Sea (Figure 4d). In contrast, the spatial distribution of CPWEs during autumn (SON) was opposite to JJA. During this season, as well as over the entire study period, the highest number of CPWEs (5–6.5 extremes per decade) was recorded in western Lithuania (Figure 4e). Furthermore, when assessing all four seasons, 78% of the grid cells showed the highest frequency of CPWEs during SON.
The change in the number of compound precipitation and wind extremes (CPWEs) was also assessed in each grid cell by comparing their occurrence at the end of the study period (2003–2022) to the beginning (1950–1969). It was found that the number of CPWEs increased in 70.2% of the grid cells, while a decrease was observed in only 21.7%. The most significant increase, reaching up to 12 cases in individual grid cells, was identified in the southern and southwestern parts of the study area. However, statistically significant changes were detected in only 6.5% of the grid cells (Figure 5a). Across all four seasons, an increase in the number of CPWEs was observed (Figure 5b–e). However, statistically significant changes (p < 0.05) were identified in only a few grid points. The highest percentage of grid cells, with a statistically significant increase in CPWEs (4.8%), occurred during JJA. This season also showed the largest overall increase in CPWEs, with 65.5% of grid cells experiencing growth.
Notably, during DJF and SON, the most pronounced increases in CPWEs were concentrated in the northern part of the study area (Figure 5b,e). In contrast, during JJA, the largest growth was observed in the eastern and southern regions of the analysed territory (Figure 5c,d).
Days when, at least in one grid cell, a CPWE was recorded were also identified. A total of 797 such days were observed over the 73 years, with their frequency increasing over the investigation period (Figure 6a). The changes are statistically significant based on the Mann–Kendall test (p < 0.05). October recorded the highest share (14.8%) of all such days (Figure 6b).
In most cases, CPWEs were recorded on the same day in only one or a few grid cells. CPWEs were identified in more than one-fifth of the grid cells in the study area on only 44 days (6% of the days with at least one CPWE) and in more than half of the grid cells on just 3 days: 22 October 1971 (CPWEs recorded in 51.1% of the grid cells), 28 October 1998 (75.4% of the grid cells), and 14 October 2009 (57.4% of the grid cells).

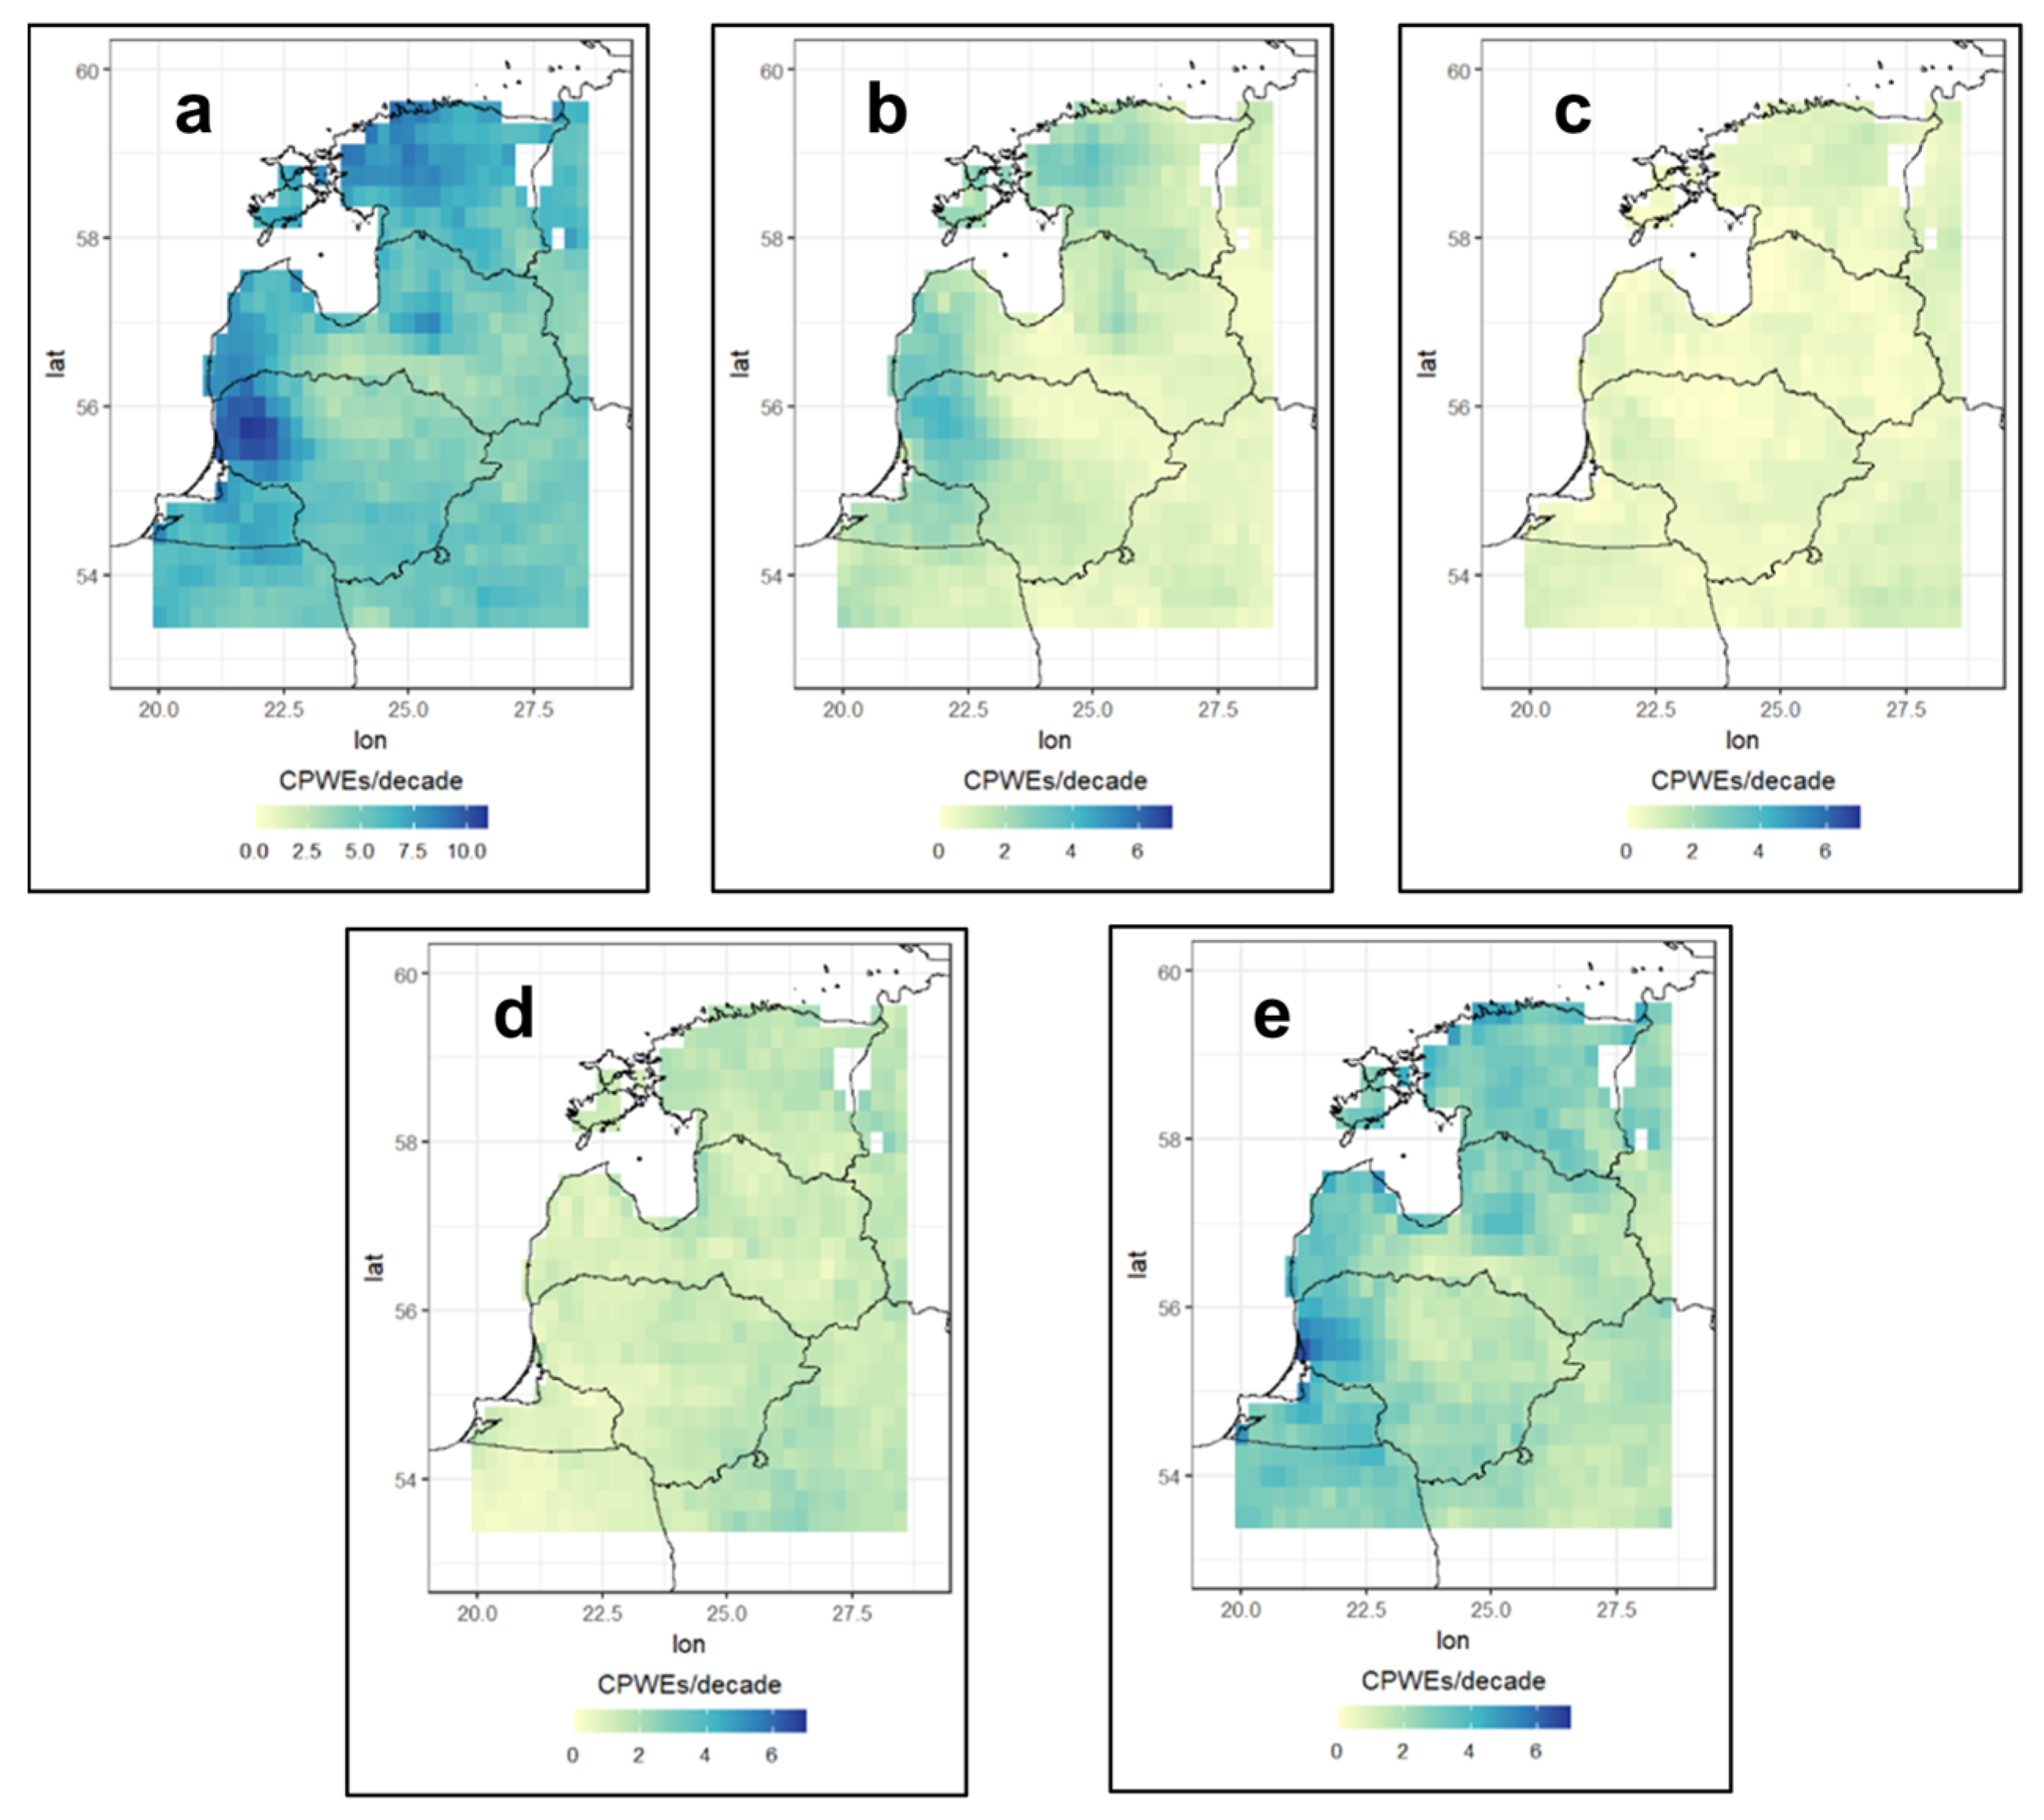
3.3. Intensity of CPWEs

By calculating the 99th and 99.9th percentile values of P and wmax, the CPWEs with the highest intensity were identified. Over the entire study period, the 99th percentile values of both variables were exceeded in 29.5% of all CPWEs. Meanwhile, CPWEs during which both P and wmax exceeded the 99.9th percentile values in the same grid cell accounted for 0.9% of all CPWEs. During these particularly intense CPWEs, the average daily precipitation amount was 46.7 mm, and the wmax averaged 26.5 m/s. Such severe CPWEs in at least one grid cell were recorded in only 11 days. All these days occurred in the second half of summer and the first ten days of September, as only during the summer months were precipitation amounts high enough to exceed the 99.9th percentile threshold.
However, during just four days, P and wmax both exceeded the 99.9th percentile values and severe CPWEs formed in more than 1% of the grid cells within the study area. These cases occurred on 6–7 August 1967, when intense CPWEs were observed in 5.8% of the grid cells; 7 August 1987 (10.2% of the grid cells); 28 July 1988 (4.3% of the grid cells); and 9–10 August 2005 (12.1% of the grid cells). These events were recorded in different locations within the analysed area (Figure 7).
The most intense CPWEs were observed during the summer (JJA). However, in many cases, they were localised and caused by mesoscale convection processes. In contrast, the CPWEs that covered the largest portion of the area were found during the autumn (SON). It was also determined that CPWEs with wmax values exceeding the 99.9th percentile most frequently occurred during the DJF and SON seasons, primarily in the southwestern and northern parts of the study area. In contrast, CPWEs with P values exceeding the 99.9th percentile showed opposite trends. Most of these cases (65.5%) occurred in JJA, mainly in the southeastern part of the study area.

3.4. Atmospheric Conditions Leading to the Formation of CPWEs

A total of 44 days were identified when CPWEs occurred in more than 1/5 of the study area, and 28 days were recorded during the cold season and 16 during the warm season. These specific days were selected for further analysis of the atmospheric conditions.
Different forcing to CPWEs mechanisms were found in the cold and warm half of the year. Most cold-season compound extremes appear to be forced by intensive mid-tropospheric zonal and only a few subzonal circulations over the southern part of Northern Europe. Such patterns of atmospheric circulation over Europe correspond to the WZ type of Hess–Brezowsky circulation, and only a few cases were identified as SWZ, WA, or NZ types (Table 1). During the cold season, CPWEs typically form due to rapidly developing frontal waves along the southern periphery of a deep depression over the Northeast Atlantic or North Sea region. Moreover, such atmospheric circulation patterns show a large persistence. This form is usually established not only on the day of the appearance of the CPWE but at least 3–5 days before it. Most of these developing waves caused deepening of local minima over the Baltic region, which is not typical for classic Atlantic cyclones moving eastward. However, this explains the increased pressure gradients in the rear of such cyclones well. Other important features of this type of atmospheric circulation are: (a) the clear zonal separation of cold and warm air masses over Central and/or Northern Europe and (b) the advection of moist air from the subtropical part of the North Atlantic through the British Isles, southern Scandinavia, and into the Baltic region (Figure 8a,b). The CPWE location in such cases has been predetermined by the proximity of the centre or, rarely, triple (occlusion) point of the fast-moving cyclone or the wave: the further north the trajectory of the developing cyclone, the more northerly the position of the CPWE and vice versa.
In the warm half of the year (April–September), the typical circulation patterns exhibit much greater diversity (Table 1). The common feature in most analysed compound extremes is the lower-than-normal pressure in the upper troposphere over Central or Eastern Europe or both. According to the Hess–Brezowsky classification, the TM, NZ, NWZ, HNZ, HNFZ, TRM, WS, BM, and HB types of circulation are capable of maintaining low pressure over Central Europe and further east while other types (HB, NWA, HFA) are capable of maintaining low pressure over Eastern Europe. The diversity of listed circulation types is very large; however, these types can be combined depending on the predominant blocking process (HNZ, HNFZ, HFA), cut-off-low (TM, HB, HM), slowly developing Rossby wave ridge (NWZ, NWA), or trough (WS, BM, TRM).
During the warm season’s CPWEs, all mentioned circulation types are related to southern-type cyclone development over the analysed region. In almost all warm season cases, the CPWE location appears to agree with the structure of these cyclones: the heaviest precipitation is almost always located on the cyclone’s forward (northern) side.
The composite analysis of all southern-type cyclone-related extremes revealed the high-pressure gradient area over the Baltic States, with pressure minima over eastern Latvia and Estonia and northwestern Russia (Figure 8c). At the same time, the temperature anomaly composition confirms typical large-scale temperature distribution in such cases: much colder than normal temperatures over the eastern part of Central Europe and higher than normal over the northern part of Eastern Europe (Figure 8d).
During the most intense warm season’s CPWEs, the prevailing circulation pattern in the study area, according to the Hess–Brezowsky classification, was northwesterly, northerly, or a high/low-pressure area over Central Europe. The highest average P value, reaching 35.5 mm, was recorded under northwesterly and northerly circulation. Meanwhile, the highest average wmax value (22.2 m/s) was observed during the dominance of a high/low-pressure area over Central Europe.
During the cold season, the formation of CPWEs was dominated by westerly (zonal) flow types. This circulation pattern also resulted in the highest average wmax value (22.6 m/s). Nevertheless, the highest average P value in the cold season, reaching 18.9 mm, was recorded in the study region under the dominance of a northwesterly and northerly circulation pattern similar to the warm season.

4. Discussion

From 1950 to 2022, the number of precipitation extremes increased in almost the entire study area. However, the observed changes were statistically significant only in a small part of it. The increase in the recurrence of precipitation extremes in recent decades has also been observed in various regions worldwide (e.g., the USA, China, and Central Europe) [52,53,54,55], as well as in the eastern part of the Baltic Sea region [26,28,31]. These changes are closely related to climate change. A study conducted in the Benelux countries found that, during the summer, the intensity of precipitation extremes increased by a factor of 1.2–9 compared with a climate that was 1.2 °C cooler [55]. Future projections suggest that the recurrence and intensity of precipitation extremes will continue to grow [27,55,56,57]. Similar trends are anticipated for the Baltic Sea region and Northern Europe [30,58].
While the number of wind extremes also increased across most of the study area during the research period, the changes are statistically significant in less than one-tenth of the study area. Similar trends, indicating minor changes in the recurrence of wind extremes, have been reported in other studies [59,60,61]. It has been found that the direction and magnitude of the changes are highly dependent on the selected study period and region [61]. Most of the extremes in northern Europe occurred during the last two decades of the 20th century, after which their frequency decreased [60,62]. Similar tendencies were observed in the eastern part of the Baltic Sea region during this study, with the highest frequency of extremes occurring in the 1990s. In the future, no significant changes in wind extremes are projected for either Europe or the Baltic Sea region [31,59,61].
The number of CPWEs also slightly increased in the eastern part of the Baltic Sea region. However, the observed changes were not significant (when p < 0.05). The low statistical power of the observed changes could be attributed to the high natural variability of CPWEs. No significant trends in the recurrence of such compound extremes were identified in other regions either [15,63,64]. An analysis of CPWE changes across the study area during 1950–1969 and 2003–2022 showed that the significant increase in the frequency of these compound extremes in the highest number of grid cells occurred during summer. Rising air temperatures lead to larger water vapour amounts in the atmosphere, intensifying convection processes [65,66,67], which, in turn, result in localised precipitation and wind speed extremes.
The number of CPWEs in the eastern part of the Baltic Sea region exhibited a meridional distribution, with their recurrence decreasing inland from the coast. The highest number of CPWEs was recorded in western Lithuania, which was influenced by two factors: the distance from the Baltic Sea and the terrain. Reduced surface friction and thermal contrasts enhance wind speeds and variability near coasts. Topography accelerates winds, intensifies turbulence, and enhances precipitation through orographic lifting, increasing precipitation amounts on windward slopes. Therefore, the likelihood of observing both extreme events simultaneously is higher in coastal areas and nearby highlands. Similar trends in the spatial distribution of CPWEs were identified in Central Europe [23]. Also, by calculating the Pearson correlation coefficient (r), a positive statistically significant relationship (when p < 0.05) was found between the number of CPWEs and altitude above sea level. Higher r values were observed during the cold season. More CPWEs were observed in areas dominated by precipitation extremes, indicating that precipitation, rather than wind, is the limiting factor for the spatial distribution of these compound extremes [12].
Analysis of the circulation conditions during CPWEs revealed that the factors influencing their formation differ between the cold (October–March) and warm (April–September) seasons. During the cold season, these compound extremes typically form under intense zonal flow from the west. This pattern has also been observed in other regions of Europe [7]. A study by Owen et al. (2021) [11] found that in Europe, during 70% of CPWEs, the cyclone centre was located within a radius of no less than 1100 kilometres from the CPWE formation site. In contrast, during the warm season in the eastern part of the Baltic Sea region, CPWEs predominantly formed when southern-type cyclones reached the region. Intense convection processes also drove local CPWE formation during this period. Such cyclones were more frequent, and convection processes were generally more intense in the eastern and southeastern parts of the study area. As a result of these differing factors, CPWEs were more frequently recorded in the western and northern parts of the study area during winter and autumn. In summer, they were more common in the eastern and southeastern parts.
The most intense CPWEs in the study area were recorded in the second part of summer. Such a tendency is uncommon in Western and Central Europe, where the strongest compound extremes typically occur during winter [24,41]. This pattern in the eastern part of the Baltic Sea region is closely linked to the activity of southern-type cyclones. These cyclones, originating from regions such as the southern Alps, the Balkans, the Mediterranean, the Black Sea, or even the Carpathians, and moving northward during the warm season, carry more moisture than their Atlantic counterparts. Their rapid development under the leading edge of an upper-level trough or low creates large surface-pressure gradients. Such cyclones were responsible for all four of the most intense CPWEs recorded during the investigation period. In recent decades, an increase in the intensity of these cyclones reaching Northern Europe and the Baltic States has also been found [68].
In the future, CPWEs are expected to increase. The most significant growth is projected in mid- and high-latitude regions [21,69], along coastal areas in North America, as well as in South and East Asia [20]. Nevertheless, the global increase in CPWEs is expected to be greater over the ocean than over land, where the projected increase in the recurrence of these compound extremes is not statistically significant [69]. A slight increase in CPWEs was also observed in this study. However, it is noted that during the period 1950–2022, this increase was more pronounced in the southern part of the study area.
The future increase in CPWEs is primarily linked to climate change, rising evaporation, more intense precipitation, and changes in tropical and extratropical cyclone trajectories [1,21]. For instance, it is projected that mid-latitude cyclones in Great Britain and Ireland will cause CPWEs 3.6 times more frequently, primarily driven by increasing precipitation intensity [70]. However, these compound extremes are characterised by high spatial and natural variability, with significant influences from other factors such as the terrain, land cover and its changes, and the ocean–atmosphere interaction [69]. These factors could explain why the changes observed during the study were not significant.
The number of deep, mid-latitude cyclones in the Baltic Sea region is expected to increase slightly. However, the reliability of these projections is low, as the magnitude of changes and shifts in cyclone trajectories will depend on the evolving temperature gradients between low and high latitudes [58]. Another critical factor influencing the recurrence and intensity of CPWEs in the eastern Baltic Sea region, as well as other regions, will be changes in the characteristics of storms generated by convective processes. Convective weather events in Europe are projected to become more frequent [71,72], and the recurrence of conditions favourable for convection is expected to increase by 5–20% for every 1 °C rise in global temperature, with the most significant growth anticipated in higher latitudes of the Northern Hemisphere [73]. These changes could lead to an increase in the number and intensity of summer CPWEs.
Several aspects should be considered when conducting further research on CPWEs in the eastern part of the Baltic Sea region. First, the reliability of ERA5 reanalysis data for precipitation and maximum wind speed varies across the study period and different seasons. As the number of data sources has increased during the 1950–2022 period, with more data being assimilated into reanalysis datasets, their accuracy has improved significantly in recent decades compared with the first part of the study period [61,74]. Additionally, it has been observed that ERA5 data in mid-latitudes for the two variables used in this study are more accurate during the winter months compared with summer. This is because ERA5 better simulates precipitation and wind extremes associated with mid-latitude cyclones than those caused by mesoscale convective systems, which are more typical in summer [36,57,75].
Another aspect to consider when interpreting the results of this study is the spatial resolution of the data grid, which is 0.25 × 0.25°. Such a spatial resolution is insufficient for accurately capturing localised CPWEs that occur during convective processes in summer [75,76]. Reanalysis data also provide grid cell averages, which may overlook the most extreme values occurring within a grid cell [35,77]. To assess the accuracy of ERA5 data, the number of CPWEs obtained using this reanalysis was compared with the number of compound extremes derived from data from several Lithuanian meteorological stations. It was found that the total number of CPWEs obtained using different data sources differed by no more than 10%. It is also important to note that ground-based observations create a different challenge. The obtained results effectively represent only CPWEs occurring at a specific location, and they are strongly influenced by local factors, thus failing to adequately reflect patterns across larger areas [61].

5. Conclusions

This study evaluated the recurrence, spatial distribution, intensity, and atmospheric conditions driving CPWEs in the eastern part of the Baltic Sea region. Changes in the recurrence of precipitation and wind speed extremes were also assessed. Between 1950 and 2022, their frequency increased, but statistically significant changes were observed in only 13.8% and 8.1% of the area, respectively. Comparing the beginning (1950–1969) and end (2003–2022) of the study period, CPWEs increased across most of the study area in all seasons. However, the changes were generally small, with statistically significant increases primarily observed in summer.
The main factors determining the spatial distribution of CPWEs are distance from the Baltic Sea and terrain. Due to these factors, the highest frequency of CPWEs (10–11 extremes per decade) was recorded in the western part of the study area. CPWEs also exhibit seasonal spatial patterns: in autumn and winter, they are most frequent in the western and northern parts, while in summer, they are concentrated in the east.
Such distribution results from differing synoptic conditions influencing CPWE formation. In the cold season (October–March), CPWEs are mainly associated with strong zonal flows from the west and rapidly developing frontal waves on the southern periphery of deep Atlantic cyclones. In the warm season (April–September), they are linked to southern-type cyclones entering the study region. Notably, these cyclones were responsible for the most intense CPWEs, typically occurring in late summer and early September.
In this study, using ERA5 reanalysis data, certain CWPEs that formed due to local processes (e.g., thermal convection) may not have been accounted for as a consequence of insufficient spatial resolution of the data (0.25 × 0.25°). To avoid this issue in future research, it would be advisable to use higher-spatial-resolution data and ground-based observations.

Author Contributions

Conceptualization, L.K., E.R., and G.S.; methodology, L.K, E.R., and G.S.; software, L.K.; formal analysis, L.K., E.R., and G.S.; investigation, L.K., E.R., and G.S.; resources, L.K., and G.S.; data curation, L.K.; writing—original draft preparation, L.K., E.R., and G.S.; visualization, L.K. All authors have read and agreed to the published version of the manuscript.

Funding

This research received no external funding.

Institutional Review Board Statement

Not applicable.

Informed Consent Statement

Not applicable.

Data Availability Statement

ERA5 data are available at the Copernicus Climate Data Store (https://doi.org/10.24381/cds.adbb2d47 (accessed on 25 February 2024)). Synoptic schemes and surface analysis charts from the German Weather Service and GFS analysis charts can be accessed at https://www.wetter3.de (accessed on 25 February 2024), UK MetOffice (UKMO) charts at https://www.wetterzentrale.de/ (accessed on 25 February 2024), and The Royal Netherlands Meteorological Institute (KNMI) charts at https://www.knmi.nl/ (accessed on 25 February 2024). The datasets generated during this study are available from the corresponding author upon request.

Conflicts of Interest

The authors declare no conflicts of interest.

References

  1. Seneviratne, S.I.; Zhang, X.; Adnan, M.; Badi, W.; Dereczynski, C.; Di Luca, A.; Ghosh, S.; Iskandar, I.; Kossin, J.; Lewis, S.; et al. Weather and Climate Extreme Events in a Changing Climate. In Climate Change 2021: The Physical Science Basis. Contribution of Working Group I to the Sixth Assessment Report of the Intergovernmental Panel on Climate Change; Cambridge University Press: Cambridge, UK, 2021. [Google Scholar] [CrossRef]
  2. Clarke, B.; Otto, F.; Stuart-Smith, R.; Harrington, L. Extreme weather impacts of climate change: An attribution perspective. Environ. Res. Clim. 2022, 1, 012001. [Google Scholar] [CrossRef]
  3. European Environment Agency Economic Losses from Weather- and Climate-Related Extremes in Europe. 2024. Available online: https://www.eea.europa.eu/en/analysis/indicators/economic-losses-from-climate-related (accessed on 14 January 2025).
  4. Seneviratne, S.I.; Nicholls, N.; Easterling, D.; Goodess, C.M.; Kanae, S.; Kossin, J.; Luo, Y.; Marengo, J.; Mc Innes, K.; Rahimi, M.; et al. Changes in climate extremes and their impacts on the natural physical environment. In Managing the Risks of Extreme Events and Disasters to Advance Climate Change Adaptation: Special Report of the Intergovernmental Panel on Climate Change; Cambridge University Press: Cambridge, UK, 2012; Volume 3, pp. 109–230. [Google Scholar] [CrossRef]
  5. Zscheischler, J.; Westra, S.; Van Den Hurk, B.J.J.M.; Seneviratne, S.I.; Ward, P.J.; Pitman, A.; Aghakouchak, A.; Bresch, D.N.; Leonard, M.; Wahl, T.; et al. Future climate risk from compound events. Nat. Clim. Change 2018, 8, 469–477. [Google Scholar] [CrossRef]
  6. Zscheischler, J.; Raymond, C.; Horton, R.M.; Ramos, A.M. A typology of compound weather. Nat. Rev. Earth Environ. 2020, 1, 333–347. [Google Scholar] [CrossRef]
  7. Martius, O.; Pfahl, S.; Chevalier, C. A global quantification of compound precipitation and wind extremes. Geophys. Res. Lett. 2016, 43, 7709–7717. [Google Scholar] [CrossRef]
  8. Li, D.; Chen, Y.; Messmer, M.; Zhu, Y.; Feng, J.; Yin, B.; Bevacqua, E. Compound Wind and Precipitation Extremes Across the Indo-Pacific: Climatology, Variability, and Drivers. Geophys. Res. Lett. 2022, 49, e2022GL098594. [Google Scholar] [CrossRef]
  9. Xoplaki, E.; Ellsäßer, F.; Grieger, J.; Nissen, K.M.; Pinto, J.G.; Chen, T.-C.; Feldmann, H.; Friederichs, P.; Gliksman, D.; Haustein, K.; et al. Compound events in Germany in 2018: Drivers and case studies. EGUsphere 2023, 1–43. [Google Scholar] [CrossRef]
  10. Plavcová, E.; Urban, A. Intensified impacts on mortality due to compound winter extremes in the Czech Republic. Sci. Total Environ. 2020, 746, 141033. [Google Scholar] [CrossRef]
  11. Owen, L.E.; Catto, J.L.; Stephenson, D.B.; Dunstone, N.J. Compound precipitation and wind extremes over Europe and their relationship to extratropical cyclones. Weather Clim. Extrem. 2021, 33, 100342. [Google Scholar] [CrossRef]
  12. Messmer, M.; Simmonds, I. Global analysis of cyclone-induced compound precipitation and wind extreme events. Weather Clim. Extrem. 2021, 32, 100324. [Google Scholar] [CrossRef]
  13. Ridder, N.N.; Ukkola, A.M.; Pitman, A.J.; Perkins-Kirkpatrick, S.E. Increased occurrence of high impact compound events under climate change. Npj Clim. Atmos. Sci. 2022, 5, 3. [Google Scholar] [CrossRef]
  14. Alvarez, I.; Pereira, H.; Picado, A.; Sousa, M.C.; Lorenzo, M.N.; Dias, J.M. Projection of Compound Wind and Precipitation Extreme Events in the Iberian Peninsula Based on CMIP6. Earth Syst. Environ. 2024, 8, 801–814. [Google Scholar] [CrossRef]
  15. Johansson, E. Compound Extreme Wind and Precipitation Events in Europe. Bachelor’s Thesis, Uppsala University, Uppsala, Sweden, 2021. Available online: https://urn.kb.se/resolve?urn=urn:nbn:se:uu:diva-446009 (accessed on 25 February 2024).
  16. Ridder, N.N.; Pitman, A.J.; Ukkola, A.M. High impact compound events in Australia. Weather. Clim. Extrem. 2022, 36, 100457. [Google Scholar] [CrossRef]
  17. Tilloy, A.; Malamud, B.D.; Joly-Laugel, A. A methodology for the spatiotemporal identification of compound hazards: Wind and precipitation extremes in Great Britain (1979–2019). Earth Syst. Dyn. 2022, 13, 993–1020. [Google Scholar] [CrossRef]
  18. Zscheischler, J.; Naveau, P.; Martius, O.; Engelke, S.; C. Raible, C. Evaluating the dependence structure of compound precipitation and wind speed extremes. Earth Syst. Dyn. 2021, 12, 1–16. [Google Scholar] [CrossRef]
  19. Catto, J.L.; Dowdy, A. Understanding compound hazards from a weather system perspective. Weather Clim. Extrem. 2021, 32, 100313. [Google Scholar] [CrossRef]
  20. Yaddanapudi, R.; Mishra, A.; Huang, W.; Chowdhary, H. Compound Wind and Precipitation Extremes in Global Coastal Regions Under Climate Change. Geophys. Res. Lett. 2022, 49, e2022GL098974. [Google Scholar] [CrossRef]
  21. Li, D.; Zscheischler, J.; Chen, Y.; Yin, B.; Feng, J.; Freund, M.; Qi, J.; Zhu, Y.; Bevacqua, E. Intensification and Poleward Shift of Compound Wind and Precipitation Extremes in a Warmer Climate. Geophys. Res. Lett. 2024, 51, e2024GL110135. [Google Scholar] [CrossRef]
  22. Messori, G.; Caballero, R. On double Rossby wave breaking in the North Atlantic. J. Geophys. Res. Atmos. 2015, 120, 11,129–11,150. [Google Scholar] [CrossRef]
  23. Müller, M.; Kašpar, M.; Bližňák, V. Central European wind and precipitation compound events are not just due to winter storms. Nat. Hazards Earth Syst. Sci. 2022, 1–19. [Google Scholar] [CrossRef]
  24. De Luca, P.; Messori, G.; Pons FM, E.; Faranda, D. Dynamical systems theory sheds new light on compound climate extremes in Europe and Eastern North America. Q. J. R. Meteorol. Soc. 2020, 146, 1636–1650. [Google Scholar] [CrossRef]
  25. Leeding, R.; Riboldi, J.; Messori, G. On Pan-Atlantic cold, wet and windy compound extremes. Weather Clim. Extrem. 2023, 39, 100524. [Google Scholar] [CrossRef]
  26. Avotniece, Z.; Klavins, M.; Rodinovs, V. Changes of extreme climate events in Latvia. Environ. Clim. Technol. 2012, 9, 4–11. [Google Scholar] [CrossRef]
  27. Cardell, M.F.; Amengual, A.; Romero, R.; Ramis, C. Future extremes of temperature and precipitation in Europe derived from a combination of dynamical and statistical approaches. Int. J. Climatol. 2020, 40, 4800–4827. [Google Scholar] [CrossRef]
  28. Dyrrdal, A.V.; Olsson, J.; Médus, E.; Arnbjerg-Nielsen, K.; Post, P.; Aņiskeviča, S.; Thorndahl, S.; Førland, E.; Wern, L.; Mačiulytė, V.; et al. Observed changes in heavy daily precipitation over the Nordic-Baltic region. J. Hydrol. Reg. Stud. 2021, 38, 100965. [Google Scholar] [CrossRef]
  29. Lizuma, L.; Briede, A.; Klavins, M. Long-term changes of precipitation in Latvia. Hydrol. Res. 2010, 41, 241–252. [Google Scholar] [CrossRef]
  30. Nikulin, G.; Kjellström, E.; Hansson, U.; Strandberg, G.; Ullerstig, A. Evaluation and future projections of temperature, precipitation and wind extremes over Europe in an ensemble of regional climate simulations. Tellus Ser. A Dyn. Meteorol. Oceanogr. 2011, 63, 41–55. [Google Scholar] [CrossRef]
  31. Ramanauskas, E.; Bukantis, A.; Dringelis, L.; Kaveckis, G.; Jonkutė-Vilkė, G. Climate Change and Cities of Lithuania: Threats, Problems and Prerequisites for Solution. Urban Sci. 2024, 8, 186. [Google Scholar] [CrossRef]
  32. Kottek, M.; Grieser, J.; Beck, C.; Rudolf, B.; Rubel, F. World map of the Köppen-Geiger climate classification updated. Meteorol. Z. 2006, 15, 259–263. [Google Scholar] [CrossRef]
  33. Peel, M.C.; Finlayson, B.L.; McMahon, T.A. Updated world map of the Köppen-Geiger climate classification. Hydrol. Earth Syst. Sci. 2007, 11, 1633–1644. [Google Scholar] [CrossRef]
  34. Hersbach, H.; Bell, B.; Berrisford, P.; Hirahara, S.; Horányi, A.; Muñoz-Sabater, J.; Nicolas, J.; Peubey, C.; Radu, R.; Schepers, D.; et al. The ERA5 global reanalysis. Q. J. R. Meteorol. Soc. 2020, 146, 1999–2049. [Google Scholar] [CrossRef]
  35. Laurila, T.K. Winds and Windstorms in Northern Europe and Finland. Ph.D. Thesis, University of Helsinki, Helsinki, Finland, 2022. [Google Scholar] [CrossRef]
  36. Lavers, D.A.; Simmons, A.; Vamborg, F.; Rodwell, M.J. An evaluation of ERA5 precipitation for climate monitoring. Q. J. R. Meteorol. Soc. 2022, 148, 3152–3165. [Google Scholar] [CrossRef]
  37. Minola, L.; Zhang, F.; Azorin-Molina, C.; Pirooz, A.A.S.; Flay, R.G.J.; Hersbach, H.; Chen, D. Near-surface mean and gust wind speeds in ERA5 across Sweden: Towards an improved gust parametrization. Clim. Dyn. 2020, 55, 887–907. [Google Scholar] [CrossRef]
  38. Hassler, B.; Lauer, A. Comparison of reanalysis and observational precipitation datasets including ERA5 and WFDE5. Atmosphere 2021, 12, 1462. [Google Scholar] [CrossRef]
  39. Wu, L.; Su, H.; Zeng, X.; Posselt, D.J.; Wong, S.; Chen, S.; Stoffelen, A. Uncertainty of Atmospheric Winds in Three Widely Used Global Reanalysis Datasets. J. Appl. Meteorol. Climatol. 2024, 63, 165–180. [Google Scholar] [CrossRef]
  40. Zhang, X.; Alexander, L.; Hegerl, G.C.; Jones, P.; Tank, A.K.; Peterson, T.C.; Trewin, B.; Zwiers, F.W. Indices for monitoring changes in extremes based on daily temperature and precipitation data. Wiley Interdiscip. Rev. Clim. Change 2011, 2, 851–870. [Google Scholar] [CrossRef]
  41. Ridder, N.N.; Pitman, A.J.; Westra, S.; Ukkola, A.; Do, H.X.; Bador, M.; Hirsch, A.L.; Evans, J.P.; Di Luca, A.; Zscheischler, J. Global hotspots for the occurrence of compound events. Nat. Commun. 2020, 11, 15. [Google Scholar] [CrossRef]
  42. Bevacqua, E.; Vousdoukas, M.I.; Zappa, G.; Hodges, K.; Shepherd, T.G.; Maraun, D.; Mentaschi, L.; Feyen, L. More meteorological events that drive compound coastal flooding are projected under climate change. Commun. Earth Environ. 2020, 1, 1–11. [Google Scholar] [CrossRef]
  43. Lücke, L.J.; Dent, C.J.; Hegerl, G.C.; Wilson, A.L.; Schurer, A.P. Severe compound events of low wind and cold temperature for the British power system. Meteorol. Appl. 2024, 31, 1–22. [Google Scholar] [CrossRef]
  44. Ranjan, R.; Karmakar, S. Compound hazard mapping for tropical cyclone-induced concurrent wind and rainfall extremes over India. Npj Nat. Hazards 2024, 1, 1–12. [Google Scholar] [CrossRef]
  45. Sanuy, M.; Rigo, T.; Jiménez, J.A.; Llasat, M.C. Classifying compound coastal storm and heavy rainfall events in the north-western Spanish Mediterranean. Hydrol. Earth Syst. Sci. 2021, 25, 3759–3781. [Google Scholar] [CrossRef]
  46. James, P.M. An Objective Classification Method for Hess and Brezowsky Grosswetterlagen over Europe. Theor. Appl. Climatol. 2007, 88, 17–42. [Google Scholar] [CrossRef]
  47. Gerstengarbe, F.; Werner, P. Katalog der Großwetterlagen Europas (1881–2004). In Nach Paul Hess und Helmuth Brezowsky—6. Verbesserte und Ergänzte Auflage; PIK Report 100; Potsdam Institute For Climate Impact Research (PIK): Potsdam, Germany, 2005. [Google Scholar]
  48. Kučerová, M.; Beck, C.; Philipp, A.; Huth, R. Trends in frequency and persistence of atmospheric circulation types over Europe derived from a multitude of classifications. Int. J. Clim. 2017, 37, 2502–2521. [Google Scholar] [CrossRef]
  49. Rimkus, E.; Kažys, J.; Butkutė, S.; Gečaitė, I. Snow cover variability in Lithuania over the last 50 years and its relationship with large-scale atmospheric circulation. Boreal Environ. Res. 2014, 19, 337–357. [Google Scholar]
  50. Quénol, H.; Corgne, S.; Planchon, O. Assessing Precipitation and Large-Scale Weather Situations in Brittany: The Usefulness of the Hess-Brezowsky Classification. Die Erde 2009, 140, 195–217. [Google Scholar]
  51. Werner, P.C. Katalog der Großwetterlagen Europas (1881–2009). In Nach Paul Hess und Helmut Brezowsky; Potsdam Institute for Climate Impact Research (PIK): Potsdam, Germany, 2010. [Google Scholar]
  52. Hänsel, S.; Hoy, A.; Brendel, C.; Maugeri, M. Record summers in Europe: Variations in drought and heavy precipitation during 1901–2018. Int. J. Climatol. 2022, 42, 6235–6257. [Google Scholar] [CrossRef]
  53. Li, X.; Zhang, K.; Gu, P.; Feng, H.; Yin, Y.; Chen, W.; Cheng, B. Changes in precipitation extremes in the Yangtze River Basin during 1960–2019 and the association with global warming, ENSO, and local effects. Sci. Total Environ. 2021, 760, 144244. [Google Scholar] [CrossRef]
  54. Prein, A.F.; Rasmussen, R.M.; Ikeda, K.; Liu, C.; Clark, M.P.; Holland, G.J. The future intensification of hourly precipitation extremes. Nat. Clim. Change 2017, 7, 48–52. [Google Scholar] [CrossRef]
  55. Tradowsky, J.S.; Philip, S.Y.; Kreienkamp, F.; Kew, S.F.; Lorenz, P.; Arrighi, J.; Bettmann, T.; Caluwaerts, S.; Chan, S.C.; De Cruz, L.; et al. Attribution of the heavy rainfall events leading to severe flooding in Western Europe during July 2021. Clim. Change 2023, 176, 90. [Google Scholar] [CrossRef]
  56. Rajczak, J.; Schär, C. Projections of Future Precipitation Extremes Over Europe: A Multimodel Assessment of Climate Simulations. J. Geophys. Res. Atmos. 2017, 122, 10,773–10,800. [Google Scholar] [CrossRef]
  57. O’Gorman, P.A. Precipitation Extremes Under Climate Change. Curr. Clim. Change Rep. 2015, 1, 49–59. [Google Scholar] [CrossRef]
  58. Rutgersson, A.; Kjellström, E.; Haapala, J.; Stendel, M.; Danilovich, I.; Drews, M.; Jylhä, K.; Kujala, P.; Larsén, X.G.; Halsnæs, K.; et al. Natural hazards and extreme events in the Baltic Sea region. Earth Syst. Dyn. 2022, 13, 251–301. [Google Scholar] [CrossRef]
  59. Kumar, D.; Mishra, V.; Ganguly, A.R. Evaluating wind extremes in CMIP5 climate models. Clim. Dyn. 2015, 45, 441–453. [Google Scholar] [CrossRef]
  60. Laurila, T.K.; Sinclair, V.A.; Gregow, H. Climatology, variability, and trends in near-surface wind speeds over the North Atlantic and Europe during 1979–2018 based on ERA5. Int. J. Climatol. 2021, 41, 2253–2278. [Google Scholar] [CrossRef]
  61. Meier, H.E.M.; Kniebusch, M.; Dieterich, C.; Gröger, M.; Zorita, E.; Elmgren, R.; Myrberg, K.; Ahola, M.P.; Bartosova, A.; Bonsdorff, E.; et al. Climate change in the Baltic Sea region: A summary. Earth Syst. Dyn. 2022, 13, 457–593. [Google Scholar] [CrossRef]
  62. Pryor, S.C.; Barthelmie, R.J.; Clausen, N.E.; Drews, M.; MacKellar, N.; Kjellström, E. Analyses of possible changes in intense and extreme wind speeds over northern Europe under climate change scenarios. Clim. Dyn. 2012, 38, 189–208. [Google Scholar] [CrossRef]
  63. He, W.; Chen, X.; Zhang, Y.; Duan, W.; Deng, H. Spatio-temporal variations of compound precipitation and wind-speed extreme events in Fujian and Jiangxi Provinces, Southeast China. Meteorol. Atmos. Phys. 2025, 137, 7. [Google Scholar] [CrossRef]
  64. Hénin, R.; Ramos, A.M.; Pinto, J.G.; Liberato, M.L.R. A ranking of concurrent precipitation and wind events for the Iberian Peninsula. Int. J. Climatol. 2021, 41, 1421–1437. [Google Scholar] [CrossRef]
  65. Kendon, E.; Roberts, N.; Fowler, H.; Roberts, M.; Chan, S.; Senior, C. Heavier summer downpours with climate change revealed by weather forecast resolution model. Nat. Clim. Change 2014, 4, 570–576. [Google Scholar] [CrossRef]
  66. Taszarek, M.; Allen, J.T.; Brooks, H.E.; Pilguj, N.; Czernecki, B. Differing Trends in United States and European Severe Thunderstorm Environments in a Warming Climate. Bull. Amer. Meteor. Soc. 2021, 102, E296–E322. [Google Scholar] [CrossRef]
  67. Ye, H.; Fetzer, E.J.; Wong, S.; Lambrigtsen, B.H. Rapid decadal convective precipitation increase over Eurasia during the last three decades of the 20th century. Sci. Adv. 2017, 3, e1600944. [Google Scholar] [CrossRef]
  68. Mändla, K.; Jaagus, J.; Sepp, M. Climatology of cyclones with southern origin in northern Europe during 1948–2010. Theor. Appl. Climatol. 2015, 120, 75–86. [Google Scholar] [CrossRef]
  69. Zhu, X.; Tang, J.; Yang, Y. Assessment and Projection of Compound Wind and Precipitation Extremes in EC-Earth3 of CMIP6 Simulations. Asia-Pac. J. Atmos. Sci. 2024, 60, 81–93. [Google Scholar] [CrossRef]
  70. Manning, C.; Kendon, E.J.; Fowler, H.J.; Catto, J.L.; Chan, S.C.; Sansom, P.G. Compound wind and rainfall extremes: Drivers and future changes over the UK and Ireland. Weather. Clim. Extrem. 2024, 44, 100673. [Google Scholar] [CrossRef]
  71. Rädler, A.T.; Groenemeijer, P.H.; Faust, E.; Sausen, R.; Púčik, T. Frequency of severe thunderstorms across Europe expected to increase in the 21st century due to rising instability. Npj Clim. Atmos. Sci. 2019, 2, 3–7. [Google Scholar] [CrossRef]
  72. Tippett, M.K.; Allen, J.T.; Gensini, V.A.; Brooks, H.E. Climate and Hazardous Convective Weather. Curr. Clim. Change Rep. 2015, 1, 60–73. [Google Scholar] [CrossRef]
  73. Lepore, C.; Abernathey, R.; Henderson, N.; Allen, J.T.; Tippett, M.K. Future Global Convective Environments in CMIP6 Models. Earth’s Future 2021, 9, 1–21. [Google Scholar] [CrossRef]
  74. Soci, C.; Hersbach, H.; Simmons, A.; Poli, P.; Bell, B.; Berrisford, P.; Horányi, A.; Muñoz-Sabater, J.; Nicolas, J.; Radu, R.; et al. The ERA5 global reanalysis from 1940 to 2022. Q. J. R. Meteorol. Soc. 2024, 150, 4014–4048. [Google Scholar] [CrossRef]
  75. Chen, T.C.; Collet, F.; Di Luca, A. Evaluation of ERA5 precipitation and 10-m wind speed associated with extratropical cyclones using station data over North America. Int. J. Climatol. 2024, 44, 729–747. [Google Scholar] [CrossRef]
  76. Gaska, J. Climate change and windstorm losses in Poland in the twenty-first century. Environ. Hazards 2023, 22, 99–115. [Google Scholar] [CrossRef]
  77. Hersbach, H.; Bell, B.; Berrisford, P.; Biavati, G.; Horányi, A.; Muñoz Sabater, J.; Nicolas, J.; Peubey, C.; Radu, R.; Rozum, I.; et al. ERA5 Hourly Data on Single Levels from 1940 to Present; Copernicus Climate Change Service (C3S); Climate Data Store (CDS): Brussels, Belgium, 2023. [Google Scholar] [CrossRef]
Figure 1. Study area and its topography (elevation above sea level).
Atmosphere 16 00276 g001
Figure 2. The 98th percentile values of daily precipitation (a) and maximum wind speed (b) in the study area for the entire 1950–2022 period. Decadal changes in the number of daily precipitation (c) and maximum wind speed (d) extremes in the study area. Grid cells with statistically significant changes, according to the Mann–Kendall test (p < 0.05), are marked with dots.
Atmosphere 16 00276 g002
Figure 3. (a) The percentage of CPWEs identified annually over the 1950–2022 period, with the red dashed line indicating the trend. (b) The percentage of CPWEs identified during each month of the year.
Atmosphere 16 00276 g003
Figure 4. The number of CPWEs per decade: (a) annually; (b) December–February (DJF); (c) March–May (MAM); (d) June–August (JJA); (e) September–November (SON).
Atmosphere 16 00276 g004
Figure 5. Change in the number of CPWEs between the 2003–2022 and 1950–1969 periods for each grid cell: (a) annually; (b) December–February (DJF); (c) March–May (MAM); (d) June–August (JJA); (e) September–November (SON). Grid cells with statistically significant changes based on the t-test (p < 0.05) are marked with dots.
Atmosphere 16 00276 g005
Figure 6. (a) Dynamics of the number of days with CPWEs from 1950 to 2022. The red dashed line represents the trend. (b) Distribution of the number of days with CPWEs throughout the year.
Atmosphere 16 00276 g006
Figure 7. The part of the study area (in blue colour) where the most intense CPWEs (above the 99.9th percentile) were recorded: (a) 6–7 August 1967; (b) 7 August 1987; (c) 28 July 1988; (d) 9–10 August 2005.
Atmosphere 16 00276 g007
Figure 8. Composite analysis of the CPWEs in the cold (October–March) (a,b) and the warm (April–September) (c,d) half of the year: (a,c) sea level pressure (hPa) and (b,d) temperature anomaly (cC) at the 850 hPa level. Anomalies were calculated according to 1991–2020 daily smoothed climatology.
Atmosphere 16 00276 g008
Table 1. The recurrence of different circulation types (% of the days when CPWEs covered > 20% of the study area) derived according to the Hess–Brezowsky classification during CPWE formation in the cold and warm seasons. D0 represents the day of CPWE formation, D − 2 and D − 1 represent two and one day before, respectively, and D + 1 represents one day after the CPWE formation date.
Circulation PatternTypeCold Season
(October–March)
Warm Season
(April–September)
D − 2D − 1D0D + 1D − 2D − 1D0D + 1
Zonal (westerly)WA, WZ, WS, WW57.160.760.767.918.818.818.837.5
SoutherlySWA, SWZ, SA, SZ, TB, TRW, SEA, SEZ17.917.914.37.112.56.36.36.3
Northwesterly and northerlyNWA, NWZ, NA, NZ, HNA, HNZ, HB, TRM14.310.721.417.943.843.831.318.8
Northeasterly and easterlyNEA, NEZ, HFA, HFZ, HNFA, HNFZ00006.312.512.512.5
High/low-pressure area over Central EuropeHM, TM, BM10.710.73.67.118.818.831.325.0
Disclaimer/Publisher’s Note: The statements, opinions and data contained in all publications are solely those of the individual author(s) and contributor(s) and not of MDPI and/or the editor(s). MDPI and/or the editor(s) disclaim responsibility for any injury to people or property resulting from any ideas, methods, instructions or products referred to in the content.

