Article

Low-Cost Pollen and Allergy Symptoms Monitoring with Beenose Sampler and Livepollen App: The Case Study of the Metz City, France, During Spring 2023

by
Jean-Baptiste Renard
1,*,
Sébastien Lefèvre
2 and
Gaëlle Glévarec
3
1
LPC2E-CNRS, 45000 Orléans, France
2
Institut Régional des pathologies Allergologiques, Environnementales et Immunologie Clinique—CHR Metz Thionville, 57000 Metz, France
3
UR 2106 Biomolécules et Biotechnologies Végétales, Université de Tours, 37000 Tours, France
*
Author to whom correspondence should be addressed.
Atmosphere 2025, 16(3), 271; https://doi.org/10.3390/atmos16030271
Submission received: 14 January 2025 / Revised: 19 February 2025 / Accepted: 21 February 2025 / Published: 25 February 2025
(This article belongs to the Special Issue Cutting-Edge Developments in Air Quality and Health)

Abstract

:
The increasing prevalence of pollen allergies and their health impact, coupled with the limitations of the current pollen measurement system, require the development of new monitoring strategies and better dissemination of the information to the population. The measurements of a Beenose real-time pollen sensor located in Pouilly, near Metz (France), and a Hirst reference station in the centre of Metz, are considered for the study of the most allergenic species from 20 March to 25 June 2023, mainly Betulaceae and grass. These measurements, which are concordant, are correlated to symptom data obtained from the LivePollen app, which allows users to voluntarily report their allergic symptoms. Strong correlations are found between the symptom reports and the pollen concentrations shifted by one day, depending on the pollen species and the period of interest. The limitations of the data collection methods, the quality of user reports, and the influence of air quality are discussed. Such studies should be extended to other locations and time periods. Considering these promising first results, it seems that future real-time pollen monitoring can help allergy sufferers and healthcare professionals to better diagnose, anticipate, and reduce allergic crises by correlating their symptoms with pollen peaks.

1. Introduction

Allergies, particularly pollen allergies, are a growing public health issue. The prevalence of allergic rhinitis has increased in France from 4% in the 1970s to more than 30% nowadays [1,2], which has significant health impacts, as well as social and economic impacts [1,3,4,5,6,7,8,9,10]. Allergic rhinitis is associated with comorbidities such as asthma [11,12] and is known to alter life quality, by causing, for example, sleep disorders [13], or by impacting academic success for children [14], and productivity at work for adults [6]. The costs associated with allergic rhinitis are high, aggregating direct costs (medical care) and indirect costs as presenteeism, loss of productivity, and absenteeism [4,15]. The costs related to asthma are also high, especially since the mortality rate due to this condition remains above 900 deaths per year in France and generates significant emergency hospital visits for asthma attacks [16].
Given these major impacts, the dissemination of high-quality pollen forecasts is fundamental to the implementation of effective prevention strategies. The strategies include taking an anti-allergy treatment at the most appropriate time to limit the onset of symptoms and adapting daily life behaviour to limit exposure to pollen [17]. Pollen forecast is currently based on measurements taken with Hirst-type sensors [18,19,20], which require a manual pollen recognition procedure and, therefore, have certain limitations, particularly in terms of spatial and temporal resolution. For example, the French territory is covered by fewer than 80 Hirst-type devices, and the data are generally available with a one-week delay. This delay is too long since the allergy crisis can start very shortly after the first pollen emission. Also, the pollen sources are not uniformly distributed, so the allergic response can strongly vary depending on the location of the allergic people.
To tentatively and partly address these issues, several automatic sensors have been developed using different techniques in order to improve the frequency of data provision [19,21,22,23,24,25,26,27], including the Beenose sensor [22] used in this study, which provides real-time pollen concentrations. This sensor is characterized by its reasonable cost and small size, allowing the deployment of sensor networks in different population areas. An initial experiment was conducted in the Brussels region, Belgium, in 2022–2023, showing significant variation in pollen concentrations depending on the sensor’s distance to the sources and its elevation [28]. These variations in concentrations can reach a factor of 10 over no more than a few kilometres apart.
The allergic response to pollen exposure is not necessarily immediate. Also, in the context of climate change and rising atmospheric carbon dioxide, the allergenicity of pollen from certain species may be modified, calling for increased monitoring of symptomatology. In particular, French doctors are observing a rising trend in the severity of pollen-induced allergic rhinitis, an increase in cases of conjunctivitis and asthma, and a growing demand for medical care [29]. The relationship between allergen concentrations and clinical responses is sometimes difficult to interpret because of the time lag between pollen concentrations and the onset of symptoms, the succession of pollination periods for different allergenic plants, the presence of fungal aeroallergens and the frequent multi-sensitization of individuals [30,31,32]. Some studies point out the existence of a dose–response relationship between pollen exposure and health impacts [33,34,35]. This dose–response relationship could indicate the existence of a minimum threshold for triggering symptoms, a linear relationship for intermediate pollen concentrations, and a maximum above which symptoms no longer increase. Nevertheless, recent EPOCHAL (Effect of Pollen on Cardiorespiratory Health and Allergies) study studies found no evidence of an exposure threshold below which no symptoms occur [36].
In order to gain a better understanding of this complex relationship, the analysis presented here aims to quantitatively study the links between pollen concentrations measured by the Beenose sensor and the Hirst sensor installed in Metz (France) during one field campaign, and the real-life symptom reports of allergy sufferers using the LivePollen app in a given area.

2. Materials and Methods

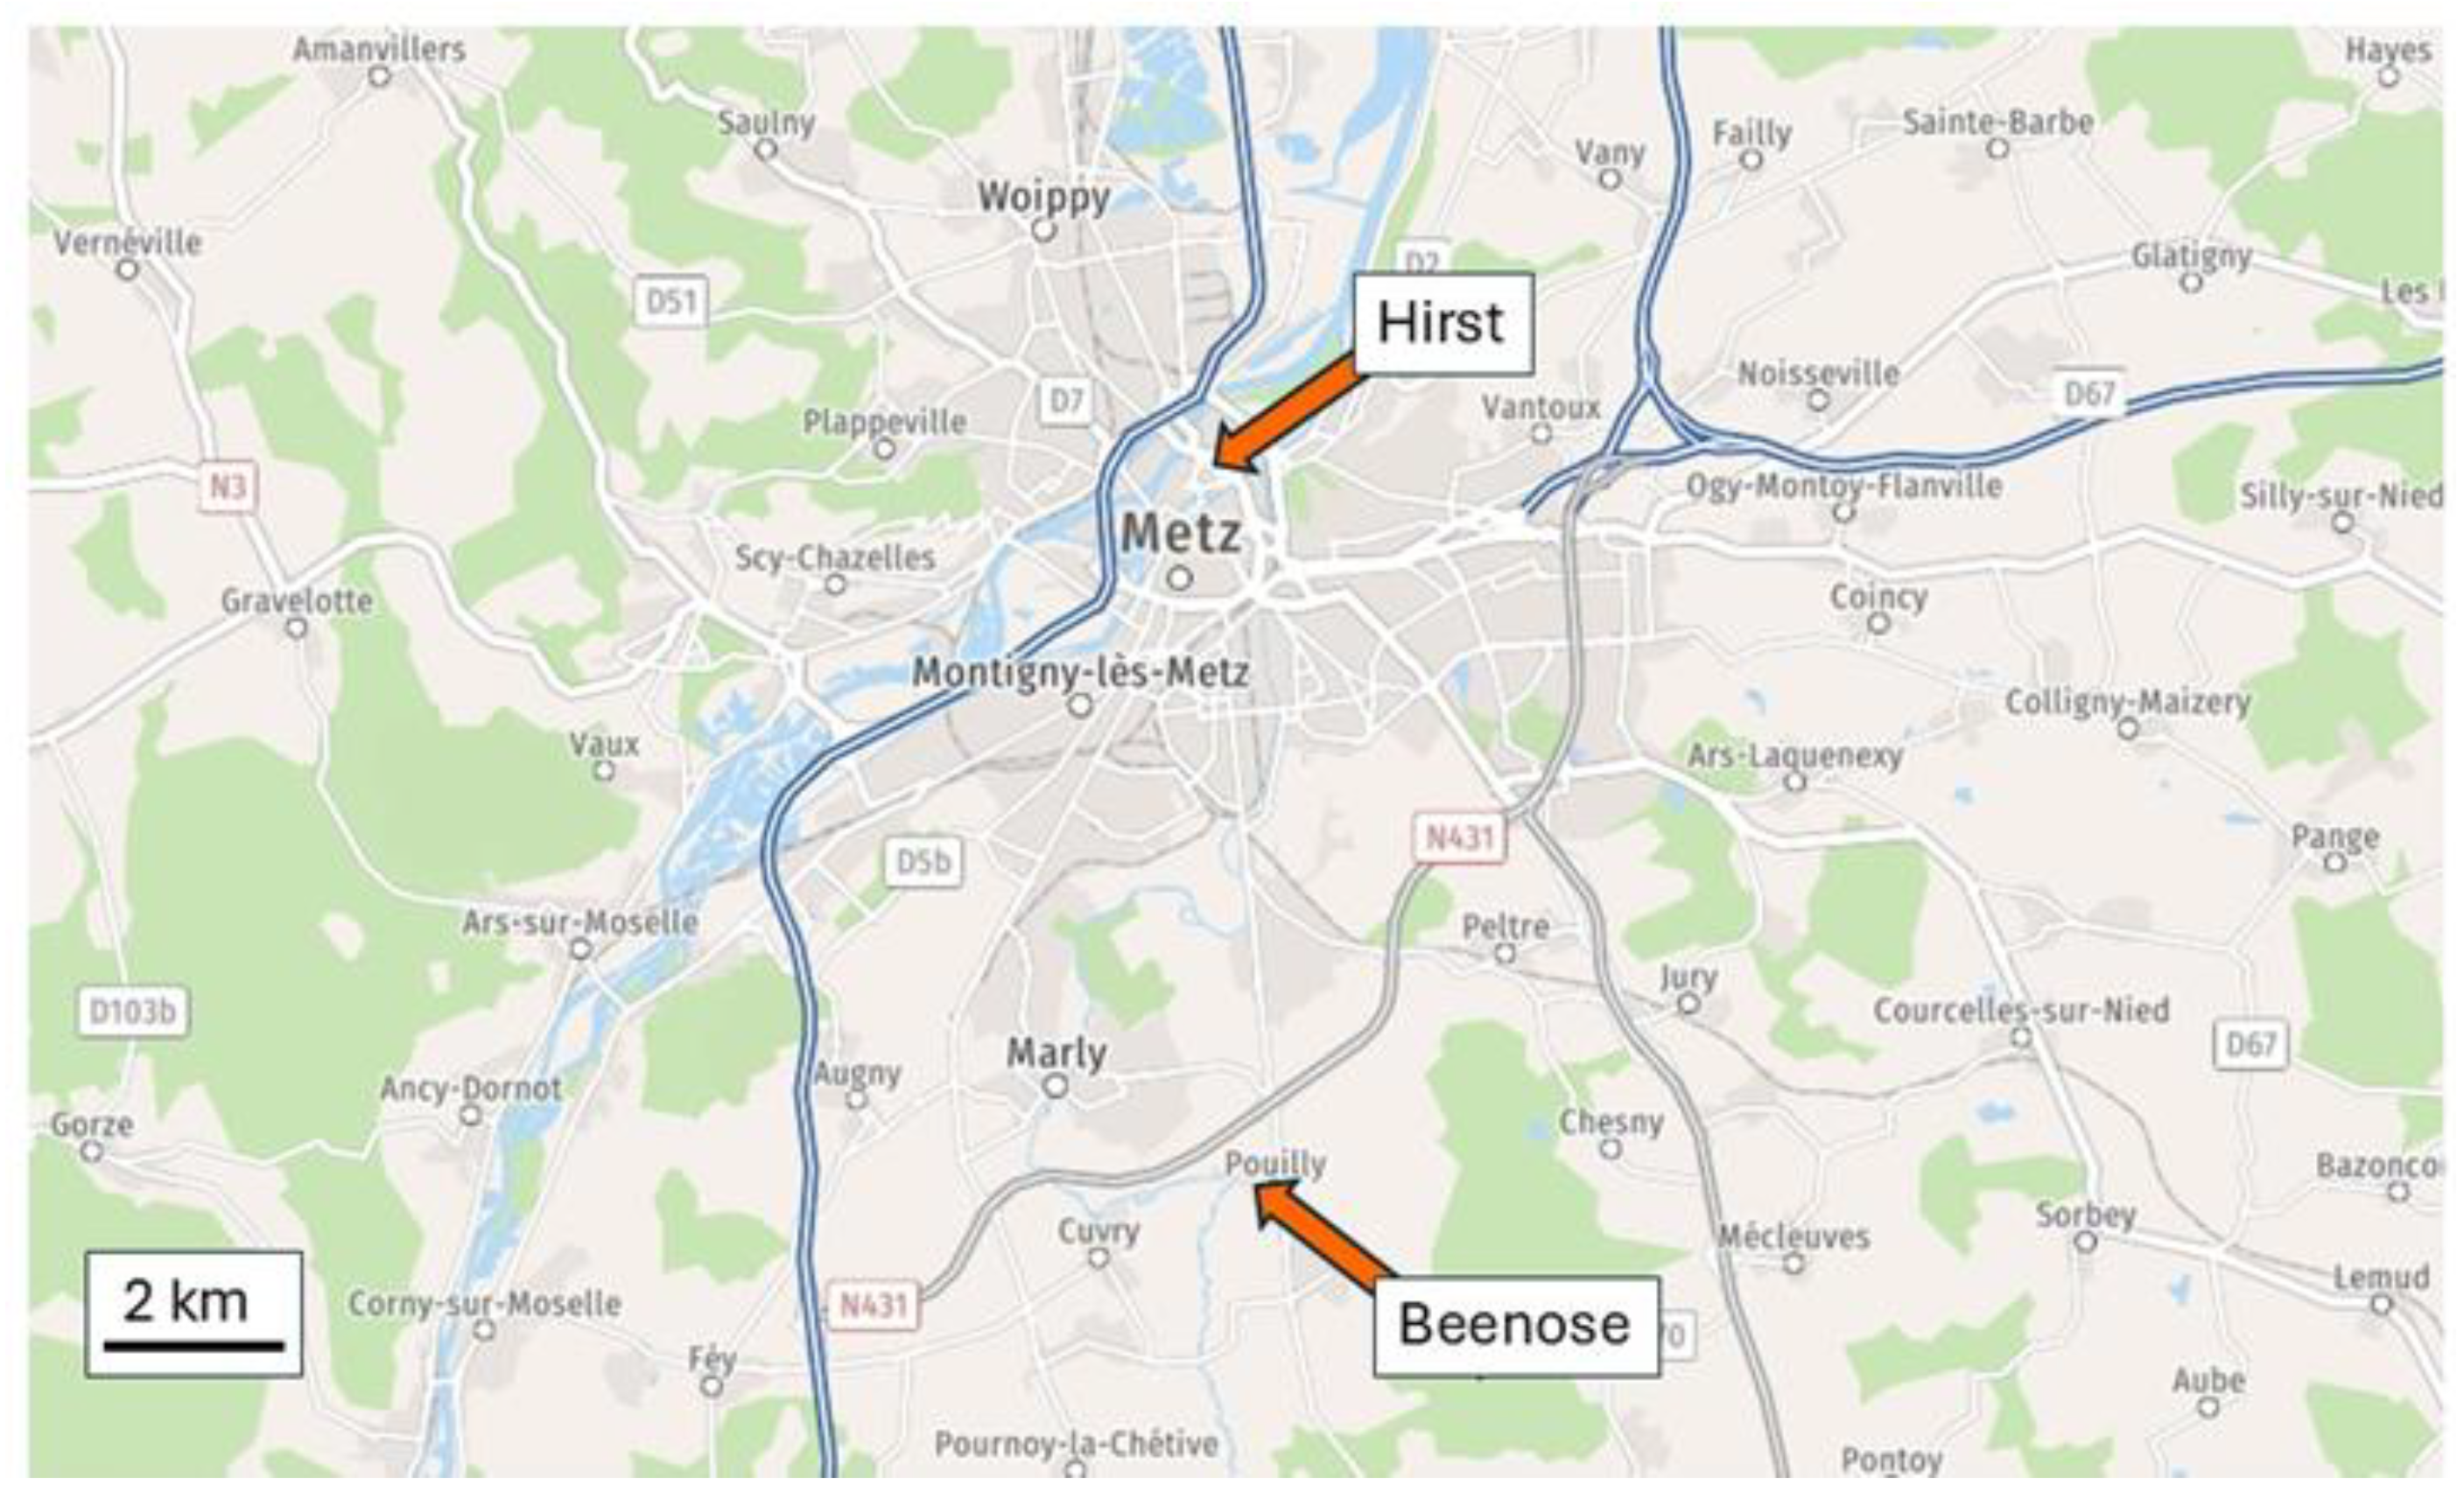
2.1. Measurements Conditions

The measurement field campaign was conducted with a Beenose sensor located in Pouilly (49.050625° N, 6.186049° E), 7 km south of Metz, in eastern France, at an altitude of 200 m above sea level. The sensor was installed on the roof of the Town Hall, at a height of about 5 m above the ground. The Hirst reference sensor used by the National Network of Aerobiological Monitoring (Réseau National de Surveillance Aérobiologique, RNSA) is positioned on the roof of a 7-floor administrative building in the city of Metz (49.126818° N, 6.1771441° E), 8 km from the Beenose sensor. Figure 1 shows the location of the two sensors. The Hirst sensor is located in an urban area, which is mainly made up of houses and buildings, and small, scattered tree areas can be identified in proximity. The Beenose sensor is in a small village in a quasi-rural area with clearly identifiable crop fields in the immediate proximity of the village, and a large, wooded area located at less than 2 km east with birch and oak that are the main species in this region. Thus, we can expect that the two instruments have recorded a similar trend in pollen concentration while some differences could occur due to the different locations.
The study period extends from 20 March to 25 June 2023, during intense pollen emissions. We will consider the total concentration as the sum of the concentrations of the most allergenic and most present species during this period, namely cypress, ash, Betulaceae, oak, and grasses.

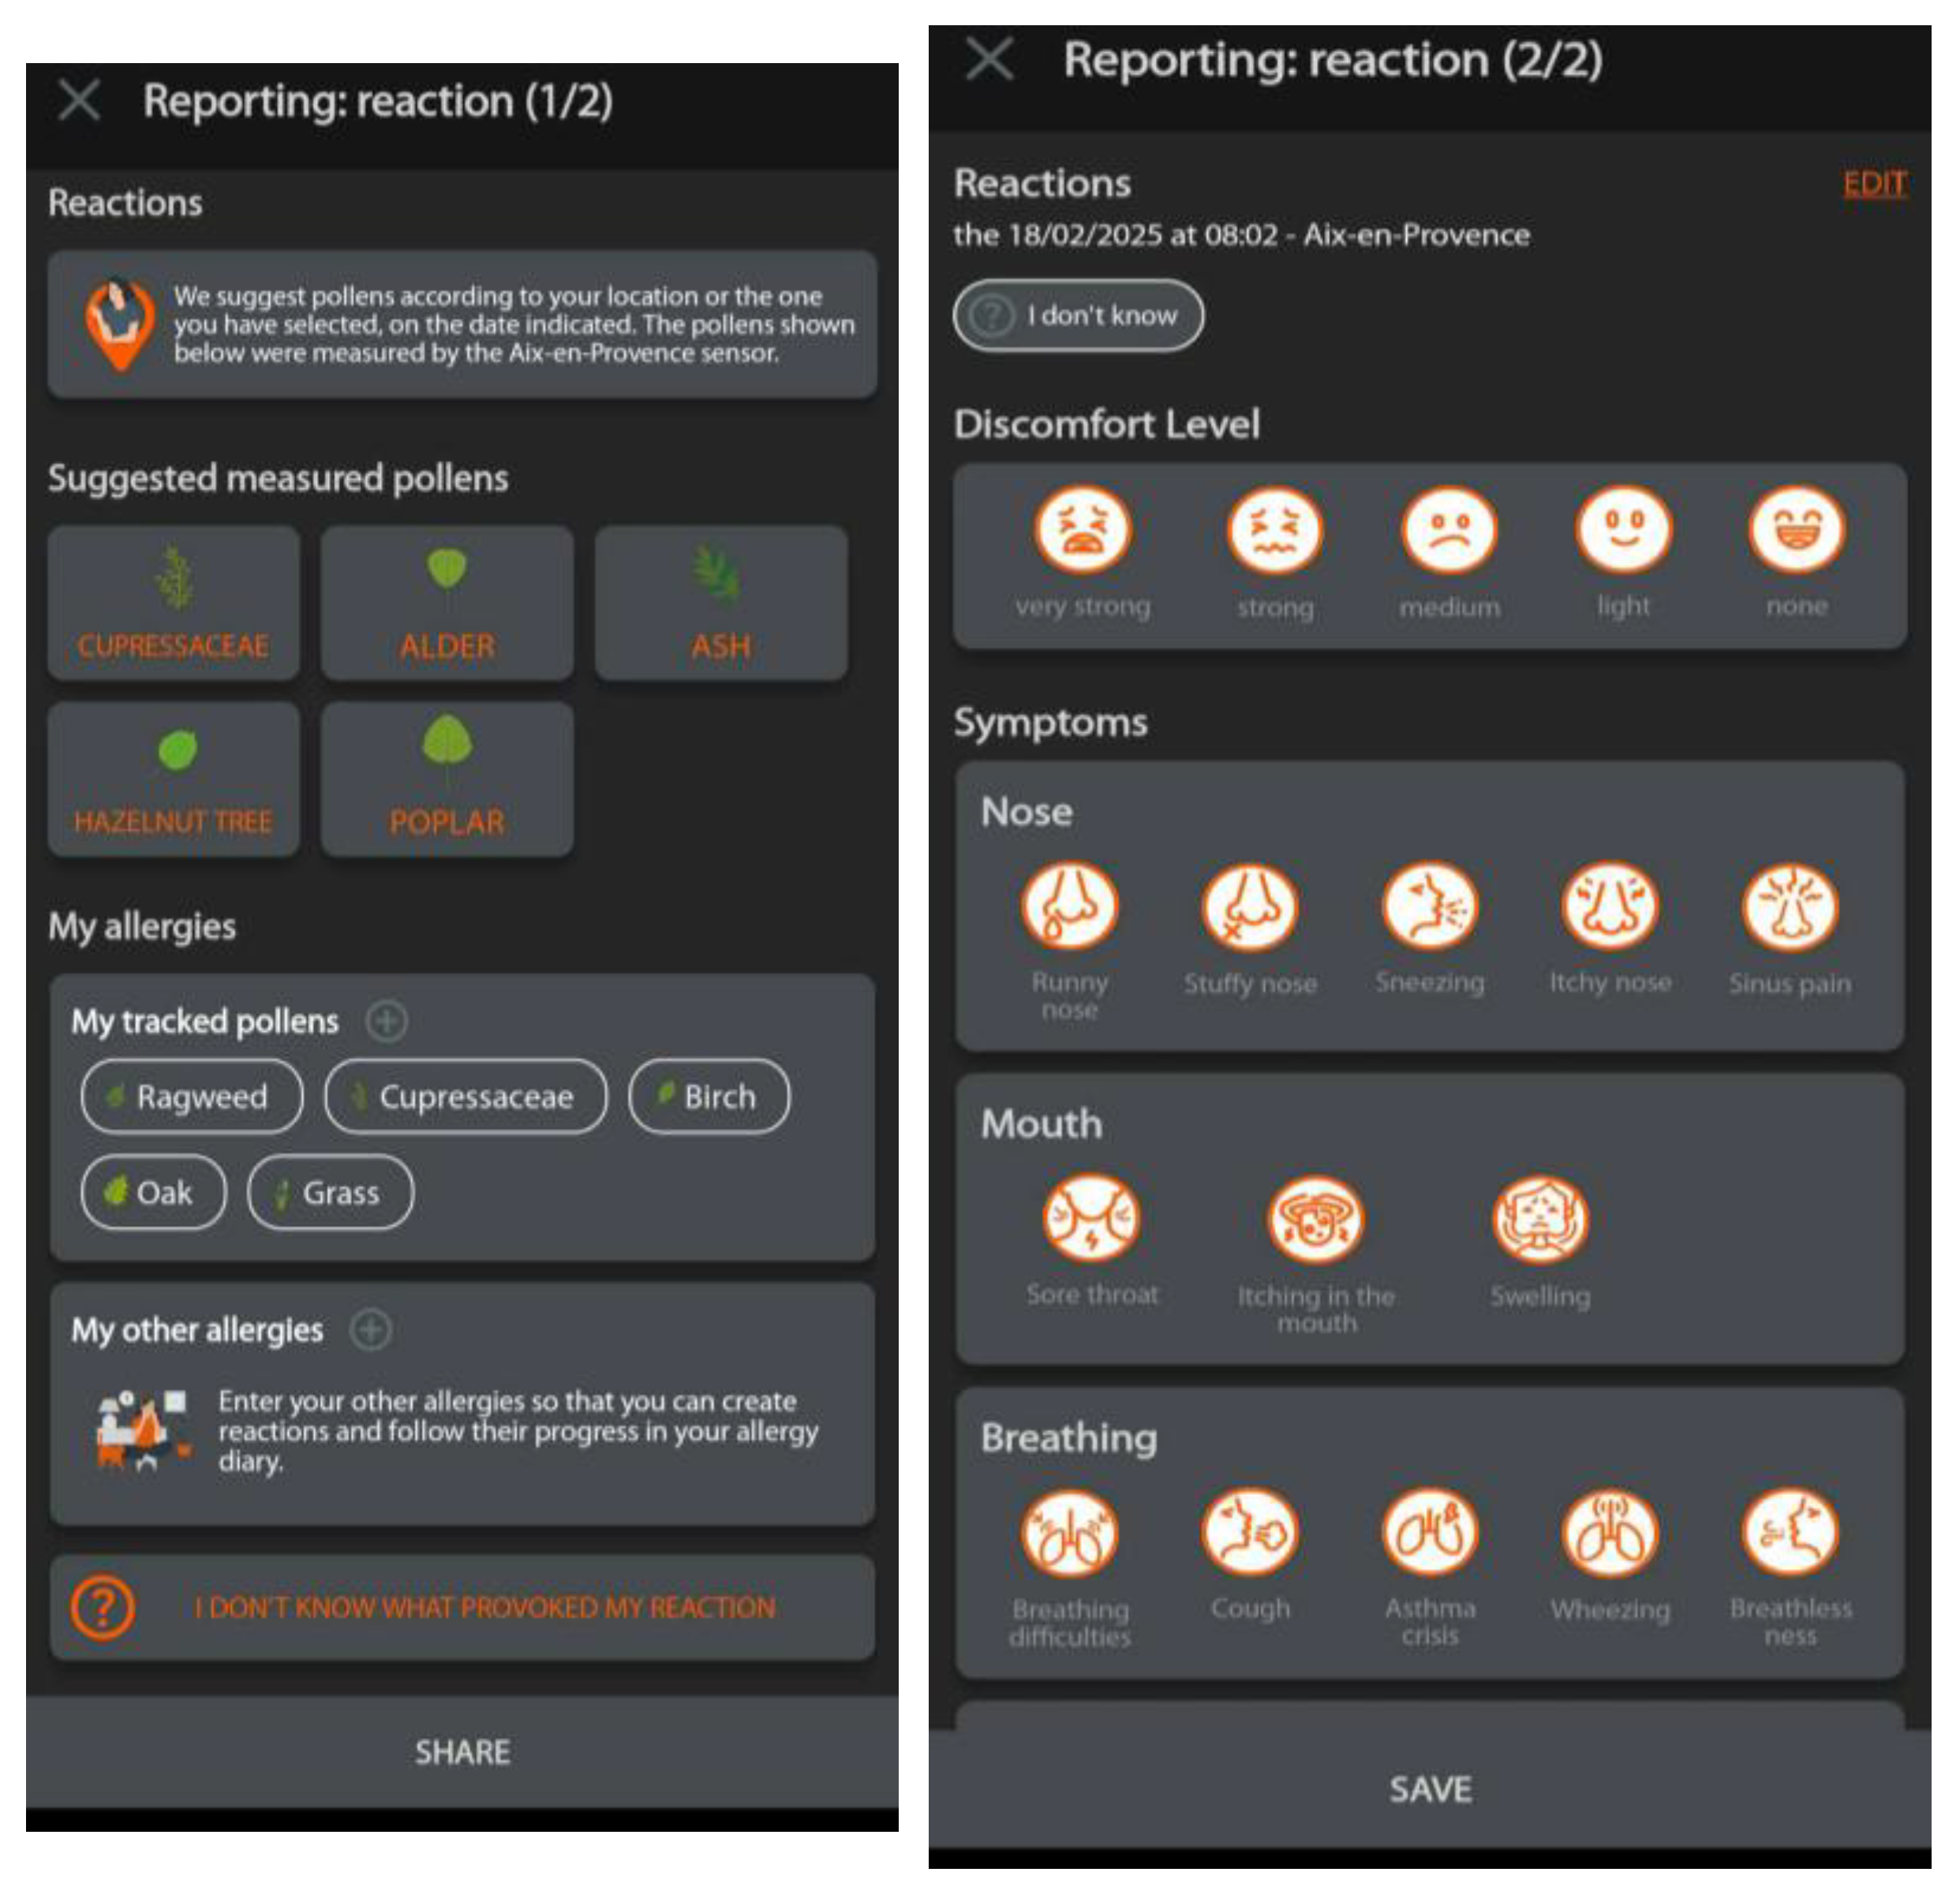
2.2. Origin of the Data

The Beenose sensor is provided by the French company Lify-Air. This sensor is based on the optical properties of light scattered by pollen grains in an airflow provided by a pumping system and passing through a light beam. Measurements at four different scattering angles allow access to the concentration and identification of different particle families, including the main allergenic pollen families, based on the optical properties of the light they scatter [37,38]. The error in total concentrations is about 15% for daily measurements [28]. The device’s internal algorithm also uses environmental and geolocation data to refine the typological detection of pollen. Beenose sensor data, available every 10 s, are averaged to provide daily values. To limit measurement dispersion without degrading the temporal resolution too much, a three-day sliding average is applied for further analysis.
The Hirst reference sensor collects particles on a support [20]. The selection of pollen among these particles and the identification of the pollen family is performed by manual microscopic observations of the support, which is typically retrieved from the device once a week. Total concentrations are obtained by summing the concentrations determined for each type of pollen. The measurement uncertainty depends on the concentrations [39,40,41], starting at 20% for concentrations above 100 particles·m−3, reaching 150% for concentrations around 1 particle·m−3. As with Beenose measurements, a three-day sliding average is applied to the data.
The LivePollen app is a real-time pollen measurement tool for allergic patients, also developed by Lify-Air, to distribute information on pollen exposure obtained from the processing of the Beenose sensor data. The app allows users to anonymously report their allergy symptoms, with the aim of enabling the history of allergy sufferers’ experiences (but is not a clinical report or based on a validated medical questionnaire). Each user can download the LivePollen app on their own initiative. Users are invited to report their symptoms (Figure 2), and they can select the pollen to which they think to be allergic (or to notify that they do not know what they reacted to). They have the possibility to indicate the level of their discomfort on a five-point scale, as well as the nature of their symptoms. They can also provide additional information that they consider necessary. Finally, their report is recorded in an allergy diary, which enables them to discuss with their healthcare professional. In this study, the choice was made to consider all reports without distinguishing intensities or typologies of symptoms in order to promote robust statistics. Finally, errors in the reporting, such as inconsistent symptom entries, and other possible allergen sources, moving to or from locations inside the observation area, will participate in statistical fluctuations (and thus uncertainties) of the analysis.
In this study, we chose to aggregate reports edited within a 25 km radius around the city of Metz. This distance range was the best compromise between the possible local variations in concentrations and the number of reports available, and it encompassed most of the high population density locations in the urban area.
During the 2023 spring period, LivePollen recorded 2541 symptom reports in this zone. As with other data, the values were smoothened over three consecutive days to minimize the data dispersion. These daily report numbers range from 5 to 100, which should provide acceptable statistics for comparisons with sensor measurements.

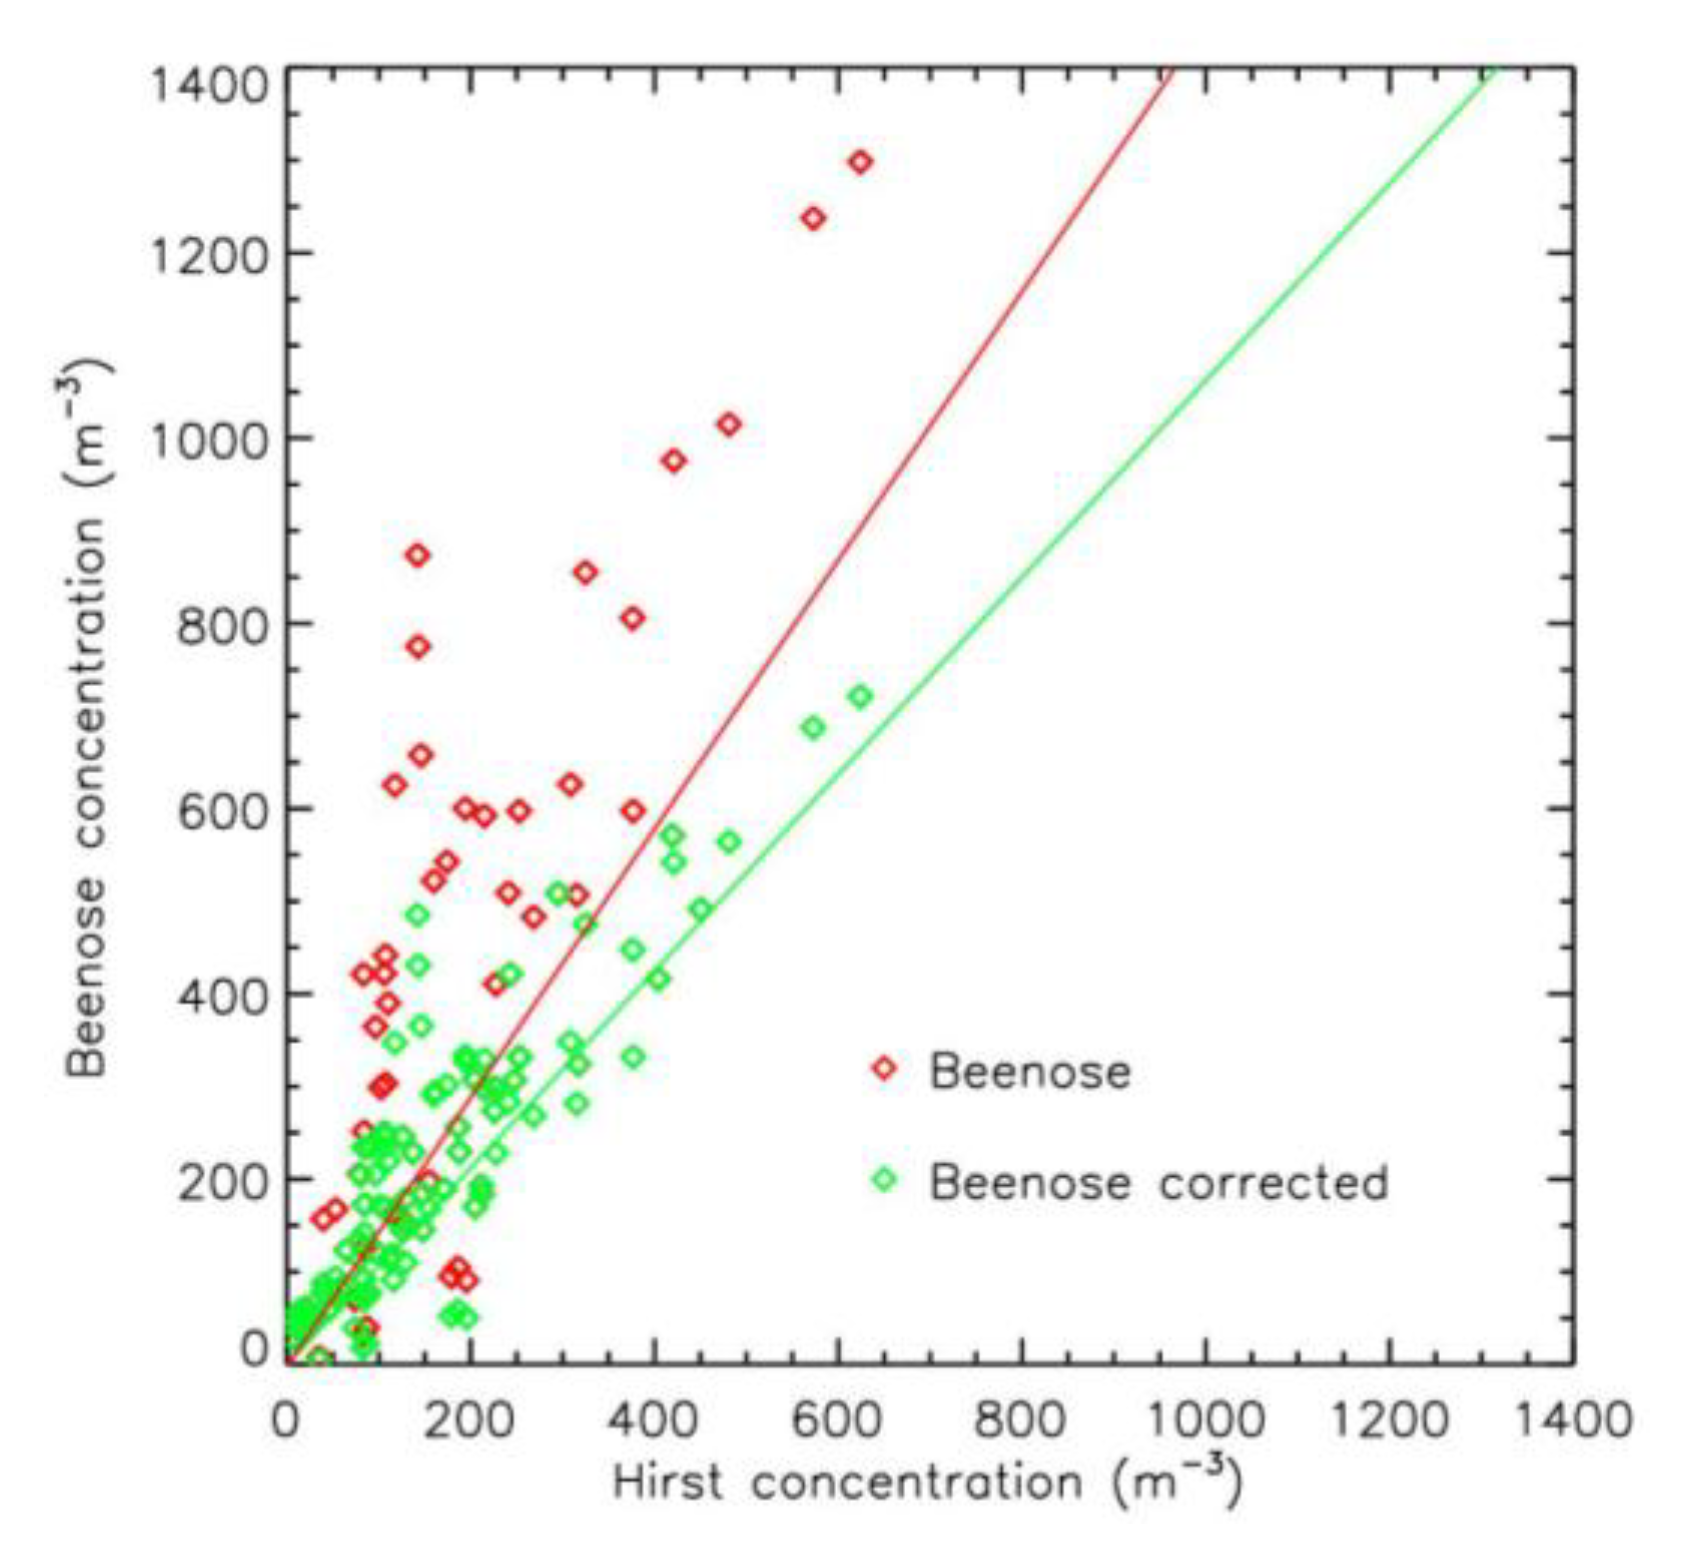
2.3. Intercomparison of Beenose and Hirst Sensors

In the following, we will base the statistical analysis on the correlations using the Person coefficient (that assesses the level of linear correlation between two sets of data) and the Spearman coefficient (that assesses how well the relationship between two sets of data can be described using a monotonic function).
Before comparing the concentrations measured by the two devices and the reports collected on LivePollen, it was useful to present a comparison of the devices to validate their consistency. Figure 3 shows the temporal evolution of total pollen concentrations (sum of ash, Betulaceae, oak, and grass pollen concentrations) measured by the Hirst and Beenose sensors. The general trend is the same for the two sets of data, with two different pollinic periods. The scatter plot (Figure 4) shows a good correlation between the two data sets. Although the overall determination coefficient R2 remains correct at 0.64, the two different periods exhibit a different profile. The concordance between the two sensors from 1 May to the end of June during the grass pollen period is obvious, while the Beenose sensor measures much higher pollen concentrations than the Hirst sensor before 1 May during the tree pollen period. This difference is clearly shown in Figure 3 and Figure 4, which consider the tree (mainly Betulaceae) pollen concentrations measured by Beenose divided by 1.8 from 20 March to 30 April. This 1.8 value was obtained by simultaneously searching for the highest coefficient R2 (Pearson determination coefficient) and the slope for the linear fit closer to 1 in the scatter plot. In this case, the correlation significantly increases, with a determination coefficient R2 of 0.74 and a slope for the linear fit approaching 1 (1.06, compared to 1.45 before).
To refine the analysis, Pearson correlation coefficients were calculated between, the Beenose and the Hirst smoothed measurements for the ash, Betulaceae, oak, and grass. These coefficients, presented in Table 1, show that the correlation is excellent for all species, confirming the linear relationship between the Hirst sensor measurements and those of the Beenose sensor.

3. Results

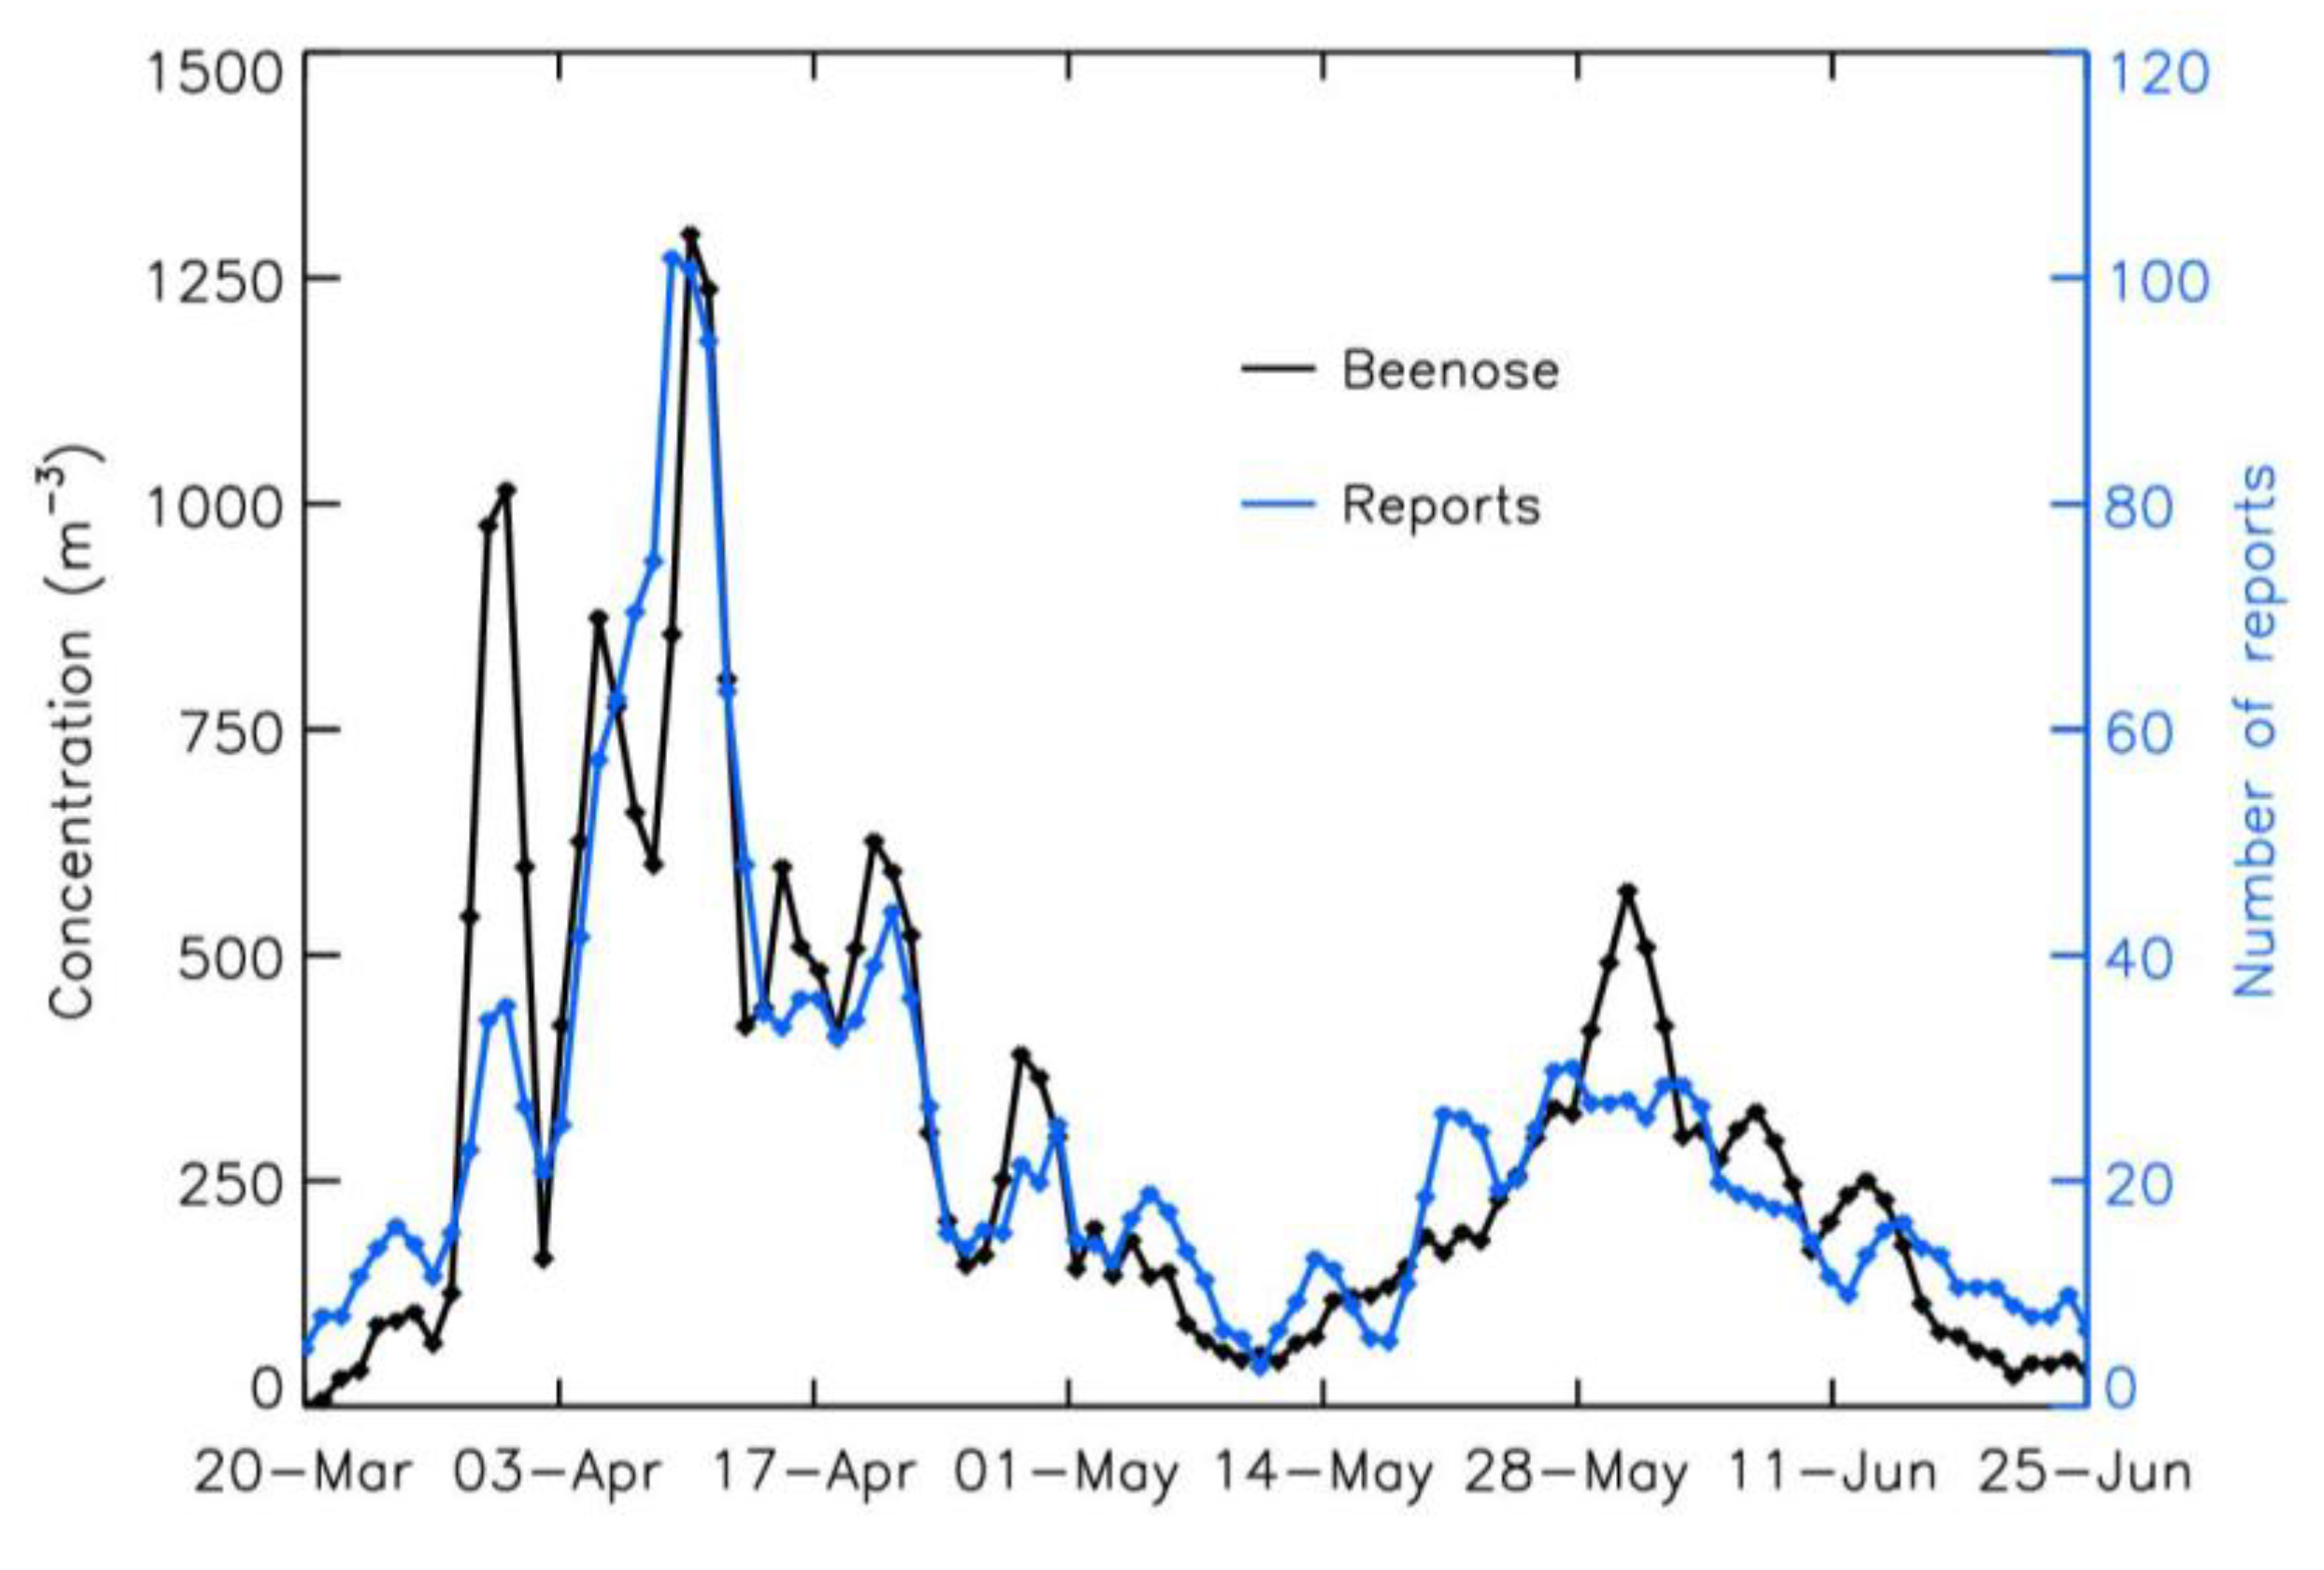
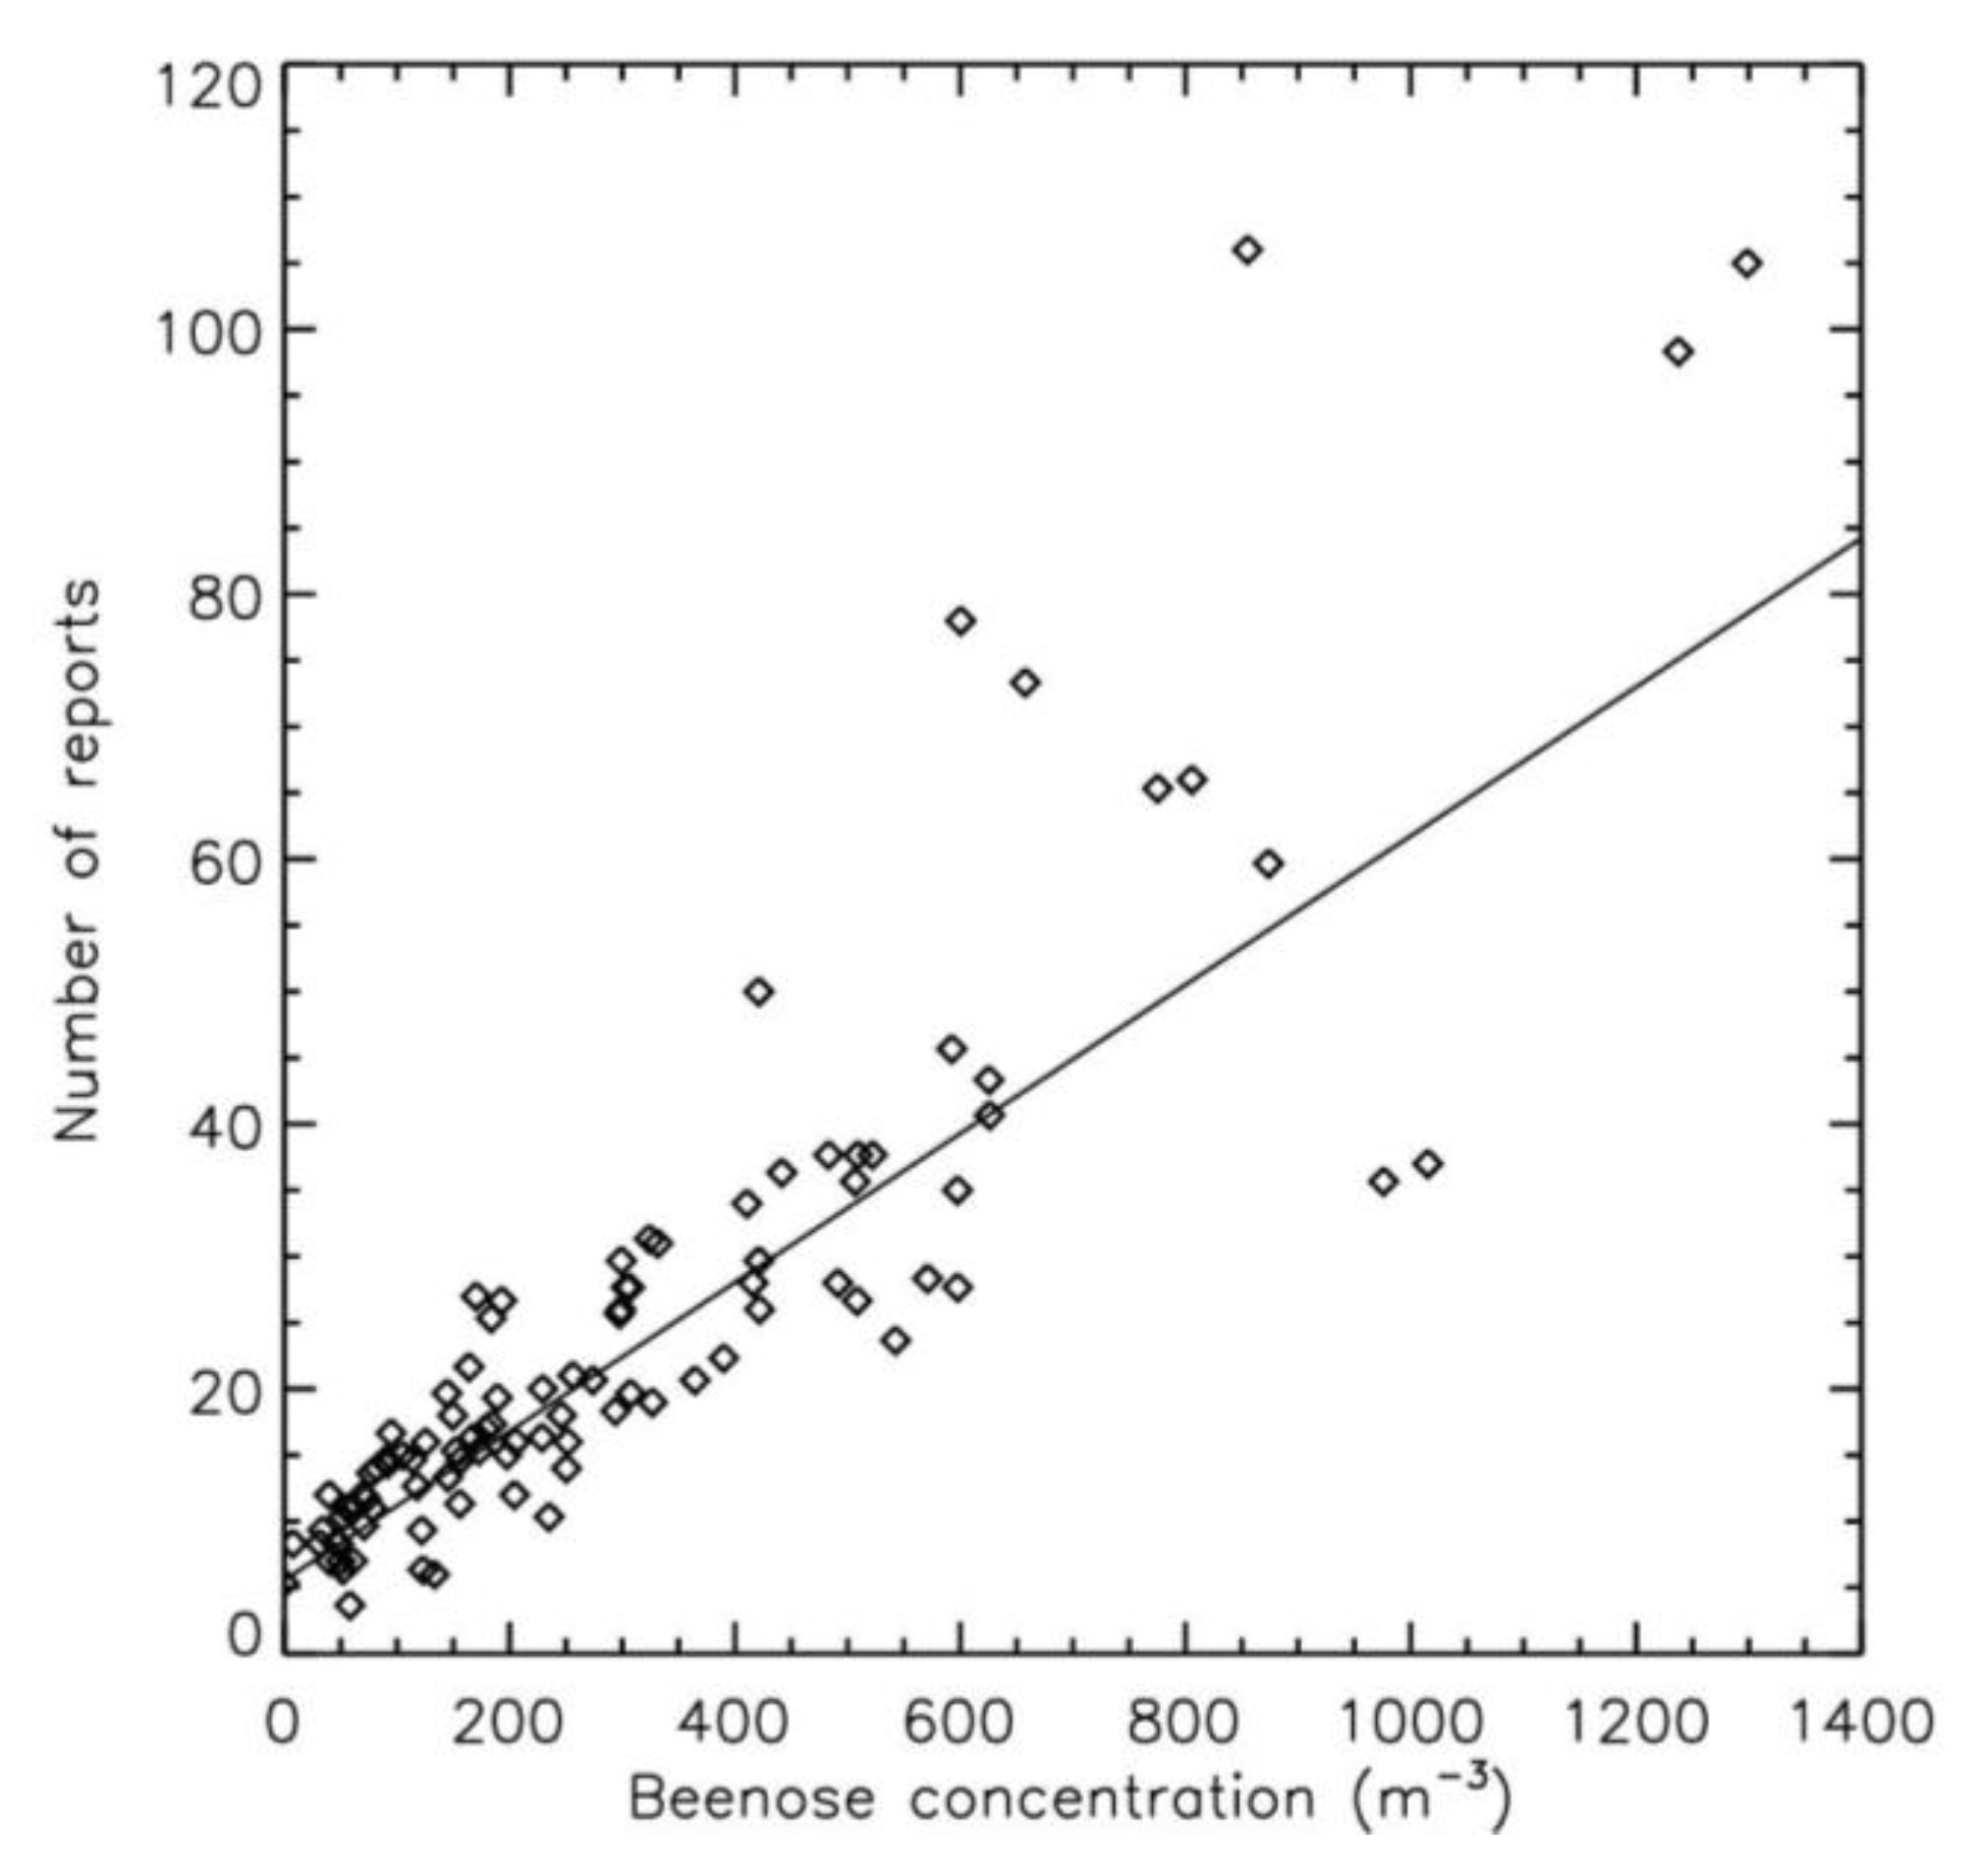
3.1. Comparison Between Pollen Concentrations and Symptoms Reports: Entire Period

The correlation between the uncorrected total pollen concentrations measured by Beenose and the number of allergic symptoms reports is clearly consistent. It is even more obvious when the date of the Beenose concentrations is shifted by one day (Figure 5). Table 2 presents the correlation based on Pearson and Spearman coefficients between the Beenose measurements and the reports, both for the entire study period and from 2 April, to remove the effect of the first peak. Improvements in the Pearson coefficient are observed when starting the study on 2 April and when shifting the reports by one day.
The scatter plot (Figure 6) shows a linear concordance between concentrations and symptom reports, with R2 = 0.75. By considering only data from 2 April 2023, the agreement improved with R2 = 0.85, confirming the clear linearity of the relationship from this date.
Nevertheless, the intensity values for the first concentration peak and reports peak during the first days of April are less correlated than for the rest of the season. Also, at the end of May and early June, a plateau is observed for reports while concentrations exhibit a peak; nevertheless, this difference remains close to the precision limit of the Beenose measurements and of the statistical fluctuations of the reports.

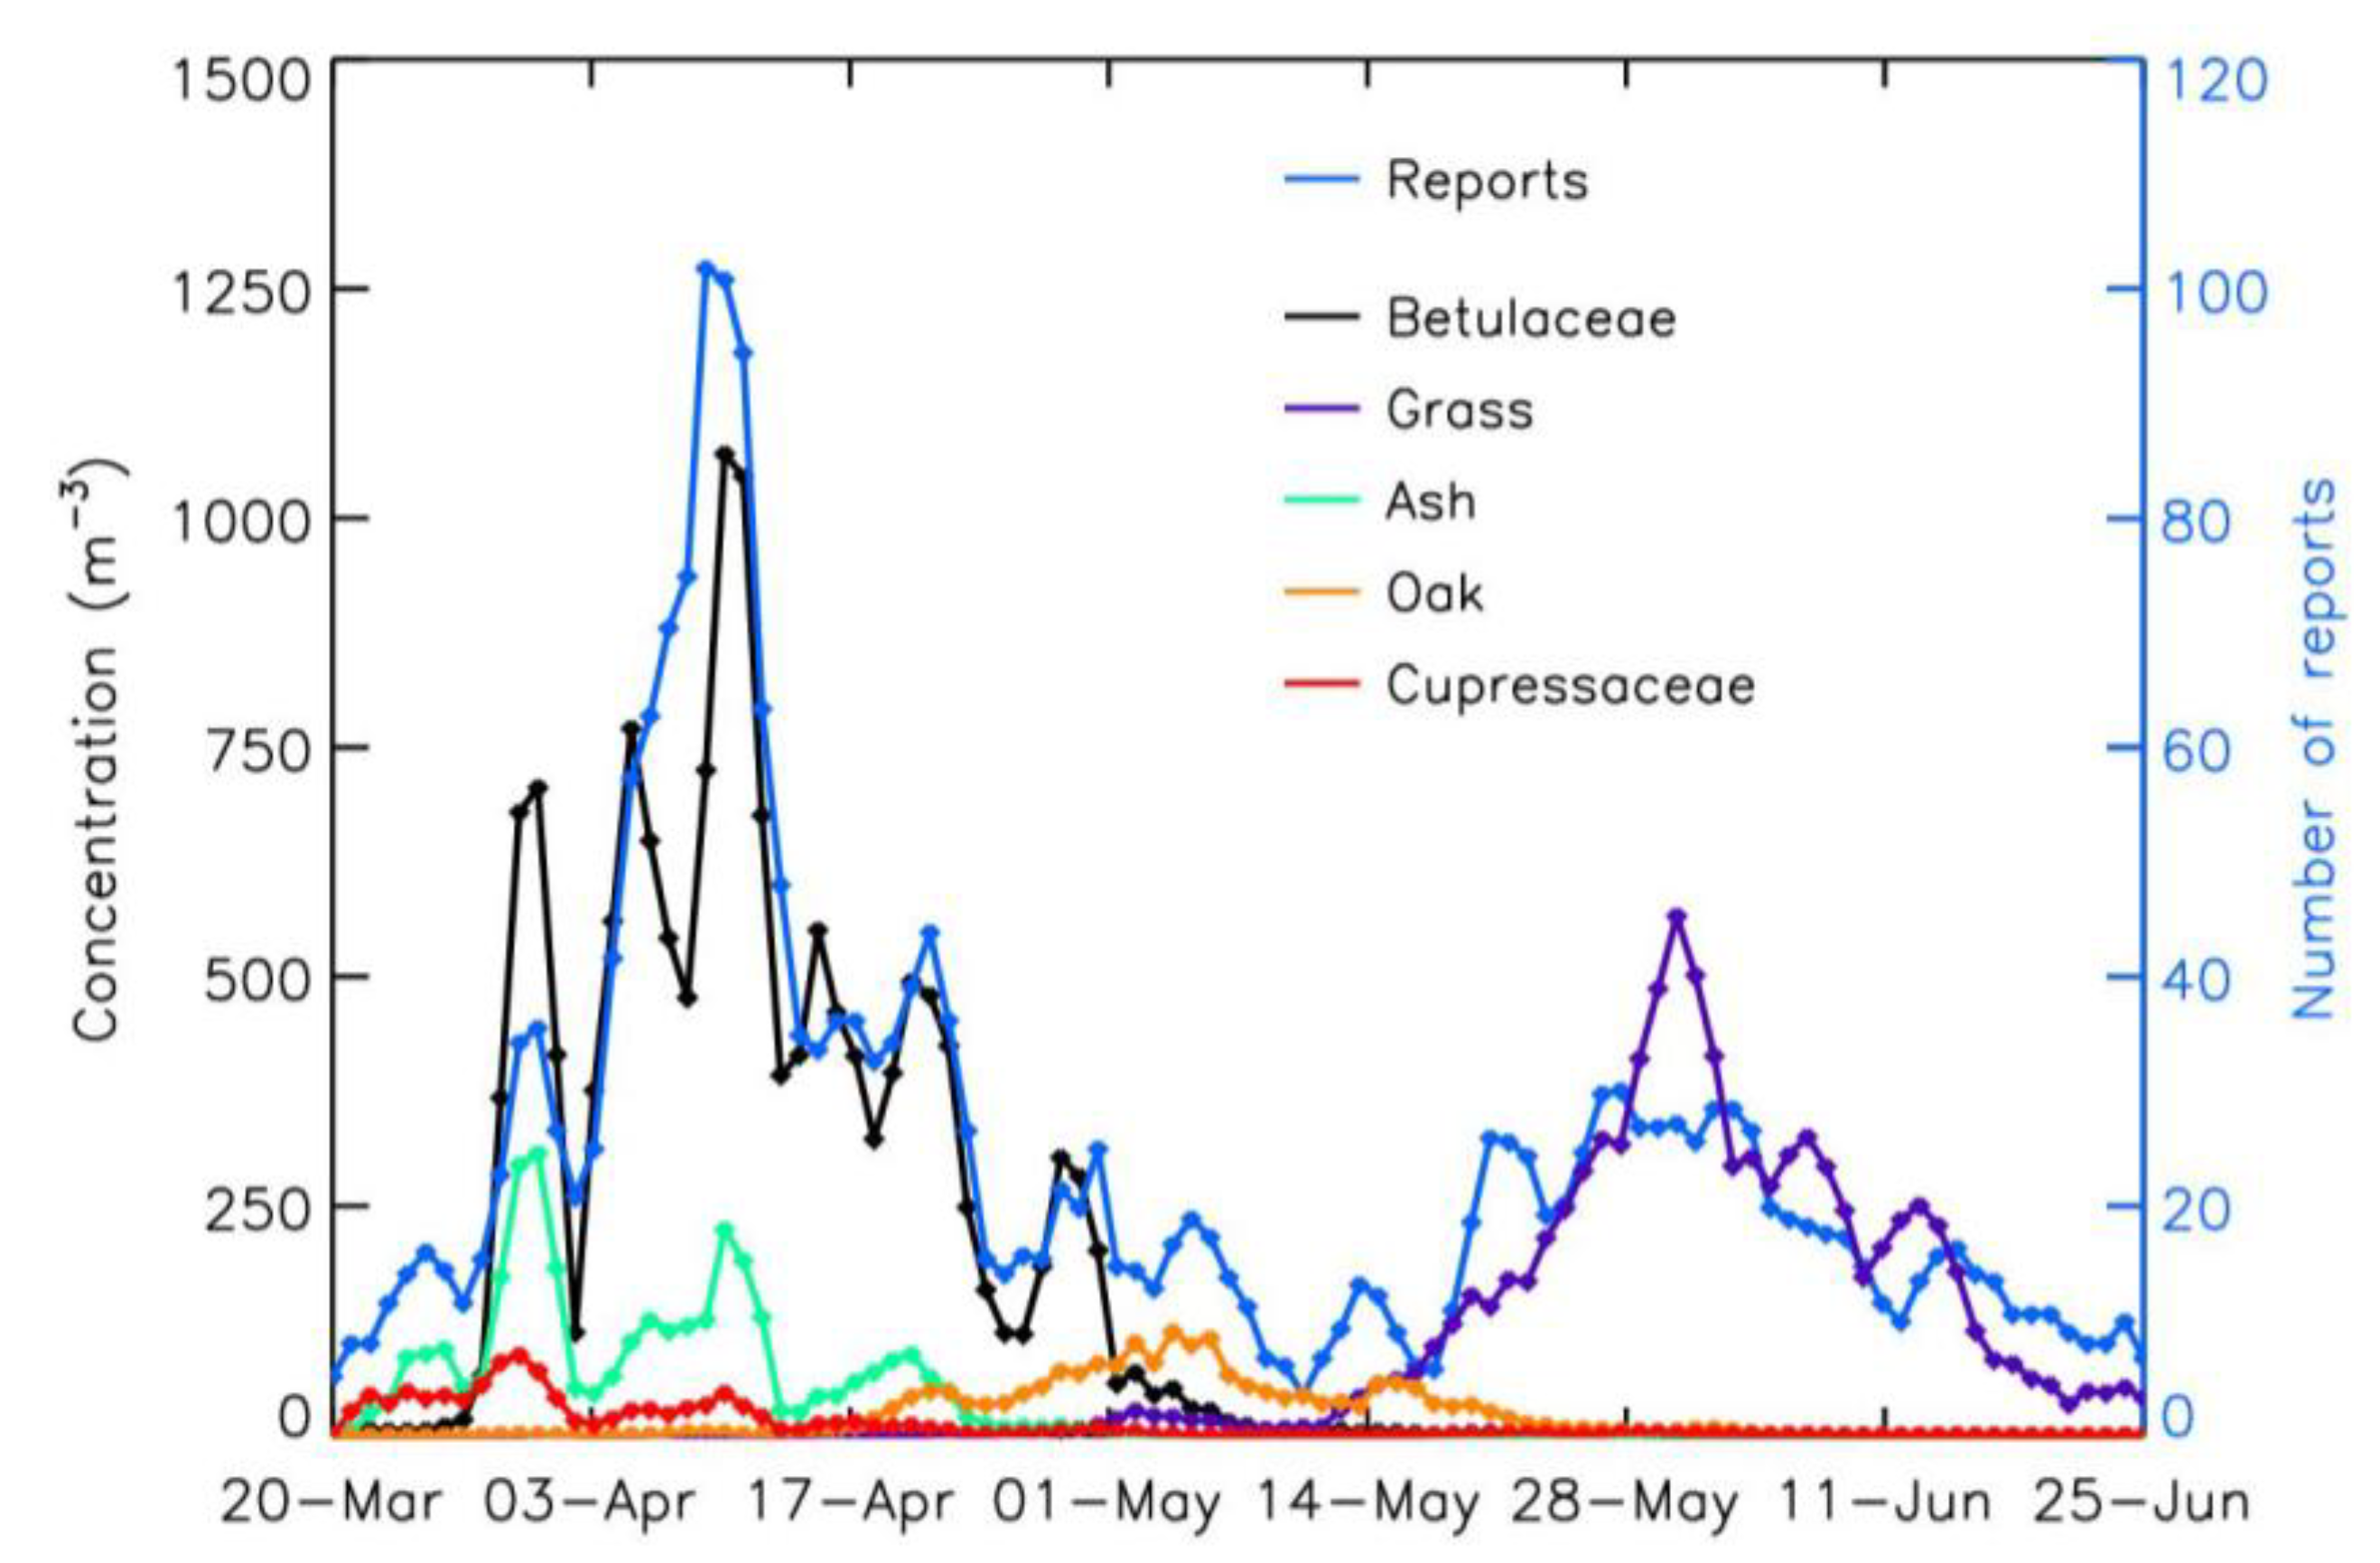
3.2. Pollen Concentrations and Symptoms Reports: Analysis by Period and Predominant Species

To better understand the temporal evolution of the pollen concentration and the differences with the symptom reports, the analysis must also be conducted by focusing on the main allergenic pollen. Figure 7 presents the time evolution of the various pollen concentrations obtained by Beenose shifted by one day. The first concentration peak, although mainly composed of Betulaceae pollen, contains a significant proportion of ash and cypress pollen. Such presences indicate that the allergy symptoms could not be totally linearly dependent on the total pollen concentration, but could be partly dependent on the pollen families. In particular, this must be considered at the beginning of allergy season when different taxa follow different time evolutions. The presence of Betulaceae pollen increases in early April while ash and Cupressaceae species decrease. Then, the presence of Betulaceae pollen decreases until early May. Grass pollen appears in early May, but it is only from 11 May that the progressive increase in concentrations becomes evident, peaking in early June. During this period, grass pollen represents almost all of the total concentration.
Table 3 gives the correlation coefficients between Beenose and reports, for the period before 1 May 2023 and after 10 May 2023, for the two main species, Betulaceae and grasses. The coefficients confirm the clear correlation between measurements and reports when one allergic taxon is the main contributor of pollen total concentration. These coefficients are slightly higher for the Betulaceae period than for the grass period, probably because of two reasons. The first one is the greater number of relative concentration peaks for Betulaceae than for grass, and the second one is the presence of the plateau only for the grass allergy reports at the end of May.
The same work is conducted with the Hirst data. Table 4 presents the correlation coefficients of the comparison between measurements and LivePollen reports. Although the agreement is satisfactory, the correlations are lower between the Hirst measurements and symptoms reports than Beenose measurements and symptoms reports. The most important explanation is probably the location of the Hirst sensor inside the city while the Beenose sensor is close to the tree sources.

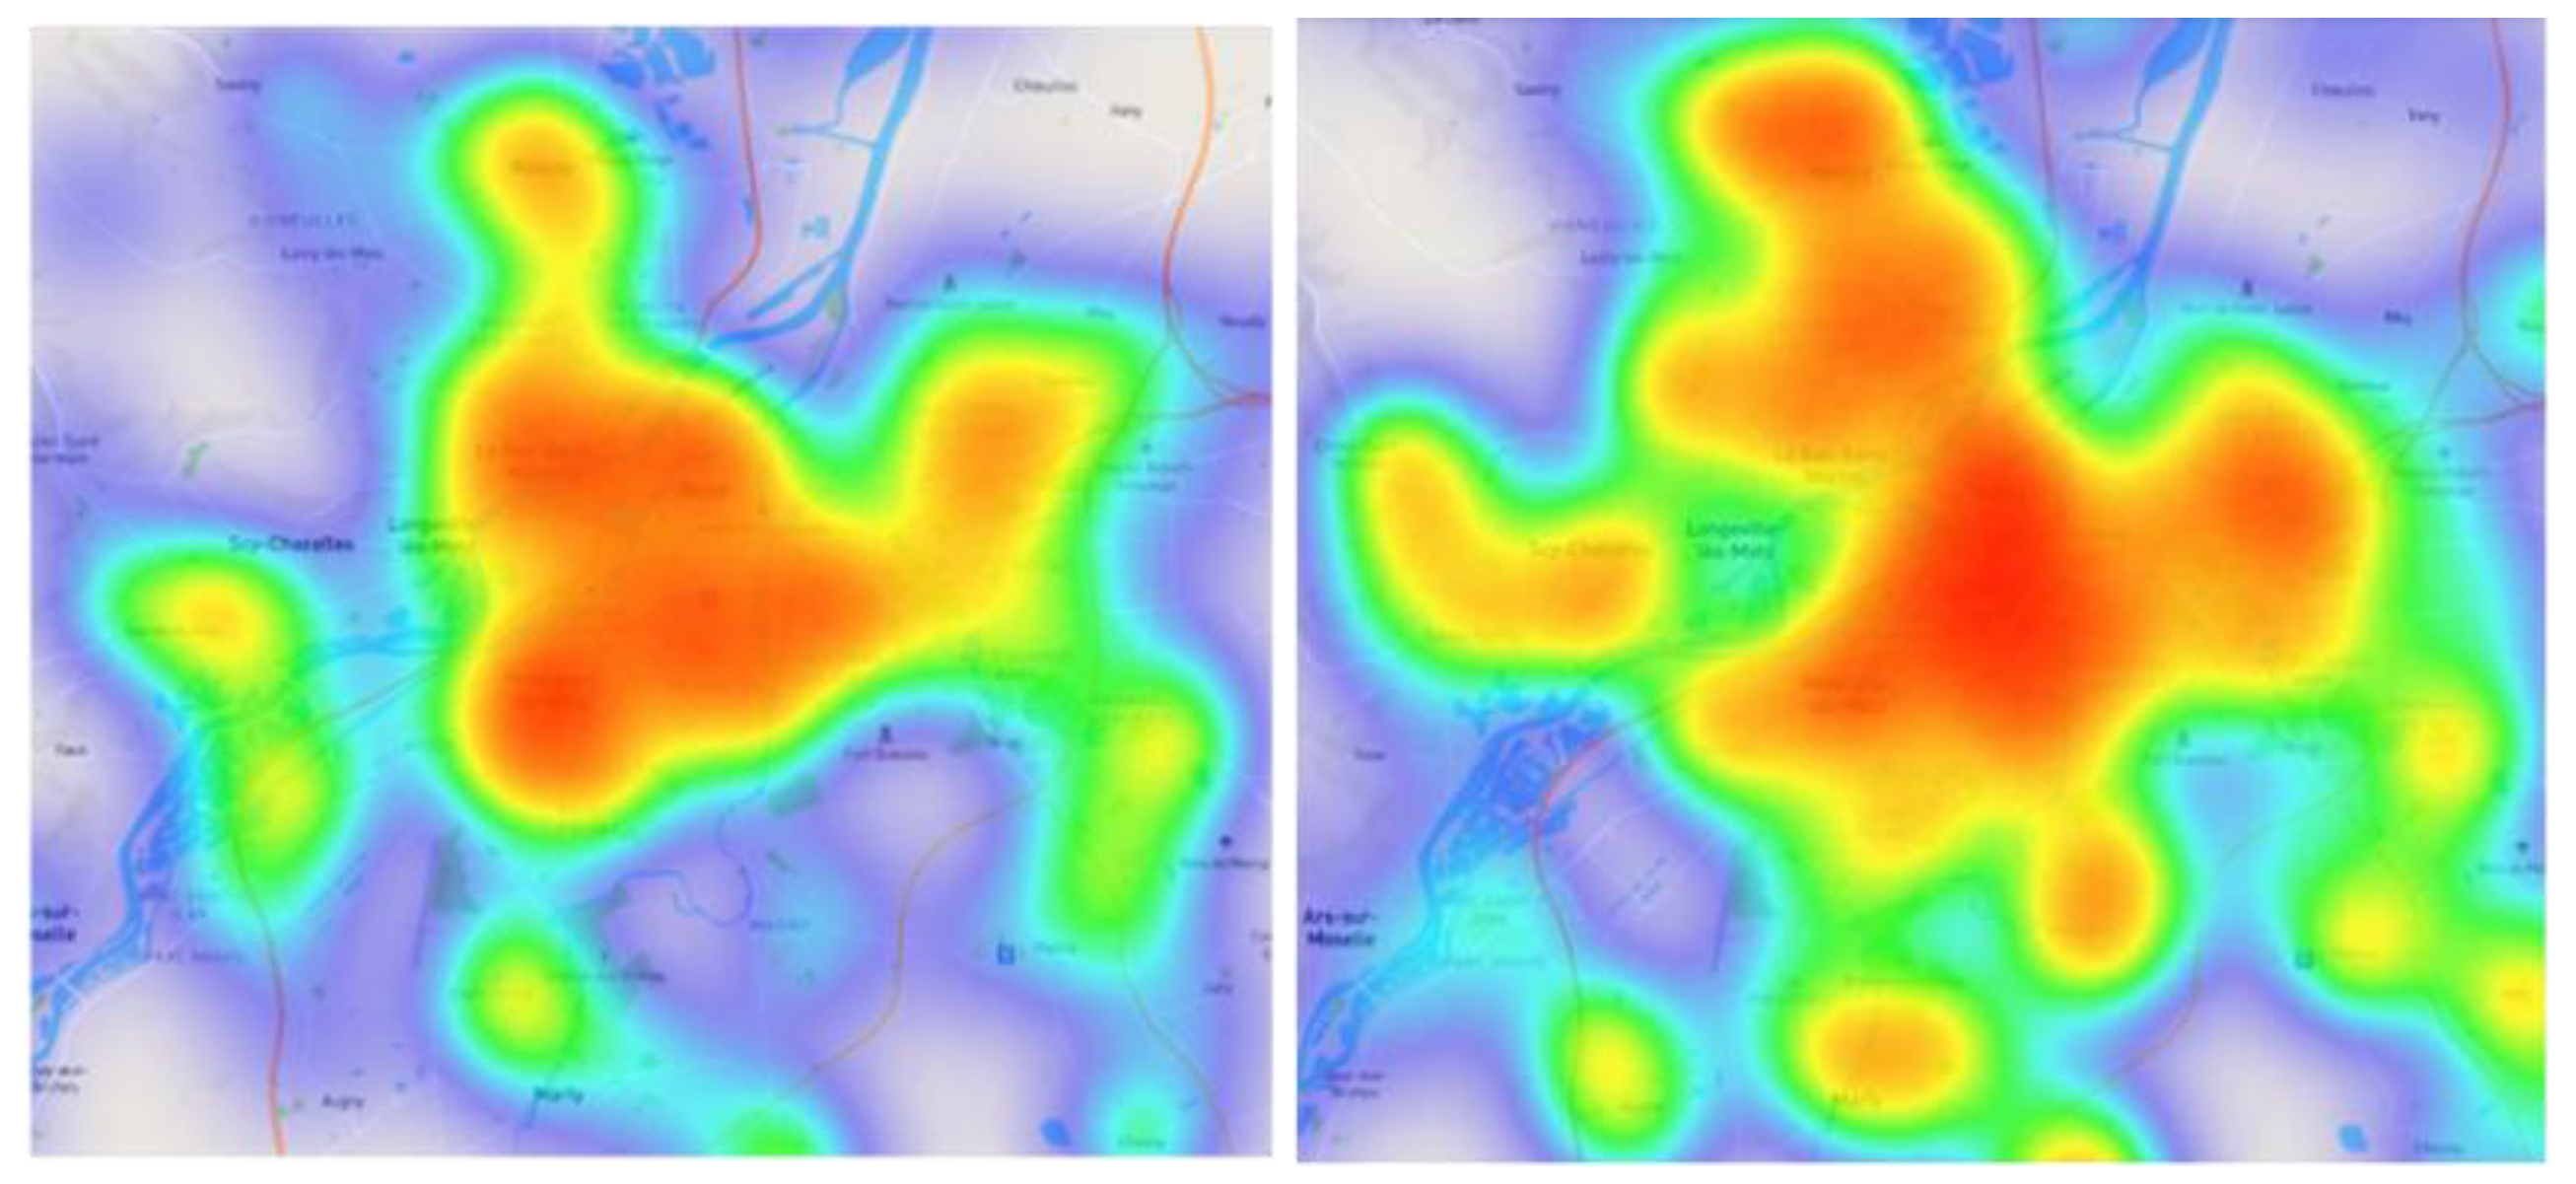
3.3. Spatial Variability of the Symptoms’ Reports

Reports were generated within a 25 km radius around Metz. There is a disparity in the spatial reports, according to the emission periods of Betulaceae and grasses (Figure 8). More spatially widespread reports are observed for Betulaceae pollen than for grass pollen. The last ones are more concentrated inside the city and follow the population density. This result could indicate that the proximity of emission sources seems to play a more important role, especially for the symptoms reports due to tree pollen. This study confirms the necessity of deploying a high-density network of sensors per metropolis to better detect the high heterogeneity of particle concentrations, as already pointed out during the study around Brussels [28], and to better determine their allergenic effects on exposed populations.

4. Discussion

The detection of higher Betulaceae concentrations by Beenose compared to Hirst presented in part 2.3 could be explained by their immediate environment. While the Hirst sensor is located in the city centre, the Beenose sensor is installed in a quasi-rural area, less than 2 km west of a forested area (Bois de l’Hôpital). The winds were relatively strong and came from the east on the days when the most significant disparities were observed and, thus, they carried a large amount of Betulaceae pollen. This sensitivity of measurements to wind direction for different sensors a few kilometres apart had already been highlighted in the Brussels suburbs [28] with a similar order of magnitude to that detected here.
The population is generally less allergic to ash pollen than to Betulaceae pollen [5]. Thus, the population should present fewer allergic reports in the initial rising phase of concentrations ( the first peak at the end of March containing a significant part of ash pollen). Then, when reaching a sufficiently high and long exposure level to pollen, the reports achieve a better agreement with concentrations. This could also explain why reports remain high despite a slight decline in Betulaceae concentrations on 7 and 8 April.
During the grass pollen period, from 11 May to 25 June, the number of reports is lower than during the Betulaceae period. This is due to both the lower concentration of the grass pollen compared to Betulaceae, and the fact that allergic persons do not react to all grass species in the same way [42].
It is also possible to consider that symptoms tend to stabilize above a possible threshold of grass pollen concentration, explaining the observation of a plateau in symptom reports beyond the sole hypothesis of statistical weakness. This kind of plateau could be due to both a saturation effect and the persistent time of the symptoms, up to around 60 h [36,43].
All grass-sensitive allergy sufferers could rapidly experience discomfort due to the high allergenicity of grass pollen, observed with the increase in the reports while pollen concentrations increase more slowly at the beginning of May. Therefore, the following increase in concentrations does not seem to affect more people.
Nevertheless, the threshold below which no symptoms occur can depend on the type of pollen and individual sensitivity, and thus cannot really be established [36]. It is more relevant to detect, as early as possible, the onset of the season when pollen concentrations are still low in the air. This procedure provides the most efficient alert for informing the allergic population in order to limit the setup of symptoms, at least when such detection is statistically robust to avoid false detection. This will be a better procedure to inform allergic people than not considering representative thresholds well.
Reports are made by volunteers who use the LiveApp app without medical supervision. The quality of the data may, therefore, be questionable, and the quantity of data is a key factor in robust statistics. Given the consistency of the results, it seems that users are relevant in their reports and can distinguish allergy symptoms from symptoms of other conditions. However, this bias can generate uncertainties and fluctuations in report values that could decrease when further studies involving more volunteers are conducted.
The last parameter that could strongly influence the report collection is air quality and, therefore, pollution (mainly Particulate Matter and NOx). A possible link between pollution and increased pollen symptoms has been reported [44], with air quality levels potentially affecting allergy risk by up to 20%. Pollution values are available at Metz metropolis from the “Atmo Grand Est” monitoring network. Figure 9 shows that during the studied period, the values of the PM10 (fine particles smaller than 10 µm) mass concentrations are low, remaining in the 5–25 µg·m−3 range, compared to the maximal authorized daily limit values of 50 µg·m−3 The same observation is made for NO2, with a maximum hourly value of 22 µg·m−3 for an authorized hourly limit of 200 µg·m−3.
This relative stability of pollution levels allows for evaluating the possible links between pollen concentrations and reports without being disturbed by high pollution levels that could influence both allergic reactions and respiratory problem reports. The highest peaks in LivePollen reports occurred on 9 and 10 April for Betulaceae, on 28 May to 2 June for grasses, and are decoupled from the days with slightly higher pollution peaks. It was proposed in another study that pollution peaks can increase the allergy to pollen [45], but our results show that peaks of pollen and allergy can also occur during low-pollution conditions. Thus, no direct relation can be established at present. Future studies, in particular, those using the Beenose sensors network, established in France and Belgium, could better determine the possible link between pollution peaks (that mainly occur during anticyclonic conditions) and the increase in allergy reports.

5. Conclusions

The results of this study firstly show a clear consistency between the data from the Beenose and Hirst sensors, with a significant influence of the sensor’s locations on the detection sensitivity, particularly for tree pollen. Secondly, they highlight the correlation between the evolution of pollen concentrations of the most allergenic taxa, Betulaceae and grasses, and the number of symptom reports by LivePollen app users. The data reinforce the interest in the local deployment of multiple sensors to provide more precise, rapid and customizable information to allergic patients based on their living areas.
A one-day shift seems to exist between the increase in pollen concentrations and the increase in reports from allergy sufferers, mainly for Betulaceae pollen. Although weak, this shift reinforces the potential for preventive intervention within a few hours, providing near-real-time information to populations suffering from allergies as soon as the first pollen appears. This cannot be effective with the Hirst monitoring system currently used, which provides pollen measurements and analysis with a delay of several days.
The number of the Beenose sensors is still increasing, as well as the number of LivePollenApp users. Then, an allergy starting threshold based on pollen concentrations could be established species by species in the future, based on the continuation of this correlation study between pollen measurements and symptoms on a daily or even hourly scale. It will also be possible to qualitatively study the typology and the intensity of symptoms. The geolocation of user reports will allow us to better understand the influence of different parameters leading to allergies, like the meteorological conditions and perhaps the pollution levels. With the history of symptoms reported by a patient, it will even be possible to establish a personalized allergy sensitivity threshold. These studies will, of course, need to be conducted in a large number of different locations to thoroughly document all the geographical, meteorological, and urban density conditions prevailing in the production and transport of pollen. All these efforts can ultimately provide significant assistance to the medical community in terms of diagnosis, prevention, and even patient follow-up.

Author Contributions

Conceptualization, J.-B.R.; methodology, J.-B.R.; validation, J.-B.R.; formal analysis, J.-B.R.; investigation, S.L.; writing—original draft preparation, J.-B.R.; writing—review and editing, G.G. and S.L.; visualization, J.-B.R. All authors have read and agreed to the published version of the manuscript.

Funding

This research received no external funding.

Institutional Review Board Statement

Not applicable

Informed Consent Statement

Not applicable.

Data Availability Statement

The Beenose data are available on request to the Lify-Air Company The Hirst RNSA data can be purchased at RNSA.

Acknowledgments

The authors thank Johann Lauthier and Jérôme Richard (Lify Air Company) for the access to the data.

Conflicts of Interest

The authors declare no conflicts of interest.

References

  1. ANSES. Etat des Connaissances sur l’impact Sanitaire lié à l’exposition de la Population générale aux Pollen présents dans l’air Ambiant. Anses. Saisine n°2011-SA-0151. 2014. Available online: https://www.anses.fr/fr/system/files/AIR2011sa0151Ra.pdf (accessed on 1 October 2024). (In French).
  2. Savouré, M.; Bousquet, J.; Jaakkola, J.J.K.; Jaakkola, M.S.; Jacquemin, B.; Nadif, R. Worldwide Prevalence of Rhinitis in Adults: A Review of Definitions and Temporal Evolution. Clin. Transl. Allergy 2022, 12, e12130. [Google Scholar] [CrossRef] [PubMed]
  3. Meng, Y.; Lou, H.; Wang, Y.; Wang, X.; Cao, F.; Wang, K.; Chu, X.; Wang, C.; Zhang, L. Endotypes of chronic rhinitis: A cluster analysis study. Allergy 2019, 74, 720–730. [Google Scholar] [CrossRef] [PubMed]
  4. Cardell, L.-O.; Olsson, P.; Andersson, M.; Welin, K.-O.; Svensson, J.; Tennvall, G.R.; Hellgren, J. TOTALL: High cost of allergic rhinitis—A national Swedish population-based questionnaire study. NPJ Prim. Care Respir. Med. 2016, 26, 15082. [Google Scholar] [CrossRef] [PubMed]
  5. D’amato, G.; Cecchi, L.; Bonini, S.; Nunes, C.; Annesia-Maesano, I.; Behrendt, H.; Liccardi, G.; Popov, T.; Van Cauwenberge, P. Allergenic pollen and pollen allergy in Europe. Allergy 2007, 62, 976–990. [Google Scholar] [CrossRef]
  6. Vandenplas, O.; Vinnikov, D.; Blanc, P.D.; Agache, I.; Bachert, C.; Bewick, M.; Cardell, L.-O.; Cullinan, P.; Demoly, P.; Descatha, A.; et al. Impact of Rhinitis on Work Productivity: A Systematic Review. J. Allergy Clin. Immunol. Pract. 2018, 6, 1274–1286.e9. [Google Scholar] [CrossRef]
  7. Sofiev, M.; Bergmann, K. Allergenic Pollen. In A Review of the Production, Release, Distribution, and Health Impacts; Springer: Dordrecht, The Netherlands, 2013. [Google Scholar]
  8. Traidl-Hoffmann, C.; Kasche, A.; Menzel, A.; Jakob, T.; Thiel, M.; Ring, J.; Behrendt, H. Impact of Pollen on Human Health, More Than Allergen Carriers? Int. Arch. Allergy Immunol. 2003, 131, 1–13. [Google Scholar] [CrossRef]
  9. Pawankar, R. Allergic diseases and asthma; a global public health concern and a call to action. World Allergy Organ. J. 2014, 7, 12. [Google Scholar] [CrossRef]
  10. Meltzer, E.O.; Bukstein, D.A. The economic impact of allergic rhinitis and current guidelines for treatment. Ann. Allergy Asthma Immunol. 2011, 106, S12–S16. [Google Scholar] [CrossRef]
  11. Agache, I.; Canelo-Aybar, C.; Annesi-Maesano, I.; Cecchi, L.; Biagioni, B.; Chung, F.; D’Amato, G.; Damialis, A.; Del Giacco, S.; De las Vecillas, L.; et al. The Impact of Indoor Pollution on Asthma-Related Outcomes: A Systematic Review for the EAACI Guidelines on Environmental Science for Allergic Diseases and Asthma. Allergy 2024, 79, 1761–1788. [Google Scholar] [CrossRef]
  12. Katz, D.S.W.; Zigler, C.M.; Bhavnani, D.; Balcer-Whaley, S.; Matsui, E.C. Pollen and Viruses Contribute to Spatio-Temporal Variation in Asthma-Related Emergency Department Visits. Environ. Res. 2024, 257, 119346. [Google Scholar] [CrossRef]
  13. Fried, J.; Yuen, E.; Li, A.; Zhang, K.; Nguyen, S.A.; Gudis, D.A.; Rowan, N.R.; Schlosser, R.J. Rhinologic disease and its impact on sleep: A systematic review. Int. Forum Allergy Rhinol. 2021, 11, 1074–1086. [Google Scholar] [CrossRef] [PubMed]
  14. Papapostolou, G.; Kiotseridis, H.; Romberg, K.; Dahl, Å.; Bjermer, L.; Lindgren, M.; Aronsson, D.; Tunsäter, A.; Tufvesson, E. Cognitive dysfunction and quality of life during pollen season in children with seasonal allergic rhinitis. Pediatr. Allergy Immunol. 2021, 32, 67–76. [Google Scholar] [CrossRef] [PubMed]
  15. Avdeeva, K.S.; Reitsma, S.; Fokkens, W.J. Direct and indirect costs of allergic and non-allergic rhinitis in the Netherlands. Allergy 2020, 75, 2993–2996. [Google Scholar] [CrossRef]
  16. Neumann, J.E.; Anenberg, S.C.; Weinberger, K.R.; Amend, M.; Gulati, S.; Crimmins, A.; Roman, H.; Fann, N.; Kinney, P.L. Estimates of Present and Future Asthma Emergency Department Visits Associated With Exposure to Oak, Birch, and Grass Pollen in the United States. GeoHealth 2019, 3, 11–27. [Google Scholar] [CrossRef]
  17. Naclerio, R.; Ansotegui, I.J.; Bousquet, J.; Canonica, G.W.; D’Amato, G.; Rosario, N.; Pawankar, R.; Peden, D.; Bergmann, K.-C.; Bielory, L.; et al. International Expert Consensus on the Management of Allergic Rhinitis (AR) Aggravated by Air Pollutants: Impact of Air Pollution on Patients with AR: Current Knowledge and Future Strategies. World Allergy Organ. J. 2020, 13, 100106. [Google Scholar] [CrossRef]
  18. Buters, J.T.M.; Antunes, C.; Galveias, A.; Bergmann, K.C.; Thibaudon, M.; Galán, C.; Schmidt-Weber, C.; Oteros, J. Pollen and Spore Monitoring in the World. Clin. Transl. Allergy 2018, 8, 9. [Google Scholar] [CrossRef] [PubMed]
  19. Buters, J.; Clot, B.; Galán, C.; Gehrig, R.; Gilge, S.; Hentges, F.; O’Connor, D.; Sikoparija, B.; Skjoth, C.; Tummon, F.; et al. Automatic Detection of Airborne Pollen: An Overview. Aerobiologia 2024, 40, 13–37. [Google Scholar] [CrossRef]
  20. Hirst, J.M. An Automatic Volumetric Spore Trap. Ann. Appl. Biol. 1952, 39, 257–265. [Google Scholar] [CrossRef]
  21. Tummon, F.; Adams-Groom, B.; Antunes, C.M.; Bruffaerts, N.; Buters, J.; Cariñanos, P.; Celenk, S.; Choël, M.; Clot, B.; Cristofori, A.; et al. The Role of Automatic Pollen and Fungal Spore Monitoring Across Major End-User Domains. Aerobiologia 2024, 40, 57–75. [Google Scholar] [CrossRef]
  22. Giesecke, T.; Fontana, S.L.; van der Knaap, W.O.; Pardoe, H.S.; Pidek, I.A. From early pollen trapping experiments to the Pollen Monitoring Programme. Veg. Hist. Archaeobotany 2010, 19, 247–258. [Google Scholar] [CrossRef]
  23. Dell’Anna, R.; Lazzeri, P.; Frisanco, M.; Monti, F.; Malvezzi Campeggi, F.; Gottardini, E.; Bersani, M. Pollen discrimination and classification by Fourier transform infrared (FT-IR) microspectroscopy and machine learning. Anal. Bioanal. Chem. 2009, 394, 1443–1452. [Google Scholar] [CrossRef] [PubMed]
  24. Šaulien, I.; Šukien, L.; Daunys, G.; Valiulis, G.; Vaitkevicius, L.; Matavulj, P.; Brdar, S.; Panic, M.; Sikoparija, B.; Clot, B.; et al. Automatic pollen recognition with the Rapid-E particle counter; the first-level procedure; experience and next steps. Atmos. Meas. Tech. 2019, 12, 3435–3452. [Google Scholar] [CrossRef]
  25. Sauvageat, E.; Zeder, Y.; Tummon, F.; Clot, B.; Crouzy, B.; Konzelmann, T.; Lieberherr, G.; Tummon, F.; Vasilatou, K. Online pollen monitoring using digital holography. Atmos. Meas. Tech. 2020, 13, 1539–1550. [Google Scholar] [CrossRef]
  26. Tummon, F.; Bruffaerts, N.; Celenk, S.; Choël, M.; Clot, B.; Crouzy, B.; Galán, C.; Gilge, S.; Hajkova, L.; Mokin, V.; et al. Towards standardisation of automatic pollen and fungal spore monitoring: Best practices and guidelines. Aerobiologia 2024, 40, 39–55. [Google Scholar] [CrossRef]
  27. Oteros, J.; Pusch, G.; Weichenmeier, I.; Heimann, U.; Möller, R.; Röseler, S.; Traidl-Hoffmann, C.; Schmidt-Weber, C.B.; Buters, J. Automatic and Online Pollen Monitoring. Int. Arch. Allergy Immunol. 2015, 167, 158–166. [Google Scholar] [CrossRef]
  28. Renard, J.-B.; El Azari, H.; Lauthier, J.; Surcin, J. Spatial Variation of Airborne Pollen Concentrations Locally around Brussels City, Belgium, during a Field Campaign in 2022–2023, Using the Automatic Sensor Beenose. Sensors 2024, 24, 3731. [Google Scholar] [CrossRef]
  29. Montagne, R.; Pham-Thi, N.; Demoly, P. Aggravation des pollinoses: Résultats d’une enquête nationale auprès des médecins allergologues francophones. Rev. Française D’allergologie 2024, 64, 103905. (In French) [Google Scholar] [CrossRef]
  30. Brake, D.R.; Yaman, R.N.; Camargo, A.R.; Marks, L.A.; Maddux, J.T.; Ochkur, S.I.; Rank, M.A. Meteorological and environmental factors that impact pollen counts, allergenicity, and thresholds: A scoping review. Allergy Asthma Proc. 2023, 44, 229–236. [Google Scholar] [CrossRef]
  31. Caillaud, D.M.; Martin, S.; Ségala, C.; Vidal, P.; Lecadet, J.; Pellier, S.; Rouzaire, P.; Tridon, A.; Evrard, B. Airborne pollen levels and drug consumption for seasonal allergic rhinoconjunctivitis: A 10-year study in France. Allergy 2015, 70, 99–106. [Google Scholar] [CrossRef]
  32. Guillam, M.T.; Ségala, C. Pollen et effets sanitaires: Synthése des études épidémiologiques. Rev. Française D’allergologie D’immunologie Clin. 2008, 48, 14–19. [Google Scholar] [CrossRef]
  33. Caillaud, D.; Martin, S.; Segala, C.; Besancenot, J.-P.; Clot, B.; Thibaudon, M. Effects of Airborne Birch Pollen Levels on Clinical Symptoms of Seasonal Allergic Rhinoconjunctivitis. Int. Arch. Allergy Immunol. 2014, 163, 43–50. [Google Scholar] [CrossRef] [PubMed]
  34. Pfaar, O.; Karatzas, K.; Bastl, K.; Berger, U.; Buters, J.; Darsow, U.; Demoly, P.; Durham, S.R.; Galán, C.; Gehrig, R.; et al. Pollen season is reflected on symptom load for grass and birch pollen-induced allergic rhinitis in different geographic areas—An EAACI Task Force Report. Allergy 2020, 75, 1099–1106. [Google Scholar] [CrossRef] [PubMed]
  35. Saha, S.; Vaidyanathan, A.; Lo, F.; Brown, C.; Hess, J.J. Short Term Physician Visits and Medication Prescriptions for Allergic Disease Associated with Seasonal Tree, Grass, and Weed Pollen Exposure Across the United States. Environ. Health 2021, 20, 85. [Google Scholar] [CrossRef] [PubMed]
  36. Luyten, A.; Bürgler, A.; Glick, S.; Kwiatkowski, M.; Gehrig, R.; Beigi, M.; Hartmann, K.; Eeftens, M. Ambient pollen exposure and pollen allergy symptom severity in the EPOCHAL study. Allergy 2024, 79, 1908–1920. [Google Scholar] [CrossRef]
  37. Renard, J.-B.; El Azari, H.; Richard, J.; Lauthier, J.; Surcin, J. Towards an Automatic Pollen Detection System in Ambient Air Using Scattering Functions in the Visible Domain. Sensors 2022, 22, 4984. [Google Scholar] [CrossRef]
  38. El Azari, H.; Renard, J.-B.; Lauthier, J.; Dudok deWitt, T. A Laboratory Evaluation of the new automated pollen sensor Beenose: Pollen discrimination using machine learning techniques. Sensors 2023, 23, 2964. [Google Scholar] [CrossRef]
  39. Adamov, S.; Lemonis, N.; Clot, B.; Crouzy, B.; Gehrig, R.; Graber, M.J.; Sallin, C.; Tummon, F. On the measurement uncertainty of Hirst-type volumetric pollen and spore samplers. Aerobiologia 2021, 40, 77–91. [Google Scholar] [CrossRef]
  40. Galán, C.; Smith, M.; Thibaudon, M.; Frenguelli, G.; Oteros, J.; Gehrig, R.; Berger, U.; Clot, B.; Brandao, R. Pollen monitoring: Minimum requirements and reproducibility of analysis. Aerobiologia 2014, 30, 385–395. [Google Scholar] [CrossRef]
  41. Suarez-Suarez, M.; Maya-Manzano, J.M.; Clot, B.; Graber, M.J.; Sallin, C.; Tummon, F.; Buters, J. Accuracy of a hand-held resistance-free flowmeters for flow adjustments of Hirst-Type pollen traps. Aerobiologia 2023, 39, 143–148. [Google Scholar] [CrossRef]
  42. Andersson, K.; Lidholm, J. Characteristics and immunobiology of grass pollen allergens. Int. Arch. Allergy Immunol. 2003, 130, 87–107. [Google Scholar] [CrossRef]
  43. Kiotseridis, H.; Cilio, C.M.; Bjermer, L.; Tunsäter, A.; Jacobsson, H.; Dahl, Å. Grass pollen allergy in children and adolescents-symptoms, health related quality of life and the value of pollen prognosis. Clin. Transl. Allergy 2013, 3, 19. [Google Scholar] [CrossRef] [PubMed]
  44. Sedghy, F.; Varasteh, A.R.; Sankian, M.; Moghadam, M. Interaction Between Air Pollutants and Pollen Grains, the Role on the Rising Trend in Allergy. Rep. Biochem. Mol. Biol. 2018, 6, 219–224. [Google Scholar] [PubMed]
  45. Berger, M.; Bastl, M.; Bouchal, J.; Dirr, L.; Berger, U. The influence of air pollution on pollen allergy sufferers. Allergol. Sel. 2021, 5, 345–348. [Google Scholar] [CrossRef] [PubMed]
Figure 1. Locations of the pollen sensors (North is up).
Atmosphere 16 00271 g001
Figure 2. Example of the questionnaire on the LivePollen app.
Atmosphere 16 00271 g002
Figure 3. Temporal evolution in 2023 of daily total concentrations for Beenose and Hirst (the thin line represents the unsmoothed data). The Beenose corrected data correspond to the initial values divided by 1.8 for the 20 March to 30 April period.
Atmosphere 16 00271 g003
Figure 4. Temporal evolution in 2023 of daily total concentrations for Beenose and Hirst. The Beenose corrected data correspond to the initial values divided by 1.8 for the 20 March to 30 April period.
Atmosphere 16 00271 g004
Figure 5. Comparison between Beenose measurements shifted by one day and LivePollen reports.
Atmosphere 16 00271 g005
Figure 6. Scatter plot of Beenose measurements shifted by one day and LivePollen reports.
Atmosphere 16 00271 g006
Figure 7. Concentrations by species obtained by Beenose (shifted by one day) and LivePollen reports, over the entire period.
Atmosphere 16 00271 g007
Figure 8. Heatmaps for the allergic symptom reports. The city of Metz is in the center of the map. Left: for the Betulaceae, on April 2023. Right: on June 2023 for grass. The coldest colours (blue) are for the areas with the fewest reports, and the warmest (red) are for the areas collecting the most reports. The maps were produced using the OpenStreetMap layer software.
Atmosphere 16 00271 g008
Figure 9. Temporal evolution of PM10 pollution; red dotted line: authorized daily limit. Reference air quality data obtained by the Atmo Grand Est network.
Atmosphere 16 00271 g009
Table 1. Pearson correlation coefficients for concentrations measured by Hirst and Beenose for the different species studied over the entire period.
AshBetulaceaeOakGrass
Pearson coefficient0.940.860.880.95
Table 2. Correlation between total concentration and reports evaluated by Pearson and Spearman correlation coefficients.
Without
Entire Season
Shift
from 2 April 2023
With One
Entire Season
Day Shift
from 2 April 2023
Pearson coefficient0.810.890.870.93
Spearman coefficient0.860.880.920.92
Table 3. Correlation coefficients between Beenose concentrations by species and reports.
BetulaceaeGrass
Pearson coefficient0.870.79
Spearman coefficient0.920.82
Table 4. Correlation coefficients between Hirst concentrations by species and reports.
BetulaceaeGrass
Pearson coefficient0610.84
Spearman coefficient0.810.81
Disclaimer/Publisher’s Note: The statements, opinions and data contained in all publications are solely those of the individual author(s) and contributor(s) and not of MDPI and/or the editor(s). MDPI and/or the editor(s) disclaim responsibility for any injury to people or property resulting from any ideas, methods, instructions or products referred to in the content.

