
Asymmetrical Time-Lagged Response of Vegetation to Drought and Extreme Precipitation Across China


Abstract
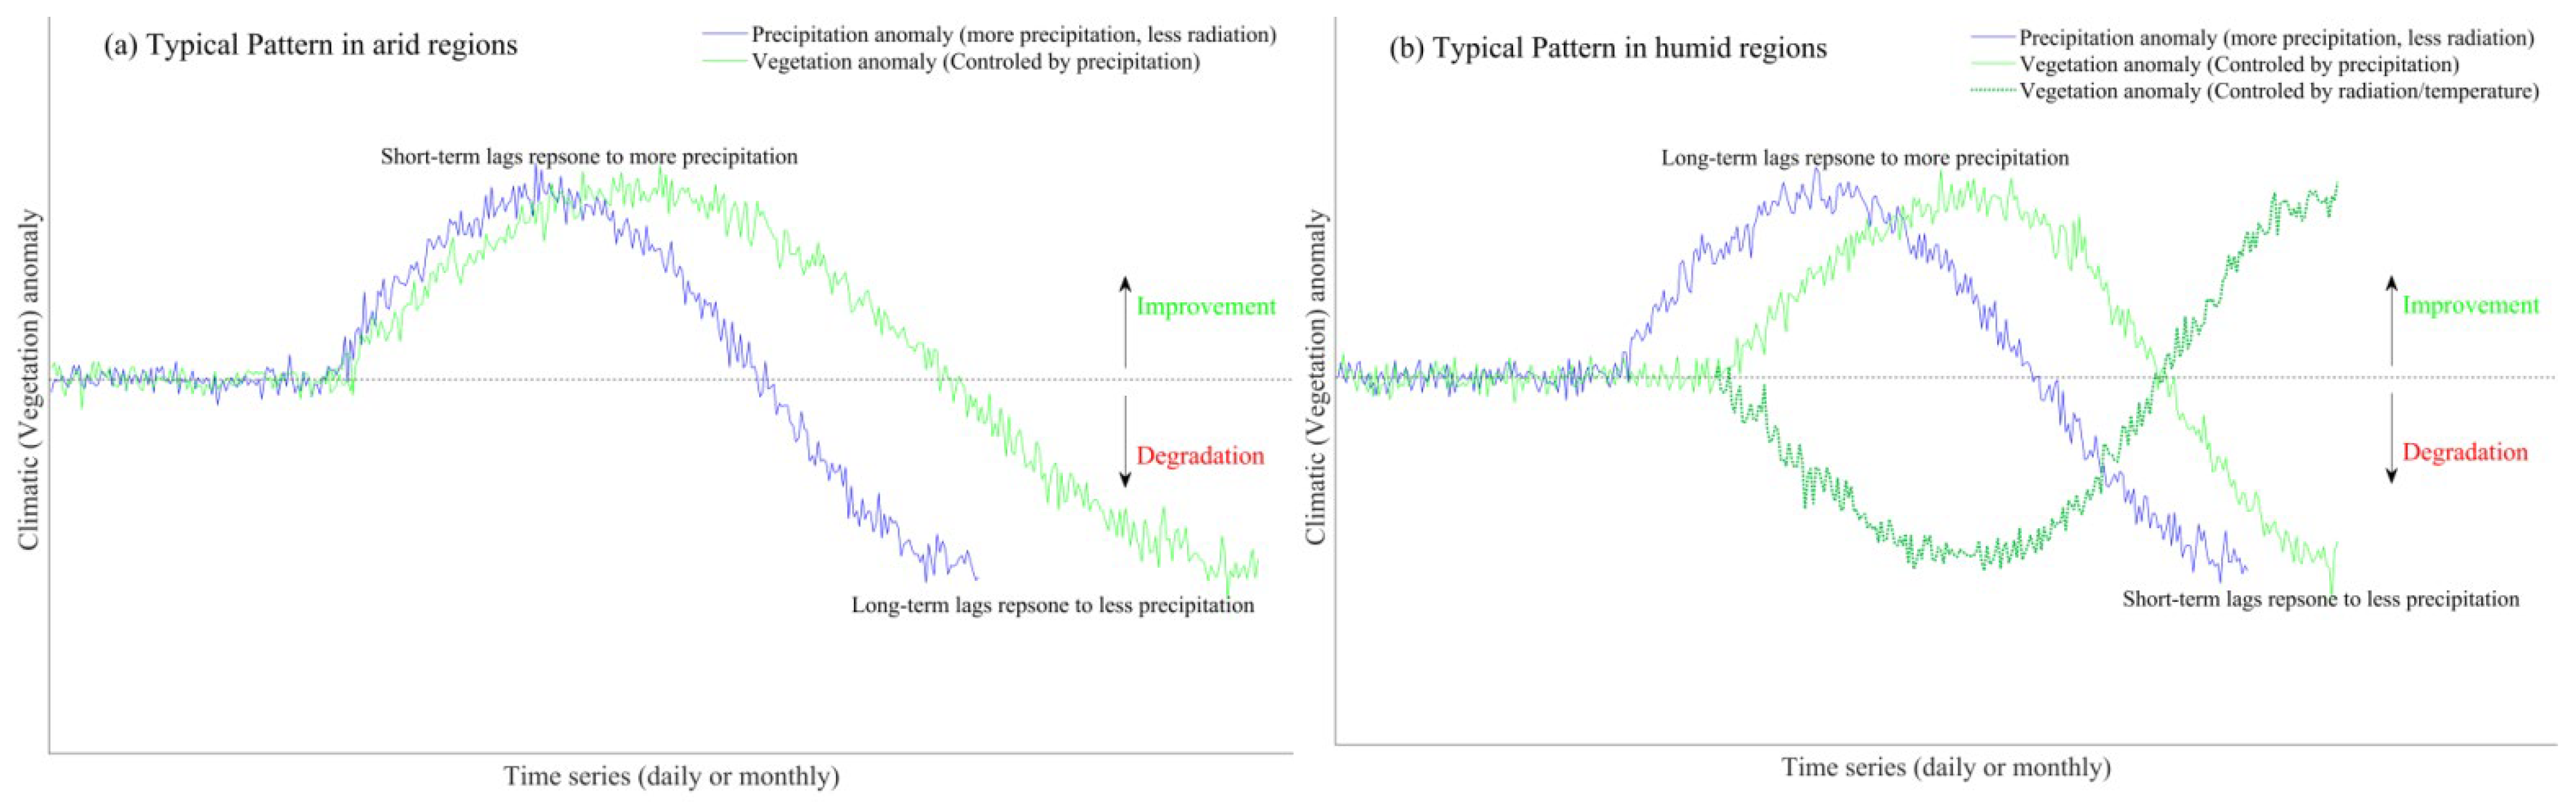
1. Introduction
2. Data and Methods
2.1. Data Processing and Controls for Consistency
2.2. Assessment of Precipitation Extremes and Droughts
2.3. Time Lags in the Response of Vegetation to Precipitation Extremes and Droughts
2.4. Eliminating Seasonal Fluctuations
3. Results
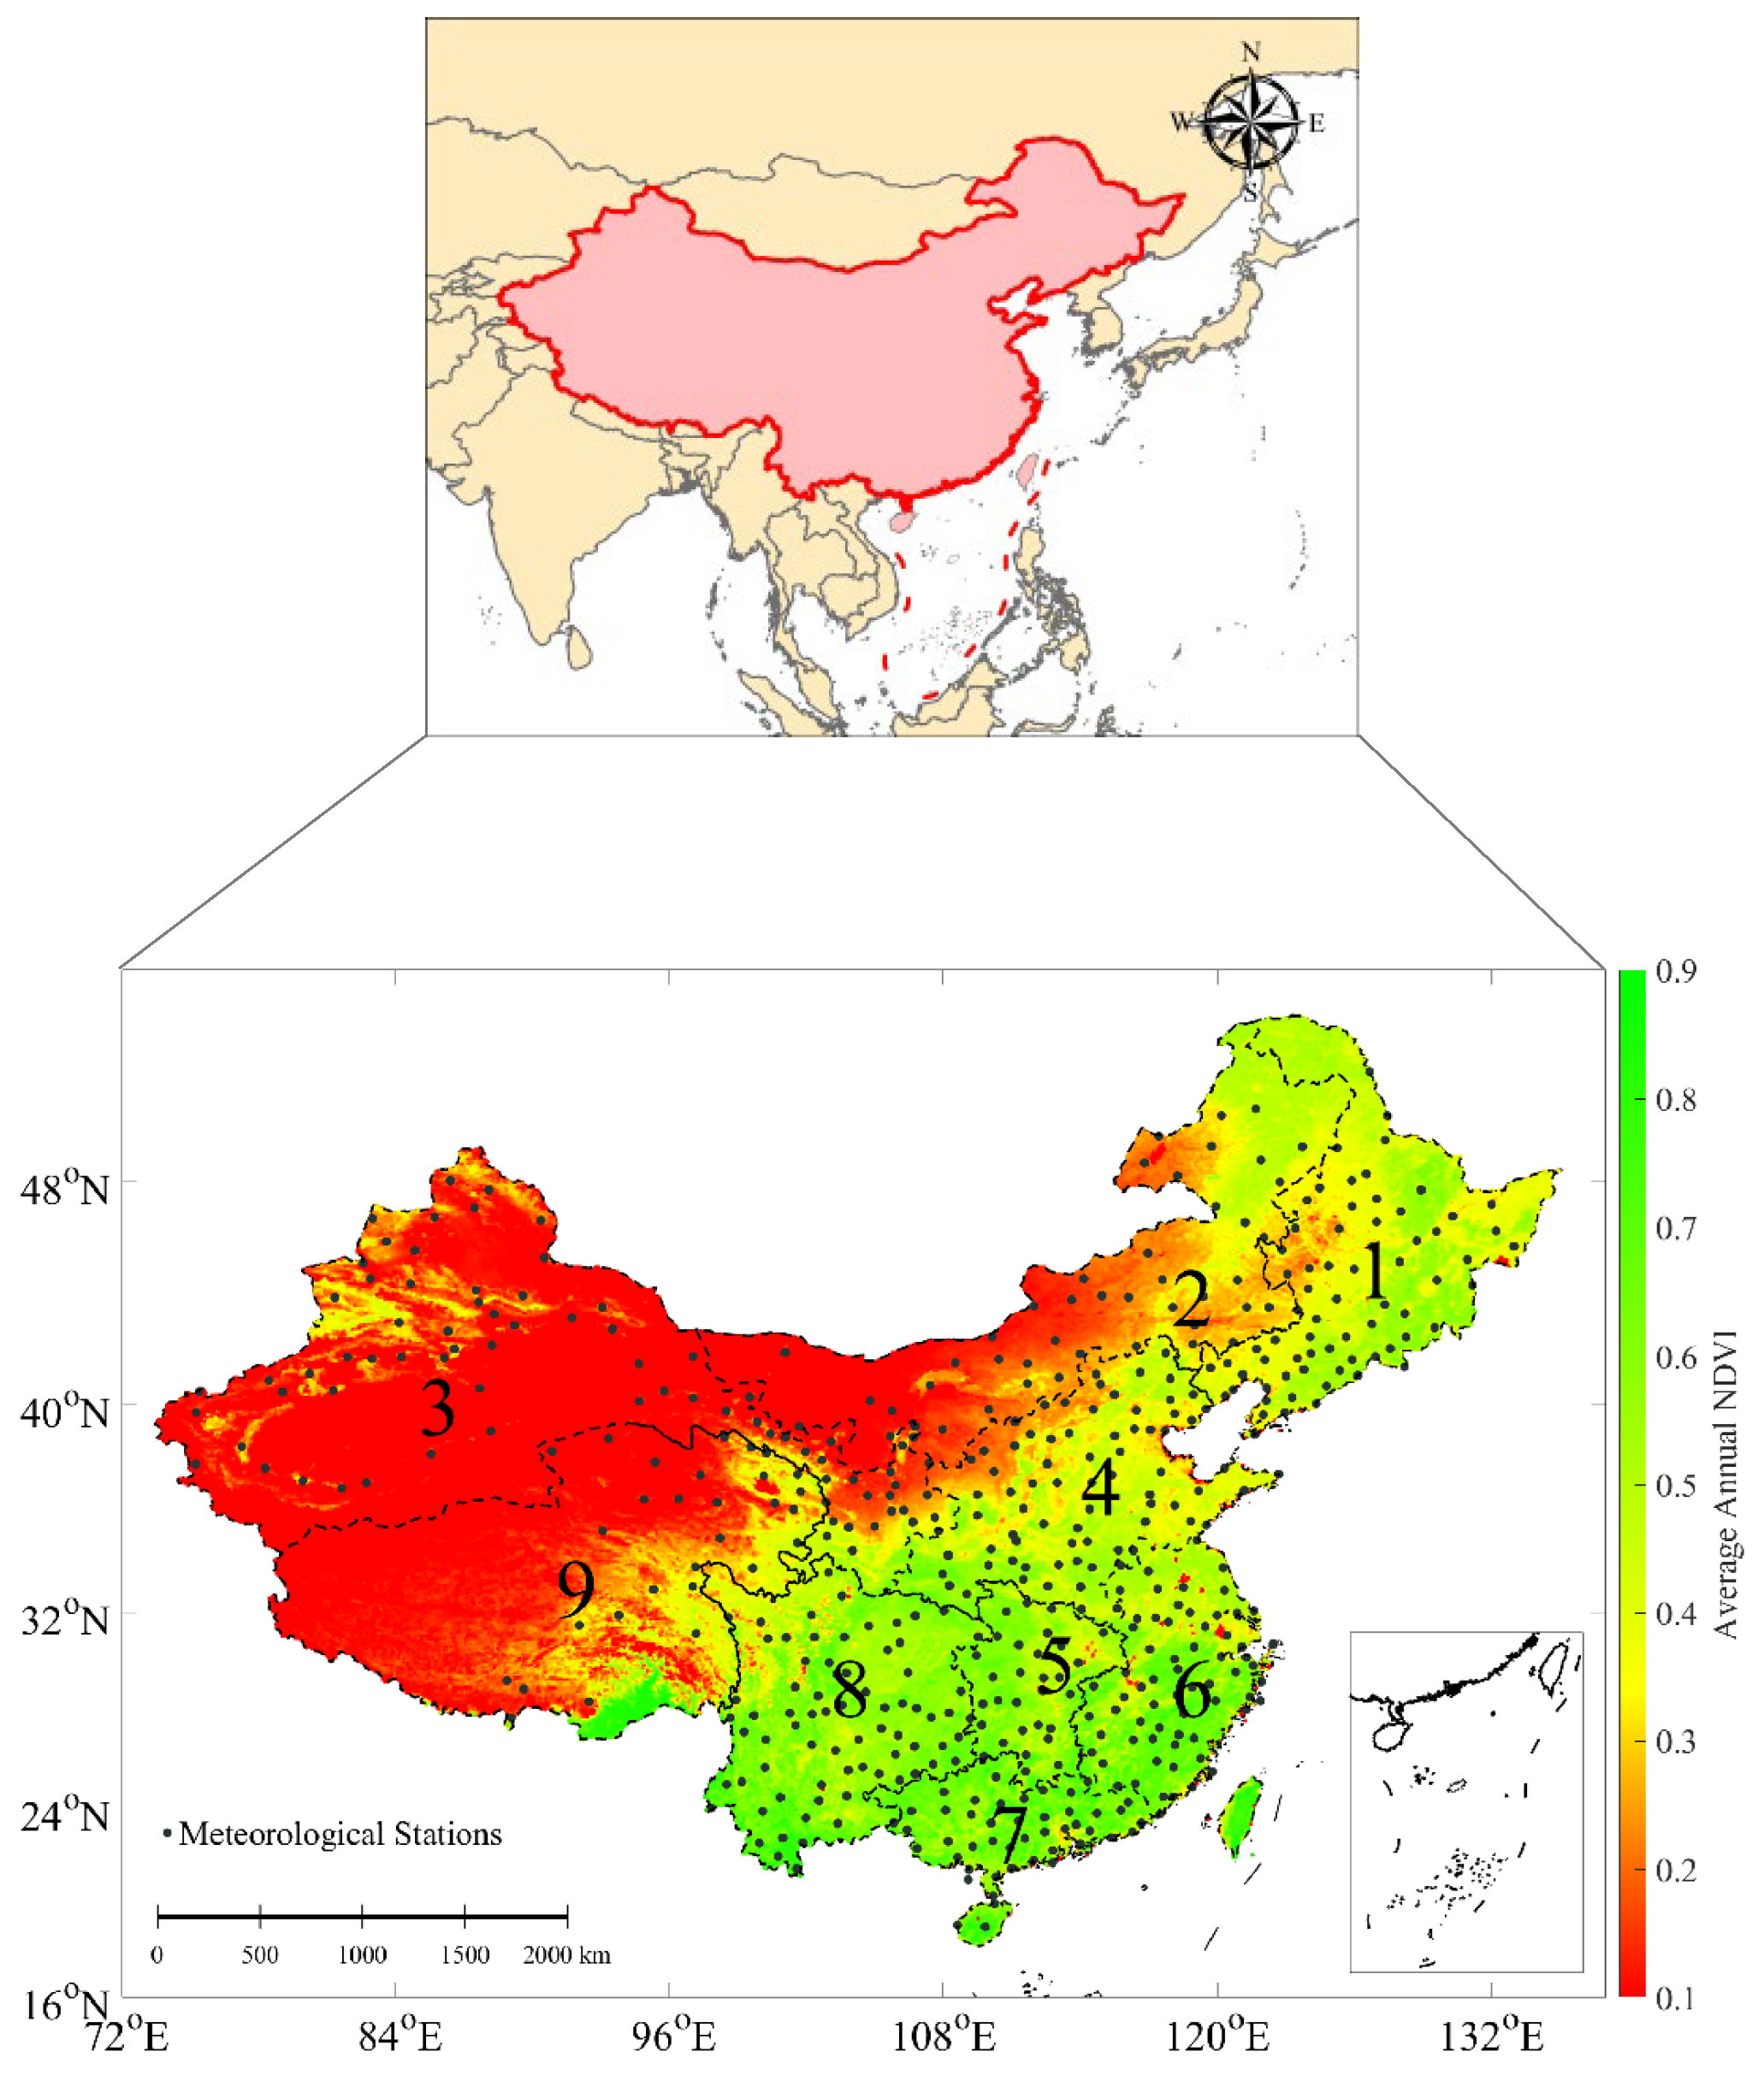
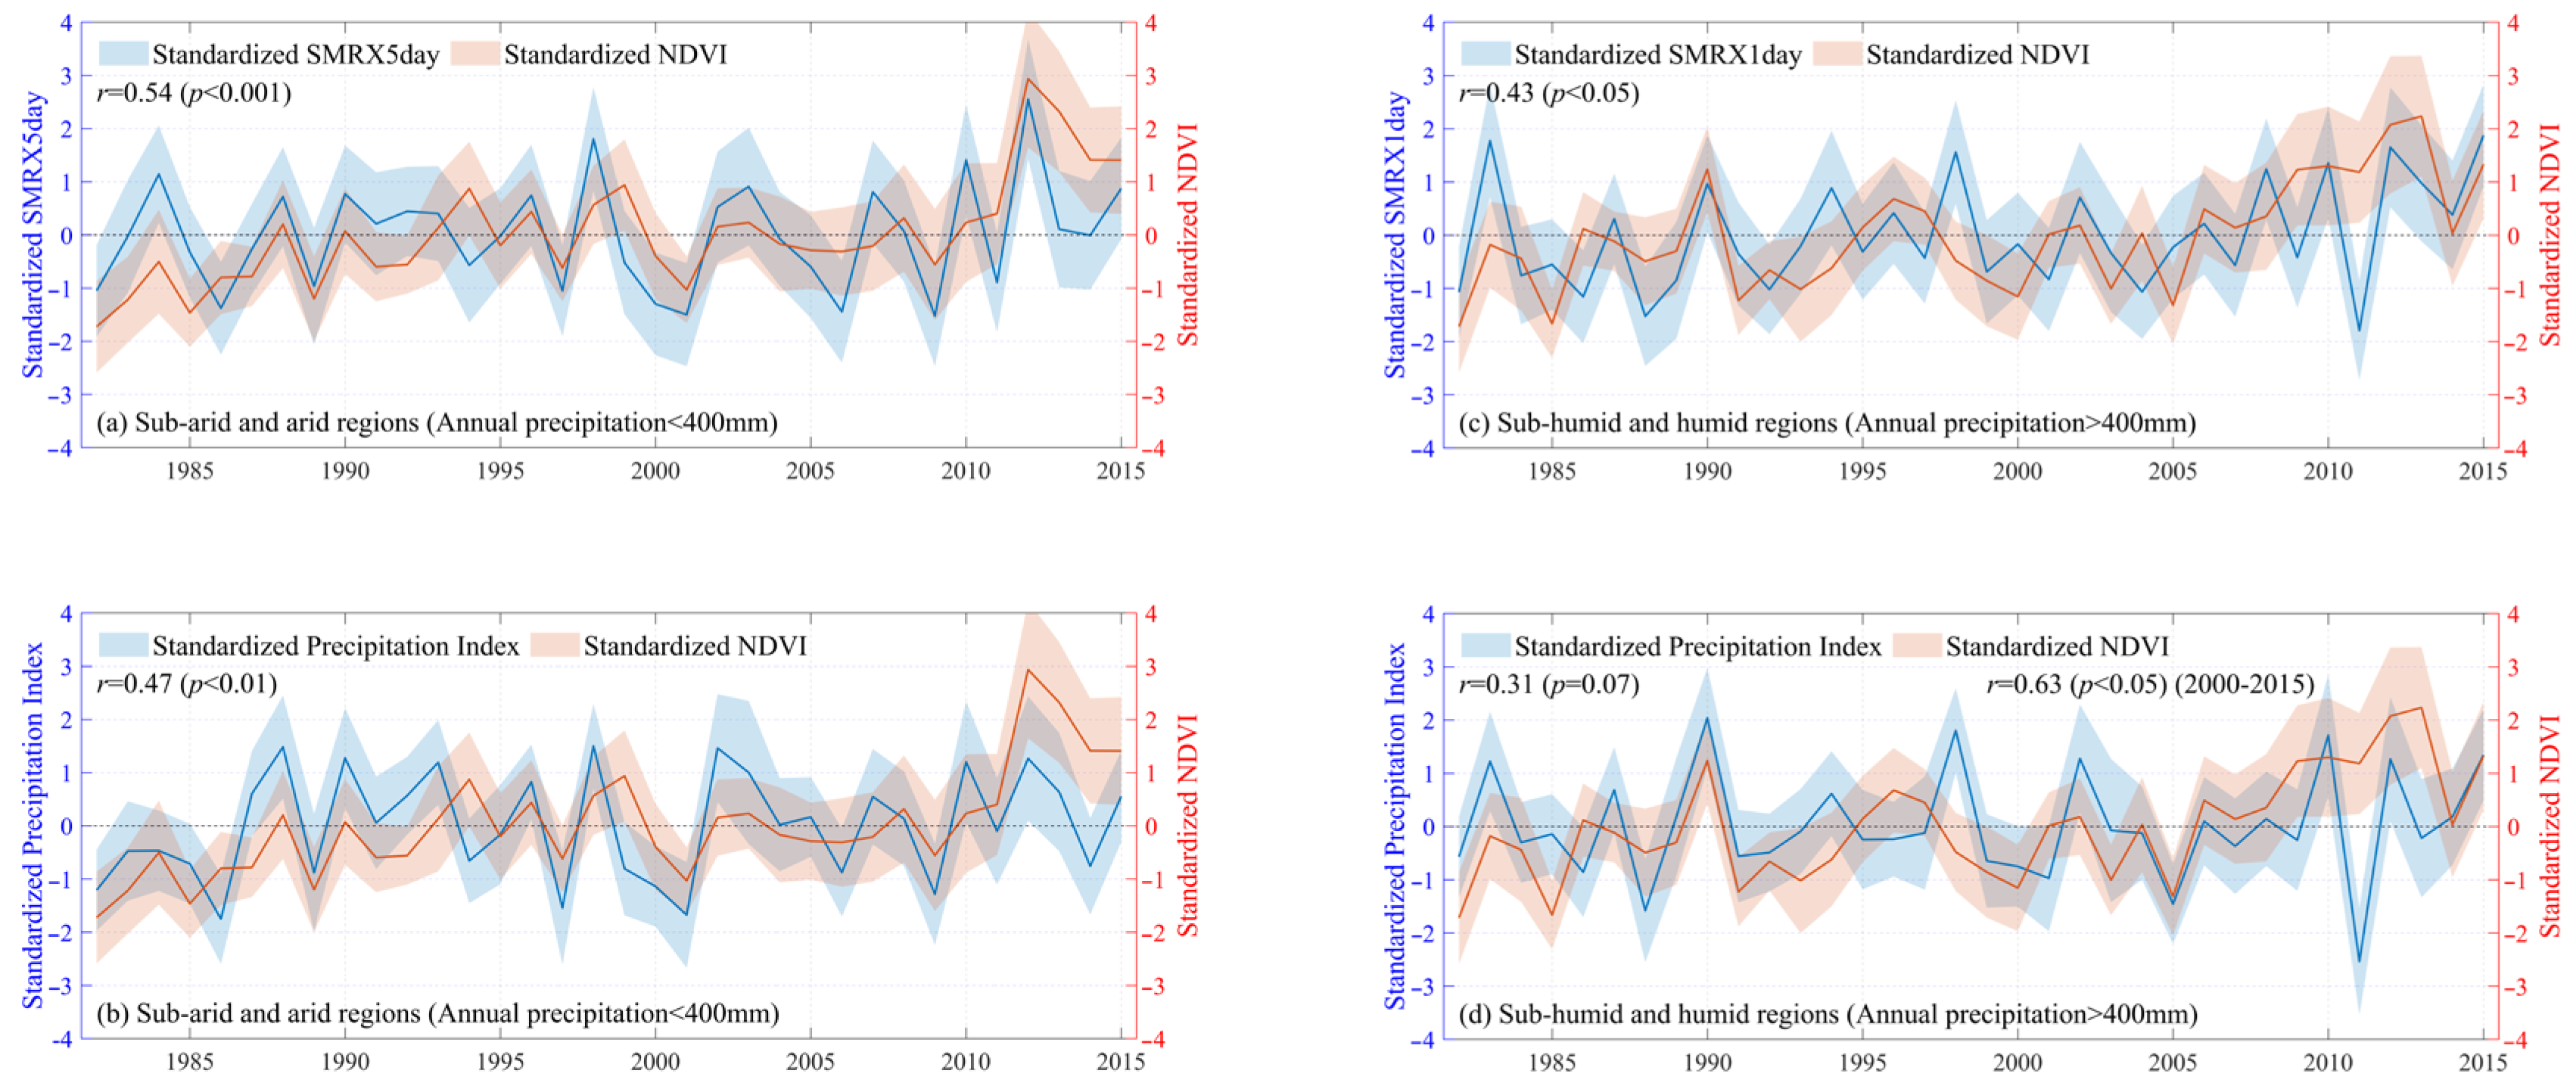
3.1. Spatial Relationship Between Precipitation and Vegetation
3.2. The Response of Vegetation to Extreme Precipitation and Droughts Across China
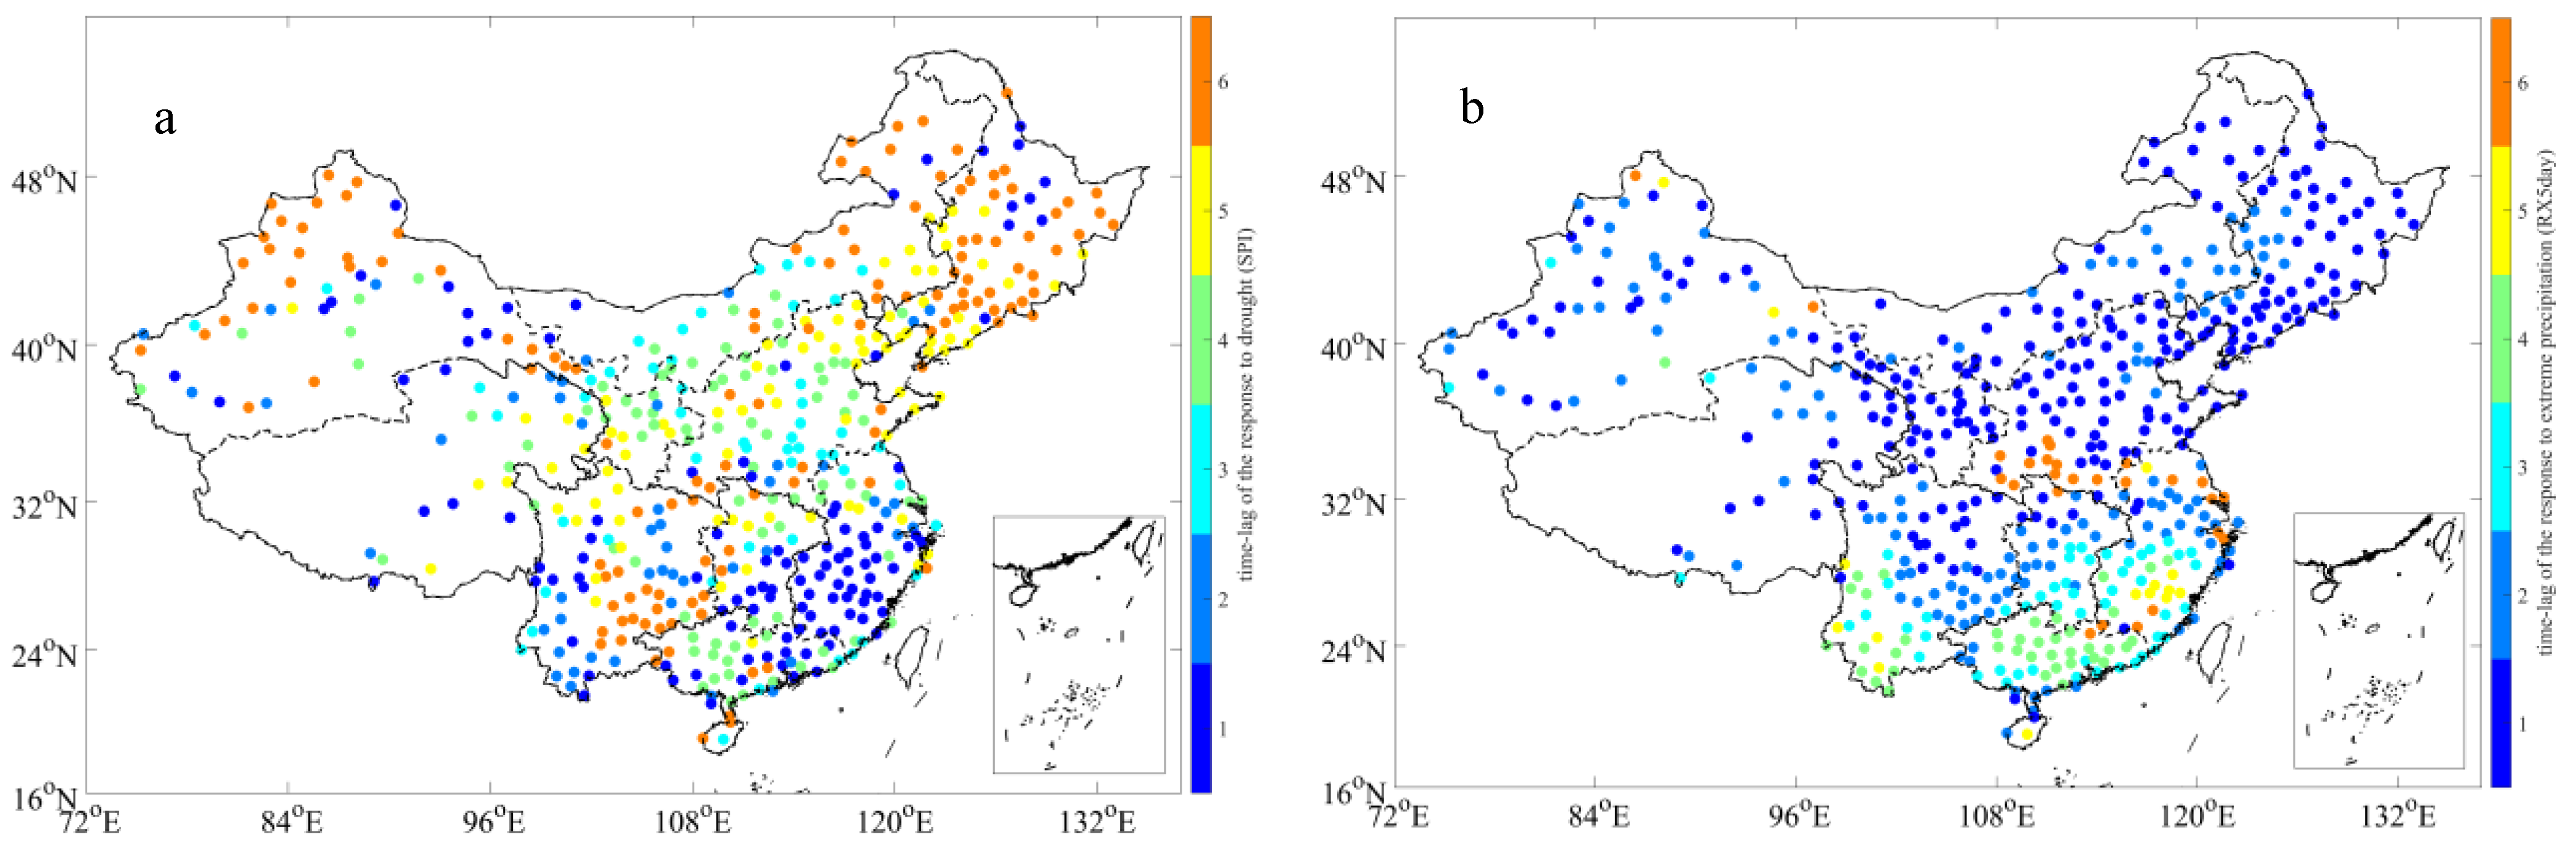
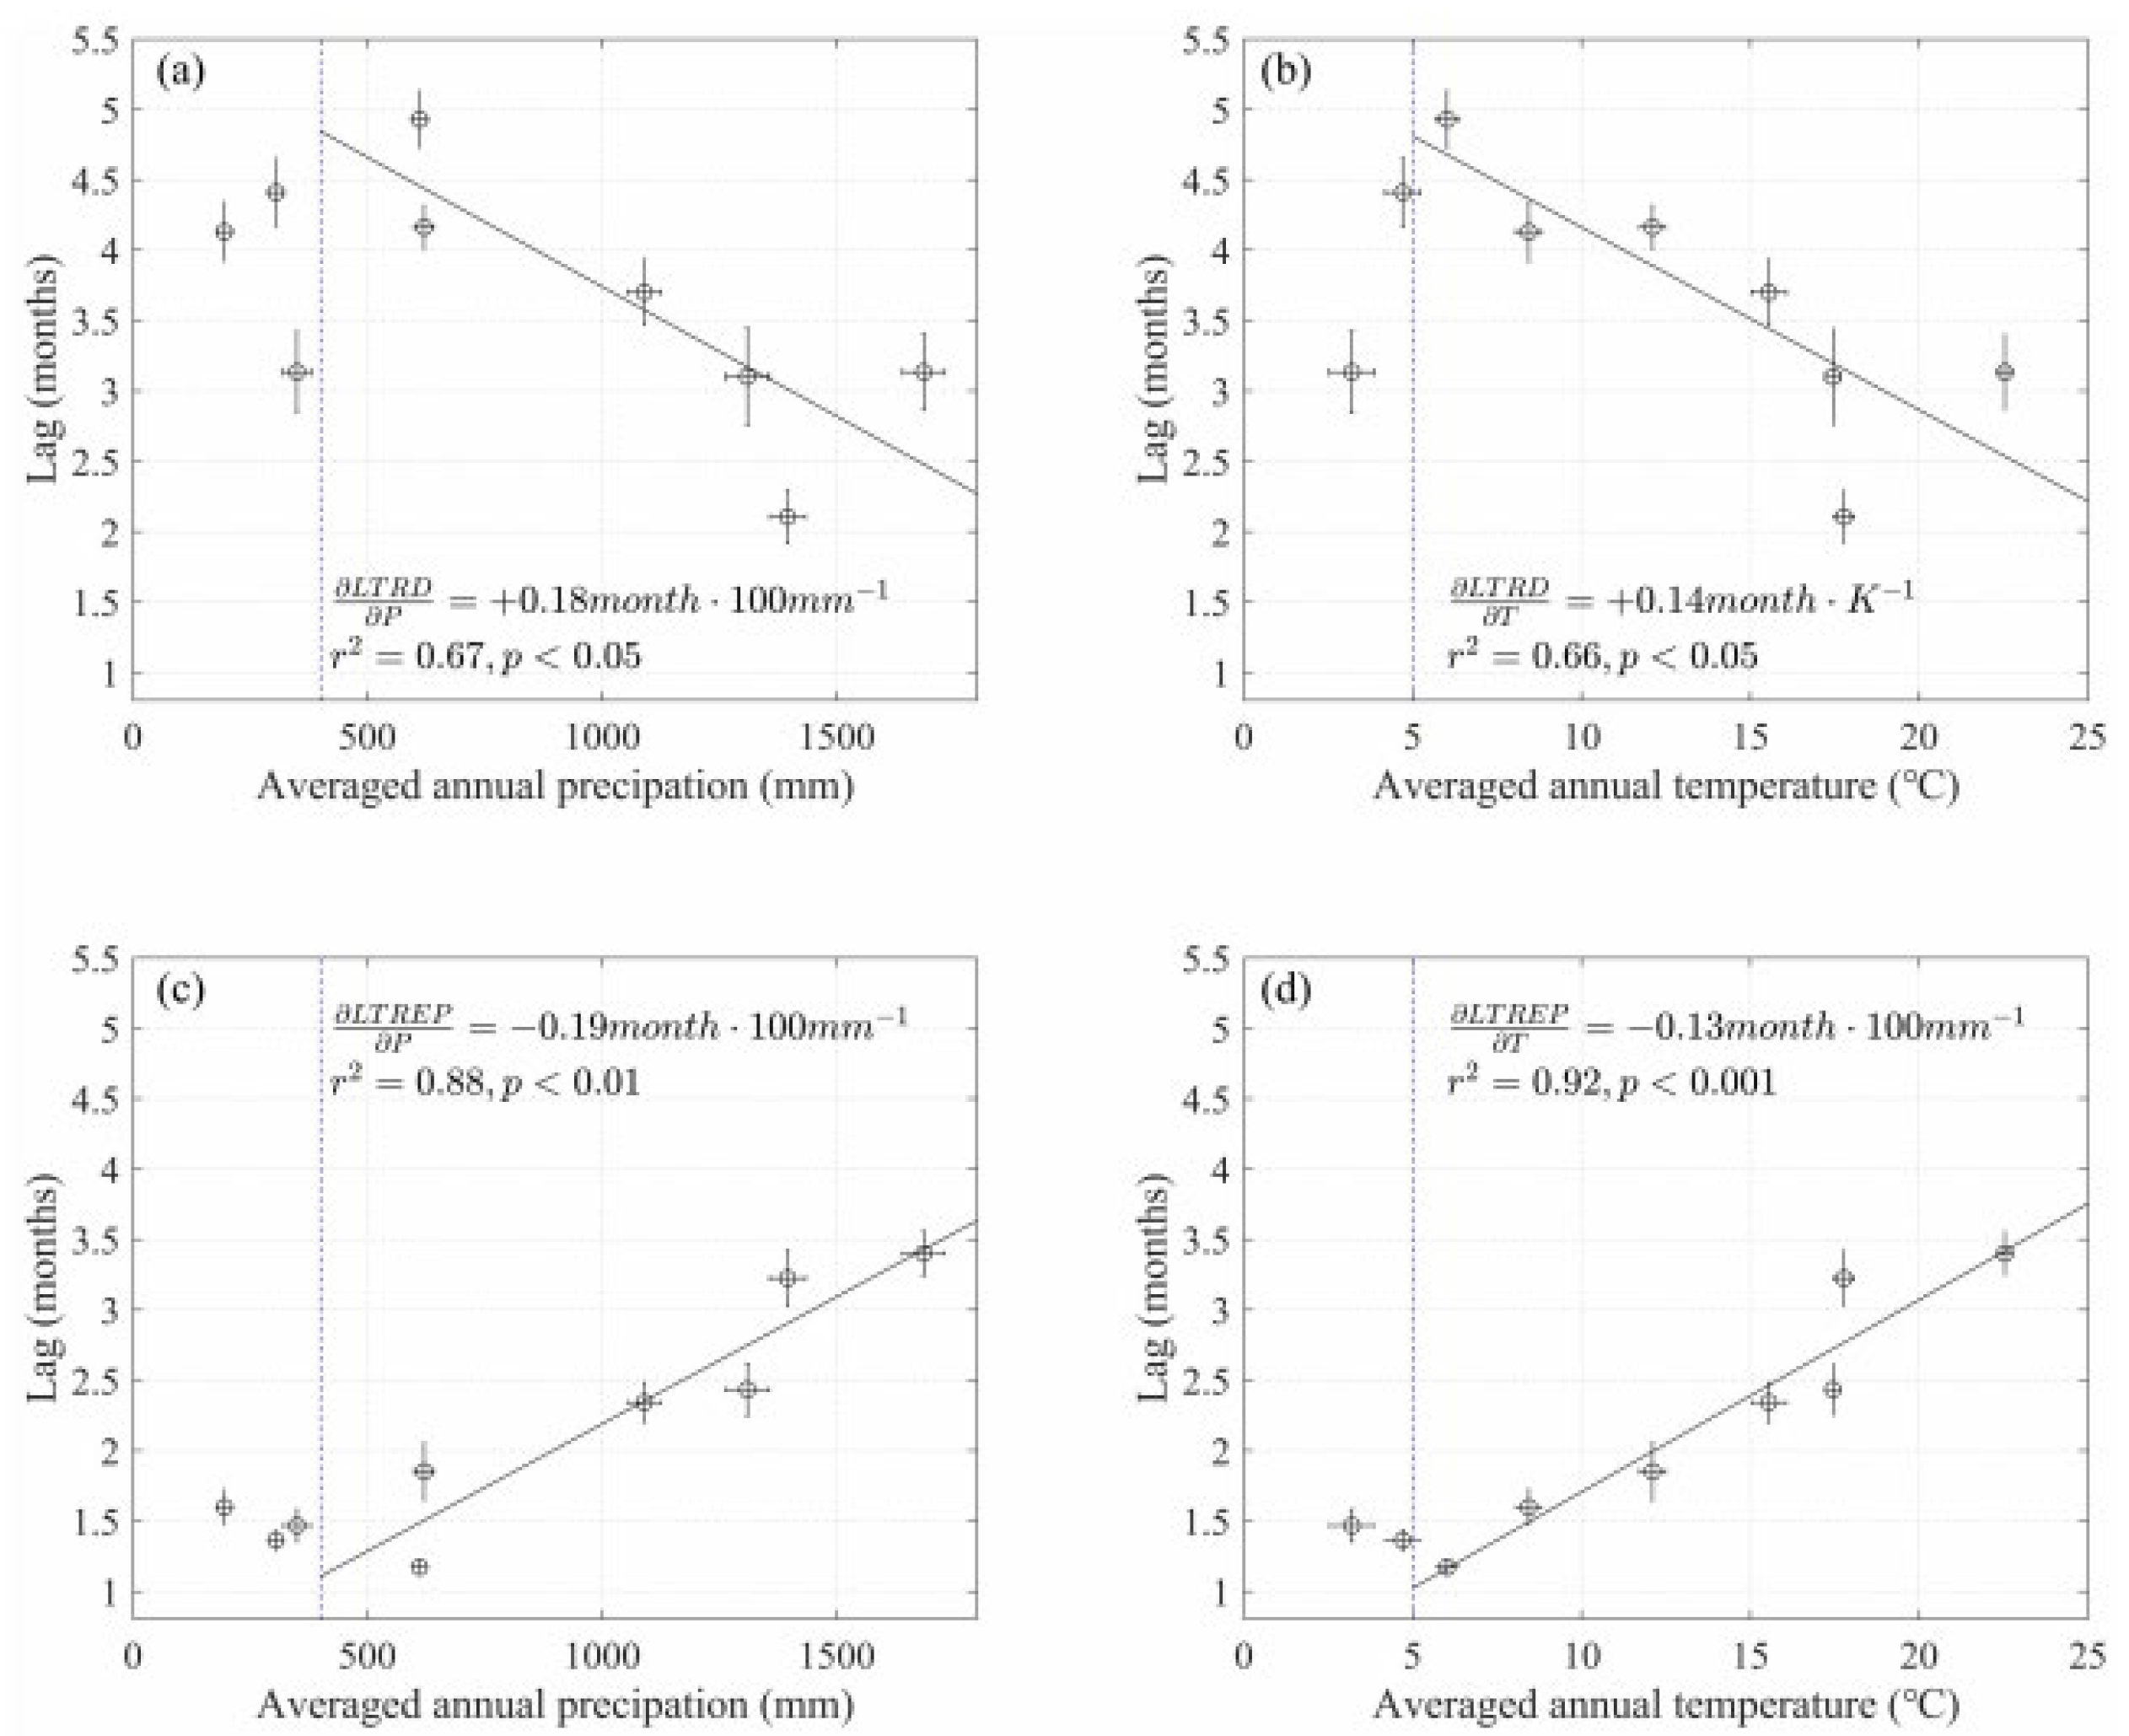
3.3. Time-Lagged Response of Vegetation to Droughts and Extreme Precipitation
4. Discussion
5. Conclusions
Author Contributions
Funding
Institutional Review Board Statement
Informed Consent Statement
Data Availability Statement
Conflicts of Interest
References
- Zhang, Y.; Gentine, P.; Luo, X.; Lian, X.; Liu, Y.; Zhou, S.; Michalak, A.M.; Sun, W.; Fisher, J.B.; Piao, S.; et al. Increasing Sensitivity of Dryland Vegetation Greenness to Precipitation Due to Rising Atmospheric CO2. Nat. Commun. 2022, 13, 4875. [Google Scholar] [CrossRef]
- Jiao, W.; Wang, L.; Smith, W.K.; Chang, Q.; Wang, H.; D’Odorico, P. Observed Increasing Water Constraint on Vegetation Growth over the Last Three Decades. Nat. Commun. 2021, 12, 3777. [Google Scholar] [CrossRef]
- Vicente-Serrano, S.M.; Domínguez-Castro, F.; Murphy, C.; Peña-Angulo, D.; Tomas-Burguera, M.; Noguera, I.; López-Moreno, J.I.; Juez, C.; Grainger, S.; Eklundh, L.; et al. Increased Vegetation in Mountainous Headwaters Amplifies Water Stress During Dry Periods. Geophys. Res. Lett. 2021, 48, e2021GL094672. [Google Scholar] [CrossRef]
- Trenberth, K.E.; Fasullo, J.T.; Shepherd, T.G. Attribution of Climate Extreme Events. Nat. Clim. Change 2015, 5, 725–730. [Google Scholar] [CrossRef]
- Thornton, P.K.; Ericksen, P.J.; Herrero, M.; Challinor, A.J. Climate Variability and Vulnerability to Climate Change: A Review. Glob. Change Biol. 2014, 20, 3313–3328. [Google Scholar] [CrossRef] [PubMed]
- Rahmstorf, S.; Coumou, D. Increase of Extreme Events in a Warming World. Proc. Natl. Acad. Sci. USA 2011, 108, 17905–17909. [Google Scholar] [CrossRef] [PubMed]
- Meehl, G.A.; Zwiers, F.; Evans, J.; Knutson, T.; Mearns, L.; Whetton, P. Trends in Extreme Weather and Climate Events: Issues Related to Modeling Extremes in Projections of Future Climate Change. Bull. Am. Meteorol. Soc. 2000, 81, 427–436. [Google Scholar] [CrossRef]
- Zscheischler, J.; Lehner, F. Attributing Compound Events to Anthropogenic Climate Change. Bull. Am. Meteorol. Soc. 2022, 103, E936–E953. [Google Scholar] [CrossRef]
- Rajah, K.; O’Leary, T.; Turner, A.; Petrakis, G.; Leonard, M.; Westra, S. Changes to the Temporal Distribution of Daily Precipitation. Geophys. Res. Lett. 2014, 41, 8887–8894. [Google Scholar] [CrossRef]
- Zhang, W.; Zhou, T. Increasing Impacts from Extreme Precipitation on Population over China with Global Warming. Sci. Bull. 2020, 65, 243–252. [Google Scholar] [CrossRef]
- Zhang, J.; Sun, F.; Lai, W.; Lim, W.H.; Liu, W.; Wang, T.; Wang, P. Attributing Changes in Future Extreme Droughts Based on PDSI in China. J. Hydrol. 2019, 573, 607–615. [Google Scholar] [CrossRef]
- Jasechko, S.; Perrone, D. California’s Central Valley Groundwater Wells Run Dry During Recent Drought. Earths Future 2020, 8, e2019EF001339. [Google Scholar] [CrossRef]
- King, A.D.; Pitman, A.J.; Henley, B.J.; Ukkola, A.M.; Brown, J.R. The Role of Climate Variability in Australian Drought. Nat. Clim. Change 2020, 10, 177–179. [Google Scholar] [CrossRef]
- Jiang, P.; Wang, Y.; Yang, Y.; Gu, X.; Huang, Y.; Liu, L.; Liu, L. Spatiotemporal Features and Time-Lagged Effects of Drought on Terrestrial Ecosystem in Southwest China. Forests 2023, 14, 781. [Google Scholar] [CrossRef]
- Praharaj, S.; Chen, T.D.; Zahura, F.T.; Behl, M.; Goodall, J.L. Estimating Impacts of Recurring Flooding on Roadway Networks: A Norfolk, Virginia Case Study. Nat. Hazards 2021, 107, 2363–2387. [Google Scholar] [CrossRef]
- Yang, W.; Yang, H.; Yang, D. Classifying Floods by Quantifying Driver Contributions in the Eastern Monsoon Region of China. J. Hydrol. 2020, 585, 124767. [Google Scholar] [CrossRef]
- Schmidt, L.; Heße, F.; Attinger, S.; Kumar, R. Challenges in Applying Machine Learning Models for Hydrological Inference: A Case Study for Flooding Events Across Germany. Water Resour. Res. 2020, 56, e2019WR025924. [Google Scholar] [CrossRef]
- Anderson, W.B.; Seager, R.; Baethgen, W.; Cane, M.; You, L. Synchronous Crop Failures and Climate-Forced Production Variability. Sci. Adv. 2019, 5, eaaw1976. [Google Scholar] [CrossRef]
- Avetisyan, D.; Borisova, D.; Velizarova, E. Integrated Evaluation of Vegetation Drought Stress through Satellite Remote Sensing. Forests 2021, 12, 974. [Google Scholar] [CrossRef]
- Zhao, J.; Huang, S.; Huang, Q.; Wang, H.; Leng, G.; Fang, W. Time-Lagged Response of Vegetation Dynamics to Climatic and Teleconnection Factors. Catena 2020, 189, 104474. [Google Scholar] [CrossRef]
- Wang, M.; An, Z.; Wang, S. The Time Lag Effect Improves Prediction of the Effects of Climate Change on Vegetation Growth in Southwest China. Remote Sens. 2022, 14, 5580. [Google Scholar] [CrossRef]
- Vicente-Serrano, S.M.; Gouveia, C.; Camarero, J.J.; Beguería, S.; Trigo, R.; López-Moreno, J.I.; Azorín-Molina, C.; Pasho, E.; Lorenzo-Lacruz, J.; Revuelto, J.; et al. Response of Vegetation to Drought Time-Scales across Global Land Biomes. Proc. Natl. Acad. Sci. USA 2013, 110, 52–57. [Google Scholar] [CrossRef] [PubMed]
- Jiang, H.; Xu, X. Impact of Extreme Climates on Vegetation from Multiple Scales and Perspectives in the Agro-Pastural Transitional Zone of Northern China in the Past Three Decades. J. Clean. Prod. 2022, 372, 133459. [Google Scholar] [CrossRef]
- Shi, X.; Chen, F.; Shi, M.; Ding, H.; Li, Y. Construction and Application of Optimized Comprehensive Drought Index Based on Lag Time: A Case Study in the Middle Reaches of Yellow River Basin, China. Sci. Total Environ. 2023, 857, 159692. [Google Scholar] [CrossRef] [PubMed]
- Cui, L.; Shi, J. Temporal and Spatial Response of Vegetation NDVI to Temperature and Precipitation in Eastern China. J. Geogr. Sci. 2010, 20, 163–176. [Google Scholar] [CrossRef]
- Guo, L.; Sun, F.; Liu, W.; Zhang, Y.; Wang, H.; Cui, H.; Wang, H.; Zhang, J.; Du, B. Response of Ecosystem Water Use Efficiency to Drought over China during 1982–2015: Spatiotemporal Variability and Resilience. Forests 2019, 10, 598. [Google Scholar] [CrossRef]
- Liu, K.; Harrison, M.T.; Archontoulis, S.V.; Huth, N.; Yang, R.; Liu, D.L.; Yan, H.; Meinke, H.; Huber, I.; Feng, P.; et al. Climate Change Shifts Forward Flowering and Reduces Crop Waterlogging Stress. Environ. Res. Lett. 2021, 16, 094017. [Google Scholar] [CrossRef]
- Liang, S.; Xu, D.; Luo, D.; Xiao, A.; Yuan, X. Study on the Impact of Land Use and Climate Change on the Spatiotemporal Evolution of Vegetation Cover in Chongqing, China. Atmosphere 2025, 16, 25. [Google Scholar] [CrossRef]
- Roebroek, C.T.J.; Melsen, L.A.; Hoek Van Dijke, A.J.; Fan, Y.; Teuling, A.J. Global Distribution of Hydrologic Controls on Forest Growth. Hydrol. Earth Syst. Sci. 2020, 24, 4625–4639. [Google Scholar] [CrossRef]
- Palmer, W.C. Meteorological Drought; U.S. Department of Commerce, Weather Bureau: Washington, DC, USA, 1965; Volume 30. [Google Scholar]
- McKee, T.B.; Doesken, N.J.; Kleist, J. The Relationship of Drought Frequency and Duration to Time Scales. In Proceedings of the 8th Conference on Applied Climatology, Anaheimet, CA, USA, 17–22 January 1993; Volume 17, pp. 179–183. [Google Scholar]
- Wen, Y.; Liu, X.; Yang, J.; Lin, K.; Du, G. NDVI Indicated Inter-Seasonal Non-Uniform Time-Lag Responses of Terrestrial Vegetation Growth to Daily Maximum and Minimum Temperature. Glob. Planet. Change 2019, 177, 27–38. [Google Scholar] [CrossRef]
- Luo, M.; Sa, C.; Meng, F.; Duan, Y.; Liu, T.; Bao, Y. Assessing Extreme Climatic Changes on a Monthly Scale and Their Implications for Vegetation in Central Asia. J. Clean. Prod. 2020, 271, 122396. [Google Scholar] [CrossRef]
- Ying, H.; Zhang, H.; Zhao, J.; Shan, Y.; Zhang, Z.; Guo, X.; Rihan, W.; Deng, G. Effects of Spring and Summer Extreme Climate Events on the Autumn Phenology of Different Vegetation Types of Inner Mongolia, China, from 1982 to 2015. Ecol. Indic. 2020, 111, 105974. [Google Scholar] [CrossRef]
- Xu, H.; Chen, H.; Wang, H. Detectable Human Influence on Changes in Precipitation Extremes Across China. Earths Future 2022, 10, e2021EF002409. [Google Scholar] [CrossRef]
- Guo, M.; Yue, W.; Wang, T.; Zheng, N.; Wu, L. Assessing the Use of Standardized Groundwater Index for Quantifying Groundwater Drought over the Conterminous US. J. Hydrol. 2021, 598, 126227. [Google Scholar] [CrossRef]
- Bai, X.; Fan, Z.; Yue, T. Dynamic pattern-effect relationships between precipitation and vegetation in the semi-arid and semi-humid area of China. Catena 2023, 232, 107425. [Google Scholar] [CrossRef]
- Lieth, H. Primary Production: Terrestrial Ecosystems. Hum. Ecol. 1973, 1, 303–332. [Google Scholar] [CrossRef]
- Luo, T.; Pan, Y.; Ouyang, H.; Shi, P.; Luo, J.; Yu, Z.; Lu, Q. Leaf Area Index and Net Primary Productivity along Subtropical to Alpine Gradients in the Tibetan Plateau. Glob. Ecol. Biogeogr. 2004, 13, 345–358. [Google Scholar] [CrossRef]
- Li, Y.; Xie, Z.; Qin, Y.; Zheng, Z. Estimating Relations of Vegetation, Climate Change, and Human Activity: A Case Study in the 400 Mm Annual Precipitation Fluctuation Zone, China. Remote Sens. 2019, 11, 1159. [Google Scholar] [CrossRef]
- Sun, W.; Wang, Y.; Fu, Y.H.; Xue, B.; Wang, G.; Yu, J.; Zuo, D.; Xu, Z. Spatial Heterogeneity of Changes in Vegetation Growth and Their Driving Forces Based on Satellite Observations of the Yarlung Zangbo River Basin in the Tibetan Plateau. J. Hydrol. 2019, 574, 324–332. [Google Scholar] [CrossRef]
- Li, G.; Sun, S.; Han, J.; Yan, J.; Liu, W.; Wei, Y.; Lu, N.; Sun, Y. Impacts of Chinese Grain for Green Program and Climate Change on Vegetation in the Loess Plateau During 1982–2015. Sci. Total Environ. 2019, 660, 177–187. [Google Scholar] [CrossRef]
- Peng, W.; Kuang, T.; Tao, S. Quantifying Influences of Natural Factors on Vegetation NDVI Changes Based on Geographical Detector in Sichuan, Western China. J. Clean. Prod. 2019, 233, 353–367. [Google Scholar] [CrossRef]
- Liu, S.; Huang, S.; Xie, Y.; Wang, H.; Huang, Q.; Leng, G.; Li, P.; Wang, L. Spatial-Temporal Changes in Vegetation Cover in a Typical Semi-Humid and Semi-Arid Region in China: Changing Patterns, Causes and Implications. Ecol. Indic. 2019, 98, 462–475. [Google Scholar] [CrossRef]
- Ding, Y.; Li, Z.; Peng, S. Global analysis of time-lag and -accumulation effects of climate on vegetation growth. Int. J. Appl. Earth Obs. Geoinform. 2020, 92, 102179. [Google Scholar] [CrossRef]
- Wu, D.; Zhao, X.; Liang, S.; Zhou, T.; Huang, K.; Tang, B.; Zhao, W. Time-lag effects of global vegetation responses to climate change. Glob. Change Biol. 2015, 21, 3520–3531. [Google Scholar] [CrossRef]
- Ivits, E.; Horion, S.; Erhard, M.; Fensholt, R. Assessing European ecosystem stability to drought in the vegetation growing season. Glob. Ecol. Biogeogr. 2016, 25, 1131–1143. [Google Scholar] [CrossRef]


| (Month·100 mm−1) | (Month·K−1) | (Month·100 mm−1) | (Month·K−1) | |
|---|---|---|---|---|
| Gradient | −0.19 | −0.13 | +0.18 | +0.14 |
| r2 | 0.67 | 0.66 | 0.88 | 0.92 |
Disclaimer/Publisher’s Note: The statements, opinions and data contained in all publications are solely those of the individual author(s) and contributor(s) and not of MDPI and/or the editor(s). MDPI and/or the editor(s) disclaim responsibility for any injury to people or property resulting from any ideas, methods, instructions or products referred to in the content. |
© 2025 by the authors. Licensee MDPI, Basel, Switzerland. This article is an open access article distributed under the terms and conditions of the Creative Commons Attribution (CC BY) license (https://creativecommons.org/licenses/by/4.0/).
Share and Cite
Lai, W.; Chen, Y.; Zhang, J.; Yang, H. Asymmetrical Time-Lagged Response of Vegetation to Drought and Extreme Precipitation Across China. Atmosphere 2025, 16, 240. https://doi.org/10.3390/atmos16030240
Lai W, Chen Y, Zhang J, Yang H. Asymmetrical Time-Lagged Response of Vegetation to Drought and Extreme Precipitation Across China. Atmosphere. 2025; 16(3):240. https://doi.org/10.3390/atmos16030240
Chicago/Turabian StyleLai, Wenli, Yongxiang Chen, Jie Zhang, and Huai Yang. 2025. "Asymmetrical Time-Lagged Response of Vegetation to Drought and Extreme Precipitation Across China" Atmosphere 16, no. 3: 240. https://doi.org/10.3390/atmos16030240
APA StyleLai, W., Chen, Y., Zhang, J., & Yang, H. (2025). Asymmetrical Time-Lagged Response of Vegetation to Drought and Extreme Precipitation Across China. Atmosphere, 16(3), 240. https://doi.org/10.3390/atmos16030240