Article

The Impact of Ambient PM2.5 on Emergency Ambulance Dispatches Due to Circulatory System Disease Modified by Season and Temperature in Shenzhen, China

1
Department of Epidemiology and Biostatistics, School of Public Health, Tongji Medical College, Huazhong University of Science and Technology, Wuhan 430030, China
2
Children’s Hospital of Nanjing Medical University, Nanjing 210008, China
3
School of Public Health, Shenzhen University, Shenzhen 518060, China
*
Author to whom correspondence should be addressed.
Atmosphere 2025, 16(2), 198; https://doi.org/10.3390/atmos16020198
Submission received: 19 December 2024 / Revised: 5 February 2025 / Accepted: 7 February 2025 / Published: 10 February 2025

Abstract

:
The adverse effects of short-term exposure to pollutants are the focus of many epidemiological studies. Little is known about the modification effects of season and temperature on the association between pollutants and the acute onset of circulatory diseases. The aim of this study was to investigate the effect of PM2.5 on emergency ambulance dispatches (EADs) due to circulatory system diseases in different seasons and temperature levels, and to locate the vulnerable population. We collected data on daily emergency ambulances, meteorological data, and air pollution concentration in Shenzhen from 2013 to 2020. A distributed lag nonlinear model was conducted to assess the effect of PM2.5 on circulatory system disease emergency ambulance dispatches modified by season. In addition, generalized additive models were used to detect the interactive effect of PM2.5 and temperature on emergency ambulance dispatches due to circulatory disease. A 10 μg/m3 increase in PM2.5 concentration was associated with a 2.43% (1.47–3.40%) increase in the risk of circulatory system disease emergency ambulance dispatches over lags of 0–5 days during the cold season, compared to 0.75% (−0.25–1.76%) during the warm season. This trend was consistent across temperature levels, with a significant 2.42% (1.47–3.10%) increase on low-temperature days, while no significant effect was observed on high-temperature days. For young people, the effect of PM2.5 on circulatory system disease emergency ambulance dispatches was higher in the cold season and low temperature days. The cold season and low temperature significantly enhanced the adverse effect of PM2.5 on the acute onset of circulatory system diseases, especially in young people. It is critical to focus on the synergistic effects of temperature and pollutants on the health of different vulnerable populations in different regions and climates.

1. Introduction

A large number of studies have proved that air pollution is a great environmental risk that affects population health [1,2,3,4]. The adverse impact of short-term exposure to air pollutants on people’s health has always been a hot topic in environmental health research [3,5]. Numerous case-crossover and time-series studies have consistently found that short-term exposure to pollutants such as PM10, PM2.5, SO2, NO2, and O3 led to an increase in all-cause and cause-specific mortality, thereby increasing the burden of disease [6,7,8,9]. Temperature is also known to be closely related to human health [10,11,12]. Fu [13] found a nonlinear relationship between ambient temperature and cause-specific moralities and pointed out that incidence of death significantly increased when temperatures exceeded the high temperature threshold or fell below the low temperature threshold.
However, in many studies about the health effects of air pollutants, temperature has often been regarded as a confounder, ignoring the interactive relationship between temperature and other effects [8,14]. In recent years, a few studies have begun to pay attention to the modifying effect of the temperature on the relationship between air pollution and health. However, these studies focused on different regions and various health factors, and there is no universally agreed conclusion. A higher adverse effect of PM2.5 on cardiovascular-respiratory mortality has been observed in lower temperature stratum according to a study in Beijing [15], which was contrary to the conclusion of another in Italy [16]. Therefore, it is necessary to conduct a comprehensive investigation of the interaction between air pollution and temperature based on the characteristics of climate and population in different regions.
In addition, most previous studies on the relationship between the environment and health have used mortality rates or outpatient visits of specific diseases as primary research variables [2,8,17,18]. Few studies explore the relationship between ambient temperature, pollutants, and emergency ambulance dispatches (EADs). Emergency ambulance dispatches provide crucial health information before death and treatment, serving as a vital indicator for measuring the acute health responses of populations to environmental fluctuations.
The study was conducted in Shenzhen, the economic center of China with hot and humid climate and relatively low pollution. The aim of this study was to investigate the effect of PM2.5 on emergency ambulance dispatches due to circulatory system diseases in different seasons and temperature levels. This is of great significance to assist the government in establishing reasonable and efficient emergency medical solutions to reduce the negative effects of pollutants and temperatures on the health of vulnerable groups.
Section 2 of this article introduces the data sources and model construction methods used in our study. The specific quantitative results of the study are presented in Section 3. In Section 4, we provide a more in-depth discussion of the results of interest in conjunction with the existing literature and elaborate on the strengths and limitations of the study. Section 5 briefly summarizes the main findings and conclusions of the study.

2. Materials and Methods

2.1. Study Sites and Data Collection

Shenzhen is a coastal city in the southern part of Guangdong Province, China, which is one of the national economic centers, with 17.79 million permanent residents by the end of 2023. Shenzhen has a tropical monsoon climate, with long summers and short winters, mild climate, abundant sunshine, and plentiful rainfall.
Data on daily EAD records from 2013 to 2020 were collected from Shenzhen First-aid Command Center. The center dispatches emergency ambulances 24 h a day and collects the call date and time, gender, age, address, symptoms, chief complaints, and primary diagnosis of each case. According to the guidance of the 10th revision of the International Classification of Diseases Version for 2016 (ICD-10) codes, the data on individuals who called emergency services due to circulatory system diseases (I00-I99) were extracted.
Air pollutant data (PM10, PM2.5, NO2 and SO2) were collected from seven state-controlled monitoring stations distributed in different administrative districts of Shenzhen, and the mean of daily average concentration from all valid stations is calculated for each pollutant. Daily meteorological data, including daily mean temperature and relative humidity were provided by Shenzhen Meteorological Service Center. According to the report from the Shenzhen Meteorological Bureau, we categorize May to October as the warm season, and November to April as the cold season [19,20].

2.2. Statistical Methods

2.2.1. Examining the Effect of Air Pollutants Modified by Season

To simultaneously assess the nonlinear and lag effects of short-term exposure to air pollutants, a distributed lag nonlinear model (DLNM) combined with quasi-Poisson regression was developed. Preliminary analysis reveals a linear trend in the relationship between pollutants and EADs (Figure 1), thus a linear parameter fitting model is chosen. The maximum lag was constrained to five days, in line with the previous study [20]. The basic model is expressed as follows:
log E Y t = α + β 1 c b l , t ( P t ) + β 2 n s ( t e m p t , 3 ) + n s T i m e , d f y e a r + n s h u m i d , 3 + γ H o l i d a y t + δ D o w t
where Y t refers to the daily count of EADs on day t; P t and t e m p t   represents the daily level of air pollutants and temperature on any current day; c b l , t ( P t ) refers to the cross-basis function obtained by DLNM with a linear function for exposure dimension and a natural cubic spline function (ns) with 4 degrees of freedom (df) for lag dimension, respectively; and l refers to the lag days. Meanwhile, daily temperature and humidity were also adjusted as a continuous variable in the model. Taking into account that the effect of temperature is nonlinear, a natural cubic spline function with 3 df ( n s ( t e m p t , 3 )   a n d   n s h u m i d , 3 ) was used [21]. We used the quasi-Akaike Information Criterion (Q-AIC) to find the optimal degree of freedom of time trend (Table S1 in Supplementary Files). In our study, the 6 degrees of freedom per year for ns (Time) was selected in the basic model for PM2.5, and the data were restricted to a specific season with fewer degrees of freedom (4 df) to analyze the seasonal effect. The H o l i d a y t   is a binary variable, which denotes the holiday on day t (1: public holiday) and D o w t is the day of the week on day t, with regression coefficients γ and δ. We examined a single-day lag (from lag0 to lag5) and the cumulative lag effect (from lag0–1 to lag0–5) in the DLM.

2.2.2. Examining Effect of Air Pollutant Modified by Temperature

A generalized additive model (GAM) was applied to detect the interaction effect of daily air pollutant concentrations and temperature for EADs. Days in study period were categorized into two levels (low and high temperature days) with median temperature from 2013 to 2020 as cutoff points (24.7 °C). A moving averages was used to represent the lag effects of pollutants on EADs (from lag0–1 to lag0–5) [22,23]. The formula for the GAM can be expressed as follows:
log E Y t = α + β 1 P t + β 2 ( I T t : P t ) + β 3 T e m p + n s t i m e , d f y e a r + n s h u m i d , 3 + γ H o l i d a y t + δ D o w t  
where I T t is an indicator that denotes the temperature stratum with the low-temperature level as a reference. β 1   indicates the main effect of pollutants, while β 1 + β 2 implies the effect of pollutants on high-temperature days, respectively [24,25]. Daily mean temperature was still introduced into the model as the main effect of temperature on EADs. The confidence interval of the combined effect is calculated using the method of combining coefficients and covariance estimates [26].

2.2.3. Different Test for Stratification Effects

In order to evaluate the corrective effects of temperature level and seasonal factors on the association between air pollutants and EADs, we conducted stratified analyses. The statistical significance difference of effects between stratums was defined by the formula below:
β 1 β 2 ± 1.96 S E 1 ^ 2 + S E 2 ^ 2
where β 1 and β 2 represent the estimated coefficients for different categories of effect modifiers and S E 1 and S E 2 are the corresponding standard errors [27].

2.2.4. Sensitivity Analysis
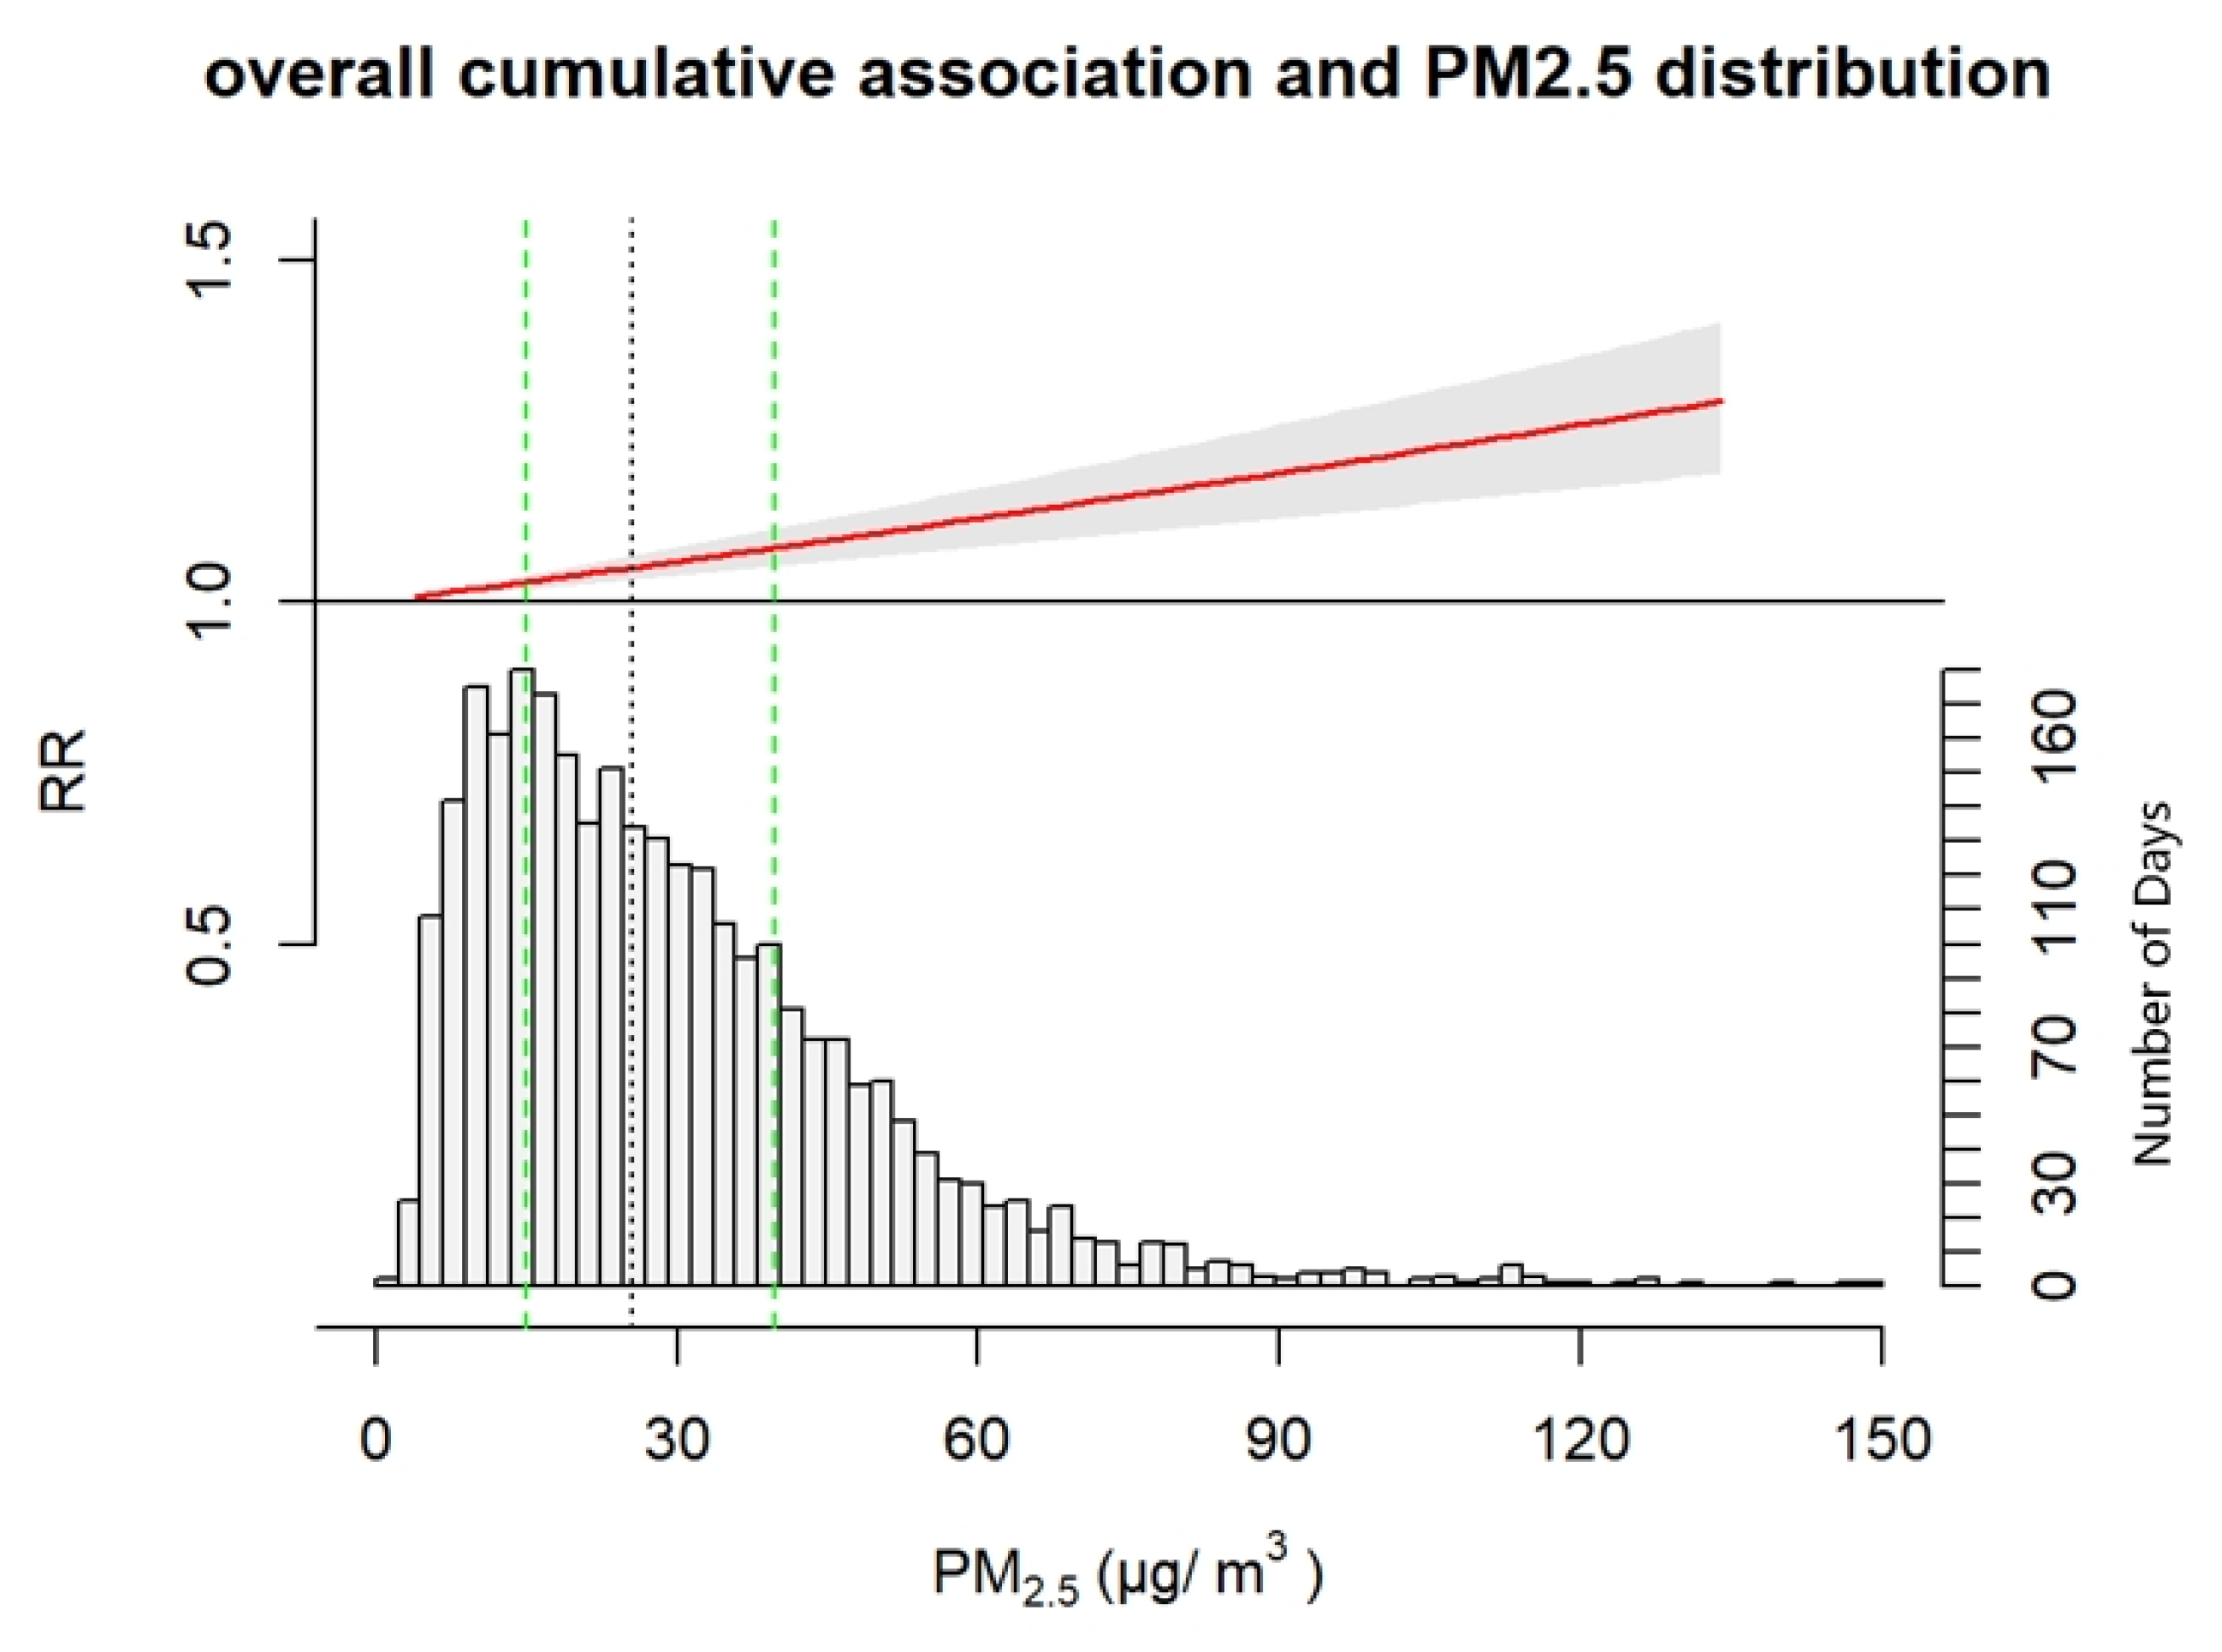
Sensitivity analyses were performed to assess the robustness of the results under different assumptions and scenarios. In order to remove the impact of COVID-19 on the calculation of emergency ambulance dispatches, we adapted the same method for analysis after excluding data from 20 December 2021. We also established a two-pollutant model to control the confounding effects of other pollutants.
All effects were reported as excess risk (ER) with a 95% confidence interval. ER was calculated as [relative risk (RR) − 1] × 100%, representing the percentage change in relative risk on EADs associated with an increment of 10 μg/m3 in air pollutant concentration [28]. All analyses were conducted using R version 4.1.0 (R Foundation for Statistical Computing, Vienna, Austria) with the dlnm and mgcv package.

3. Result

3.1. Descriptive Analysis

There was a total of 114,988 EADs caused by circulatory system disease in Shenzhen, China from 2013 to 2020. The average daily EADs were 39 during the full year, 41 in the cold season and low-temperature days, and 37 in the warm season and high-temperature days, respectively (Table 1). Table 1 also summarizes the daily pollutant concentration and meteorological factors. The concentrations of PM10, PM2.5, NO2, and SO2 in the cold season and low-temperature days are higher than those in the warm season and high-temperature days. The average daily concentration of PM2.5 was 28.63 μg/m3 during the full year, 35.99 μg/m3 in the cold season and 21.38 μg/m3 in the warm season, respectively. When stratified using daily temperatures, the PM2.5 concentration was 36.40 μg/m3 on low-temperature days and 21.38 μg/m3 on high-temperature days.

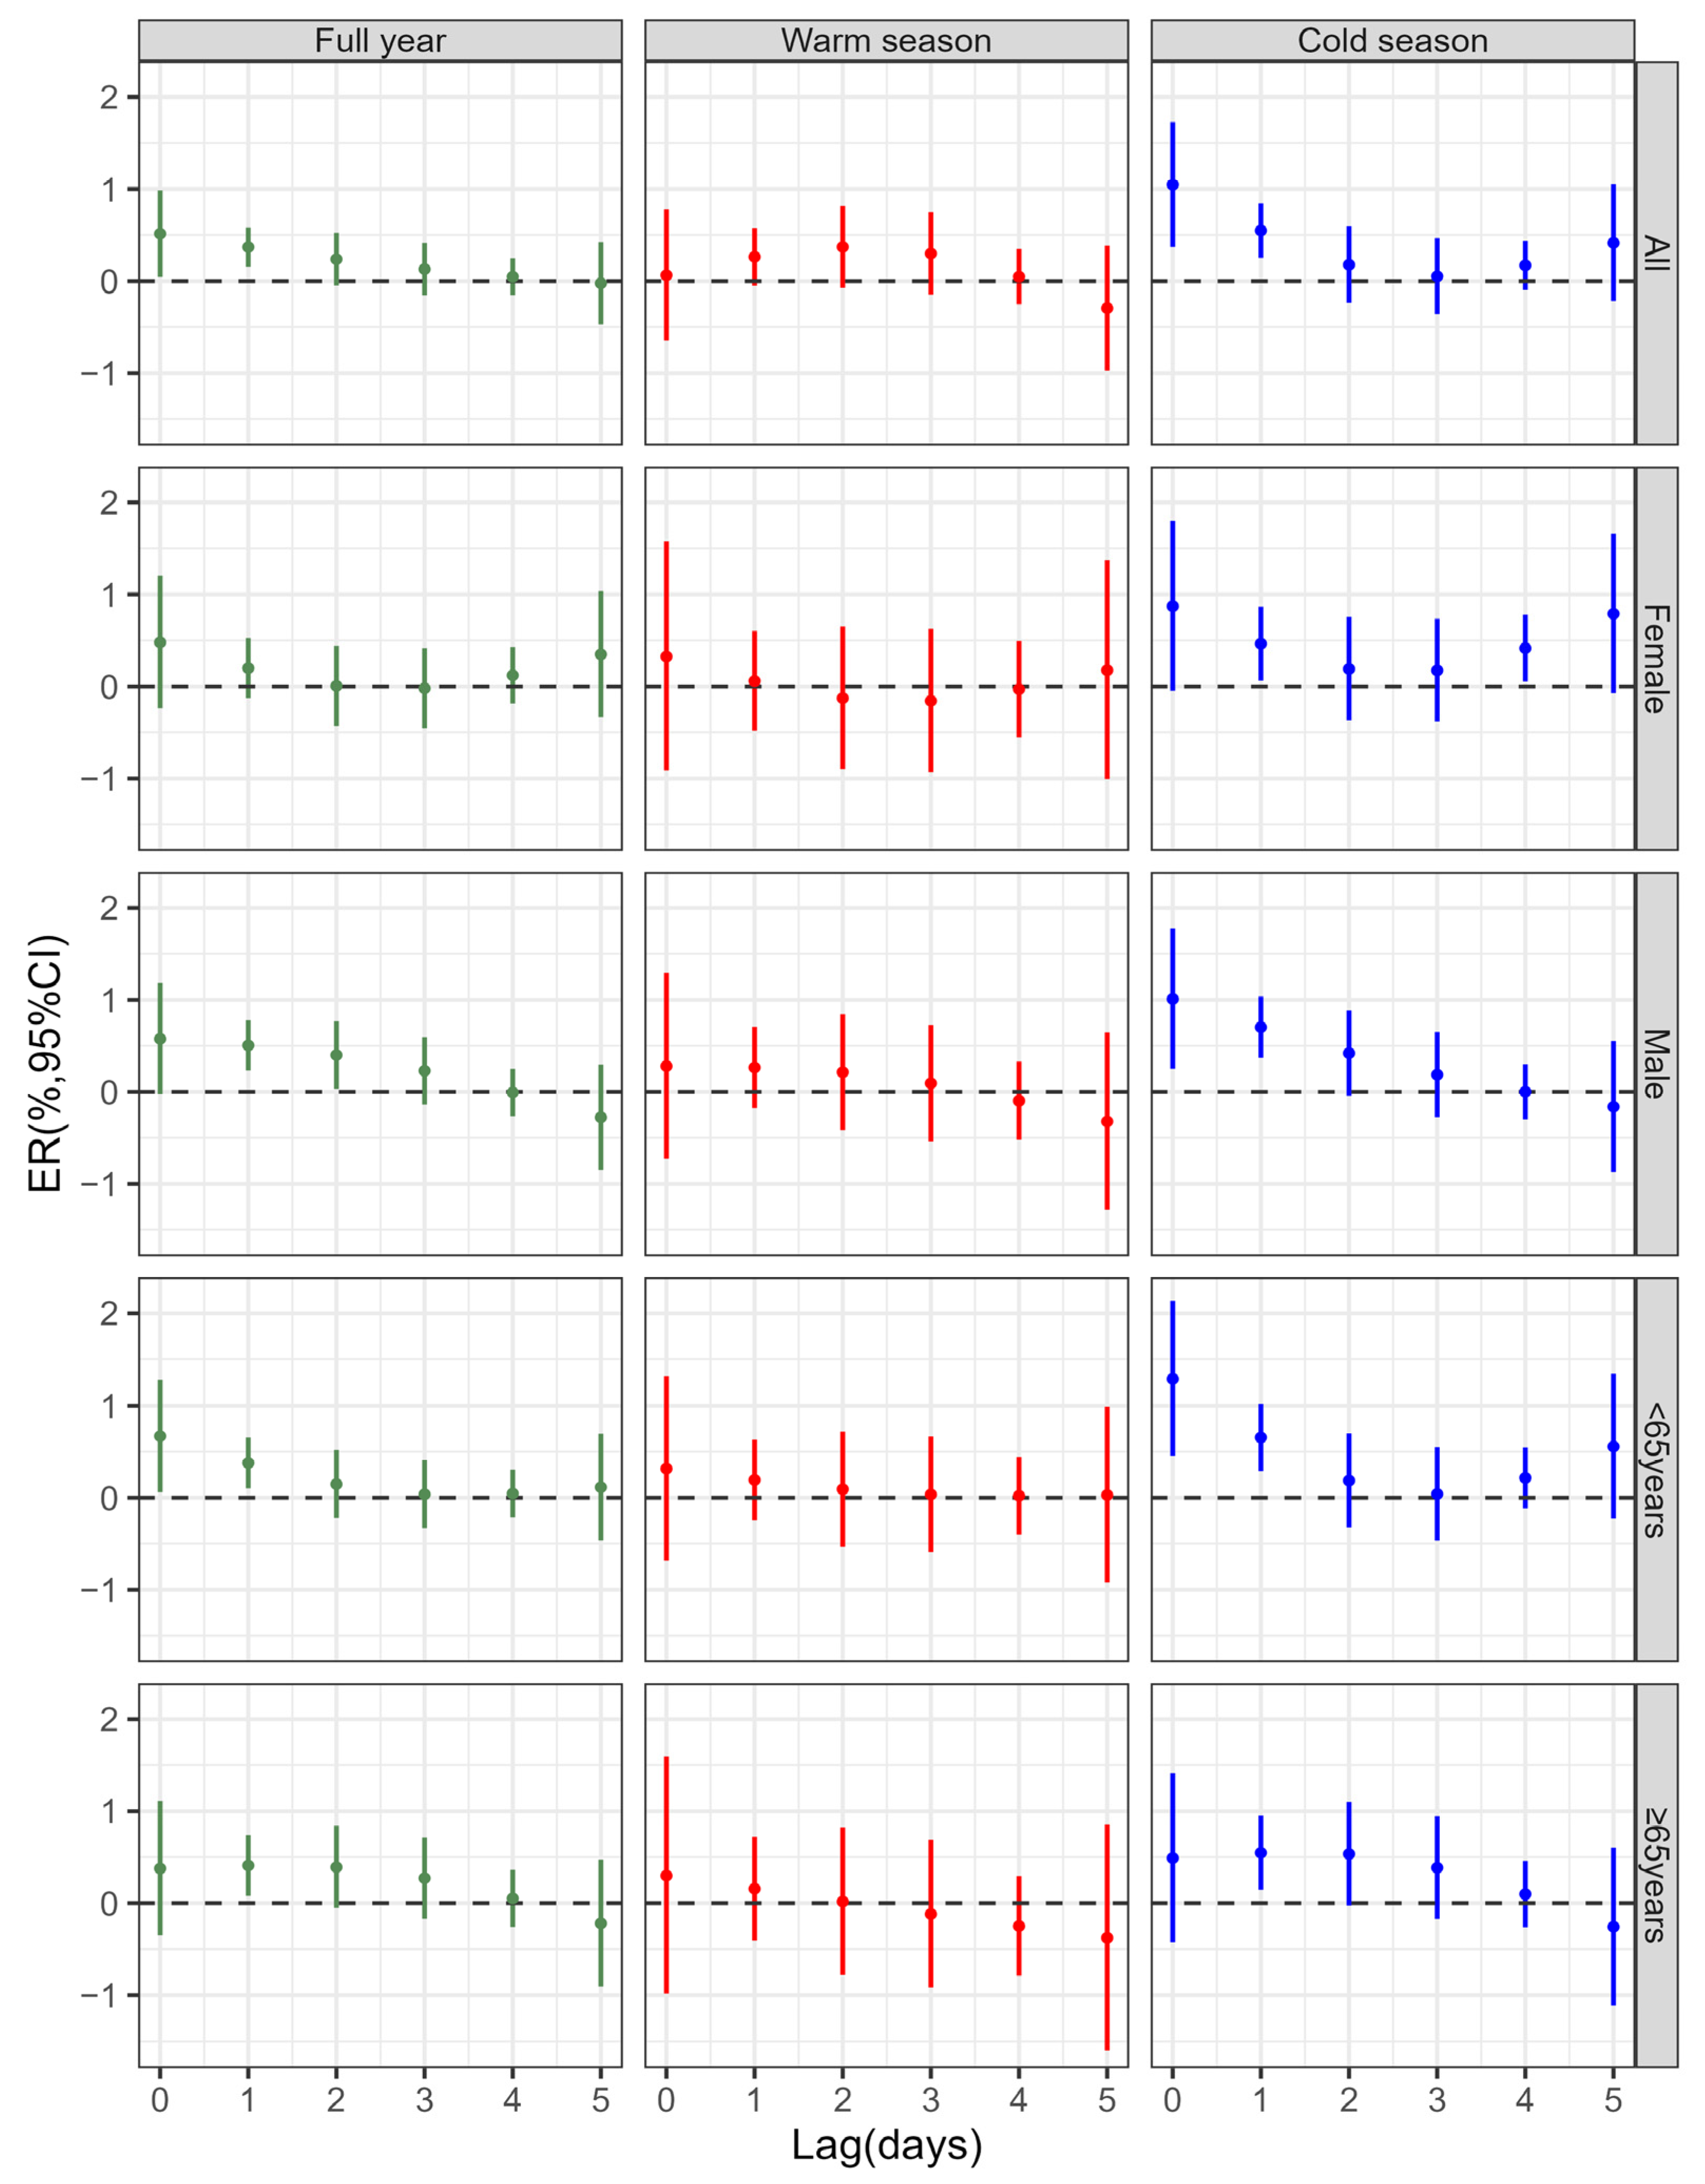
3.2. Effect of Air Pollutant Modified by Season

Figure 1 shows the overall cumulative-exposure effect of PM2.5 on circulatory system disease EADs. As the concentration of pollutants increases, the risk of circulatory system disease incidents also shows a linear upward trend.
Figure 2 indicates that the excess risk of EADs caused by circulatory system diseases due to PM2.5 concentration is significantly greater than zero on the current day (lag0) and one day lag (lag1) over the full year across all individuals. In the cold season, the excessive risk of EADs is higher at single-lag days (lag0, lag1), especially for males and young people (<65 years). However, there were no significant effects observed in the warm season at single lag days.
The cumulative risk from day 1 to day 5 after exposure to PM2.5 (from lag0–1 to lag0–5) is presented in Table 2. With each 10 μg/m3 increment in PM2.5 concentration, risk of circulatory system disease EADs increased by 1.28% (0.48–2.08%) at a lag of 0–5 over the full year, 2.43% (1.47–3.40%) during the cold season and 0.75% (−0.25–1.76%) during the warm season, the same as the trend observed on single days. The effects of PM2.5 on circulatory system disease EADs in the cold season were significantly higher than those in the warm season among all demographic groups except for elderly people at lag0–5.

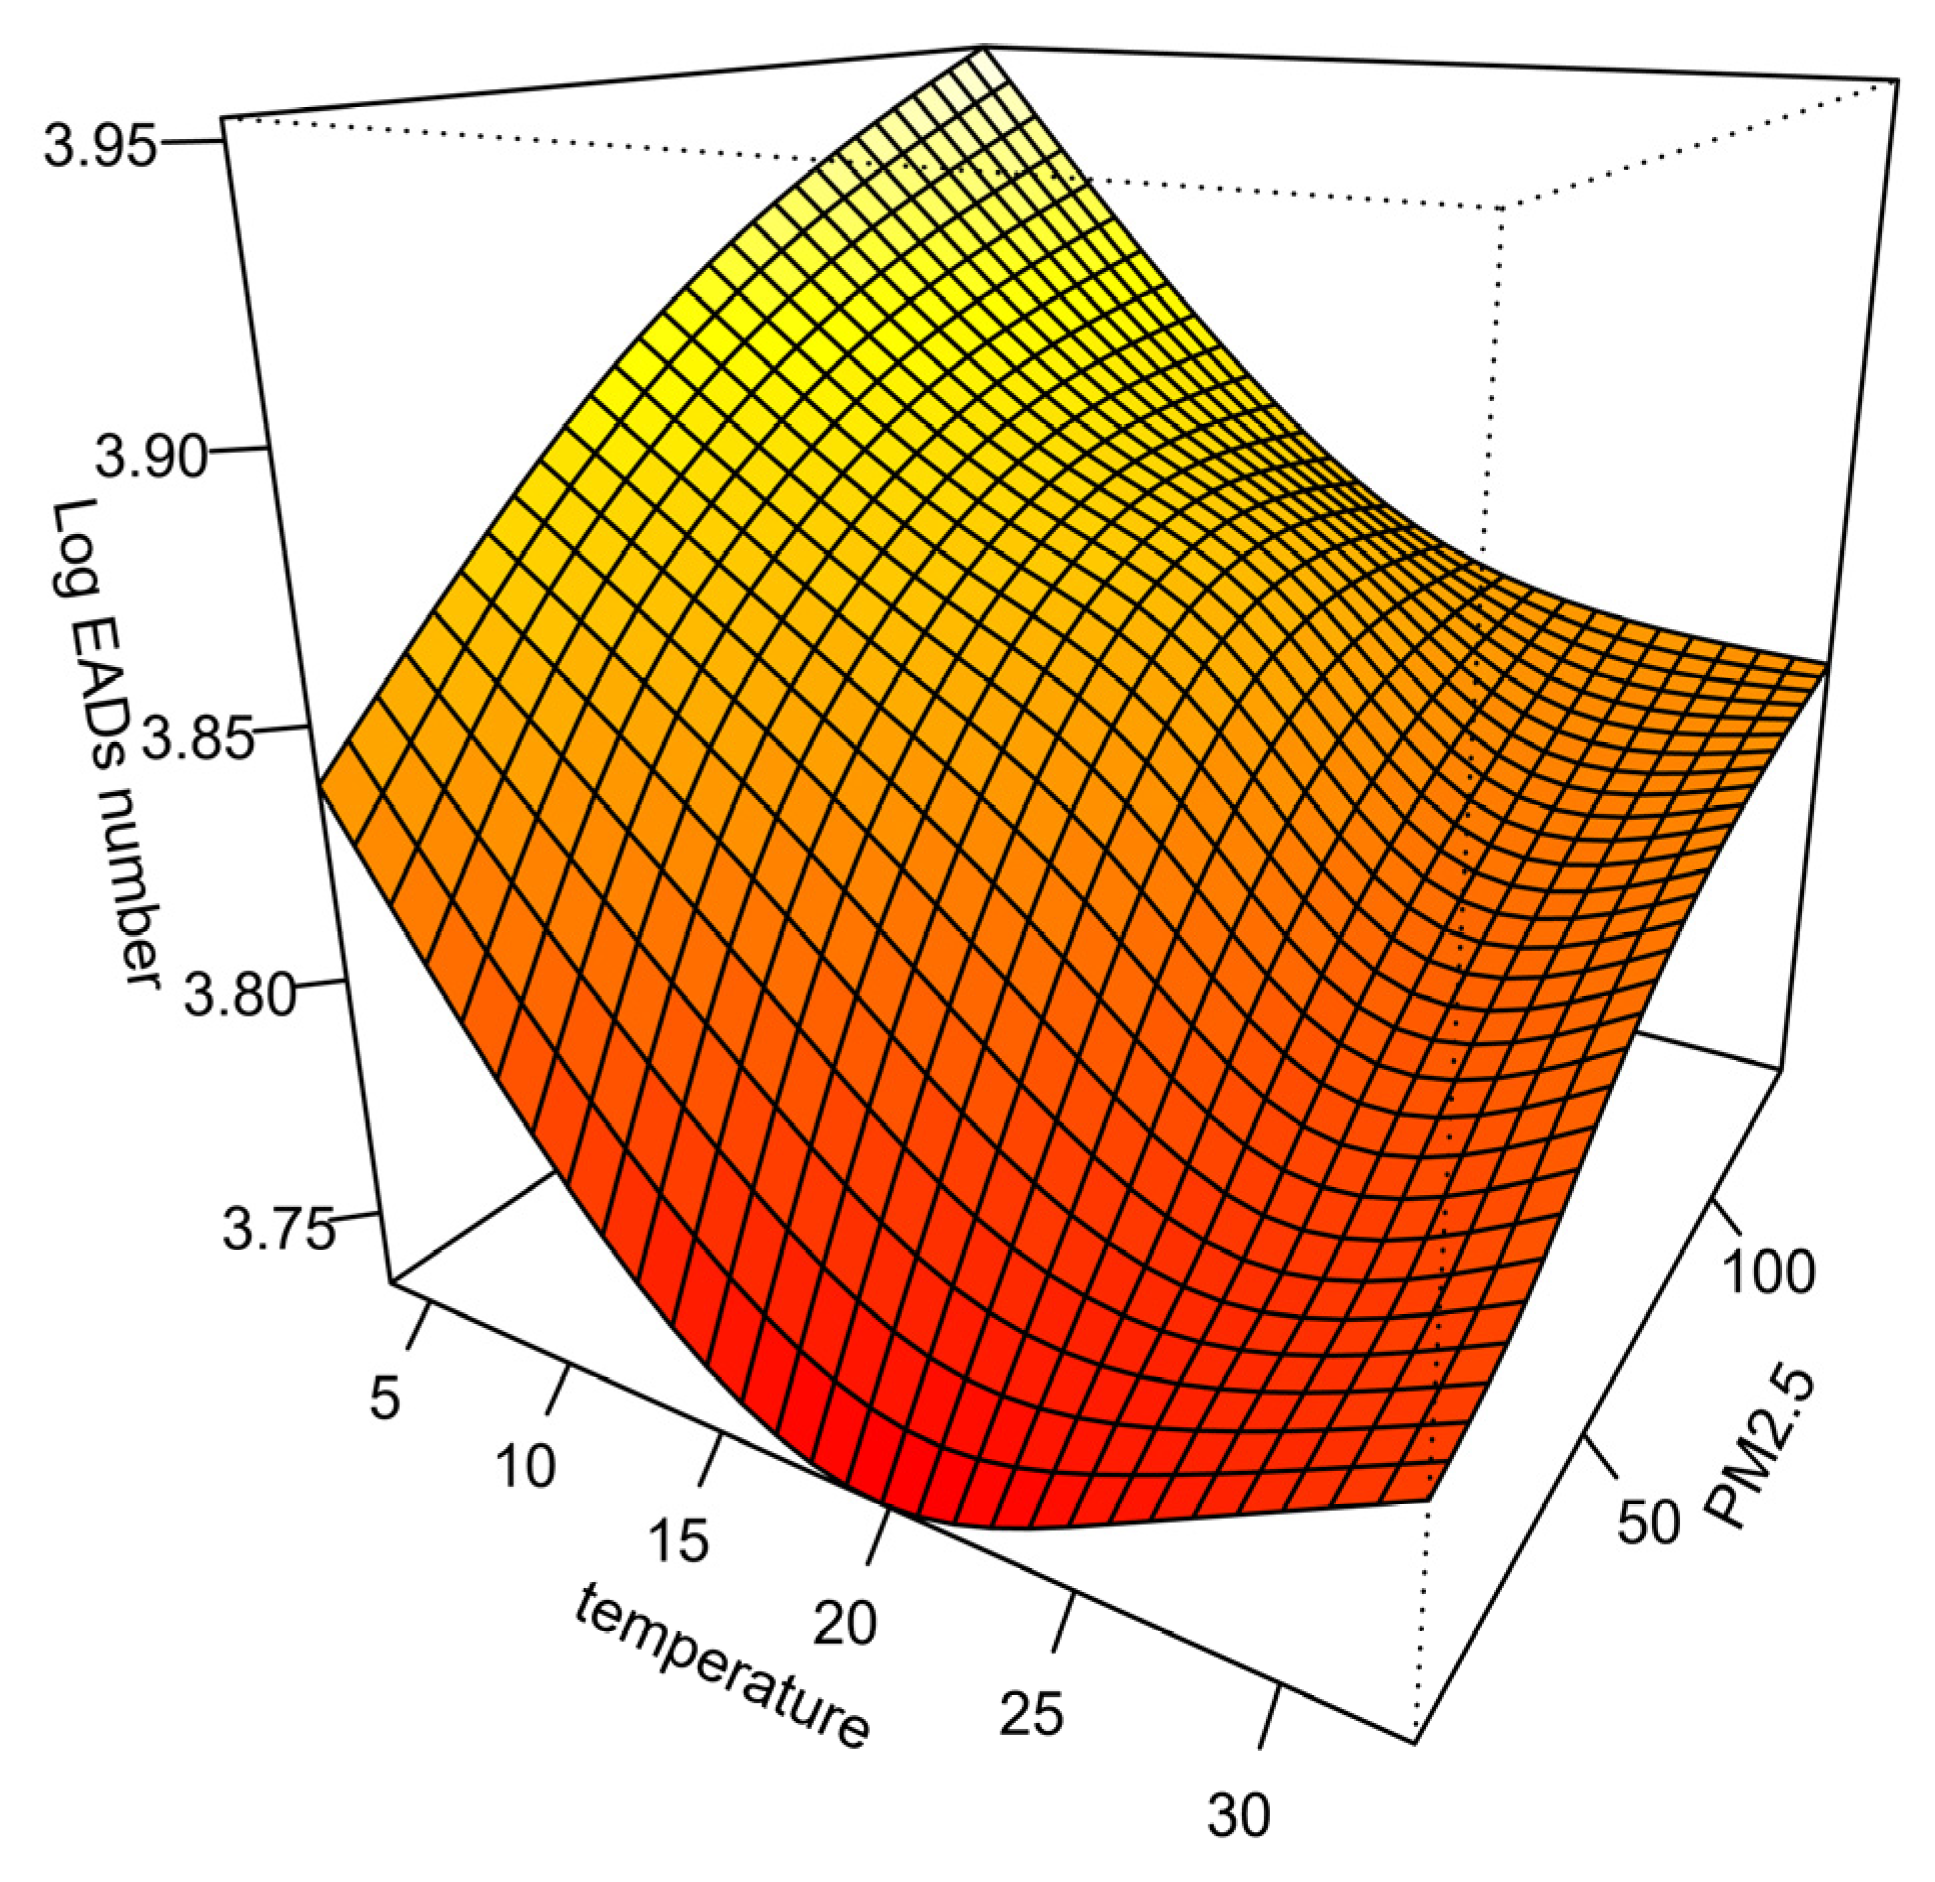
3.3. Effect of Air Pollutant Modified by Temperature

A generalized additive model including the interaction of temperature and pollutants was constructed to calculate the effect of PM2.5 at different temperature levels. Figure 3 demonstrates that the adverse impact of PM2.5 on EADs due to circulatory system disease was higher on low-temperature days than on high-temperature days, and the differences between temperature levels were statistically significant during the delayed five days among all people. For example, for each 10 μg/m3 increment in PM2.5 concentration, the risk of circulatory system disease on low-temperature days significantly increased by 2.42% (1.47–3.10%), while no significant effect was found on high-temperature days at lag0–5 for all the individuals. The same pattern was observed in all subgroups of people. Compared with the elderly, young people (<65 years) generally showed a higher risk on low-temperature days.
Figure 4 shows the joint PM2.5-temprature patterns for EADs caused by circulatory system disease for PM2.5 at lag0–5 and ambient temperature on the current day. A noticeable interaction between PM2.5 and temperature on circulatory EADs was observed, with low temperatures amplifying the adverse impact of PM2.5 on the risk of acute circulatory system disease incidents.

3.4. Sensitivity Analyses

The sensitivity analysis showed that the relationship between the impact of PM2.5 on circulatory system disease EADs stratified by season and temperature before the outbreak of COVID-19 was consistent with the overall situation (Tables S3 and S4). Our conclusions did not change after adjusting for co-pollutants (Tables S5 and S6).

4. Discussion

The study found that short-term exposure to PM2.5 increased the rate of acute onset of circulatory system disease for up to five days. We used different stratified models to explore the modification effects of season and temperature on the influence of PM2.5 exposure on EADs caused by circulatory system disease and found that this effect was only significant in cold seasons and low temperatures, across the entire population as well as in different subgroups. Young people (<65 years) appear to be more vulnerable to the harmful impacts of PM2.5. To the best of our knowledge, this is the first study that observed how low temperature strengthened the effect of PM2.5 on the acute onset of the circulatory system diseases in Shenzhen (a subtropical city).

4.1. Association Between Air Pollutants and EADs

In our study, there was a significant association between PM2.5 and the acute onset of circulatory system disease, which is consistent with the conclusions of several previous epidemiological studies [29,30,31,32]. Contrary to some other studies, we did not observe a significant effect of short-term exposure to PM10 on circulatory system disease EADs [33,34]. This may be due to the strong correlation between PM10 and PM2.5, but PM2.5 particles are of a smaller size, have a larger specific surface area and stronger activity, are more likely to attach harmful substances compared to PM10, and have long residence time in the atmosphere. At the same time, it is more likely to remain in the terminal bronchioles and alveoli, so the effect of PM2.5 is more pronounced. Zhu et al. [35] also found that PM2.5 had a higher impact on all-cause mortality than PM10, which supported our conclusions. We also corrected the effects of PM10, NO2, SO2, CO, and O3 in the multi-pollutant model, and the association between PM2.5 and EADs caused by circulatory system diseases remained significant, indicating that PM2.5 had a strong independent effect.

4.2. Air Pollution Effects Stratified by Season

The results of seasonal stratification show that PM2.5 has a significant effect on the number of EAD cases caused by circulatory system diseases only in the cold season. However, another study [28] found that the effect of particulate matter was more pronounced during the warm season, which may be due to changes in particulate matter exposure patterns caused by climates in different regions. Shenzhen has a subtropical monsoon climate with more rain in summer, which reduces the concentration of pollution. In addition, people are more likely to stay indoors in the hot and rainy summer, reducing exposure to pollutants.

4.3. Air Pollution Effects Stratified by Temperature

The results of the seasonal stratification study suggest that temperature might also affect the impact of PM2.5. Then, we also fitted a temperature stratification model to explore the interaction between temperature and PM2.5 on EADs due to circulatory system diseases. The conclusion of temperature stratification analysis was consistent with seasonal stratification, with the effect of PM2.5 being stronger at a low-temperature level. The bivariate response surface model was also fitted in this study, and the model showed the same trend as the above results. Studies also found that in low temperature environments, in order to maintain body temperature, the human body increases the level of blood circulation of the heart, and the cardiovascular system increases the burden, which was more likely to induce cardiovascular diseases [36]. At the same time, at a low temperature, the phagocytic ability of alveolar macrophages is reduced, the respiratory defense ability is weakened, and temperature changes stimulate the occurrence of inflammatory response, increasing the incidence of diseases. These may lead to a strong synergistic effect between low temperature and PM2.5 [37,38,39].

4.4. Vulnerable Subgroups

We have found that the effect of pollutants on young people is higher than that on the elderly, which is different from some studies [40,41]. This may be related to the age composition and lifestyle habits of Shenzhen’s population. As of 2020, Shenzhen had a permanent population of approximately 17.8 million, of which only 3.22% are elderly people over 65. As the first special economic zone in China, Shenzhen is a young city. Compared with the elderly, young people have more commuting time and outdoor activities, resulting in more exposure to pollutants. Outdoor jobs, such as transportation and construction, are also occupied mostly by young people. A previous study in the Czech Republic also found that young people are more vulnerable to cold spells, which is consistent with our conclusion [42]. Some previous studies have linked air pollutants and extreme temperatures to childhood illness such as asthma, pneumonia, and congenital heart disease [43,44]. The results suggest that young people should also pay more attention to protecting themselves by using effective masks when the concentration of PM2.5 is high.

4.5. Potential Public Health Interventions

In order to reduce the negative impact of PM2.5 on the risk of circulatory disease acute onset in Shenzhen, the monitoring of air quality and early warning system should be strengthened. Shenzhen should implement stricter emission controls on traffic, especially during the cold season. It is also necessary to raise public health awareness and encourage protective behaviors such as wearing masks or using air purifiers during the cold season, especially for young people. Strengthening urban planning to increase green space will be useful to minimize pollution.

4.6. Strengths and Limitations

This study has several advantages. EAD data were rarely used in previous studies on the association of pollutants with disease as an outcome of population health. A large number of emergency ambulance dispatch data from Shenzhen Emergency Command Center reflected the timely impact of pollutants on the acute disease outbreak. Additionally, we fitted different models for hierarchical analysis of season and temperature, respectively, taking into account the moderating effects of ambient temperature on different lagged structures of short-term exposure to pollutants, which provided stronger support for the conclusion.
This study also has some limitations. First, the study was an ecological study, lacking individual information, which may cause bias in the estimation of the effect of pollutants. Second, there was only simple demographic information and preliminary diagnosis of disease collected from emergency ambulance dispatches data, not allowing for more specific subgroup exploration of the study population. Third, this study, being focused on a single city, has limitations when it comes to understanding the broader applicability of the findings. Future studies should certainly take regional differences into account. The patterns of interaction effects between pollutants and meteorological factors may be more diverse and complex. For instance, regional differences in temperature, air quality, and urban density might modify the health risks associated with exposure to PM2.5, potentially resulting in stronger or weaker associations in different regions. Further research could benefit from a multisite or national study that explores these interactions in more depth, with an emphasis on regional context and the underlying factors that drive these differences.

5. Conclusions

This study found that short-term exposure to ambient PM2.5 increases the risk of emergency ambulance dispatches due to circulatory system disease in Shenzhen, China. Through different stratification models, we found that season and temperature have modification effects on the association between PM2.5 and EADs due to circulatory disease. With each 10 μg/m3 increment in PM2.5 concentration, the risk of circulatory system disease emergency ambulance dispatches increased by 2.43% (1.47–3.40%) at lag0–5 days during the cold season vs. 0.75% (−0.25–1.76%) during the warm season. The effects over low-temperature days, with a 2.42% (1.47–3.10%) increase in EADs for the same concentration increase in PM2.5, were significantly higher than high-temperature days. Obviously, the cold season and low temperature significantly enhanced the adverse effect of PM2.5 on the acute onset of circulatory system diseases. In cold days, young people are more susceptible to the adverse impact of exposure to PM2.5. It is critical to focus on the synergistic effects of temperature and pollutants on the health of different vulnerable populations in different regions and climates. Given that emergency ambulance dispatch data are collected in real time, our study offers support to the growing body of research concerning the acute adverse effects of short exposure to air pollutants and climate change.

Supplementary Materials

The following supporting information can be downloaded at: https://www.mdpi.com/article/10.3390/atmos16020198/s1, Table S1: Q-AIC values of model by changing df of the lag spaces for air pollutants; Table S2: Descriptive statistics for yearly number of circulatory disease emergency dispatches, air pollutants, and temperature in Shenzhen, 2003–2020; Table S3: Percentage increase (95% CI) of circulatory EADs for each 10 μg/m3 increment in PM2.5 with adjustment for co-pollutants; Table S4: Percentage increase (95% CI) of circulatory disease EADs for each 10 μg/m3 increment in PM2.5 with adjustment for co-pollutants across temperature levels; Table S5: Percentage increase (95% CI) of circulatory EADs for each 10 μg/m3 increment in PM2.5 excluding post-COVID-19 data; Table S6: Percentage increase (95% CI) of circulatory disease EADs for each 10 μg/m3 increment in PM2.5 across temperature levels excluding post-COVID-19 data; Figure S1: Distribution of state-controlled air quality monitoring sites in Shenzhen; Figure S2: Correlation between daily meteorological factors and air pollutants concentrations.

Author Contributions

X.C.: Conceptualization, Data curation, Methodology, Software, Formal analysis, Writing—original draft, Writing—review & editing. Y.T.: Conceptualization, Data curation, Methodology, Software, Formal analysis. Z.Y.: Methodology, Supervision. S.H.: Resources, Supervision. P.Y.: Investigation, Supervision, Project administration, Funding acquisition. All authors have read and agreed to the published version of the manuscript.

Funding

The National Natural Science Foundation of China provided funding for the study (Grant Nos. 81973004).

Institutional Review Board Statement

Not applicable.

Informed Consent Statement

Patient consent was waived because the emergency ambulance dispatch data used in this study had been fully anonymized, which ensured that the data could not be traced back to any individual.

Data Availability Statement

The data presented in this study are available on request from the corresponding author. The data are not publicly available due to privacy.

Acknowledgments

We appreciate the contributions made to this study by every staff member of the Shenzhen First-aid Command Center, Shenzhen Meteorological Bureau, and National Earth System Science Data Center.

Conflicts of Interest

The authors declare no conflicts of interest.

References

  1. de Bont, J.; Jaganathan, S.; Dahlquist, M.; Persson, Å.; Stafoggia, M.; Ljungman, P. Ambient Air Pollution and Cardiovascular Diseases: An Umbrella Review of Systematic Reviews and Meta-Analyses. J. Intern. Med. 2022, 291, 779–800. [Google Scholar] [CrossRef] [PubMed]
  2. Liu, C.; Chen, R.; Sera, F.; Vicedo-Cabrera, A.M.; Guo, Y.; Tong, S.; Coelho, M.S.Z.S.; Saldiva, P.H.N.; Lavigne, E.; Matus, P.; et al. Ambient Particulate Air Pollution and Daily Mortality in 652 Cities. N. Engl. J. Med. 2019, 381, 705–715. [Google Scholar] [CrossRef] [PubMed]
  3. Schraufnagel, D.E.; Balmes, J.R.; De Matteis, S.; Hoffman, B.; Kim, W.J.; Perez-Padilla, R.; Rice, M.; Sood, A.; Vanker, A.; Wuebbles, D.J. Health Benefits of Air Pollution Reduction. Ann. Am. Thorac. Soc. 2019, 16, 1478–1487. [Google Scholar] [CrossRef] [PubMed]
  4. Schwela, D. Air Pollution and Health in Urban Areas. Rev. Environ. Health 2000, 15, 13–42. [Google Scholar] [CrossRef]
  5. Khoshakhlagh, A.H.; Mohammadzadeh, M.; Gruszecka-Kosowska, A.; Oikonomou, E. Burden of Cardiovascular Disease Attributed to Air Pollution: A Systematic Review. Global Health 2024, 20, 37. [Google Scholar] [CrossRef] [PubMed]
  6. Crouse, D.L.; Peters, P.A.; Hystad, P.; Brook, J.R.; van Donkelaar, A.; Martin, R.V.; Villeneuve, P.J.; Jerrett, M.; Goldberg, M.S.; Pope, C.A.; et al. Ambient PM2.5, O3, and NO2 Exposures and Associations with Mortality over 16 Years of Follow-Up in the Canadian Census Health and Environment Cohort (CanCHEC). Environ. Health Perspect. 2015, 123, 1180–1186. [Google Scholar] [CrossRef] [PubMed]
  7. Karimi, B.; Moradzadeh, R.; Samadi, S. Air Pollution and COVID-19 Mortality and Hospitalization: An Ecological Study in Iran. Atmos. Pollut. Res. 2022, 13, 101463. [Google Scholar] [CrossRef] [PubMed]
  8. Orellano, P.; Reynoso, J.; Quaranta, N.; Bardach, A.; Ciapponi, A. Short-Term Exposure to Particulate Matter (PM10 and PM2.5), Nitrogen Dioxide (NO2), and Ozone (O3) and All-Cause and Cause-Specific Mortality: Systematic Review and Meta-Analysis. Environ. Int. 2020, 142, 105876. [Google Scholar] [CrossRef]
  9. Yao, M.; Wu, G.; Zhao, X.; Zhang, J. Estimating Health Burden and Economic Loss Attributable to Short-Term Exposure to Multiple Air Pollutants in China. Environ. Res. 2020, 183, 109184. [Google Scholar] [CrossRef] [PubMed]
  10. Chen, R.; Yin, P.; Wang, L.; Liu, C.; Niu, Y.; Wang, W.; Jiang, Y.; Liu, Y.; Liu, J.; Qi, J.; et al. Association between Ambient Temperature and Mortality Risk and Burden: Time Series Study in 272 Main Chinese Cities. BMJ 2018, 363, k4306. [Google Scholar] [CrossRef]
  11. Healy, J.P.; Danesh Yazdi, M.; Wei, Y.; Qiu, X.; Shtein, A.; Dominici, F.; Shi, L.; Schwartz, J.D. Seasonal Temperature Variability and Mortality in the Medicare Population. Environ. Health Perspect. 2023, 131, 77002. [Google Scholar] [CrossRef] [PubMed]
  12. Nordio, F.; Zanobetti, A.; Colicino, E.; Kloog, I.; Schwartz, J. Changing Patterns of the Temperature–Mortality Association by Time and Location in the US, and Implications for Climate Change. Environ. Int. 2015, 81, 80–86. [Google Scholar] [CrossRef] [PubMed]
  13. Fu, S.H.; Gasparrini, A.; Rodriguez, P.S.; Jha, P. Mortality Attributable to Hot and Cold Ambient Temperatures in India: A Nationally Representative Case-Crossover Study. PLoS Med. 2018, 15, e1002619. [Google Scholar] [CrossRef] [PubMed]
  14. Zhao, Y.; Guo, M.; An, J.; Zhang, L.; Tan, P.; Tian, X.; Liu, L.; Zhao, Z.; Wang, X.; Liu, X.; et al. Associations between Ambient Air Pollution, Meteorology, and Daily Hospital Admissions for Ischemic Stroke: A Time-Stratified Case-Crossover Study in Beijing. Environ. Sci. Pollut. Res. 2022, 29, 53704–53717. [Google Scholar] [CrossRef]
  15. Li, Y.; Ma, Z.; Zheng, C.; Shang, Y. Ambient Temperature Enhanced Acute Cardiovascular-Respiratory Mortality Effects of PM2.5 in Beijing, China. Int. J. Biometeorol. 2015, 59, 1761–1770. [Google Scholar] [CrossRef]
  16. Stafoggia, M.; Schwartz, J.; Forastiere, F.; Perucci, C.A. SISTI Group Does Temperature Modify the Association between Air Pollution and Mortality? A Multicity Case-Crossover Analysis in Italy. Am. J. Epidemiol. 2008, 167, 1476–1485. [Google Scholar] [CrossRef] [PubMed]
  17. Chan, E.Y.; Goggins, W.B.; Yue, J.S.; Lee, P. Hospital Admissions as a Function of Temperature, Other Weather Phenomena and Pollution Levels in an Urban Setting in China. Bull. World Health Organ. 2013, 91, 576. [Google Scholar] [CrossRef] [PubMed]
  18. Rai, M.; Stafoggia, M.; de’Donato, F.; Scortichini, M.; Zafeiratou, S.; Vazquez Fernandez, L.; Zhang, S.; Katsouyanni, K.; Samoli, E.; Rao, S.; et al. Heat-Related Cardiorespiratory Mortality: Effect Modification by Air Pollution across 482 Cities from 24 Countries. Environ. Int. 2023, 174, 107825. [Google Scholar] [CrossRef] [PubMed]
  19. Duan, Y.; Liao, Y.; Li, H.; Yan, S.; Zhao, Z.; Yu, S.; Fu, Y.; Wang, Z.; Yin, P.; Cheng, J.; et al. Effect of Changes in Season and Temperature on Cardiovascular Mortality Associated with Nitrogen Dioxide Air Pollution in Shenzhen, China. Sci. Total Environ. 2019, 697, 134051. [Google Scholar] [CrossRef] [PubMed]
  20. Li, L.; Huang, S.; Tian, Y.; Ji, J.; Zhang, Y.; Hu, J.; Lv, Z.; Liu, N.; Wang, P.; Yin, P.; et al. Short-Term Exposure to Nitrogen Dioxide and Ischemic Stroke Incidence in Shenzhen, China: Modification Effects by Season and Temperature. Ecotoxicol. Environ. Saf. 2022, 239, 113644. [Google Scholar] [CrossRef] [PubMed]
  21. Peng, R.D.; Dominici, F.; Louis, T.A. Model Choice in Time Series Studies of Air Pollution and Mortality. J. R. Stat.Soc. Ser. A (Stat.Soc.) 2006, 169, 179–203. [Google Scholar] [CrossRef]
  22. Lu, F.; Zhou, L.; Xu, Y.; Zheng, T.; Guo, Y.; Wellenius, G.A.; Bassig, B.A.; Chen, X.; Wang, H.; Zheng, X. Short-Term Effects of Air Pollution on Daily Mortality and Years of Life Lost in Nanjing, China. Sci. Total Environ. 2015, 536, 123–129. [Google Scholar] [CrossRef] [PubMed]
  23. Luo, K.; Li, R.; Wang, Z.; Zhang, R.; Xu, Q. Effect Modification of the Association between Temperature Variability and Daily Cardiovascular Mortality by Air Pollutants in Three Chinese Cities. Environ. Pollut. 2017, 230, 989–999. [Google Scholar] [CrossRef] [PubMed]
  24. Ren, C.; Williams, G.M.; Mengersen, K.; Morawska, L.; Tong, S. Does Temperature Modify Short-Term Effects of Ozone on Total Mortality in 60 Large Eastern US Communities? An Assessment Using the NMMAPS Data. Environ. Int. 2008, 34, 451–458. [Google Scholar] [CrossRef]
  25. Ren, C.; Tong, S. Temperature Modifies the Health Effects of Particulate Matter in Brisbane, Australia. Int. J. Biometeorol. 2006, 51, 87–96. [Google Scholar] [CrossRef] [PubMed]
  26. Yu, I.T.; Qiu, H.; Wang, X.; Tian, L.; Tse, L.A. Synergy between Particles and Nitrogen Dioxide on Emergency Hospital Admissions for Cardiac Diseases in Hong Kong. Int. J. Cardiol. 2013, 168, 2831–2836. [Google Scholar] [CrossRef] [PubMed]
  27. Altman, D.G.; Bland, J.M. Interaction Revisited: The Difference between Two Estimates. BMJ 2003, 326, 219. [Google Scholar] [CrossRef]
  28. Ai, S.; Wang, C.; Qian, Z.M.; Cui, Y.; Liu, Y.; Acharya, B.K.; Sun, X.; Hinyard, L.; Jansson, D.R.; Qin, L.; et al. Hourly Associations between Ambient Air Pollution and Emergency Ambulance Calls in One Central Chinese City: Implications for Hourly Air Quality Standards. Sci. Total Environ. 2019, 696, 133956. [Google Scholar] [CrossRef] [PubMed]
  29. Michikawa, T.; Sasaki, J.; Yamazaki, S.; Takami, A.; Asakura, K.; Imamura, H.; Ueda, K.; Saito, S.; Hoshi, J.; Yoshino, A.; et al. A Case-Crossover Analysis of the Association between Exposure to Total PM2.5 and Its Chemical Components and Emergency Ambulance Dispatches in Tokyo. Environ. Sci. Technol. 2022, 56, 7319–7327. [Google Scholar] [CrossRef]
  30. You, X.; Cao, X.; Guo, Y.; Wang, D.; Qiu, W.; Zhou, C.; Zhou, M.; Chen, W.; Zhang, X. Associations between Short-Term PM2.5 Exposure and Daily Hospital Admissions for Circulatory System Diseases in Ganzhou, China: A Time Series Study. Front. Public. Health 2023, 11, 1134516. [Google Scholar] [CrossRef]
  31. Kramer, A.L.; Liu, J.; Li, L.; Connolly, R.; Barbato, M.; Zhu, Y. Environmental Justice Analysis of Wildfire-Related PM2.5 Exposure Using Low-Cost Sensors in California. Sci. Total Environ. 2023, 856, 159218. [Google Scholar] [CrossRef] [PubMed]
  32. Sun, Y.; Zhang, Y.; Chen, C.; Sun, Q.; Wang, Y.; Du, H.; Wang, J.; Zhong, Y.; Shi, W.; Li, T.; et al. Impact of Heavy PM2.5 Pollution Events on Mortality in 250 Chinese Counties. Environ. Sci. Technol. 2022, 56, 8299–8307. [Google Scholar] [CrossRef]
  33. Kim, S.; Lee, J.-T. Short-Term Exposure to PM10 and Cardiovascular Hospitalization in Persons with and without Disabilities: Invisible Population in Air Pollution Epidemiology. Sci. Total Environ. 2022, 848, 157717. [Google Scholar] [CrossRef] [PubMed]
  34. Feng, W.; Li, H.; Wang, S.; Van Halm-Lutterodt, N.; An, J.; Liu, Y.; Liu, M.; Wang, X.; Guo, X. Short-Term PM10 and Emergency Department Admissions for Selective Cardiovascular and Respiratory Diseases in Beijing, China. Sci. Total Environ. 2019, 657, 213–221. [Google Scholar] [CrossRef]
  35. Zhu, F.; Yu, H.; Fan, X.; Ding, Z.; Wang, Q.; Zhou, J. Particulate Air Pollution and Cardiovascular Disease Mortality in Jiangsu Province, China: A Time-Series Analysis between 2015 and 2021. Front Public Health 2023, 11, 1218479. [Google Scholar] [CrossRef]
  36. Manou-Stathopoulou, V.; Goodwin, C.D.; Patterson, T.; Redwood, S.R.; Marber, M.S.; Williams, R.P. The Effects of Cold and Exercise on the Cardiovascular System. Heart 2015, 101, 808–820. [Google Scholar] [CrossRef]
  37. Boonarkart, C.; Suptawiwat, O.; Sakorn, K.; Puthavathana, P.; Auewarakul, P. Exposure to Cold Impairs Interferon-Induced Antiviral Defense. Arch. Virol. 2017, 162, 2231–2237. [Google Scholar] [CrossRef] [PubMed]
  38. He, F.; Liao, B.; Pu, J.; Li, C.; Zheng, M.; Huang, L.; Zhou, Y.; Zhao, D.; Li, B.; Ran, P. Exposure to Ambient Particulate Matter Induced COPD in a Rat Model and a Description of the Underlying Mechanism. Sci. Rep. 2017, 7, 45666. [Google Scholar] [CrossRef] [PubMed]
  39. Juan, Y.; Haiqiao, W.; Xie, W.; Huaping, H.; Zhong, H.; Xiangdong, Z.; Kolosov, V.P.; Perelman, J.M. Cold-Inducible RNA-Binding Protein Mediates Airway Inflammation and Mucus Hypersecretion through a Post-Transcriptional Regulatory Mechanism under Cold Stress. Int. J. Biochem. Cell Biol. 2016, 78, 335–348. [Google Scholar] [CrossRef] [PubMed]
  40. Li, G.; Zhou, M.; Cai, Y.; Zhang, Y.; Pan, X. Does Temperature Enhance Acute Mortality Effects of Ambient Particle Pollution in Tianjin City, China. Sci. Total Environ. 2011, 409, 1811–1817. [Google Scholar] [CrossRef] [PubMed]
  41. Tian, L.; Liang, F.; Guo, Q.; Chen, S.; Xiao, S.; Wu, Z.; Jin, X.; Pan, X. The Effects of Interaction between Particulate Matter and Temperature on Mortality in Beijing, China. Environ. Sci. Process Impacts 2018, 20, 395–405. [Google Scholar] [CrossRef]
  42. Kysely, J.; Pokorna, L.; Kyncl, J.; Kriz, B. Excess Cardiovascular Mortality Associated with Cold Spells in the Czech Republic. BMC Public Health 2009, 9, 19. [Google Scholar] [CrossRef] [PubMed]
  43. Xu, Q.; Wang, S.; Guo, Y.; Wang, C.; Huang, F.; Li, X.; Gao, Q.; Wu, L.; Tao, L.; Guo, J.; et al. Acute Exposure to Fine Particulate Matter and Cardiovascular Hospital Emergency Room Visits in Beijing, China. Environ. Pollut. 2017, 220, 317–327. [Google Scholar] [CrossRef]
  44. Yang, Q.; Chen, Y.; Shi, Y.; Burnett, R.T.; McGrail, K.M.; Krewski, D. Association between Ozone and Respiratory Admissions among Children and the Elderly in Vancouver, Canada. Inhal. Toxicol. 2003, 15, 1297–1308. [Google Scholar] [CrossRef] [PubMed]
Figure 1. Overall cumulative exposure–response associations between PM2.5 and the counts of emergency ambulance dispatches, with PM2.5 distributions in Shenzhen, 2013–2020. The dashed black line represents the median value of the daily PM2.5 concentrations, and the two dashed green lines represent the 25th and 75th percentiles of the daily PM2.5. Abbreviations: RR, relative risk.
Atmosphere 16 00198 g001
Figure 2. Excess risk of emergency ambulance dispatches caused by circulatory system diseases for each 10 μg/m3 increment in PM2.5 at single lag days, using distributed lag linear model stratified by season. Abbreviations: ER, excess risk.
Atmosphere 16 00198 g002
Figure 3. Excess risk and 95% CI of emergency ambulance dispatches caused by circulatory system diseases for each 10 μg/m3 increment in PM2.5 across different temperature days in Shenzhen, 2013–2020. Estimates were generated using GAM combined with the stratification parametric model. The red line in the figure represents the high temperature level (≥median 24.7 °C), while the blue line represents the low temperature level (<median 24.7 °C). The P-value tests the interaction effect between PM2.5 and temperature levels.
Atmosphere 16 00198 g003
Figure 4. Bivariate response surface of temperature and PM2.5 on emergency ambulance dispatches caused by circulative disease. Abbreviations: EADs, emergency ambulance dispatches.
Atmosphere 16 00198 g004
Table 1. Summary statistics for air pollutant concentrations, emergency ambulance dispatches, and meteorological factors, by season and mean temperature in Shenzhen, 2013–2020.
VariablesMeanSDPercentile
MinP25MedianP75Max
Temperature (°C)
  Full year23.565.313.5019.6024.7028.1033.00
  Cold season (Nov.–Apr.)18.304.033.5016.6019.6022.4028.00
  Warm season (May–Oct.)27.762.0918.8026.5028.1029.4033.00
  Low temperature18.103.763.5016.6019.6022.2024.60
  High temperature27.971.6824.7026.6028.1029.4033.00
Relative humidity (%)
  Full year75.7212.8819.0070.0078.0084.00100.00
  Cold season (Nov.–Apr.)72.6414.5519.0065.0075.0083.00100.00
  Warm season (May–Oct.)78.7510.1234.0073.0080.0086.00100.00
  Low temperature (<Median)72.0914.9819.0064.0074.5083.00100.00
  High temperature (≥Median)79.299.0739.0074.0080.0085.00100.00
PM10 (μg/m3)
  Full year61.0244.655.5530.0049.1374.75336.83
  Cold season (Nov.–Apr.)73.3648.455.5540.2759.4191.00336.83
  Warm season (May–Oct.)48.8636.728.7023.7837.0061.08266.00
  Low temperature (<Median)73.2448.725.5540.6559.0088.93336.83
  High temperature (≥Median)48.9536.428.7023.8636.5462.45253.57
PM2.5 (μg/m3)
  Full year28.6317.763.9115.4024.8937.55135.60
  Cold season (Nov.–Apr.)35.9918.154.0023.4032.3644.00135.60
  Warm season (May–Oct.)21.3814.003.9111.4317.0527.35101.00
  Low temperature36.4018.404.0023.4532.6044.50135.60
  High temperature20.9613.213.9111.4316.8627.00101.00
NO2 (μg/m3)
  Full year34.4916.156.7323.7531.4441.29139.40
  Cold season (Nov.–Apr.)39.4318.489.5527.0035.2348.00139.40
  Warm season (May–Oct.)29.6211.576.7321.2327.8236.0083.80
  Low temperature (<Median)39.2518.579.5526.4535.2548.00139.40
  High temperature (≥Median)29.7911.566.7321.4528.0036.0083.80
SO2 (μg/m3)
  Full year8.213.753.095.867.369.5054.20
  Cold season (Nov.–Apr.)8.784.453.096.007.6010.1754.20
  Warm season (May–Oct.)7.642.783.205.737.178.8628.80
  Low temperature (<Median)8.774.483.096.007.5010.1754.20
  High temperature (≥Median)7.662.743.205.737.298.8628.80
Emergency ambulance dispatches
  All-cause
  Full year398.3186.56173.00335.00390.00457.00776.00
  Cold season (Nov.–Apr.)383.0691.67173.00316.00373.00447.00753.00
  Warm season (May–Oct.)413.4078.35236.00351.00404.00470.00776.00
  Low temperature (<Median)382.0292.35173.00313.00372.50445.00753.00
  High temperature (≥Median)414.4777.09237.00353.00405.00471.00776.00
  Circulatory system disease
  Full year39.4710.1015.0032.0039.0046.0084.00
  Cold season (Nov.–Apr.)41.1610.5115.0034.0040.0048.0084.00
  Warm season (May–Oct.)37.819.3915.0031.0037.0044.0073.00
  Low temperature (<Median)41.1510.4415.0034.0041.0048.0084.00
  High temperature (≥Median)37.829.4715.0031.0037.0044.0077.00
Abbreviations: SD, standard deviation; Min, minimum; Px, xth percentiles; Max, maximum; PM2.5, particulate matter less than 10 μm in aerodynamic diameter; Nov., November; Apr., April; Oct., October.
Table 2. Percentage increase (95% CI) of circulatory system disease emergency ambulance dispatches for each 10 μg/m3 increment in PM2.5 by season in Shenzhen, 2013–2020.
GroupPercentage Change in EADs(95%CI) b
Lag0–1Lag0–2Lag0–3Lag0–4Lag0–5
Full year
  All a0.88 (0.26, 1.51)1.12 (0.47, 1.78)1.26 (0.54, 1.97)1.30 (0.56, 2.05)1.28 (0.48, 2.08)
  Male1.08 (0.28, 1.89)1.49 (0.65, 2.33)1.72 (0.80, 2.64)1.71 (0.76, 2.67)1.43 (0.41, 2.46)
  Female0.68 (−0.27, 1.64)0.68 (−0.31, 1.69)0.66 (−0.42, 1.76)0.79 (−0.34, 1.92)1.14 (−0.09, 2.37)
  <65 years1.05 (0.24, 1.87)1.20 (0.36, 2.05)1.24 (0.32, 2.17)1.28 (0.33, 2.25)1.40 (0.36, 2.45)
  ≥65 years0.79 (−0.18, 1.77)1.18 (0.17, 2.20)1.46 (0.35, 2.57)1.51 (0.36, 2.66)1.28 (0.05, 2.54)
Cold season
  All1.60 (0.71, 2.50)1.78 (0.88, 2.69)1.83 (0.86, 2.82)2.01 (1.04, 2.98)2.43 (1.47, 3.40)
  Male1.72 (0.72, 2.72)2.15 (1.13, 3.17)2.34 (1.24, 3.44)2.33 (1.26, 3.42)2.17 (1.10, 3.25)
  Female1.34 (0.14, 2.56)1.53 (0.31, 2.77)1.71 (0.39, 3.04)2.13 (0.83, 3.45) 2.94 (1.63, 4.26)
  <65 years1.96 (0.86, 3.06)2.15 (1.03, 3.27)2.19 (0.99, 3.40)2.41 (1.22, 3.61) 2.98 (1.79, 4.18)
  ≥65 years1.04 (−0.16, 2.25)1.58 (0.36, 2.82)1.97 (0.65, 3.31)2.07 (0.77, 3.39)1.81 (0.52, 3.12)
Warm season
  All0.33 (−0.60, 1.26)0.70 (−0.25, 1.65)1.00 (−0.02, 2.03)1.02 (−0.04, 2.06)0.75 (−0.25, 1.76)
  Male0.54 (−0.76, 1.87)0.76 (−0.57, 2.10)0.85 (−0.57, 2.30)0.75 (−0.64, 2.16)0.43 (−0.92, 1.80)
  Female0.38 (−1.22, 2.02)0.26 (−1.36, 1.90)0.10 (−1.64, 1.87)0.07 (−1.63, 1.80)0.24 (−1.42, 1.94)
  <65 years0.51 (−0.79, 1.82)0.60 (−0.70, 1.93)0.64 (−0.77, 2.07)0.66 (−0.71, 2.06)0.69 (−0.66, 2.05)
  ≥65 years0.46 (−1.21, 2.15)0.47 (−1.21, 2.19)0.35 (−1.45, 2.19)0.10 (−1.66, 1.90)−0.27 (−1.99, 1.47)
a “All” meant daily death count, not stratified by sex and age. b Estimates were generated using the distributed lag linear model stratified by season, adjusted for the calendar day [natural cubic spline with 6 df for full year and 4 df for seasonal analysis], day of the week, holiday, temperature (lag0, natural smooth function, 3df), humidity (lag0, natural smooth function, 3df). Bold represents statistically significant results at the 5% level (p < 0.05). represents statistical significance for the difference between the results of the two stratifications at the 5% level (p < 0.05).
Disclaimer/Publisher’s Note: The statements, opinions and data contained in all publications are solely those of the individual author(s) and contributor(s) and not of MDPI and/or the editor(s). MDPI and/or the editor(s) disclaim responsibility for any injury to people or property resulting from any ideas, methods, instructions or products referred to in the content.

