
An Analysis of Regional Ozone Pollution Generation and Intercity Transport Characteristics in the Yangtze River Delta

Abstract
1. Introduction
2. Data and Methods
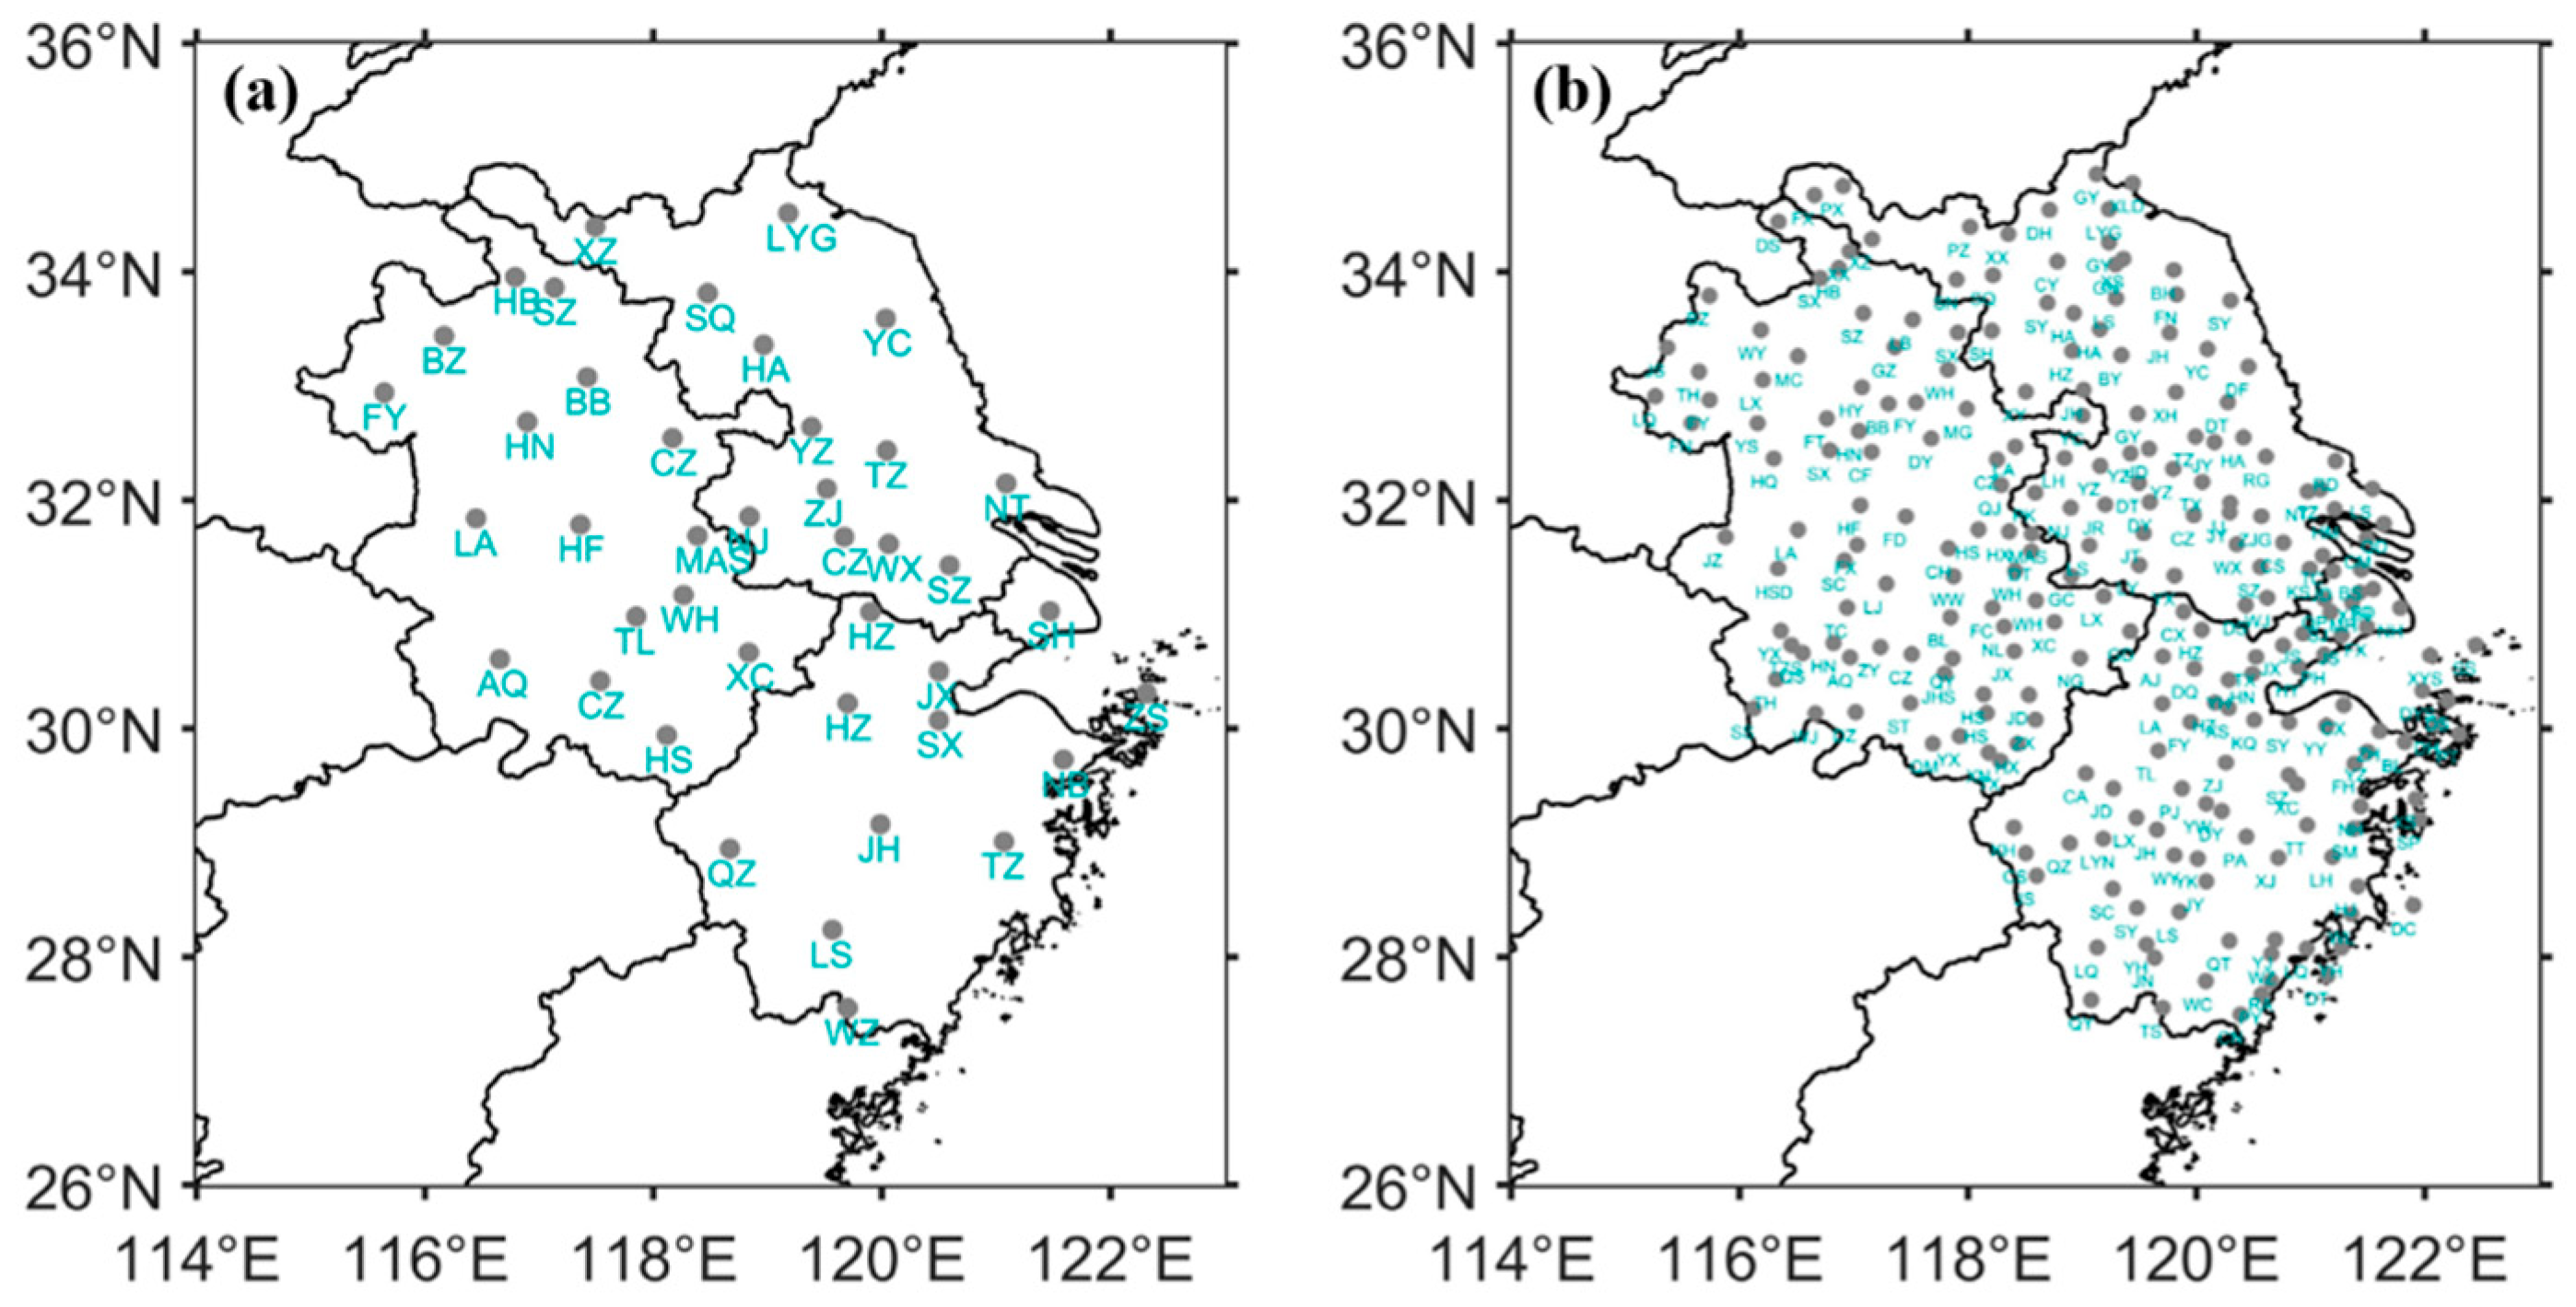
2.1. Data Source
2.2. Methods
2.2.1. TCEQ Method
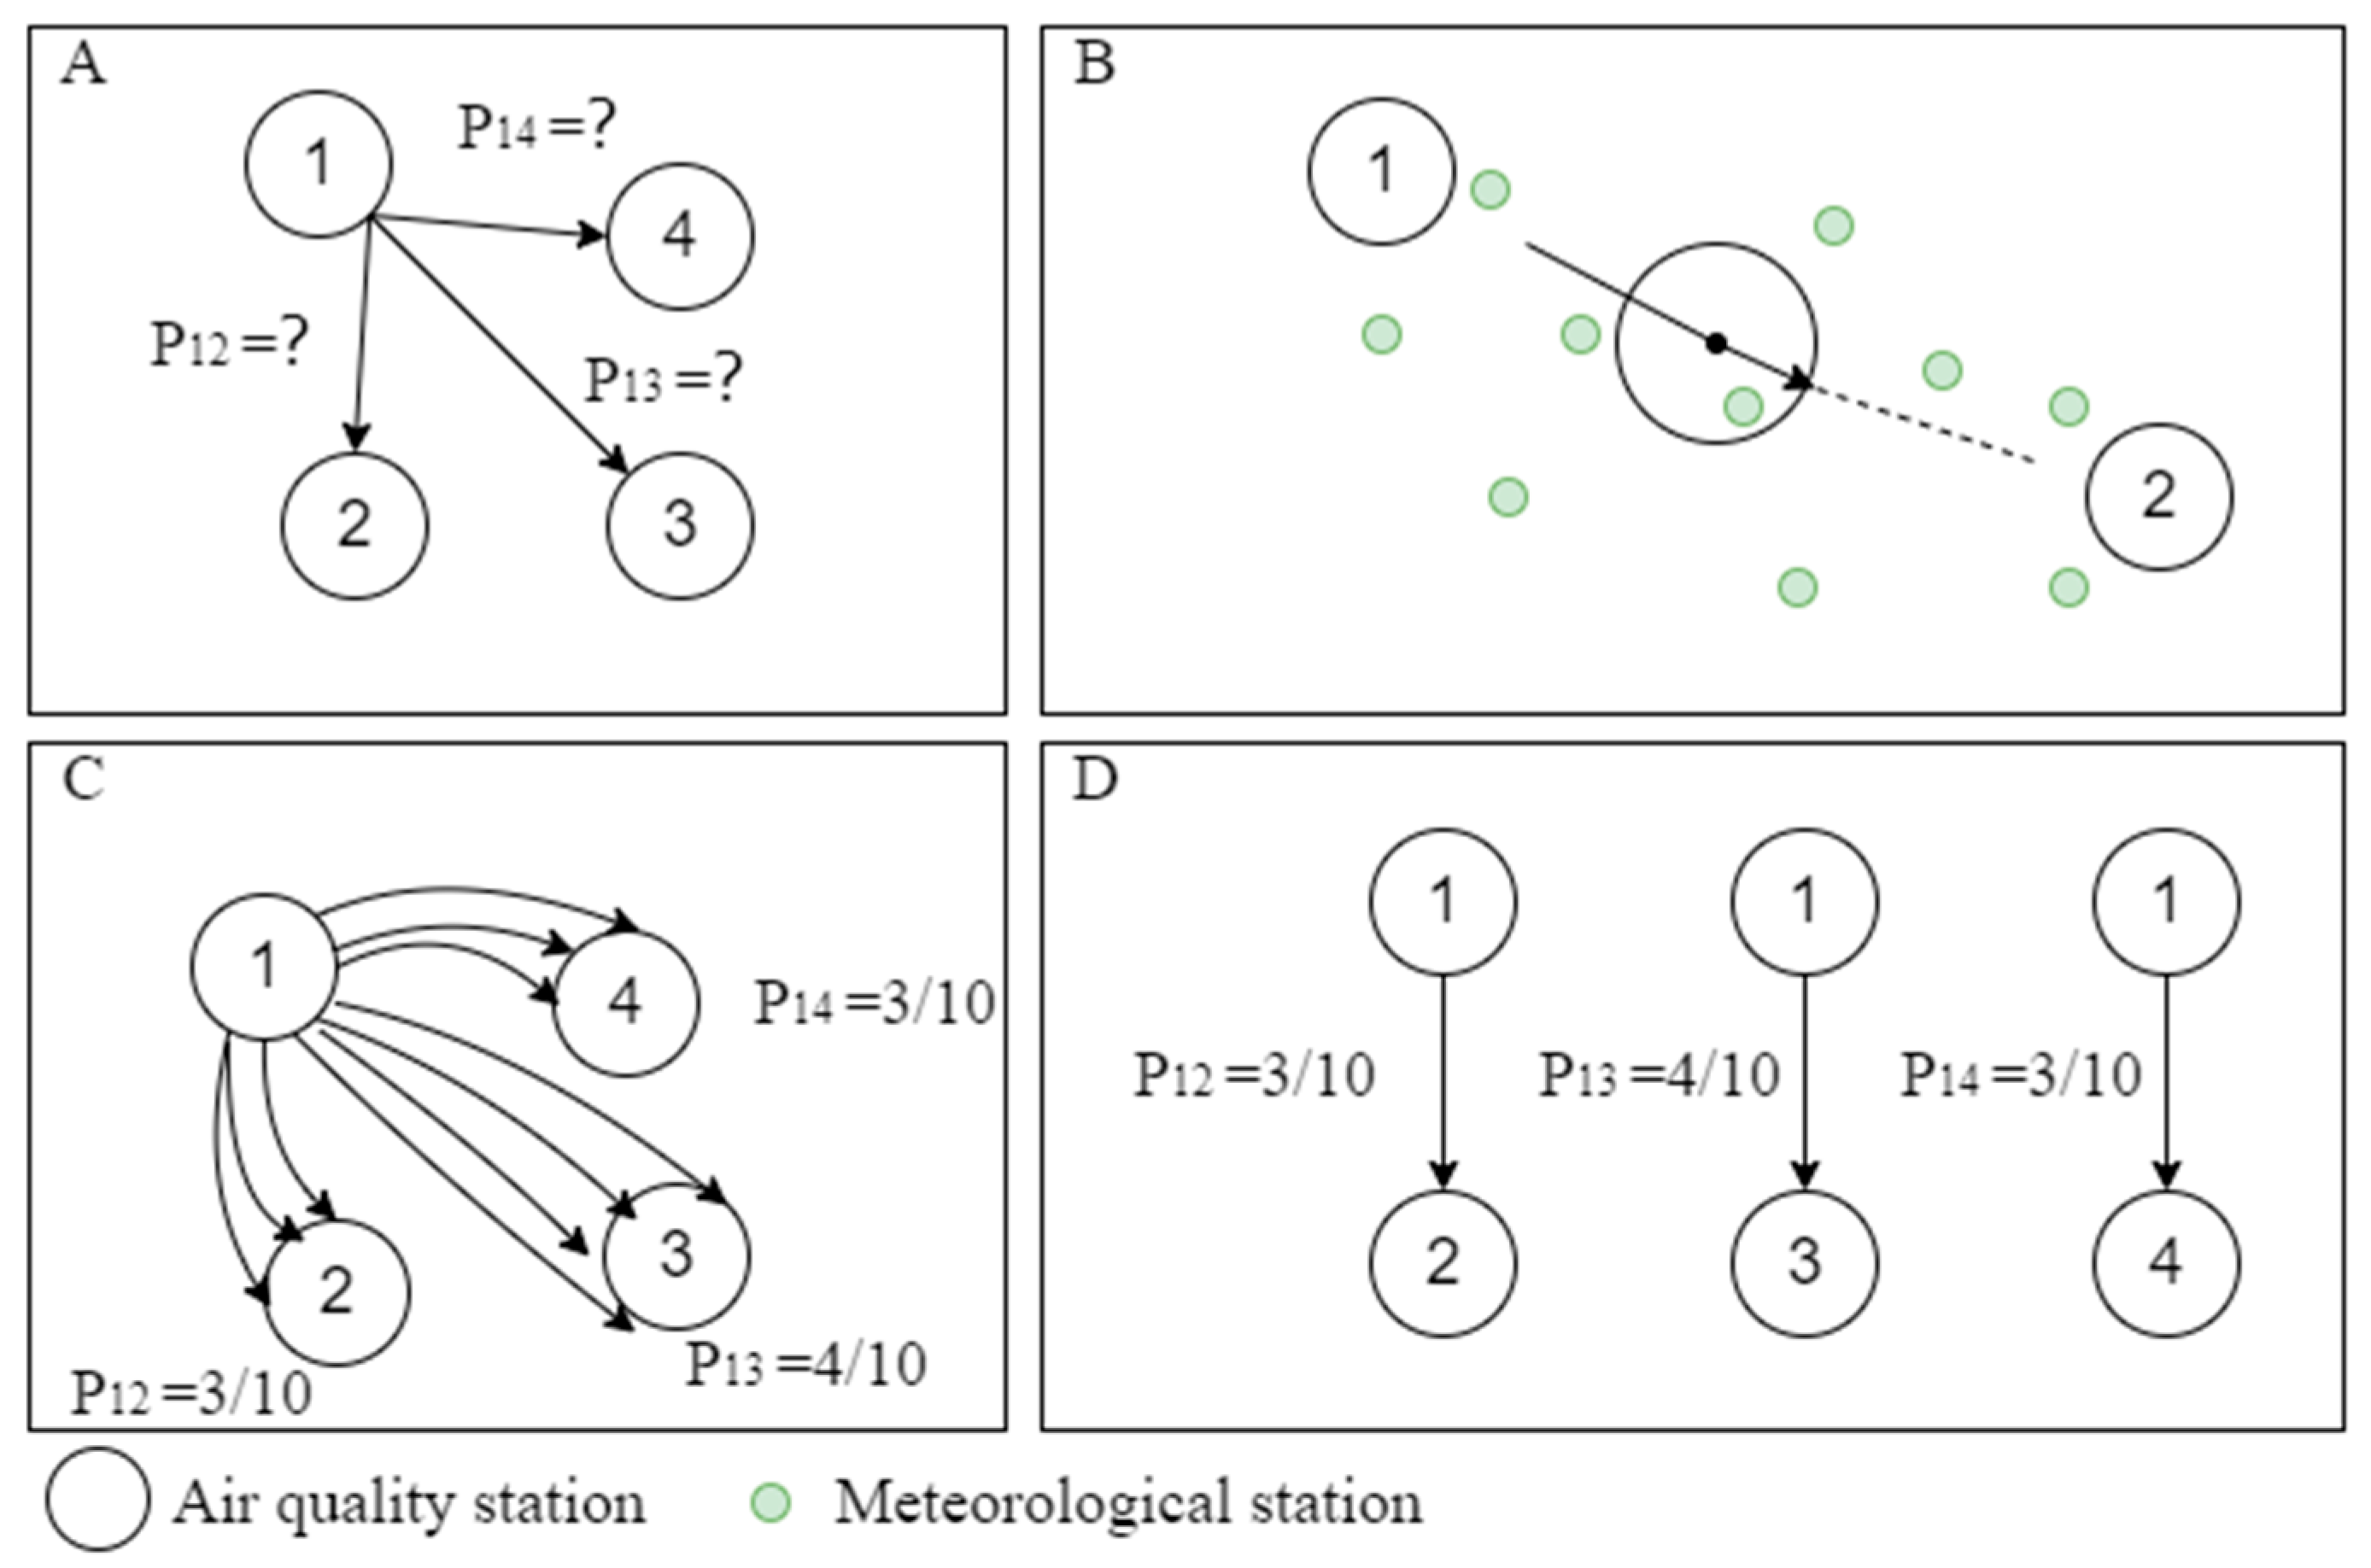
2.2.2. O3 Transport Rate Algorithm
- (1)
- Quantitative modeling based on hourly O3 and meteorological parameter observations.
- (2)
- Backward trajectory calculation to model observed O3 transport paths.
- (3)
- Clustering analysis to identify key transport channels and to quantify intercity transport contributions across five defined spatial categories.
3. Results
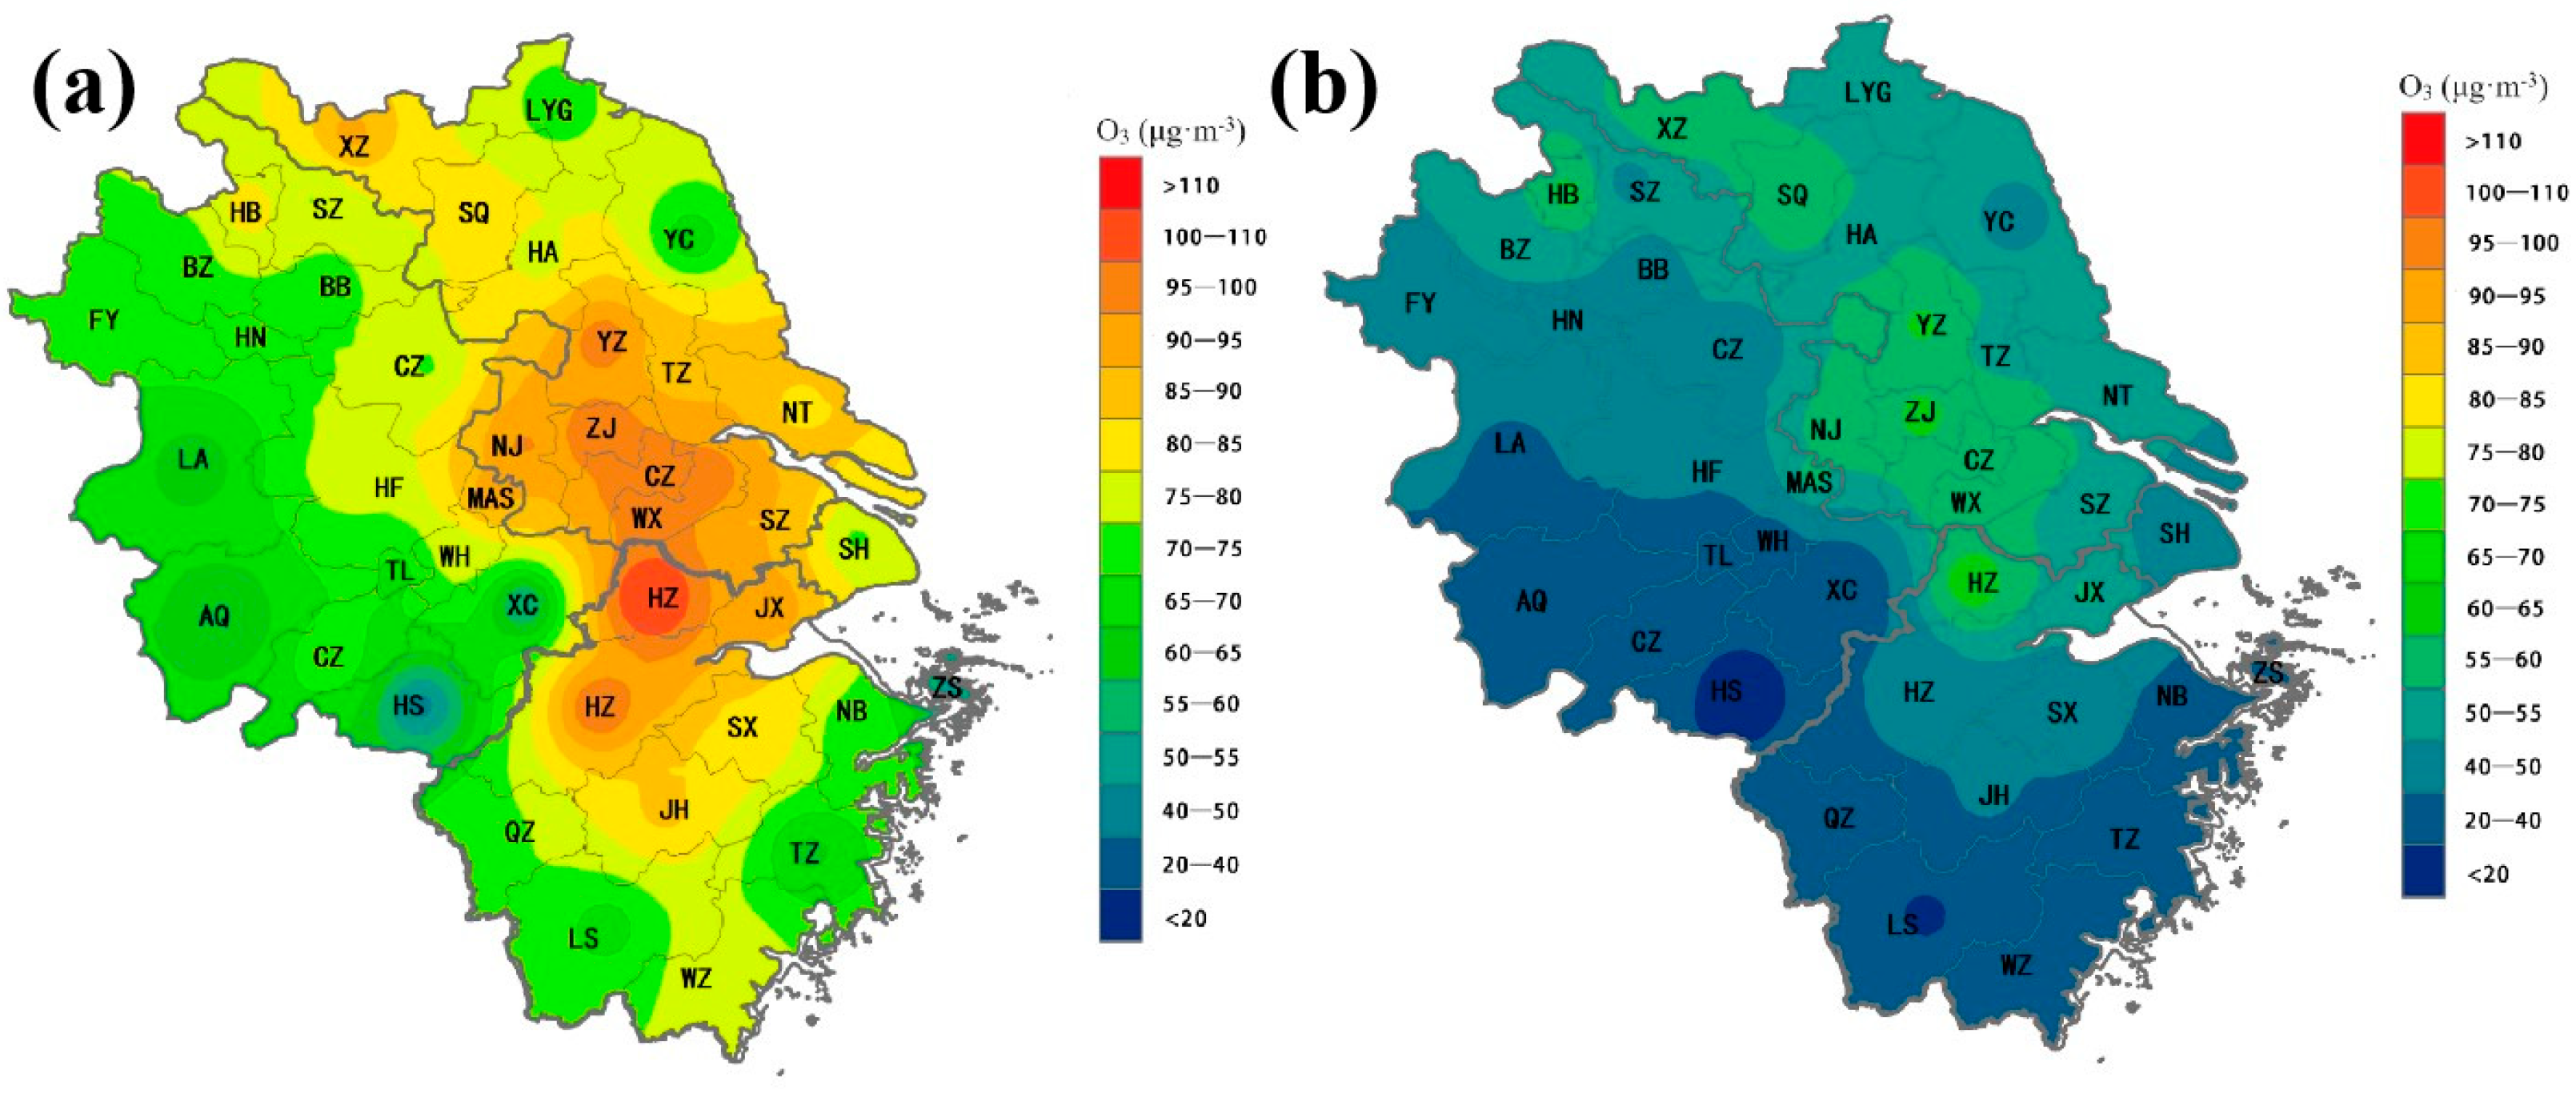
3.1. Estimation of Regional Background Ozone and Locally Generated Concentrations
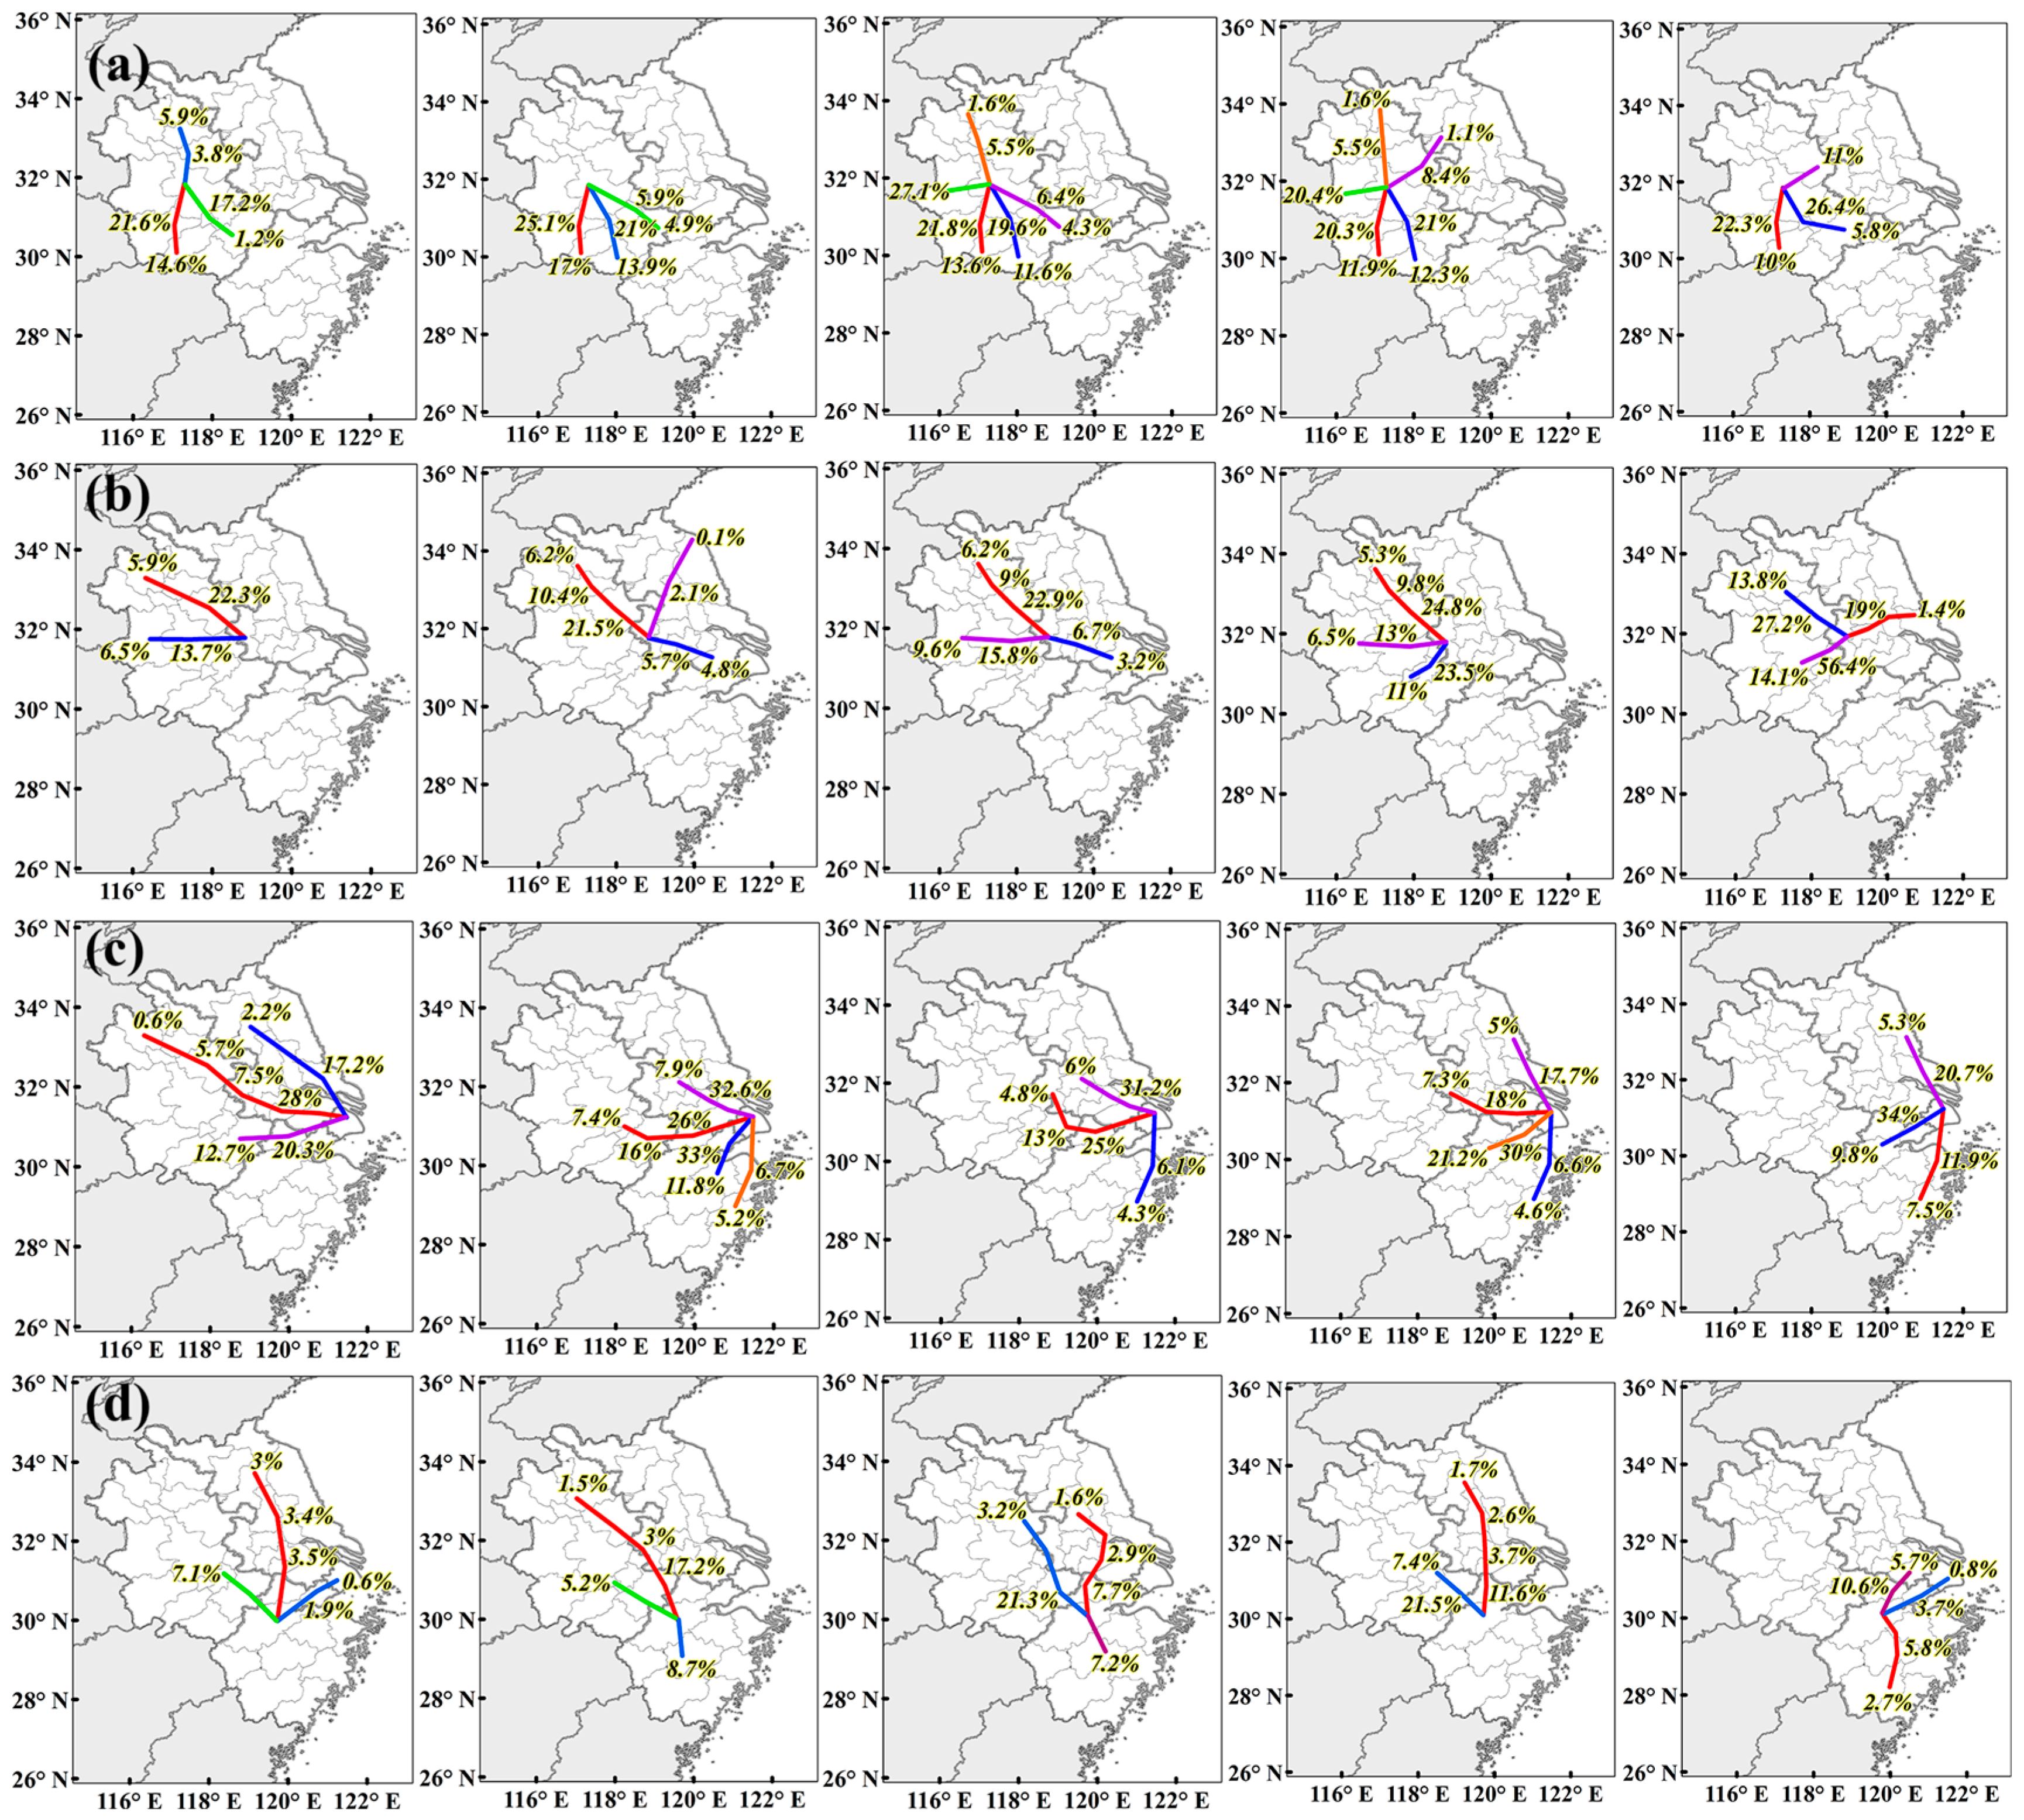
3.2. Transportation Routes and Contribution Rates of Key Cities
4. Discussion and Summary
- (1)
- The average O3 concentration in the YRD from May to September is approximately 44.9 μg·m−3, with local generation accounting for about 36.3% of the total O3 (encompassing both regional background and locally generated concentrations). High ozone concentrations are prevalent in most areas of Jiangsu, Northern Anhui, and Northern Zhejiang, with the area around Taihu Lake exhibiting the highest background O3 levels in the region. Notably, Huzhou records an exceptionally high background concentration of 108.7 μg·m−3.
- (2)
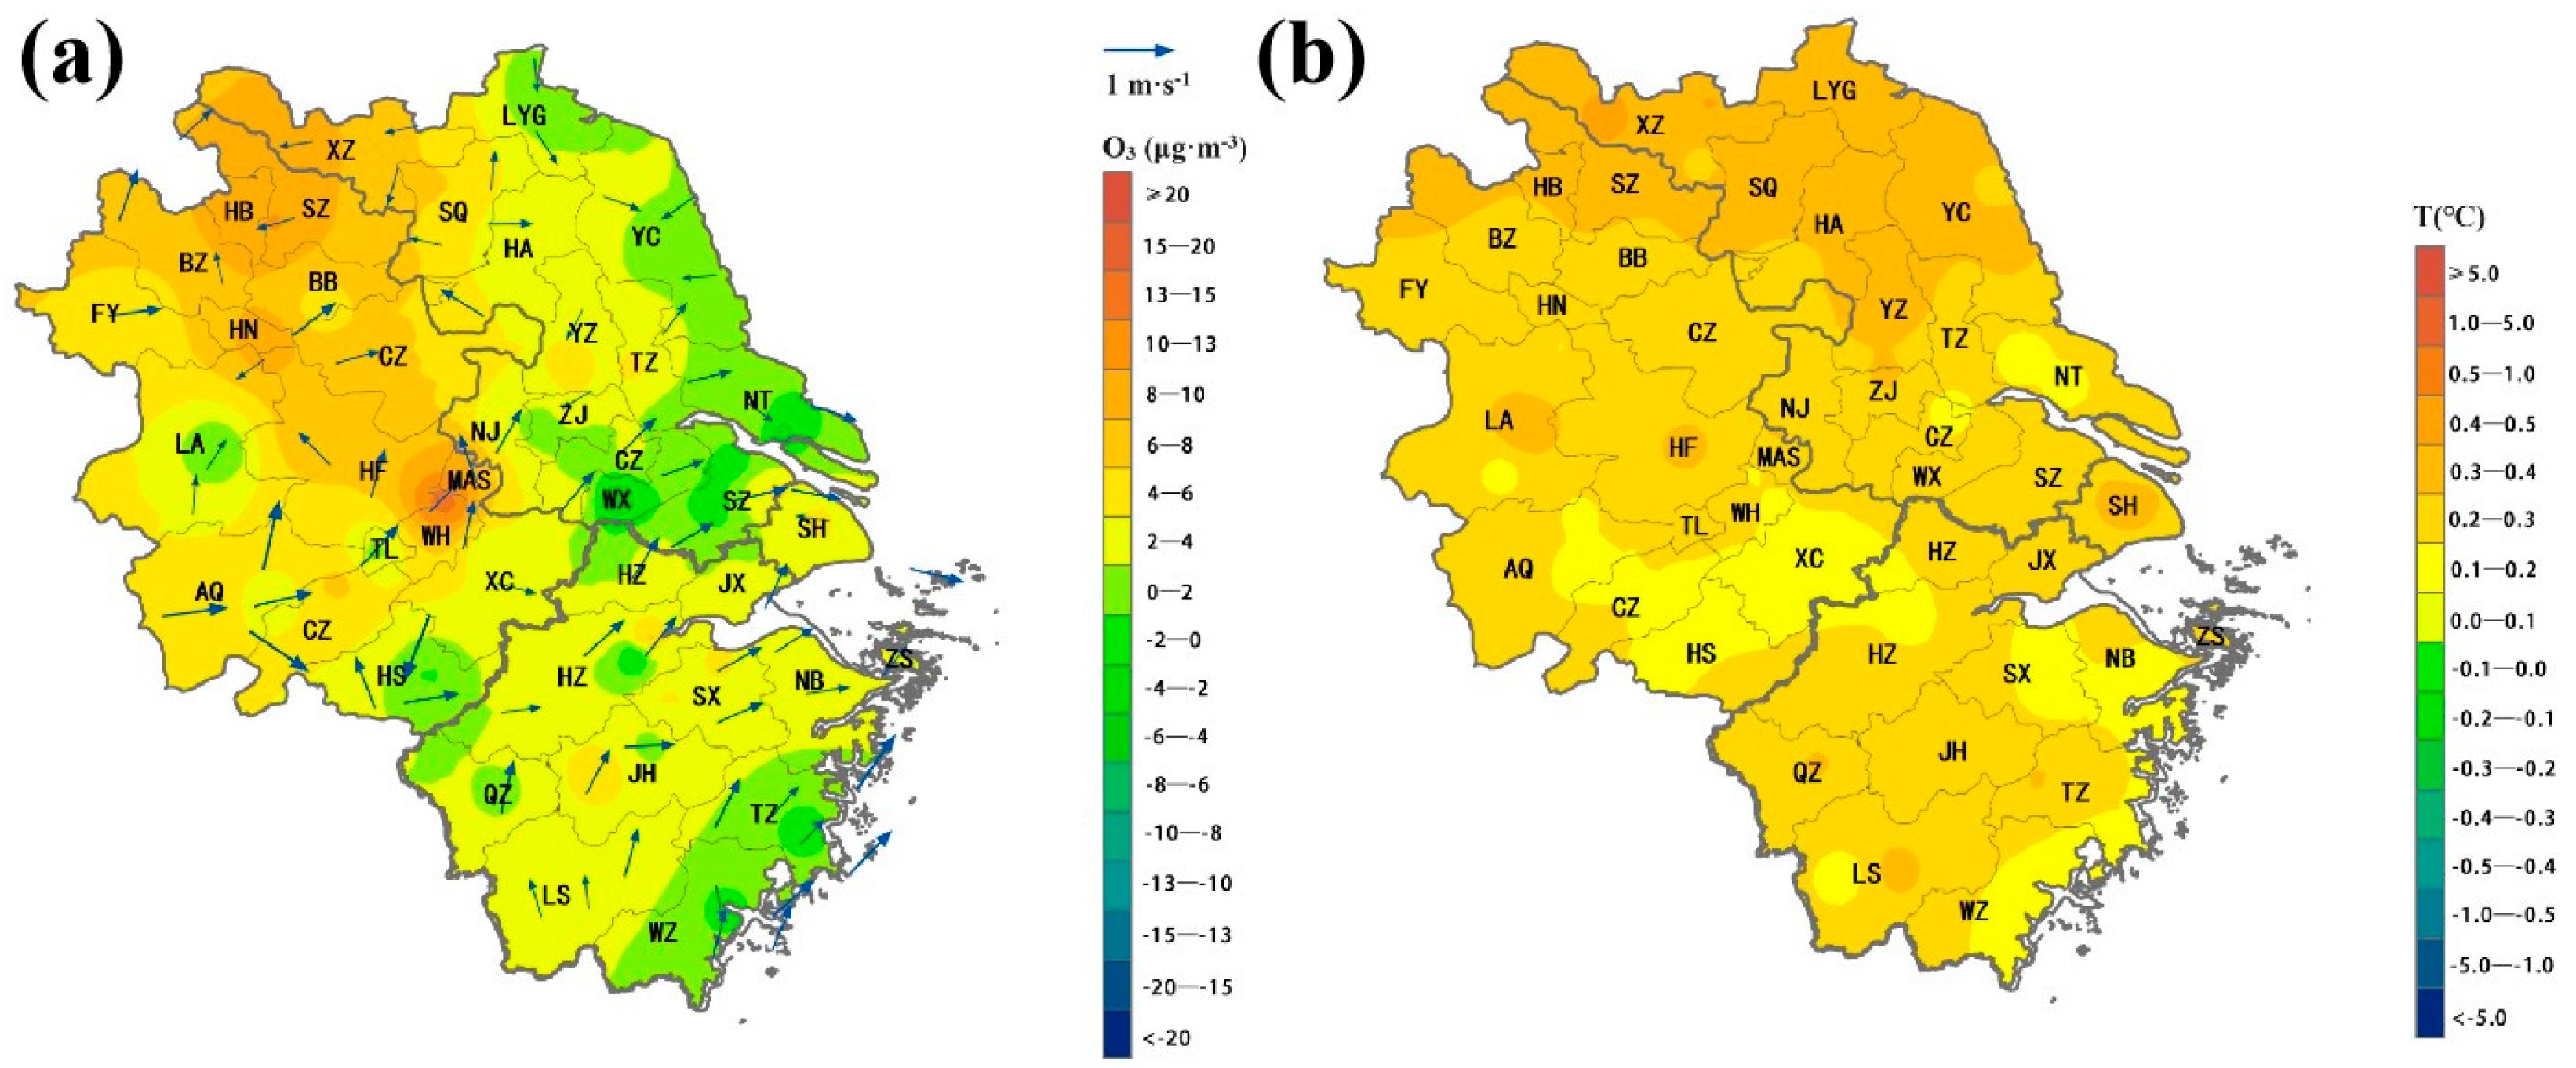
- From 2015 to 2022, background and local O3 generation rates across the YRD gradually increased. In particular, 2022—a year marked by one of the most severe complex dry heat events since the establishment of monitoring systems—saw rapid increases in both background concentrations and local production due to extensive O3 formation. Annual synthesis analyses highlight that wind convergence is likely a significant factor in the heightened O3 concentrations observed in Anhui and Northwest Jiangsu. Additionally, bioVOC emissions transported from western and southern mountainous regions substantially influence O3 levels in Hefei, Ma’anshan, Wuhu, and Nanjing, while ozone transport to Shanghai is closely linked with prevailing southwest winds and southerly breezes. During years of high local generation, elevated temperature anomalies align with O3 production patterns, underscoring the strong positive correlation between the temperature and ozone formation.
- (3)
- Using the TOR methodology, mutual transport contributions among forty-two cities within the YRD are estimated to range between 45.2% and 65.1%, indicating that transported contributions to ozone levels generally exceed those from local generation. Specifically, for the four focal cities, Shanghai shows significant transmission impacts, with contributions exceeding 50%, while Hangzhou experiences minimal transport impacts at under 20%. The TOR method effectively quantifies air pollution transport rates by combining ground-level measurements with wind field data, addressing uncertainties in inter-regional pollutant transport caused by wind field fluctuations. This approach provides an improvement over previous methodologies by accurately characterizing pollutant transfer dynamics across the YRD and distinguishing regional pollutant trajectories.
- (4)
- The characteristics of ozone transport between cities in the Yangtze River Delta region are significant. From the perspective of key cities, some cities are affected by the main wind direction, while others have different transport distances. These differences are related to ozone pollution types and weather conditions and need further discussion.
Author Contributions
Funding
Institutional Review Board Statement
Informed Consent Statement
Data Availability Statement
Conflicts of Interest
References
- Zhan, Y.; Luo, Y.Z.; Deng, X.F.; Grieneisen, M.L.; Zhang, M.H.; Di, B.F. Spatiotemporal prediction of daily ambient ozone levels across China using random forest for human exposure assessment. J. Environ. Pollut. 2018, 233, 464–473. [Google Scholar] [CrossRef]
- Li, M.; Zhang, Q.; Kurokawa, J.-I.; Woo, J.-H.; He, K.; Lu, Z.; Ohara, T.; Song, Y.; Streets, D.G.; Carmichael, G.R.; et al. MIX: A mosaic Asian anthropogenic emission inventory under the international collaboration framework of the MICS-Asia and HTAP. J. Atmos. Chem. Phys. 2017, 17, 935–963. [Google Scholar] [CrossRef]
- Yang, J.; Bu, D.; Liu, J.; Du, M. A Review of the Current Status of Urban Ozone Pollution Prevention and Control in China. J. Environ. Sustain. Dev. 2022, 4, 86–90. [Google Scholar]
- Zhao, Y. Characteristics of Ozone Pollution and Source Apportionment of VOCs in Typical Cities of the Yangtze River Delta Region. J. Environ. Sci. Res. 2024, 37, 1500–1512. [Google Scholar] [CrossRef]
- Wang, Q. Characteristics of VOCs Variations and Their Contribution to O3 Pollution in the Summer of Shanghai’s Suburbs. J. Environ. Sci. 2023, 45. [Google Scholar] [CrossRef]
- Li, L.; Xu, J.; An, J.Y.; Huang, C.; Zhu, S.H.; Zhou, M.; Li, X.M. The air pollution issues under the economic and energy constraint and their implications on the regional joint-effort in the Yangtze River Delta region. J. China. J. Environ. Manag. 2017, 9, 9–18. [Google Scholar] [CrossRef] [PubMed]
- Sun, L.; Zhang, H.; Wang, H.B.; Wei, Y.W. Temporal and Spatial Distribution of Ozone in Typical Cities of Yangtze River Delta Region and Its Correlation with Meteorological Factors. J. Atmos. Environ. Optics. 2021, 16, 483–494. [Google Scholar]
- Wang, Y.; Zhu, S.; Ma, J.; Shen, J.; Wang, P.; Wang, P.; Zhang, H. Enhanced atmospheric oxidation capacity and associated ozone increases during COVID-19 lockdown in the Yangtze River Delta. J. Sci. Total Environ. 2021, 768, 144796. [Google Scholar] [CrossRef]
- Lin, W.; Guo, X. Spatial and temporal distribution characteristics of ozone in urban agglomerations in China. J. China Environ. Sci. 2022, 42, 24812494. [Google Scholar]
- Fan, Q.; Liu, Y.; Wang, X.; Fan, S.; Chan, P.W.; Lan, J.; Feng, Y. Effect of different meteorological fields on the regional air quality modelling over Pearl River Delta, China. J. Int. J. Environ. Pollut. 2013, 53, 3–23. [Google Scholar] [CrossRef]
- Zhang, Z.; Zhang, X.; Gong, D.; Quan, W.; Zhao, X.; Ma, Z.; Kim, S.-J. Evolution of surface O3 and PM2.5 concentrations and their relationships with meteorological conditions over the last decade in Beijing. J. Atmos. Environ. 2015, 108, 67–75. [Google Scholar] [CrossRef]
- Huang, X.-G.; Zhao, J.-B.; Cao, J.-J.; Song, Y.-Y. Spatial-temporal variation of ozone concentration and its driving factors in China. J. Environ. Sci. 2019, 40, 1120–1131. [Google Scholar]
- Liu, J.; Wu, D.; Fan, S.J.; Deng, T. Influence of Precursors and Meteorological Factors on Ozone Pollution in the Pearl River Delta Region. J. China Environ. Sci. 2017, 37, 813–820. [Google Scholar]
- Xie, F.J.; Lu, X.B.; Yang, F.; Li, W.Q.; Li, J.; Xie, Y.S.; Wang, Y.; Liu, Y.H.; Wang, Q.J.; Hu, J.L. Impact of Ozone Pollution Transport and Identification of Potential Source Regions during Spring and Summer 2017 in Nanjing Area. J. Environ. Sci. 2021, 42, 88–96. [Google Scholar]
- Zhao, S.; Yu, Y.; Qin, D.; Yin, D.; Dong, L.; He, J. Analyses of regional pollution and transportation of PM2.5 and ozone in the city clusters of Sichuan Basin, China. J. Atmos. Pollut. Res. 2019, 10, 374–385. [Google Scholar] [CrossRef]
- Liu, N.; Yu, Y.; Ma, X.Q. Seasonal Characteristics of Air Pollution Sources and Transport in Xining City. J. Environ. Sci. 2021, 42, 1268–1279. [Google Scholar]
- Li, W.; Sheng, L.; Song, Z.X.; Chen, J.; Hu, J.; Tong, H. Source Apportionment of Particulate Matter in February at Beijing National Olympic Sports Center Based on Multiple TSM Methods. J. Meteorol. Mon. 2020, 46, 687–694. [Google Scholar]
- Potier, E.; Waked, A.; Bourin, A.; Minvielle, F.; Péré, J.C.; Perdrix, E.; Michoud, V.; Riffault, V.; Alleman, L.Y.; Sauvage, S. Characterizing the regional contribution to PM10 pollution over northern France using two complementary approaches: Chemistry transport and trajectory-based receptor models. J. Atmos. Res. 2019, 223, 1–14. [Google Scholar] [CrossRef]
- Nzotungicimpaye, C.M.; Abiodun, B.J.; Steyn, D.G. Tropospheric ozone and its regional transport over Cape Town. J. Atmos. Environ. 2014, 87, 228–238. [Google Scholar] [CrossRef]
- Vellingiri, K.; Kim, K.H.; Lim, J.M.; Lee, J.-H.; Ma, C.-J.; Jeon, B.-H.; Sohn, J.-R.; Kumar, P.; Kang, C.-H. Identification of nitrogen dioxide and ozone source regions for an urban area in Korea using back trajectory analysis. J. Atmos. Res. 2016, 176–177, 212–221. [Google Scholar] [CrossRef]
- Xue, L.K.; Wang, T.; Gao, J.; Ding, A.J.; Zhou, X.H.; Blake, D.R.; Wang, X.F.; Saunders, S.M.; Fan, S.J.; Zuo, H.C.; et al. Ground-level ozone in four Chinese cities: Precursors, regional transport and heterogeneous processes. J. Atmos. Chem. Phys. 2014, 14, 13175–13188. [Google Scholar] [CrossRef]
- Wang, M.; Yim, S.H.; Wong, D.; Ho, K. Source contributions of surface ozone in China using an adjoint sensitivity analysis. J. Sci. Total Environ. 2019, 662, 385–392. [Google Scholar] [CrossRef]
- Wang, P.; Chen, Y.; Hu, J.; Zhang, H.; Ying, Q. Source apportionment of summertime ozone in China using a source-oriented chemical transport model. Atmospheric Environ. 2019, 211, 79e90. [Google Scholar] [CrossRef]
- Kalnay, E.; Kanamitsu, M.; Kistler, R.; Collins, W.; Deaven, D.; Gandin, L.; Iredell, M.; Saha, S.; White, G.; Woollen, J.; et al. The NCEP/NCAR 40-year reanalysis project. J. Bull. Am. Meteorol. Soc. 1996, 77, 437–471. [Google Scholar] [CrossRef]
- Nielson-Gammon, J.; Tobin, J.; Mcneel, A.; Li, G. A Conceptual Model for Eight-Hour Ozone Exceedances in Houston, Texas Part I: Background Ozone Levels in Eastern Texas; Texas A&M University: College Station, TX, USA, 2005. [Google Scholar]
- Stein, A.; Draxler, R.R.; Rolph, G.D.; Stunder, B.J.B.; Cohen, M.D.; Ngan, F. Noaa’s hysplit atmospheric transport and dispersion modeling system. J. Bull. Am. Meteorol. Soc. 2015, 96, 2059–2077. [Google Scholar] [CrossRef]
- Shneiderman, B. The Eyes Have It: A Task by Data Type Taxonomy for Information Visualizations. In Proceedings of the 1996 IEEE Symposium on Visual Languages, Boulder, CO, USA, 3–6 September 1996; pp. 336–343. [Google Scholar]
- Seinfeld, J.H. Urban air pollution:state of the science. J. Sci. 1989, 243, 745–752. [Google Scholar]
- Draxler, R.R.; Hess, G.D. Description of the HYSPLIT-4 Modeling System; NOAA Technical Memorandum ERL ARL-224; NOAA Air Resources Laboratory: Silver Spring, MD, USA, 1997; pp. 1–24.
- Cao, Y.; Qu, Y.H.; Ma, J.H. Classification of ozone pollution and analysis of meteorological factors in the Yangtze River Delta. J. Big Earth Data 2023, 7, 318–337. [Google Scholar] [CrossRef]
- Langford, A.O.; Senff, C.J.; Banta, R.M.; Alvarez, R.J.; Sandberg, S.P.; Darby, L.S. Regional and local background ozone in Houston during Texas Air Quality Study 2006. J. Geophys. Res. Atmos. 2009, 114. [Google Scholar] [CrossRef]
- Liang, Y.; Liu, Y.H.; Wang, H.; Li, L.; Duan, Y.; Lu, K. Regional characteristics of ground-level ozone in Shanghai based on PCA analysis. J. Acta Sci. Circumstantiae 2018, 38, 3807–3815. [Google Scholar]
- Wu, L.; Xue, L.K.; Wang, W.X. Review on the observation-based methods for ozone air pollution research. J. Earth Environ. 2017, 8, 479–491. [Google Scholar]
- Shu, L.; Wang, T.J.; Han, H. Summertime ozone pollution in the Yangtze River Delta of eastern China during 2013–2017: Synoptic impacts and source apportionment. J. Environ. Pollut. 2019, 257, 113631. [Google Scholar] [CrossRef] [PubMed]


| Provincial | Observation Station Number | Data Quantity | Data Efficiency |
|---|---|---|---|
| Anhui | 73 | 1,301,736 | 97% |
| Jiangsu | 114 | 2,032,848 | 98% |
| Zhejiang | 59 | 1,052,088 | 98% |
| Shanghai | 10 | 178,320 | 99% |
Disclaimer/Publisher’s Note: The statements, opinions and data contained in all publications are solely those of the individual author(s) and contributor(s) and not of MDPI and/or the editor(s). MDPI and/or the editor(s) disclaim responsibility for any injury to people or property resulting from any ideas, methods, instructions or products referred to in the content. |
© 2025 by the authors. Licensee MDPI, Basel, Switzerland. This article is an open access article distributed under the terms and conditions of the Creative Commons Attribution (CC BY) license (https://creativecommons.org/licenses/by/4.0/).
Share and Cite
Cao, Y.; Ma, J.; Wang, X.; Bian, J. An Analysis of Regional Ozone Pollution Generation and Intercity Transport Characteristics in the Yangtze River Delta. Atmosphere 2025, 16, 158. https://doi.org/10.3390/atmos16020158
Cao Y, Ma J, Wang X, Bian J. An Analysis of Regional Ozone Pollution Generation and Intercity Transport Characteristics in the Yangtze River Delta. Atmosphere. 2025; 16(2):158. https://doi.org/10.3390/atmos16020158
Chicago/Turabian StyleCao, Yu, Jinghui Ma, Xiaoyi Wang, and Juanjuan Bian. 2025. "An Analysis of Regional Ozone Pollution Generation and Intercity Transport Characteristics in the Yangtze River Delta" Atmosphere 16, no. 2: 158. https://doi.org/10.3390/atmos16020158
APA StyleCao, Y., Ma, J., Wang, X., & Bian, J. (2025). An Analysis of Regional Ozone Pollution Generation and Intercity Transport Characteristics in the Yangtze River Delta. Atmosphere, 16(2), 158. https://doi.org/10.3390/atmos16020158