Article

Methodological Development for Studying the Chemical Composition of Exhaust Particle Emissions: Application to a Passenger Vessel Operating on Marine Gas Oil

1
IMT Atlantique, CNRS, GEPEA, UMR 6144, 4 rue Alfred Kastler, 44307 Nantes, France
2
ESTACA, ESTACA’Lab—Paris Saclay, F−78180 Montigny-Le-Bretonneux, France
*
Author to whom correspondence should be addressed.
Atmosphere 2025, 16(2), 126; https://doi.org/10.3390/atmos16020126
Submission received: 25 November 2024 / Revised: 17 January 2025 / Accepted: 19 January 2025 / Published: 24 January 2025

Abstract

:
On-board emission measurements were conducted at the exhaust of a passenger ship operating under real-world conditions. The chemical composition of exhaust particulate emissions from a turbocharged four-stroke marine diesel engine, operated on Marine Gas Oil was studied. A variety of organic compounds, including alkanes, alkenes, alcohols, cycloalkanes, cycloalkenes, esters, ketones, carboxylic acids, etc., were analyzed. Alkanes were the most abundant organic compounds, followed by alkenes, esters, and alcohols. Emission factors for these compounds were determined under two operating conditions: low engine load (at berth at 400 rpm/4% load, and during port maneuvers at 800 rpm/14% load) and high engine load (during cruising at 1000 rpm, 68% load). A clear increase in organic-compound emission factors was observed at lower loads. The total particulate matter emission factors were between 0.02 and 0.03 g/kWh at high-load points and exhibited significant variability under low-load conditions, from 0.02 to 2.83 g/kWh. The effect of a marine fuel additive was evaluated in this study. Using this fuel additive resulted in a significant decrease in both particulate matter and organic-compound emission factors, especially at low engine loads. Furthermore, the marine fuel additive decreased the total emission factors ( E F T O C s ) by a factor of 56 under low-load conditions. For high loads, the additive had no effect on the EFTOCs.

1. Introduction

Maritime traffic serves as a crucial mode of transportation worldwide, particularly in regions where road or air travel is unfeasible or costly. Shipping represents about 90% of the global trade transportation capacity by volume to and from the European Community member states and about 80% of the weight of all goods imported and exported by the United States [1,2]. The cruise industry has experienced significant growth, global demand for cruising increased by 77% from 2003 to 2013, rising from 12.0 million to 21.3 million passengers [2,3]. This growth was accompanied by a proportional increase in the sector’s contribution to atmospheric pollution [2]. Shipping is a major contributor to both particulate and gaseous air pollution, both globally and for coastal urban zones. In France, the contribution of the maritime transport sector to air pollution appears low when considering conventional emission inventory approaches. However, this pollution is concentrated, especially in port areas where ships conduct regular maneuvers. Global annual estimates indicate that nearly 70% of particulate matter (PM) emissions from shipping occur within 400 km of the coast [4]. Furthermore, emissions from ships can be carried over hundreds of kilometers through the atmosphere, deteriorating air quality on land even when they are released at sea [5].
Particulate and gaseous emissions from ships have garnered growing attention due to their potential effects on climate change [6,7], air quality [8,9,10,11,12], and human health [13,14,15,16].
Ship emissions are largely dependent on fuel quality [17,18,19,20] and the operation conditions of the engine [21,22,23]. Marine fuels are classified into five types based on their blends and viscosity: (1) Marine Gas Oil (MGO), similar to automotive diesel fuel used in land vehicles; (2) Heavy Fuel Oil (HFO), the lowest grade of marine fuel, consisting of high-viscosity residual oil that requires preheating before use; (3) Marine Diesel Oil (MDO), a blend of HFO and MGO, with low viscosity and no need for preheating; (4) Intermediate Fuel Oil (IFO), similar to MDO, being a mixture of residual oil (or HFO) and MGO, but with different proportions; and (5) Marine Fuel Oil (MFO), almost identical to HFO, though it contains less MGO than IFO [24].
While MDO is the standard reference fuel for marine diesel engines, HFO is the fuel commonly employed on board [25]. Due to the usage of HFO, marine vessels generate a high amount of fine and ultrafine PM (PM10 and PM2.5), containing elemental carbon (EC), organic carbon (OC), metals (V, Ni, Cr, Fe), and polycyclic aromatic hydrocarbons (PAHs) [26,27,28,29]. Burning HFO also generates nitrogen oxides (NOX), sulphur oxide (SOX), carbon dioxide (CO2), carbon monoxide (CO), and volatile and semi-volatile organic compounds (VOC) [5,30].
Since all these pollutants are produced during the combustion process, understanding the mechanisms of combustion in diesel engines is a necessary first step. Unlike gasoline engines, where combustion is initiated by an electric spark at a specific point, diesel engine combustion begins through autoignition at multiple locations within the combustion chamber. In a diesel engine, fuel is introduced into the cylinder as a liquid spray through a nozzle under the effect of a high-pressure differential. The injected fuel is disintegrated into droplets of diverse sizes and concentrations. At the start of the injection, the fuel is slowed down by the drag of the air moving along the spray axis. The following droplets encounter less resistance, allowing them to overtake the slower ones and push them toward the edges of the spray. As a result, the droplets at the center become less atomized. At the front of the spray, the droplets face the highest aerodynamic resistance, but the spray continues to move forward as the slower droplets are replaced by newer, higher momentum ones. This means that the droplets on the spray’s periphery are the first to be injected, evaporating quickly and mixing with the air [31]. The highly compressed and heated air in the chamber causes the fuel to evaporate and mix, creating a heterogeneous fuel–air mixture. Autoignition occurs when the temperature and pressure in the combustion chamber reach a critical threshold, causing the fuel-air mixture to ignite spontaneously without the need for a spark. The combustion process in diesel engines involves several chemical reactions, primarily the decomposition of heavy hydrocarbons into lighter components, followed by preignition reactions between these decomposed components and oxygen. These complex reactions occur in stages, contributing to both heat release and emission formation. It is challenging to clearly separate the physical and chemical processes in diesel engine combustion, as they overlap. The chemical processes begin when the fuel vapor contacts the air. However, in the early stages of injection, the amount of fuel vapor undergoing chemical reactions is too small to cause detectable combustion. As a result, the initial stages of preignition are dominated by physical processes (spray disintegration, droplet formation, heating of the liquid fuel, evaporation, and vapor diffusion) that create a combustible mixture. Later stages are driven primarily by chemical changes leading to autoignition [31].
Diesel engine combustion is influenced by various factors, including fuel properties such as viscosity, cetane number, blends, and sulfur content, which affect ignition quality and atomization. The air–fuel mixture quality, along with injection timing, pressure, and injector nozzle design, are crucial for efficient combustion. Operating conditions like engine load, speed, and intake air temperature impact in-cylinder pressure and oxygen levels. The compression ratio, air swirl, and combustion chamber design also play a key role in combustion efficiency. Exhaust gas recirculation (EGR) helps reduce NOX emissions but can affect combustion stability. These parameters work together and require careful optimization for improved efficiency and reduced pollutants [24,31].
Soot, or black carbon (BC), is regarded as one of the most harmful pollutants produced during diesel engine combustion [32]. Soot has been classified as a carcinogenic substance by the World Health Organization [33]. The smallest particles are capable of penetrating deep into the human body and contributing to heart and pulmonary diseases [34,35]. Globally, shipping emissions are estimated to cause hundreds of thousands of premature deaths annually [36]. Furthermore, soot is recognized as the second most significant anthropogenic contributor to global warming, following CO2 emissions [37]. Soot is mainly produced from the incomplete combustion of fuel under high-temperature, oxygen-deficient conditions, along with the re-accumulation of hydrocarbons emitted in the exhaust gases during combustion [38,39]. The elemental analysis of diesel soot revealed that carbon is the predominant component, along with trace amounts of sulfur, oxygen, hydrogen, and metal species [40]. The intricate chemistry underlying soot formation kinetics remains only partially understood to this day. Soot formation, which involves the conversion of a hydrocarbon fuel molecule containing only a few carbon atoms into a carbonaceous agglomerate with millions of carbon atoms, is an exceptionally complex process. It can be viewed as a gas-to-solid phase transition, where the solid phase lacks a distinct chemical and physical structure. Consequently, the formation of soot encompasses a range of chemical and physical phenomena, including the creation and growth of large aromatic hydrocarbons and their transformation into particles, the coagulation of primary particles into larger aggregates, and the growth of solid particles by absorbing growth components from the surrounding gas phase [41]. During oxidation, hydrocarbon fuel is degraded into small hydrocarbon radicals. These radicals promote growth by combining with additional hydrocarbon radicals. As the unsaturated hydrocarbons grow, they form aromatic rings once they reach a sufficiently high carbon atom count. The formation of larger aromatic rings primarily occurs through the addition of acetylene. All these processes operate on molecular length scales. The growth in the third dimension is thought to occur through the coagulation of larger aromatic structures, leading to the formation of primary soot particles. These primary particles rapidly undergo further coagulation, simultaneously absorbing molecules from the gas phase to facilitate surface growth. Surface growth plays a dominant role in determining the final concentration of soot in sooting flames, while coagulation, shifting the process to particle-scale dimensions, governs the ultimate size of the soot particles. The irregular, aggregate structure of soot particles is also attributed to coagulation [41]. Although many critical aspects of PAHs and soot formation remain poorly understood, there is general consensus on the main stages of the process. These stages are summarized as follows [38,42,43,44,45,46]: (1) the formation of molecular precursors of soot, (2) nucleation or particle inception from heavy PAH molecules, (3) particle mass growth via the addition of gas-phase molecules, (4) coagulation through reactive collisions between particles, (5) carbonization of particulate material, and (6) oxidation of PAHs and soot particles. Together, these stages describe the soot formation process. This process is influenced by factors such as temperature, pressure, oxygen concentration, fuel structure, fuel composition, fuel/air stoichiometry, and other external variables [43,45].
Three primary strategies are currently used to control soot emissions: (1) fuel-based approaches, focusing on modifying fuel properties or adopting alternative fuels; (2) engine-based methods, which aim to enhance combustion efficiency for cleaner fuel use; and (3) post-treatment technologies, such as diesel particulate filters (DPFs) and catalytic oxidation systems, designed to reduce emissions before they are released [45,46].
Great efforts are being made to investigate and reduce gaseous and particle emissions from marine diesel engines. Some solutions have been proposed to improve air quality in ports and coastal urban zones. These include establishing emissions control regions and reduced speed areas and adapting shore-side electrification technologies for ships at berth [47,48]. Sulfur environmental control areas (SECAs) in Europe and the US have been established, with the aim of mandating the use of low-sulfur fuels to regulate acidification [49].
Fuel sulfur content used by ocean-going shipping outside of SECAs has been limited by the International Maritime Organization (IMO) to 0.5% since 2020 [19]. In SECAs, the sulfur emissions cap is limited to 0.1% [50]. Also, ships are currently required to switch from HFO to lighter fuels in SECAs to comply with sulfur regulations. The IMO also limits nitrogen oxides and has set regional emission control areas for NOX (NECA, applicable to new ships since 2021).
To address maritime environmental regulations and fuel efficiency requirements, which significantly influence the shipping and shipbuilding sectors, advancing engine technologies and adopting alternative, low-emission energy sources have become imperative to meet the growing demands of the maritime transport industry. At present, biodiesel, methanol, and natural gas represent the principal alternative fuels commercially accessible for marine diesel engines. Biodiesel, produced through the transesterification of vegetable oils or animal fats, is a renewable, biodegradable, and environmentally friendly energy source that is compatible with existing engines and has low toxicity [51,52,53]. Biodiesel can be utilized for ship propulsion without any modifications to the engine systems due to its combustion characteristics being nearly identical to those of conventional diesel. Several engine studies using biodiesel have demonstrated that its performance is comparable to conventional diesel. Additionally, biodiesel engines show improved emissions compared to fossil fuels, with a reduction in PM emissions, although NOX emissions may increase [24,54]. Methanol is another viable option for reducing ship emissions, with no significant issues identified in its supply chain. As an engine fuel, methanol generates low emissions and poses minimal environmental and health risks [55]. Liquefied natural gas (LNG) is also regarded as a potential fuel pathway for decarbonizing the maritime industry and achieving emission reduction targets. LNG can reduce both NOX and PM emissions [56,57]. However, the release of unburned methane from LNG has been identified as a concern, potentially offsetting some of the advantages of using LNG in marine engines [58,59].
The use of fuel additives has also been recommended to optimize fuel consumption and mitigate emissions. Fuel additives are designed to enhance fuel performance, influencing properties such as pumpability and flash point, while their main functions include improving dispersion, boosting lubrication, and facilitating the combustion process [60]. However, the performance of many fuel additives used in the shipping industry has not been fully evaluated, leaving questions about the benefits of their increased use [61].
Numerous studies have investigated the mechanism of PM reduction through fuel additives [62], as well as the characteristics of additive-blended fuels, such as atomization, evaporation, mixing, ignition, and combustion properties [63]. Guerry et al. [64] investigated how varying injection timing affects a diesel–methane dual-fuel combustion engine. This technology offers a potential design strategy for future engines due to its promising ability to reduce NOX and PM emissions. The study, which varied the injection timing, demonstrated an increase in fuel conversion efficiency. Valentine et al. [65] examined the impact of fuel additives on engine emissions and efficiency in on-road engines. The changes in fuel properties resulting from the use of fuel additives on board marine vessels were examined by Han et al. [66]. Babushok et al. [67] examined the influence of additives on the formation of PAHs. They found that metallic additives inhibited soot formation and also explained the mechanism responsible for this suppression. Ethanol-based dual-fuel combustion under low-load conditions was investigated by Pedrozo et al. [68]. Their findings showed that efficiency could be improved by adjusting exhaust gas recirculation, as well as intake air and rail pressures. After performance optimization, NOX and soot emissions were reduced by 65% and 29%, respectively. Wang et al. [69] examined dieseline, a blend of diesel and gasoline, to evaluate whether reducing the ignition delay could enhance combustion efficiency and lower emissions. Li et al. [70] also conducted simulations on the effects of dieseline and concluded that while pure diesel performs well at low loads, dieseline is more efficient at higher engine loads.
Zablotsky and Sagin [60] conducted a study to evaluate the impact of marine fuel additives on fuel performance and environmental outcomes. Their research utilized a medium-speed 6N21L four-stroke diesel engine, operating with RME25 marine fuel (which has a viscosity of 25 sSt at 100 °C and a sulfur content of 2.8% by weight). The fuel was enhanced with an additive containing active oxygen-bearing groups and modified with light metal salts. The study demonstrated that the additive improved fuel efficiency, reducing specific fuel oil consumption by 3.5–5.8% depending on engine load and additive concentration. Environmental benefits included reductions in NOX emissions by 1.4–4.3% and SOX emissions by 15.6–22.9%. Furthermore, the additive improved the technical condition of the cylinder–piston group and exhaust system elements, leading to a 20–25% reduction in maintenance labor. Optimal additive concentration was identified as a key factor, varying with engine and fuel specifications. Jang and Choi [61] conducted a study to assess the effects of fuel oil additives on a real marine engine under low-load conditions. Fuel separability tests showed improved fuel stability with certain additive dosages. Fuel combustion and ignition characteristics, analyzed via a Fuel Combustion Analysis (FCA) test, revealed that combustion parameters, including pressure trace and rate of heat release (ROHR), were significantly influenced by the additives. The results indicated that while some additives reduced fuel consumption, others increased specific fuel oil consumption. Additionally, the study found that fuel additives affected NOX PM emissions.
A large number of studies on exhaust emissions from marine vessels were performed within the last years, including test-bed, ship plume-based and on-board studies [19,25,29,71,72,73,74,75,76,77,78,79,80,81]. These studies considered several types of vessels (cargo, fishing ships, passenger and cruise vessels). These measurement studies focused on PM emissions from different marine engines operated with different types of fuel. The physical characteristics of PM emissions, including morphology and PM number size distribution, were investigated. Nevertheless, in comparison to on-road vehicles, the emissions of particulate and gaseous compounds from ships are still not well known, particularly in real-world usage at sea during all operational modes. A very limited number of on-board measurement studies have been undertaken. Alfödy et al. [82] analyzed sulfur dioxide (SO2), NOX, and PM emissions from the exhaust plumes of passing ships. Their findings showed a clear increase in SO2 emission factors (EFs) with higher engine power, while NOX EFs decreased as the crankshaft speed increased. Cooper [83] conducted measurements of emissions from 22 auxiliary engines, with maximum power ranging from 720 to 2675 kW, aboard six ships at berth. The study revealed significant variations in the EFs for NOX, hydrocarbons (HC) and CO across different engine models and operating loads. Lack et al. [18] investigated atmospheric emissions of gas and PM from a large ocean-going container vessel as it slowed and transitioned from high-sulfur to low-sulfur fuel while entering the regulated coastal waters of California. The results showed a substantial reduction in EFs of SO2, PM, and particulate sulfate, with decreases ≥90%. EFs for organic PM were reduced by 70%, while soot EFs showed a 41% reduction. Schrooten et al. [84] estimated EFs for main and auxiliary engines based on ship type and size class. The study specifically examined NOX EFs for main engines in Spain, providing valuable data for air quality assessments in coastal regions. Zhang et al. [85] reported NOX and PM EFs of 25.8 g/kWh and 2.09 g/kWh, respectively, for two low-engine-power vessels, which were higher than those observed for high-engine-power vessels. Similarly, it was noted that fishing boats operating at low loads consistently exhibited higher emission factors for CO, PM, and NO2 [86]. Zhang et al. [87] also reported the fuel-based average emission factors for organic pollutants, including PAHs and n-alkanes, present in PM from various vessels. Celo et al. [72] investigated the chemical composition of exhaust emissions from the main engines of five cargo vessels operating in Canadian waters. The study reported the EFs for PM2.5 and SO2 from intermediate fuel oils (IFO). It also investigated the average EFs for NOX, CO, and CO2. The findings showed that PM2.5 was primarily composed of hydrated sulfates, organic carbon, and trace metals, which together accounted for 80–97% of the total PM2.5 mass.
A significant reduction in PM2.5 and SO2 EFs was observed when one vessel switched from IFO to MDO, with organic carbon becoming the dominant component of PM2.5 (comprising 65% of its mass). In addition to standard pollutants, the study reported EFs for lanthanoid elements, revealing a similar distribution pattern between ship exhaust PM2.5 and emissions from oil refineries. Moldanova et al. [29] studied the exhaust emissions from a ship diesel engine using HFO aboard a large cargo vessel. The study focused on PM and gas-phase emissions, examining their mass, size distribution, chemical composition, and microstructure. The research reported that PM was primarily composed of organic carbon, ash, and sulfate, with a small proportion of elemental carbon. This study highlighted that the combustion residues consisted of soot aggregates, char particles, and mineral/ash particles, along with organic carbon particles originating from unburned fuel or lubricating oil. It also revealed the presence of hazardous metals such as vanadium, nickel, calcium, and iron in the PM. Additionally, the study showed that the gaseous emissions, including NOX, hydrocarbons, and CO, had relatively low emission factors compared to global averages. Wu et al. [20] investigated the chemical compositions and toxicity effects of PM emitted from a marine diesel engine under typical operating conditions. The study compared the use of two marine fuels (HFO and DO) on a container ship. The physical characteristics of size-segmented PM samples, including their number size distribution and morphology, were analyzed, along with their chemical composition. Additionally, the toxicity effects, such as oxidative stress and cytotoxicity, were evaluated in experiments, with a focus on their correlation with the chemical composition of the PM. In a recent study, Huang et al. [71] performed on-board emission measurement on a large bulk carrier during the course of a voyage. The authors determined the EFs of PM components (OC and EC), VOC compounds, and criteria pollutants (such as NOX, CO) from the main and auxiliary engines using two types of fuel: low and high-sulfur fuels. The authors noted that EFs were higher during maneuvering compared to cruising. Additionally, during cruising, the distance-based EFs for gaseous emissions and PM increased as vessel speed increased. To our knowledge, this is the only study that has investigated particulate and gaseous emissions from two different engines operating on two types of fuel during a whole ship voyage. Therefore, further on-board measurement studies are necessary to enhance the quality of ship emission data and help enrich the currently limited databases on ship emissions.
Our study aims to develop a rigorous methodology for characterizing the chemical composition of particulate emissions from ship exhausts. For this purpose, samples of particulate emissions were collected, at the exhaust stack, on board a passenger vessel traveling its routine itineraries in French waters. The main engine was operated on commonly used marine gas fuel (MGO) over two engine modes representing the typical range of in-use operating conditions, including at berth, departure, arrival (transitional mode), and cruising (stationary mode). The chemical compositions of particulate emissions were determined under these different engine operating conditions. Furthermore, the effect of a marine fuel additive, used to reduce the ship’s pollutant emissions, was evaluated in this study.

2. Materials and Methods

2.1. Vessel and Engine Description

The measurements were performed on board the Fromveur 2-Penn Ar Bed during its normal routine operations (Supplementary Materials, Figure S1). The ship was built in 2011 by the Piriou shipyard to provide passenger service to the islands of Molène and Ouessant from the mainland (from Le Conquet and Brest, France; see Supplementary Materials, Figure S2). The Fromveur 2 displays the following specifications: length of 45 m, width of 9.90 m, loaded cruising speed of 15 knots (28 km/h). It accommodates 8 crew members and 365 passengers, including 12 with reduced mobility.
The ship is equipped with two main engines. In this study, emissions were measured from one main engine. Each engine delivers a nominal power of 1650 kW. During maneuvering phases, the ability to quickly reverse the pitch of the propeller and thus the propulsive force gives the vessel excellent maneuverability. Equipped with a hydraulic bow thruster, the ship can pivot in place, especially in Le Conquet port, where the navigational space is limited. These propulsion capabilities offset the lack of draft, which limits maneuverability.
The major technical specifications of the main port engine, on which the study was carried out, are presented in Table 1.

2.2. Measurement Campaigns

Three sampling campaigns were conducted on board to characterize PM emissions at the exhaust pipe. The measurements were performed in July 2021 and May and July 2022 as a part of a field campaign organized within the French project ADEME CORTEA CAPNAV-Grant n° 1966C0011. The aim of these campaigns was to better quantify and characterize particulate emissions, particularly in the different phases of ship maneuvering. The quantity of measurements conducted during the first campaign in July 2021 was constrained by adverse weather conditions and by technical difficulties related to our first experience on board. However, this campaign enabled us to establish the sampling protocols. The two other campaigns were conducted in May and July 2022. We were able to carry out a larger number of samplings under good conditions without any technical issues (9 filter samples in May 2022 and 4 in July 2022) compared to the first campaign (only 2 usable filters in July 2021).
The experiments were conducted with Marine Gas Oil (MGO) with an ultra-low sulfur content of less than 0.1 wt.%. The main specifications of the fuel used in this study are shown in Table S1.
In July 2021 and July 2022, a marine fuel additive (ECO GAS Diesel Marine 250 mL), developed by the company ECO GAS (Boulogne-Billancourt, France), was tested to evaluate its impact on particle emissions. The developer of this additive promotes it as a solution to optimize fuel consumption and reduce pollutant emissions. The documentation provided by ECO GAS outlines the chemical composition of this additive, which consists of three primary components: white mineral oil (petroleum) (CAS n° 8042-47-5, EC n° 232-455-8), α-Terpinol (CAS n° 8000-41-7, EC n° 232-268-1), and 2-Butoxyethanol (CAS n° 111-76-2, EC n° 203-905-0). The decision to evaluate this fuel additive was based on its recognized ability to reduce fine-particle emissions from land-based diesel engines in France [88]. The physical and chemical properties of this fuel additive are presented in Supplementary Materials Table S2.

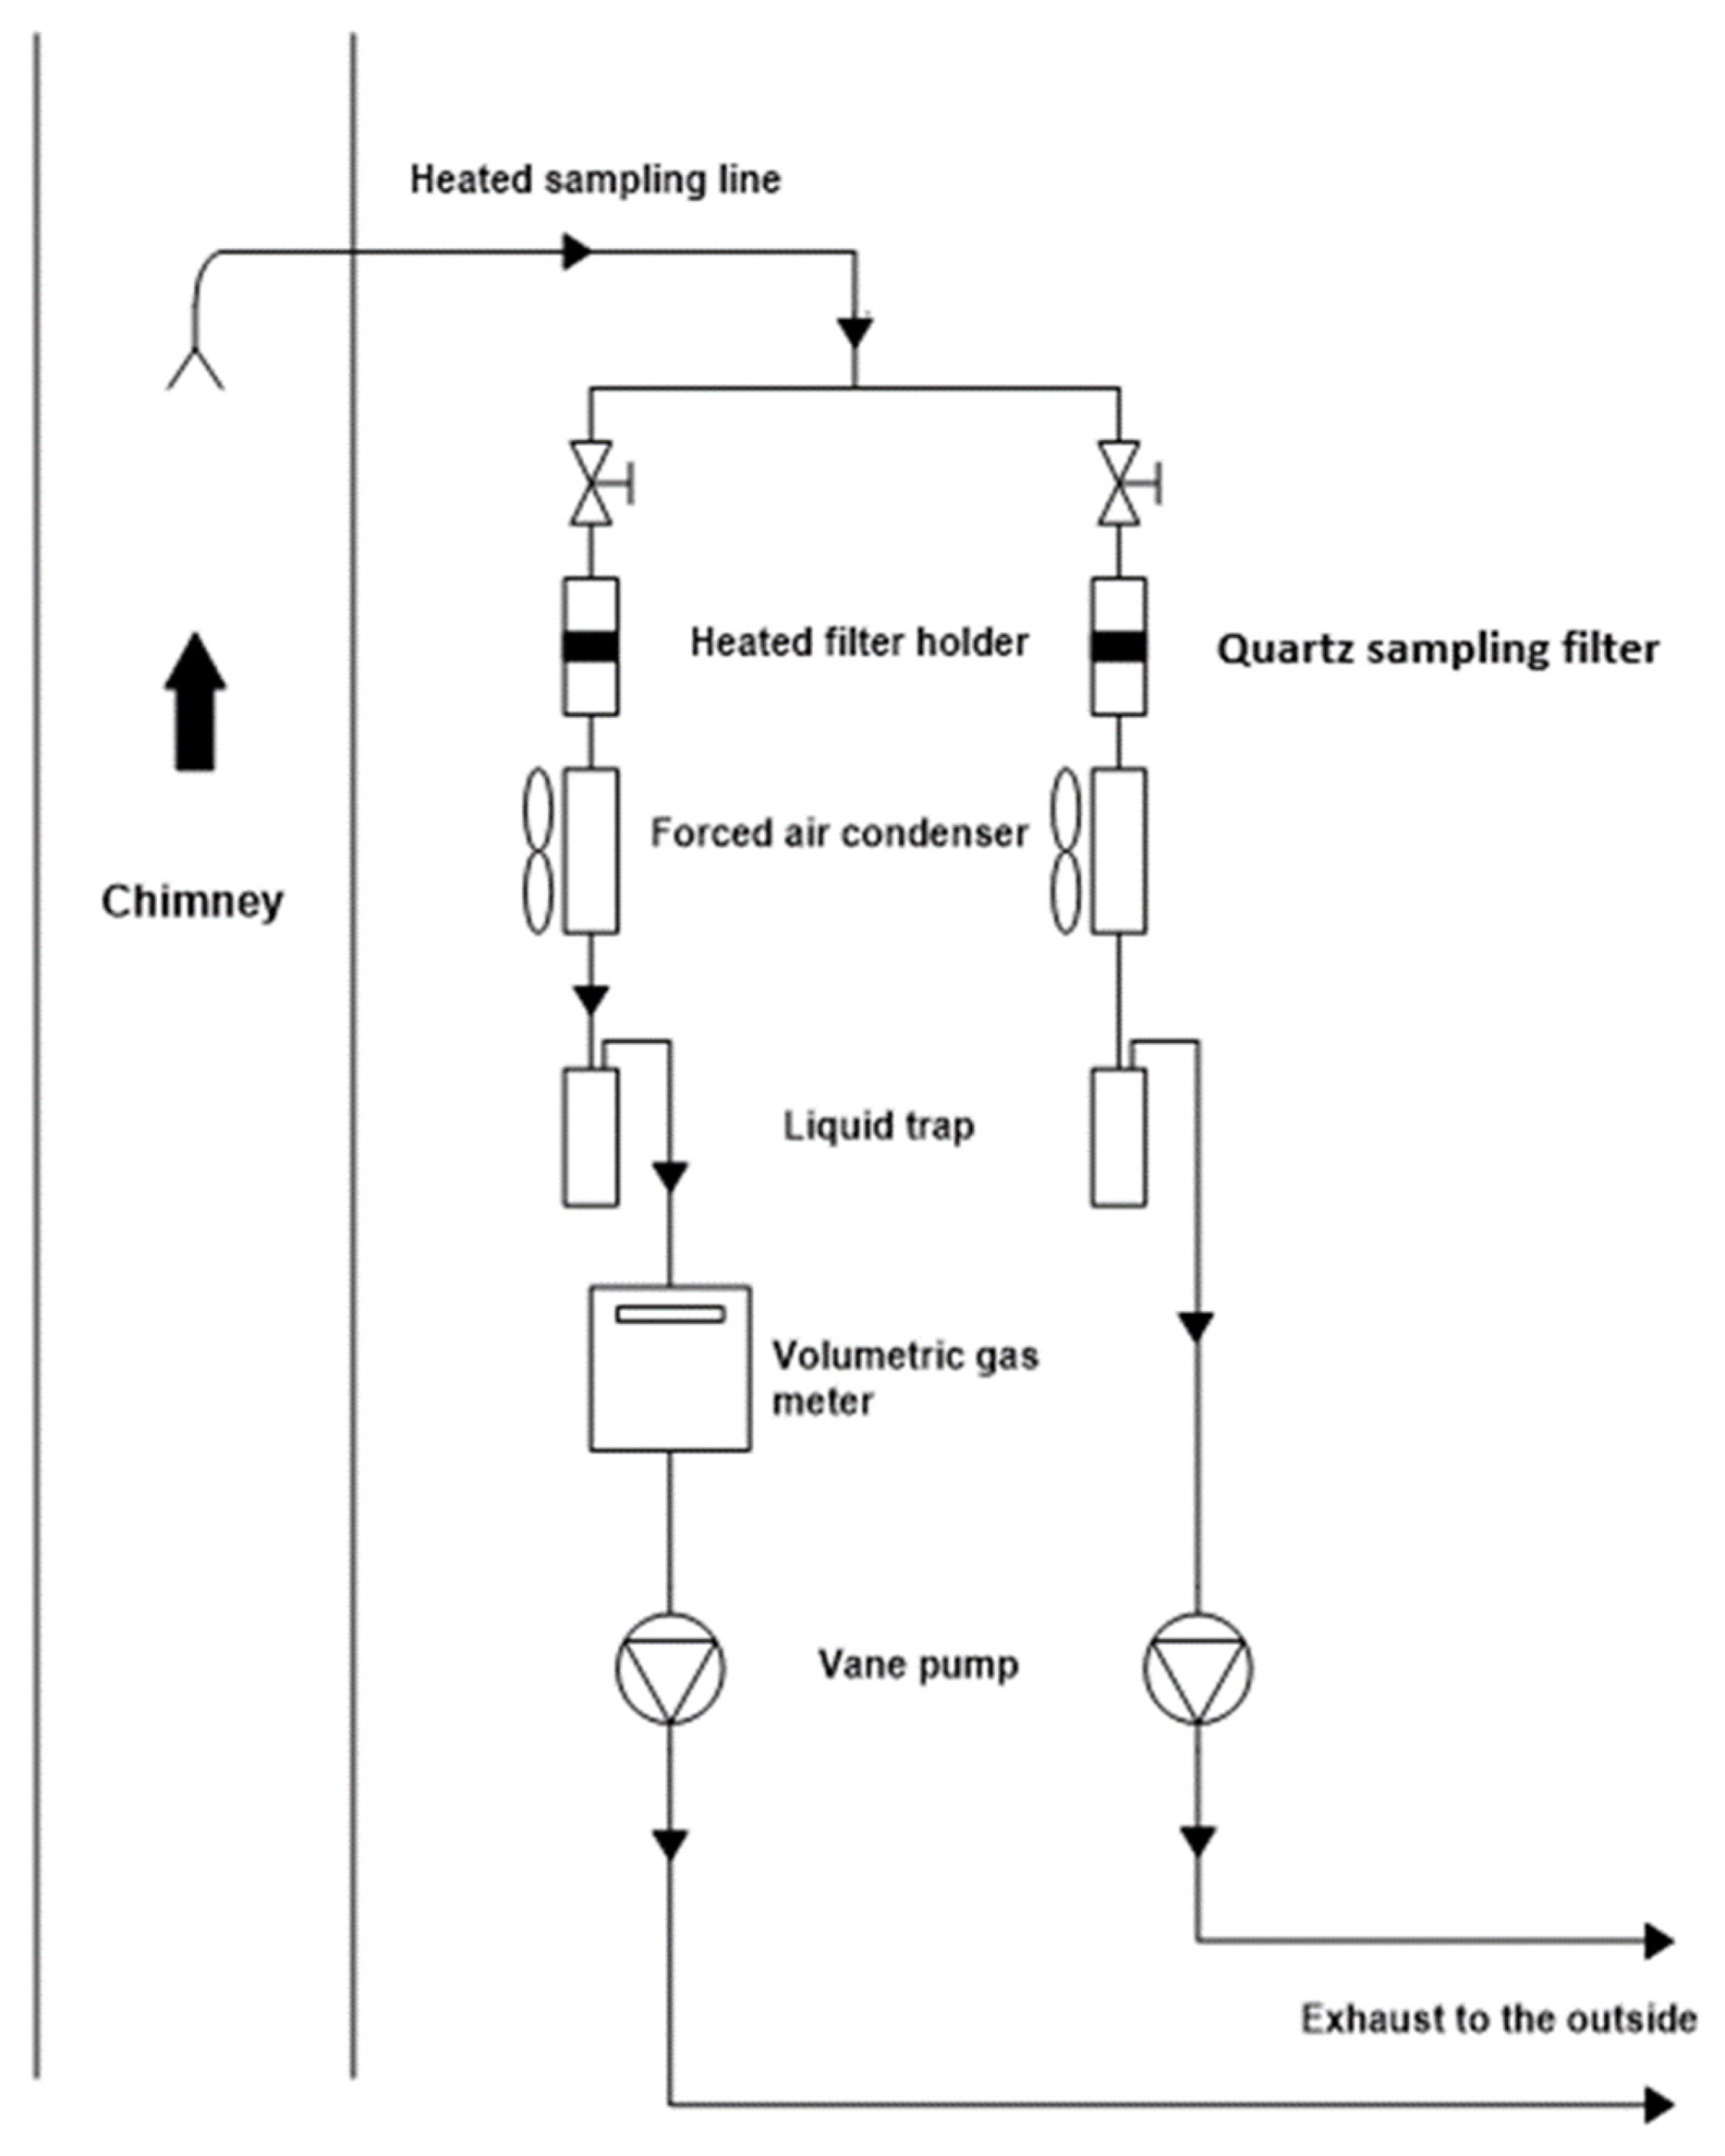
2.3. Sampling and Exhaust Emission Measurements

A schematic of the sampling apparatus used in this study is shown in Figure 1. A photograph of the sampling setup is shown in Supplementary Materials Figure S3.
The experimental device was developed to carry out a representative sampling of the exhaust emissions for chemical analysis.
Exhaust gas was sampled from one measurement point in the chimney a few meters distance from the engine. The raw exhaust gas sample was drawn through a heated transfer line (Supplementary Materials, Figure S4a) to the inlet of the sampling device and was then divided into two parallel and independent sampling circuits. To avoid any cold spots upstream the sampling device, the transfer line was maintained at 200 °C. In each sampling circuit, the exhaust gas was pulled through a quartz-fiber filter using a vane pump. The filter was placed in a heating block maintained at 120 °C. The flow rate was 75 L·min−1. The vane pump discharge was directed to a volumetric flowmeter to measure the volume of sampled gas.
The experimental setup is also equipped with a condensation system comprising a condenser and a condensate trap placed upstream of the pump, which protects it from potential condensate deposition.
A Pitot probe PSI2MKII for measuring velocity and temperature was installed in a watertight fitting, welded onto the chimney stack (Supplementary Materials, Figure S4b). This Pitot probe is equipped with a differential pressure and temperature sensor, enabling real-time acquisition followed by post-processing, thereby providing access to both instantaneous and average exhaust mass flow.
The sampling instruments and device were placed on a bridge deck below the chimney in a relatively protected area from the wind and water.
The ship was operated at three distinguished maneuver phases:
a
At berth: engine idling;
b
Maneuvering in port: engine providing slight thrust to keep the ship pressed against the dock. Maneuvering while arriving or departing a port were generally very brief;
c
Cruising at different engine loads: the crew regulates the engine load so the ship can accelerate or decelerate depending on external conditions.
Using two parallel sampling pipelines to collect particulate matter provided significant flexibility during the sampling process. Each pipeline was dedicated to a specific operational mode: one pipeline was used for sampling during port operations (including port maneuvers), while the other was reserved for sampling during cruising conditions. This setup ensured efficient and uninterrupted collection of particulate matter tailored to different engine load scenarios.
The engine typically operated at a fixed rotational speed, and the power generated was adjusted by the crew by varying the pitch of the propeller. The corresponding speeds for the three operational modes, at berth, maneuvering, and cruising, were 400 rpm, 800 rpm, and 1000 rpm, respectively.
The main engine was operated under three load conditions. At berth, during idling, the average engine load was 4%. During port maneuvering, the average engine load was 14%. Under cruising conditions, the engine operated at an average load of 68%.
In this study, operation points were classified into two categories: low-load operation points and high-load operation points. Low-load operation points included conditions at berth (idling) and during maneuvering in port, with engine loads ranging from 4% to 14%. High-load operation points corresponded to cruising conditions, with an engine load of 68%. The engine loads during the cruising phase are moderate compared to the higher loads commonly referenced in the literature (75–100% loads) [19,25,29,33,72,73,74]. This moderate engine load of 68% can be attributed to the calm sea conditions during the campaigns, which resulted in smoother navigation and reduced overall engine demand.

2.4. Chemical Analysis

Quartz-fiber filters (47 mm, QM-A, Whatman, UK) were used to sample particles for extraction analysis to determine the content of organic compounds (OCs). The blank filters were preconditioned to remove any OCs that might be present. In the first step, the blank filters were cleaned up with deionized water (150 mL) and then dried in an oven at 50 °C for 12 h. In the second step, the filters were extracted in an ultrasonic extractor for 30 min with acetonitrile (5 mL) and then placed in an oven at 50 °C for 24 h to dry and evaporate the residual solvent. After drying, each filter was individually placed in clean screw-capped jars with Teflon cap liners.
The filters were weighed on an analytical electronic balance (Sartorius Quintix 125D-1S, Sartorius Lab Instruments GmbH & Co. KG, Germany) before and after each sampling, and the total particulate mass was determined gravimetrically by the difference between two tests. After particulate collection, the samples were stored in the laboratory in an opaque box to avoid light for less than two weeks until extraction.
Each collected sample was extracted by mechanical agitation 3 times (24 h each time, 250 rpm) with dichloromethane (5 mL each time). The 3 extracts were combined, filtered using a Whatman Puradisc syringe filter (diameter: 13 mm, pore size: 0.2 µm), and then concentrated to exactly 2 mL. Due to the low concentrations of the solvent-extractable organic compounds, all the extracts from filters sampled under the same sampling conditions (high engine load/low engine load) were combined and then reconcentrated to 2 mL.
Naphthalene (10 ppm) was added to all combined extracts as an internal standard for quantification purposes.

2.5. Analytical Method

Analyte contents were determined with a gas chromatograph with a mass spectrometer and flame ionization detector (GC-MS/FID) (PerkinElmer TurboMass Gold AutoSystem XL, PerkinElmer, USA).
The GC analytical method for particle-phase OCs requires dual chromatographic detection, MS analysis for OCs identification and FID analysis for OCs quantification. A simple MS detection of the samples would not allow quantification of all compounds due to their low contents in the liquid phase and to the lower sensitivity of MS compared to FID.
The GC was equipped with a capillary column (DB-5MS, 30 m × 0.25 mm × 0.25 µm). Helium was used as carrier gas at a flow rate of 1 mL/min. Spitless injection volume was 1 μL at 250 °C. The oven was heated from 40 °C (0 min) to 56 °C at a rate of 0.5 °C·min−1 and to 280 °C at 5 °C·min−1 and then held at 280 °C for 33.2 min. The MS was operated in scan mode and the analysis covered a mass range of m/z 25 to 600 in electron impact mode (EI). The ion source (EI) temperature was 250 °C. The spectrometer was outfitted with an NIST database (Nist/EPA/NIH Mass Spectral Library, version 2.0d, build 26 April 2005).
In order to guarantee the reliability of the experiment, repeatability tests of the GC analyses were conducted. Each analysis was repeated at least three times to achieve a coefficient of variation (CV) of less than 10%.

2.6. Extraction Method Optimization

Several tests were conducted in the lab to select the most efficient extraction method to use. Extraction is the prime step for accurate identification and subsequent analysis of particle-phase OCs. Conventional extraction methods like Soxhlet extraction and ultrasonication and mechanical agitation are the common methods of choice. Thus, the choice of an appropriate solvent is the main factor affecting the extraction process, which depends on the solubility of the desired compounds with respect to solvent polarity and solvent–matrix interactions [89].
In this study, two solvents, acetonitrile (ACN) and dichloromethane (DCM), as well as two extraction techniques, mechanical agitation and ultrasonication, were tested. The following factors influencing the extraction were studied: choice of solvent, extraction time, solvent volume and extraction yield. Initially, a standard solution of 1 g/L of 18 compounds (methanol, Acrolein,1-Pentene, dimethyl sulfide, acetic acid, carbon disulfide, butyraldehyde, 2-Butanone, chloroform, benzene, 2-Methyltetrahydrofuran, isopropyl nitrate, butyl acetate, O-Xylene, benzaldehyde, phenanthrene, fluoranthene, and 1-Nitropyrene) dissolved in each solvent (ACN and DCM) was prepared. These compounds were selected to represent all chemical compound families found in exhaust emissions associated with the use of marine fuels, including alkanes, alkenes, alcohols, aldehydes, ketones, acids, oxides, polycyclic aromatic hydrocarbons (PAHs).
Clean quartz filters were then doped with the prepared standard solution; approximately 50 mg of this solution was deposited on each filter. The doped filters were extracted using both chosen extraction techniques with DCM and ACN separately. The extracts were then subjected to GC-MS analysis following the protocol described previously. Five-point calibration curves were constructed and the correlation coefficient was more than 0.99. The extraction yields expressed in mass percentage (wt.%) are reported in Supplementary Materials Table S3. The results showed that mechanical agitation with DCM produced the most favorable condition for doped-filter extraction. We adopted this method for the extraction of organic compounds from quartz filters.

2.7. Calculation of Emission Factors

There is a linear correlation between engine power (Peng) and exhaust mass flow rate (Qm) at a nominal speed of 1000 rpm. In this study, the engine power was evaluated based on the exhaust mass flow rate.
Exhaust mass flow rate data were obtained through post-processing of Pitot measurements. As discussed in the previous section, the extracts from different filters were sampled under the same navigation mode: transitional mode (including at berth, departure, and arrival) and stationary mode (cruising) were combined to concentrate the organic compounds collected on these filters. Figure 2 shows the variations in the recorded mass flow rate for each navigation mode, measured at the chimney during the sampling campaign conducted in July 2022. Seven measurements were taken at low engine loads (blue points) and six measurements at high loads (orange points). For each navigation mode, a cumulative sampling was performed on two filters (one filter on each sampling line of the experimental setup). Therefore, an average mass flow rate was defined for each operating mode: an average mass flow rate for high loads, based on all mass flow rates recorded during the six measurements taken in stationary mode (orange points), and an average mass flow rate for low loads, considering all mass flow rates recorded during the seven measurements taken in transitional mode (blue points).
Similar calculations were conducted for both the July 2021 and May 2022 campaigns.
The emission factors (EFs) for all OCs reported in this study were calculated based on the concentration of measured species, engine power, and exhaust gas flow; see Equation (1).
E F O C i = j = 1 3 C i , j 3 × Q v P e n g       g · k W h 1   ,
where:
  • E F O C i is the emission factor of species i;
  • Peng is the engine power evaluated from the exhaust flow rat (Qm);
  • Qv is the exhaust gas flow, in m3·h−1, calculated from Qm data obtained through post-processing of Pitot measurements (kg·h−1) and the corresponding densities (ρ, in kg·m−3), using Equation (2):
Q v = Q m ρ         m 3 · h 1   ,
where Ci,j in (g·m−3) represents the concentration of species i in analysis j, with j varying from 1 to 3. Each analyte was analyzed three times using GC-MS-FID to verify the repeatability of the measurements. Ci,j was calculated using Equation (3):
C i , j = m i , j V         g · m 3   ,
where mi represents the mass of species i in analysis j extracted from the particulate phase and quantified using GC-MS-FID. V represents the sampled gas volume.
Using emission data, a total emission factor ( E F T O C s ) was calculated to obtain a comprehensive view of exhaust emissions. E F T O C s is the sum of emission factors of all detected species (both identified and unidentified species). E F T O C s was calculated using Equation (4):
E F T O C s = E F O C i d × 100 I R         g · k W h 1   ,
where:
  • E F O C i d is the sum of the emission factors of the identified species i. E F O C i d can be calculated from the measured pollutant emission factors ( E F O C i d ) using Equation (5):
E F O C i d = E F O C i         g · k W h 1   ,
and IR is the identification rate expressed as a mass percentage (wt. %). IR was calculated using Equation (6):
I R = m i m T × 100         w t %   ,
where mi is the mass of the identified chemical species i and mT is the total organic mass extracted from the filters (mass of both identified and unidentified species). mT was calculated from the internal calibration data.
Particulate matter emission factors (EFPM) were calculated using Equation (7):
E F P M = Q v × C P M P e n g         g · k W h 1   ,
where CPM is the concentration of particle mass in g·m−3. CPM is given by Equation (8):
C P M = m s o o t V         g · m 3  
Emission factors are reported in grams (or microgram) per kilowatt-hour (g/kWh or µg/kWh).
Uncertainties have been attributed to the measured quantities in this study. The relative uncertainty in the engine power is given by the following equation (Equation (9)):
P e n j P e n g = Q m Q m   .
The uncertainty of the average exhaust mass flow rate is given by Equation (10). This uncertainty ranged from about 8% to 20% at high engine loads and approximately between 23% and 75% at low loads. During the ship’s commercial voyage at sea, the engine load and mass flow rate remained relatively stable, leading to low uncertainty in the mass flow rate at high loads. However, at low loads (i.e., during port maneuvers for arrival or departure and while docked), the crew had to frequently adjust the engine load to keep the vessel stable at the quay. This explains the higher uncertainty in the mass flow rate at low loads.
Q m Q m = Q v Q v + ρ ρ     .
Given that the density showed minimal variation, it was treated as constant. Therefore, Equation (10) can be written as follows (Equation (11)):
Q m Q m = Q v Q v     .
The uncertainty in the concentration Ci,j is given by Equation (12). The uncertainty in Ci,j varies between 0.1% and 10% for all analyzed organic compounds.
C i , j C i , j = m i , j m i , j   .
The relative uncertainty in the emission factors EFOCi was represented by Equation (13):
E F O C i E F O C i = C i , j C i , j + Q v Q v + P e n g P e n g   .
Since Peng and Qv depend on the exhaust mass flow rate, Equations (9) and (11)–(13) led to Equation (14).
E F O C i E F O C i = m i , j m i , j + Q m Q m   .
The relative uncertainties in EFTOCs and EFOCid are given by Equation (15):
E F T O C s E F T O C s = E F O C i d E F O C i d = E F O C i E F O C i = m i , j m i , j + Q m Q m   .
Likewise, the relative uncertainty in the particulate matter emission factors is given by Equation (16):
E F P M E F P M = Q v Q v + C P M C P M + P e n g P e n g     .
with
C P M C P M = m s o o t m s o o t   .
Equations (9), (11), (16) and (17) led to the following expression (Equation (18)):
E F P M E F P M = Q m Q m + m s o o t m s o o t   .
The detailed numerical values of these uncertainties will be provided in the subsequent sections.

2.8. Materials

The chemicals, acetonitrile, dichloromethane, naphthalene, methanol, Acrolein, 1-Pentene, dimethyl sulfide, acetic acid, carbon disulfide, butyraldehyde, 2-Butanone, chloroform, benzene, 2-Methyltetrahydrofuran, isopropyl nitrate, butyl acetate, O-Xylene, benzaldehyde, phenanthrene, fluoranthene, and 1-Nitropyrene were used without further purification. Their purity and source are given in Supplementary Materials Table S4. High-purity deionized water (conductivity = 18.2 MΩ·cm, using a Millipore Milli-Q, Q-POD Water Purification, Merck-Millipore, Germany) was used. A digital balance (Sartorius Quintix 125D-1S, Sartorius Lab Instruments GmbH & Co. KG, Germany) having an accuracy of 0.0001 g was used.

3. Results and Discussion

3.1. Overview of the Main Results of the Three Measurement Campaigns

Table 2 summarizes the different data used to calculate the emission factors from the three conducted measurement campaigns, including total mass of soot, sampled gas volume, average exhaust gas flow rate, average engine power, PM emission factors, and other results from the analyses of filter extracts, which will be discussed in the section below.

3.2. Particle Emissions

The particulate matter emission factors ( E F P M ) increased as the engine power decreased. Moreover, the total PM emissions factors based on gravimetric analysis of the filter samples was between 0.02 and 0.03 g/kWh at high-load points (during navigation where the engine operated at 1000 rpm and 68% load). The E F P M exhibited significant variability under low-load conditions, from 0.02 to 2.83 g/kWh (at berth at 400 rpm and 4% load and during maneuvers 800 rpm and 14% load). This could be explained by the fact that the average engine power varied significantly at low-load conditions, whereas it remained almost constant at high loads (Table 2).
These E F P M were generally similar to the levels reported in previous studies by Agrawal et al. [26], Huang et al. [71], Celo et al. [72], and Winnes and Fridell [74] for engines operated at different loads and fuels (MDO, HFO).

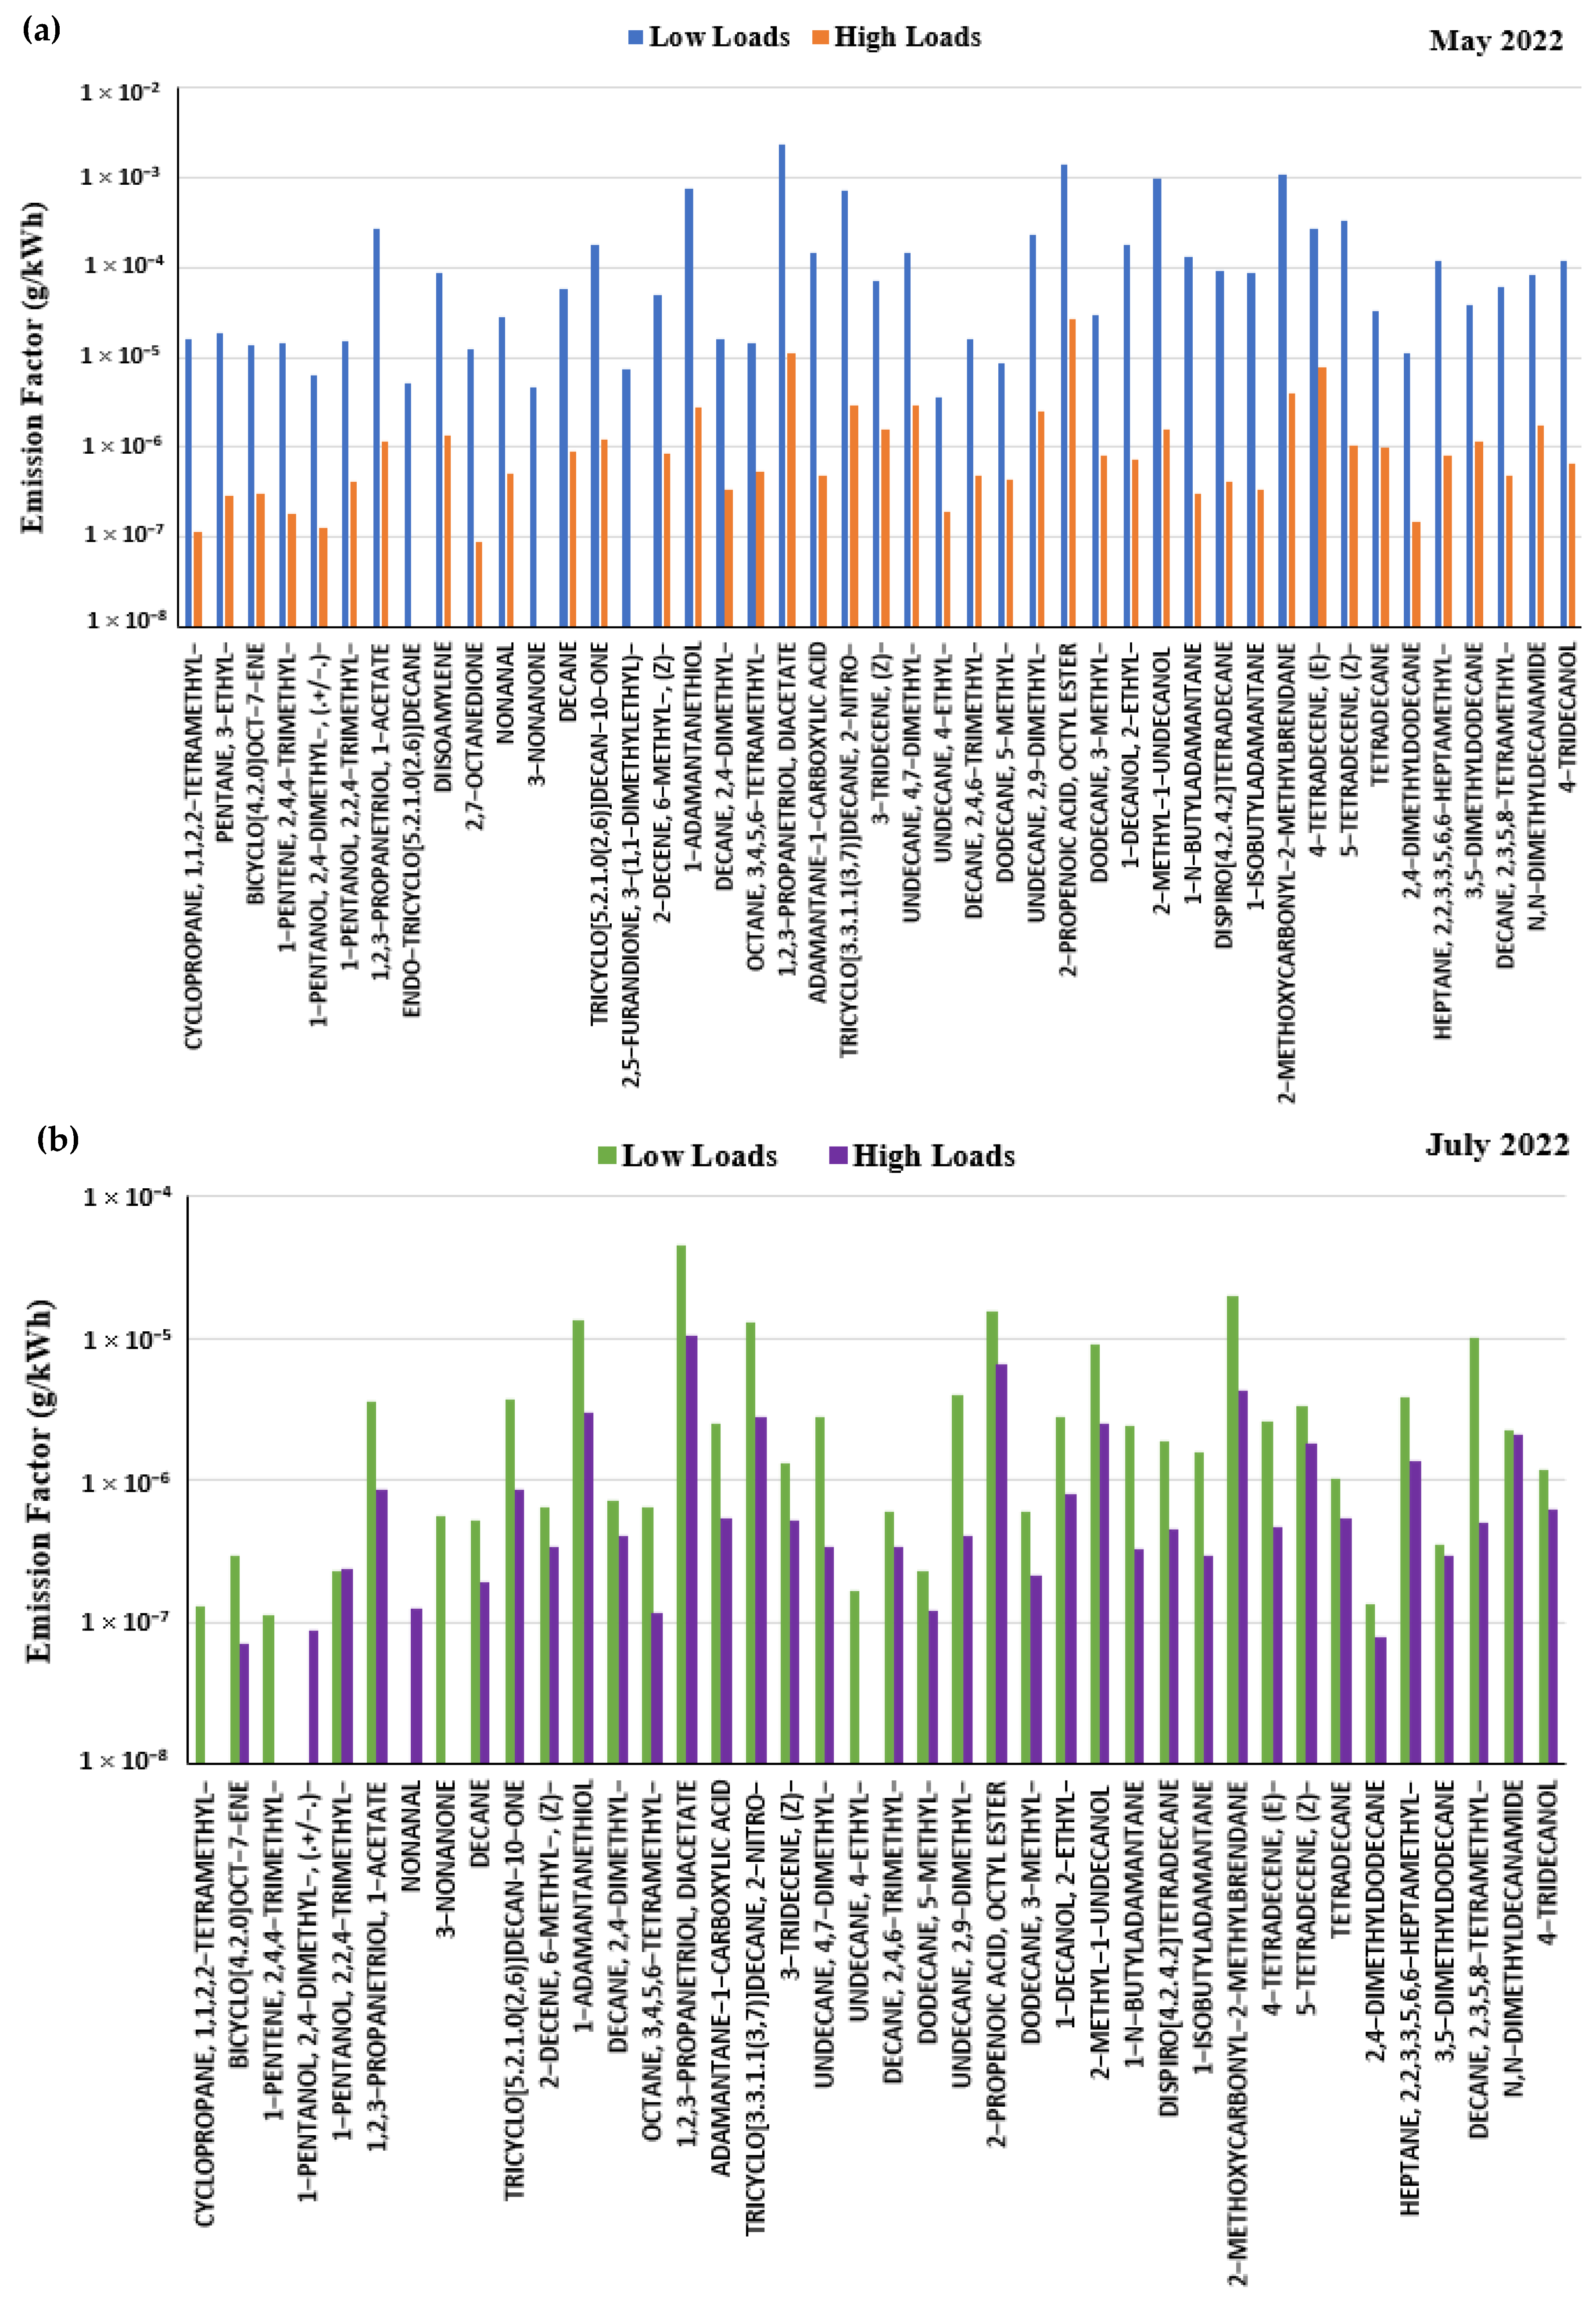
3.3. Organic Compound Emissions and Their Composition

The GC-MS analyses of the various extracts allowed the identification of a significant number of organic chemical compounds. A variety of organic compounds was determined, including alkanes, cycloalkanes, alkenes, cycloalkenes, alcohols, ketones, esters, etc. The nature of these compounds, their composition, and their emission factors are reported in Table S5, Table S6 and Table S7, respectively, for the July 2021, May 2022, and July 2022 measurement campaigns. These compounds represent approximately 4–20 weight % of the total organic mass (see Table 2). This implies that a substantial portion of the organic matter’s composition remains unknown. Despite this, the nature of the identified compounds provides indication of the composition of particulate organic matter. The identification of all detected chromatographic peaks did not succeed. The probability of this failure being caused by low sample concentration was eliminated since the peaks were intense enough to be analyzable. The other possible explanation would be a very complex chemical structure of these compounds, which prevented their identification via the available mass spectrometer database. The identification of chemical compounds was considered relevant when the match was 90% or higher.
Also, fewer compounds were identified in the July 2021 samples compared to those from May and July 2022 (30 compared to 45 and 38, respectively; Table 2). This can be explained by the limited number of measurements conducted during the July 2021 campaign due to adverse weather conditions, unlike the subsequent campaigns where the weather was favorable, and also by the sampling difficulties encountered during our first on-board experience. The analyte from the July 2021 measurements shares 23 common compounds with the analytes from May 2022 and 19 compounds in common with the analyte from July 2022.
Alkanes were the most abundant organic compounds (15 compounds) in the identified fraction, followed by alkenes (6 compounds), esters (5 compounds), and alcohols (5 compounds). The shares of esters and alkanes in the identified organic mass were higher than those of other compounds. As an illustration, in the samples collected during the July 2022 campaign, the proportion of alkanes and esters was 1.5 wt.% and 5 wt.% at low-load points and 1.0 wt.% and 4.0 wt.% at high-load points, respectively, while the proportions of the other identified organic compound groups varied between 0.01 wt.% and 0.8 wt.%. This observation is logical because diesel fuels generally contain higher proportions of aliphatic compounds, while heavy fuel oils contain significant fractions of aromatic species, particularly polycyclic aromatics [73].
Figure 3a,b, illustrate the emission factors (g/kWh) of the identified chemical species based on engine load for the May and July 2022 measurement campaigns, respectively. A clear increase in emission concentrations was observed at lower loads (Figure 3). The low-load conditions generated clearly higher organic compound emission factors. For example, the emission factor of 2,3,5,8-tetramethyldecane was 126 and 20 times higher in low loads than in high loads in the May and July 2022 samples, respectively. Emission factor ratios at low-load points and high-load points are depicted in Supplementary Materials Figure S5.
The T-test statistical method was employed to compare the obtained emission factor results. This test showed that emission factors at low loads were significantly higher than those at high loads, with an average confidence level of 91.4% and 94% for May and July 2022, respectively. In May 2022, the lowest confidence level observed was 88.8% for 4-ethylundecane, whereas in July 2022, it was 61.8% for n,n-dimethyldecanamide.
As shown in Table 2, the total emission factors ( E F T O C s ) were higher at low engine loads. E F T O C s , at high load, decreased by a factor of 235 and 3, respectively, in the samples from July 2022 and May 2022. Similarly, in both campaigns, the total emission factor of the identified species ( E F O C i d ) is consistently greater at lower engine loads than at higher engine loads (Table 2).
The results show that esters are the most abundant compounds in terms of emission factors at both high and low engine loads. At low engine loads, esters account for 49.1% and 48.5% of the total E F O C i d in May and July 2022, respectively. At high engine loads, esters represent 43.7% and 21.6% of the total E F O C i d in May and July 2022, respectively. The fractional contributions of the various families of identified organic compounds in May 2022 are as follows (at low/high engine loads respectively, % of the total E F O C i d ): alcohols (12.6/4.1), alkenes (8.1/15.1), alkanes (7.8/15.5), thiols (7.5/3.4), nitroalkanes (7/3.5), cycloalkanes (3.3/1.4), ketones (1.9/1.5), carboxylic acids (1.4/0.6), amides (0.8/2.1), aldehydes (0.3/0.6), and cycloalkenes (0.1/0.4). In July 2022, the fractional contributions of these species were as follows (% of the total E F O C i d ) : alcohols (7.7/9.5), alkenes (4.6/7), alkanes (14.8/10.9), thiols (7.9/6.6), nitroalkanes (7.5/6.3), cycloalkanes (3.5/2.4), ketones (2.5/1.9), carboxylic acids (1.5/1.2), amides (1.3/4.7), aldehydes (0.0/0.3), and cycloalkenes (0.2/0.2) at low loads and high loads, respectively.
The proportions of the organic compounds in the total emission factors ( E F T O C s ) at low and high engine loads for the May and July campaigns, respectively, are as follows: esters (5.1–10.6/4.7–3.6), alcohols (1.3–0.8/0.75–0.7), alkenes (0.9–3.1/0.45–0.52), alkanes (0.8–3.1/1.4–0.8), thiols (0.8–0.7/0.8–0.5), nitroalkanes (0.73–0.7/0.7–0.5), cycloalkanes (0.35–0.28/0.34–0.2), ketones (0.2–0.31/0.24–0.14), carboxylic acids (0.15–0.12/0.14–0.09), amides (0.09–0.43/0.13–0.34), aldehydes (0.03–0.12/0.0–0.02), and cycloalkenes (0.01–0.07/0.02–0.01).
In this study, the alkanes identified from MDO combustion were primarily in the size range of C7–C14. The alkane chain lengths observed in the MDO align with the typical composition of diesel fuel, which is characterized by hydrocarbon mixtures ranging approximately from C10 to C25, with boiling points between 280 and 360 °C [90,91]. Moreover, these findings account only for linear alkanes, while it is well established that diesel emissions also contain significant amounts of branched and cyclic alkanes [92,93]. Sippula et al. [73] investigated the chemical composition of PM emissions from a medium-speed four-stroke marine engine operating on both HFO and distillate fuel (DF) under various operating conditions. They quantified 15 n-alkanes, 11 hopanes, 11 PAHs, 17 oxy-PAHs, nine azaarenes, and one nitro-PAH from the PM samples. The authors reported the alkane emissions were slightly higher from HFO compared to DF, but the proportion of alkanes in the identified organic mass was greater for DF. The authors also reported that the n-alkanes in the DF PM were predominantly in the C19–C26 range (mean = C22–24), whereas the HFO PM samples showed a broader alkane distribution (mean = C24–25) with a notably higher presence of alkane sizes ranging from C25 to C33 compared to the DF PM samples. In another study, Huang et al. [71] conducted on-board emission measurements on a Handysize-class bulk carrier operating under real-world conditions. Measurements were carried out on a main two-stroke diesel engine and an auxiliary four-stroke diesel engine using both low-sulfur fuel (LSF) and high-sulfur fuel (HSF). A total of 21 n-alkanes, 10 hopanes, 21 particulate PAHs, and 27 n-fatty acids were quantified in the PM samples by the authors. The n-alkanes emitted from LSF were mainly composed of C18–C23 compounds, whereas HSF emitted a wider range of alkanes, including higher-carbon components (such as C27–C36). The absence of alkanes with longer carbon chains (greater than C14) in our characterization is likely due to the limitations of our database, which is unable to identify chemical species with more complex structures. Additionally, a limitation of the studies by Sippula et al. [73] and Huang et al. [71] is that they do not provide information on the identification rates of the chemical species they detected.
The EFs of alkanes reported by Sippula et al. [73] varied depending on the fuel type and engine load. For DF, the total EF of alkanes was 2557 µg/kWh at 75% engine load and 2951 µg/kWh at 10% load. The individual alkanes EFs ranged from 4.5 µg/kWh (C33) to 478 µg/kWh (C20) at 75% load and from 7.1 µg/kWh (C33) to 586 µg/kWh (C22) at 10% engine load. In HFO usage, alkane EFs were higher compared to those of DF under the same operating conditions. The total alkane EFs increased from 5499 µg/kWh to 18,782 µg/kWh as the engine load was decreased from 75% to 10%, respectively. The individual alkane EFs from HFO ranged from 33 µg/kWh (C33) to 736 µg/kWh (C22) at 75% load and from 142 µg/kWh (C33) to 2584 µg/kWh (C20) at 10% engine load. In a similar manner, the individual EFs of alkanes reported by Huang et al. [71] ranged from 25.2 µg/kWh (C36) to 406.9 µg/kWh (C18) at high engine loads and from 302.6 µg/kWh (C36) to 945.2 µg/kWh (C23) at low engine loads. In our study, the total alkane EFs, using MDO, ranged from 25.1 to 797.5 µg/kWh at low engine loads and from 4.81 to 13.03 µg/kWh at high engine loads. These EFs are comparable to those obtained with DF and significantly lower than those observed with HFO across both low and high loads. The total EFs for the other organic compounds identified in our study, respectively, at low and high load, are as follows (in µg/kWh): esters (82.1–5005.6/21.6–43.7), alcohols (13–1290/3.5–4.2), alkenes (7.84–829/3.1–12.7), thiols (13.4–768.9/2.8–2.9), nitroalkanes (12.7–712/2.8–2.9), cycloalkanes (5.9–336.9/1.06–1.2), ketones (4.2–191.6/0.85–1.28), carboxylic acids (2.46–144.68/0.48–0.54), amides (2.23–83.0/1.80–2.05), aldehydes (0.0–27.5/0.12–0.51), and cycloalkenes (0.3–13.5/0.07–0.3). Previous studies on ship emissions have not reported EF values for these compounds. Unfortunately, we were unable to find any experimental data in the literature to compare with our results.
The soot emissions also showed an increasing trend toward lower loads (Table 2). At low-load points, the engine generated higher exhaust particle concentrations than at high-load points. The representation of emission concentrations based on the soot mass (g/g) and sampled gas volume (g/m3) showed that some organic compounds exhibit higher contents at low loads such as 1-n-butyladamantane, 5-tetradecene, etc. For other compounds, the highest emissions occurred at high loads, like undecane, 4-ethyl; decane, 2,4,6-trimethyl, etc.; see Figures S5 and S6 (Supplementary Materials).
Figure S5 shows that expressing emissions based on soot mass allows for the reconciliation of ratios between high and low load concentrations. Using the example of major compounds like 1-adamantanethiol; 1,2,3-propanetriol, diacetate; tricyclo [3.3.1.1(3,7)] decane,2-nitro; and 2-methoxycarbonyl-2-methylbrendane, it was observed that the emission factor ratios (g/kWh) between low and high loads for these compounds ranged from 200 to 270 in the May 2022 measurement campaign and between 4 and 5 in the July 2022 campaign (Supplementary Materials, Figure S7). In contrast, the ratios of these compounds’ concentrations relative to soot mass (g/g of soot) were significantly lower, ranging from 2 to 3 in May 2022 and from 0.90 to 0.97 in July 2022. This observation indicates comparable chemical compositions of the particulate phase (PM) across the different compounds identified at both low and high engine loads.
On the other hand, Figure S6 illustrates a wider variation in the compound content ratios by representing these concentrations as a function of the volume of the sampled exhaust gas (g/m3). As an example, the ratios (low/high loads) of concentrations for major compounds such as 1,2,3-propanetriol,1-acetate; 1-adamentanethiol; 1,2,3-propanetriol,diacetate; adamentane-1-carboxylic acid; tricyclo [3.3.1.1(3,7)]decane,2-nitro-; 1-decanol, 2-ethyl-; 2-methyl-1-undecanol; 1-n-butyladamantane; Dispiro [4.2.4.2]tetradecane; 1-isobutyladamantane; 2-methoxycarbonyl-2-methylbrendane; and Decane,2,3,5,8-tetramethyl are around 4 to 13.1 in May 2022 (Figure S6a) and 2.6 to 13.07 in July 2022 (Figure S6b). This makes sense since the content of organic compounds is related to the concentration of emitted particles, which, as already mentioned, is higher at low loads than at high loads.

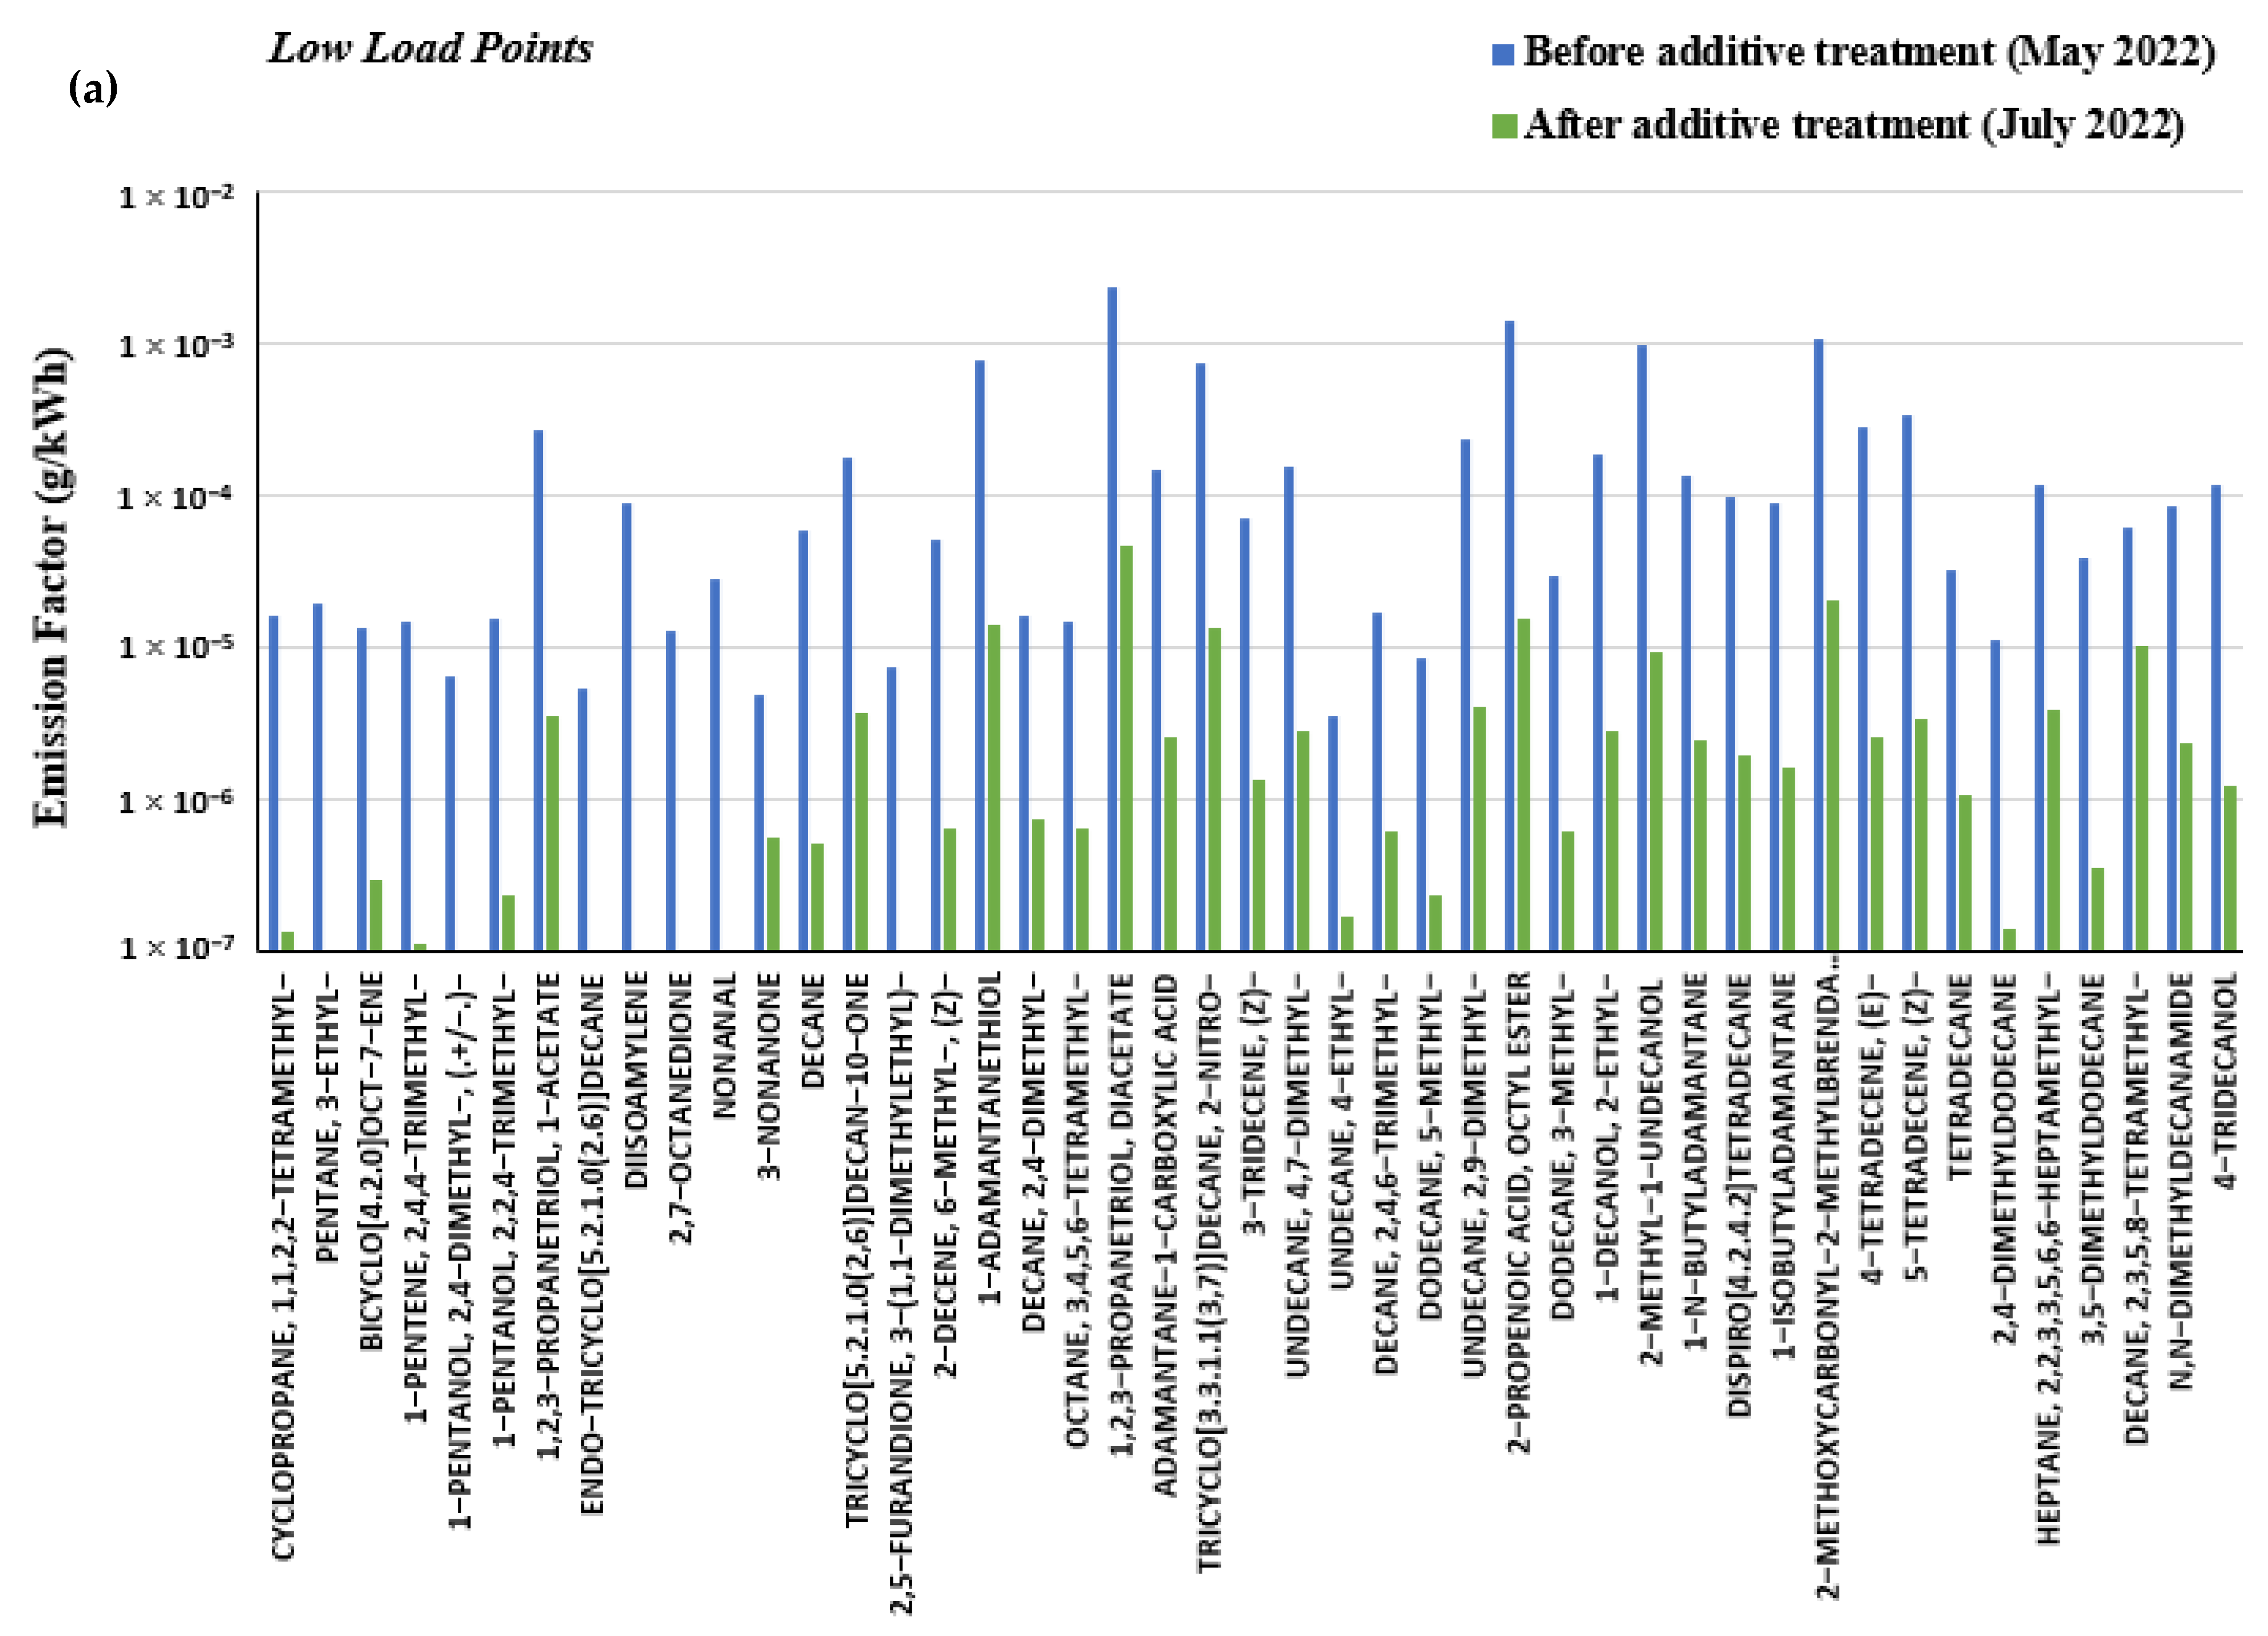
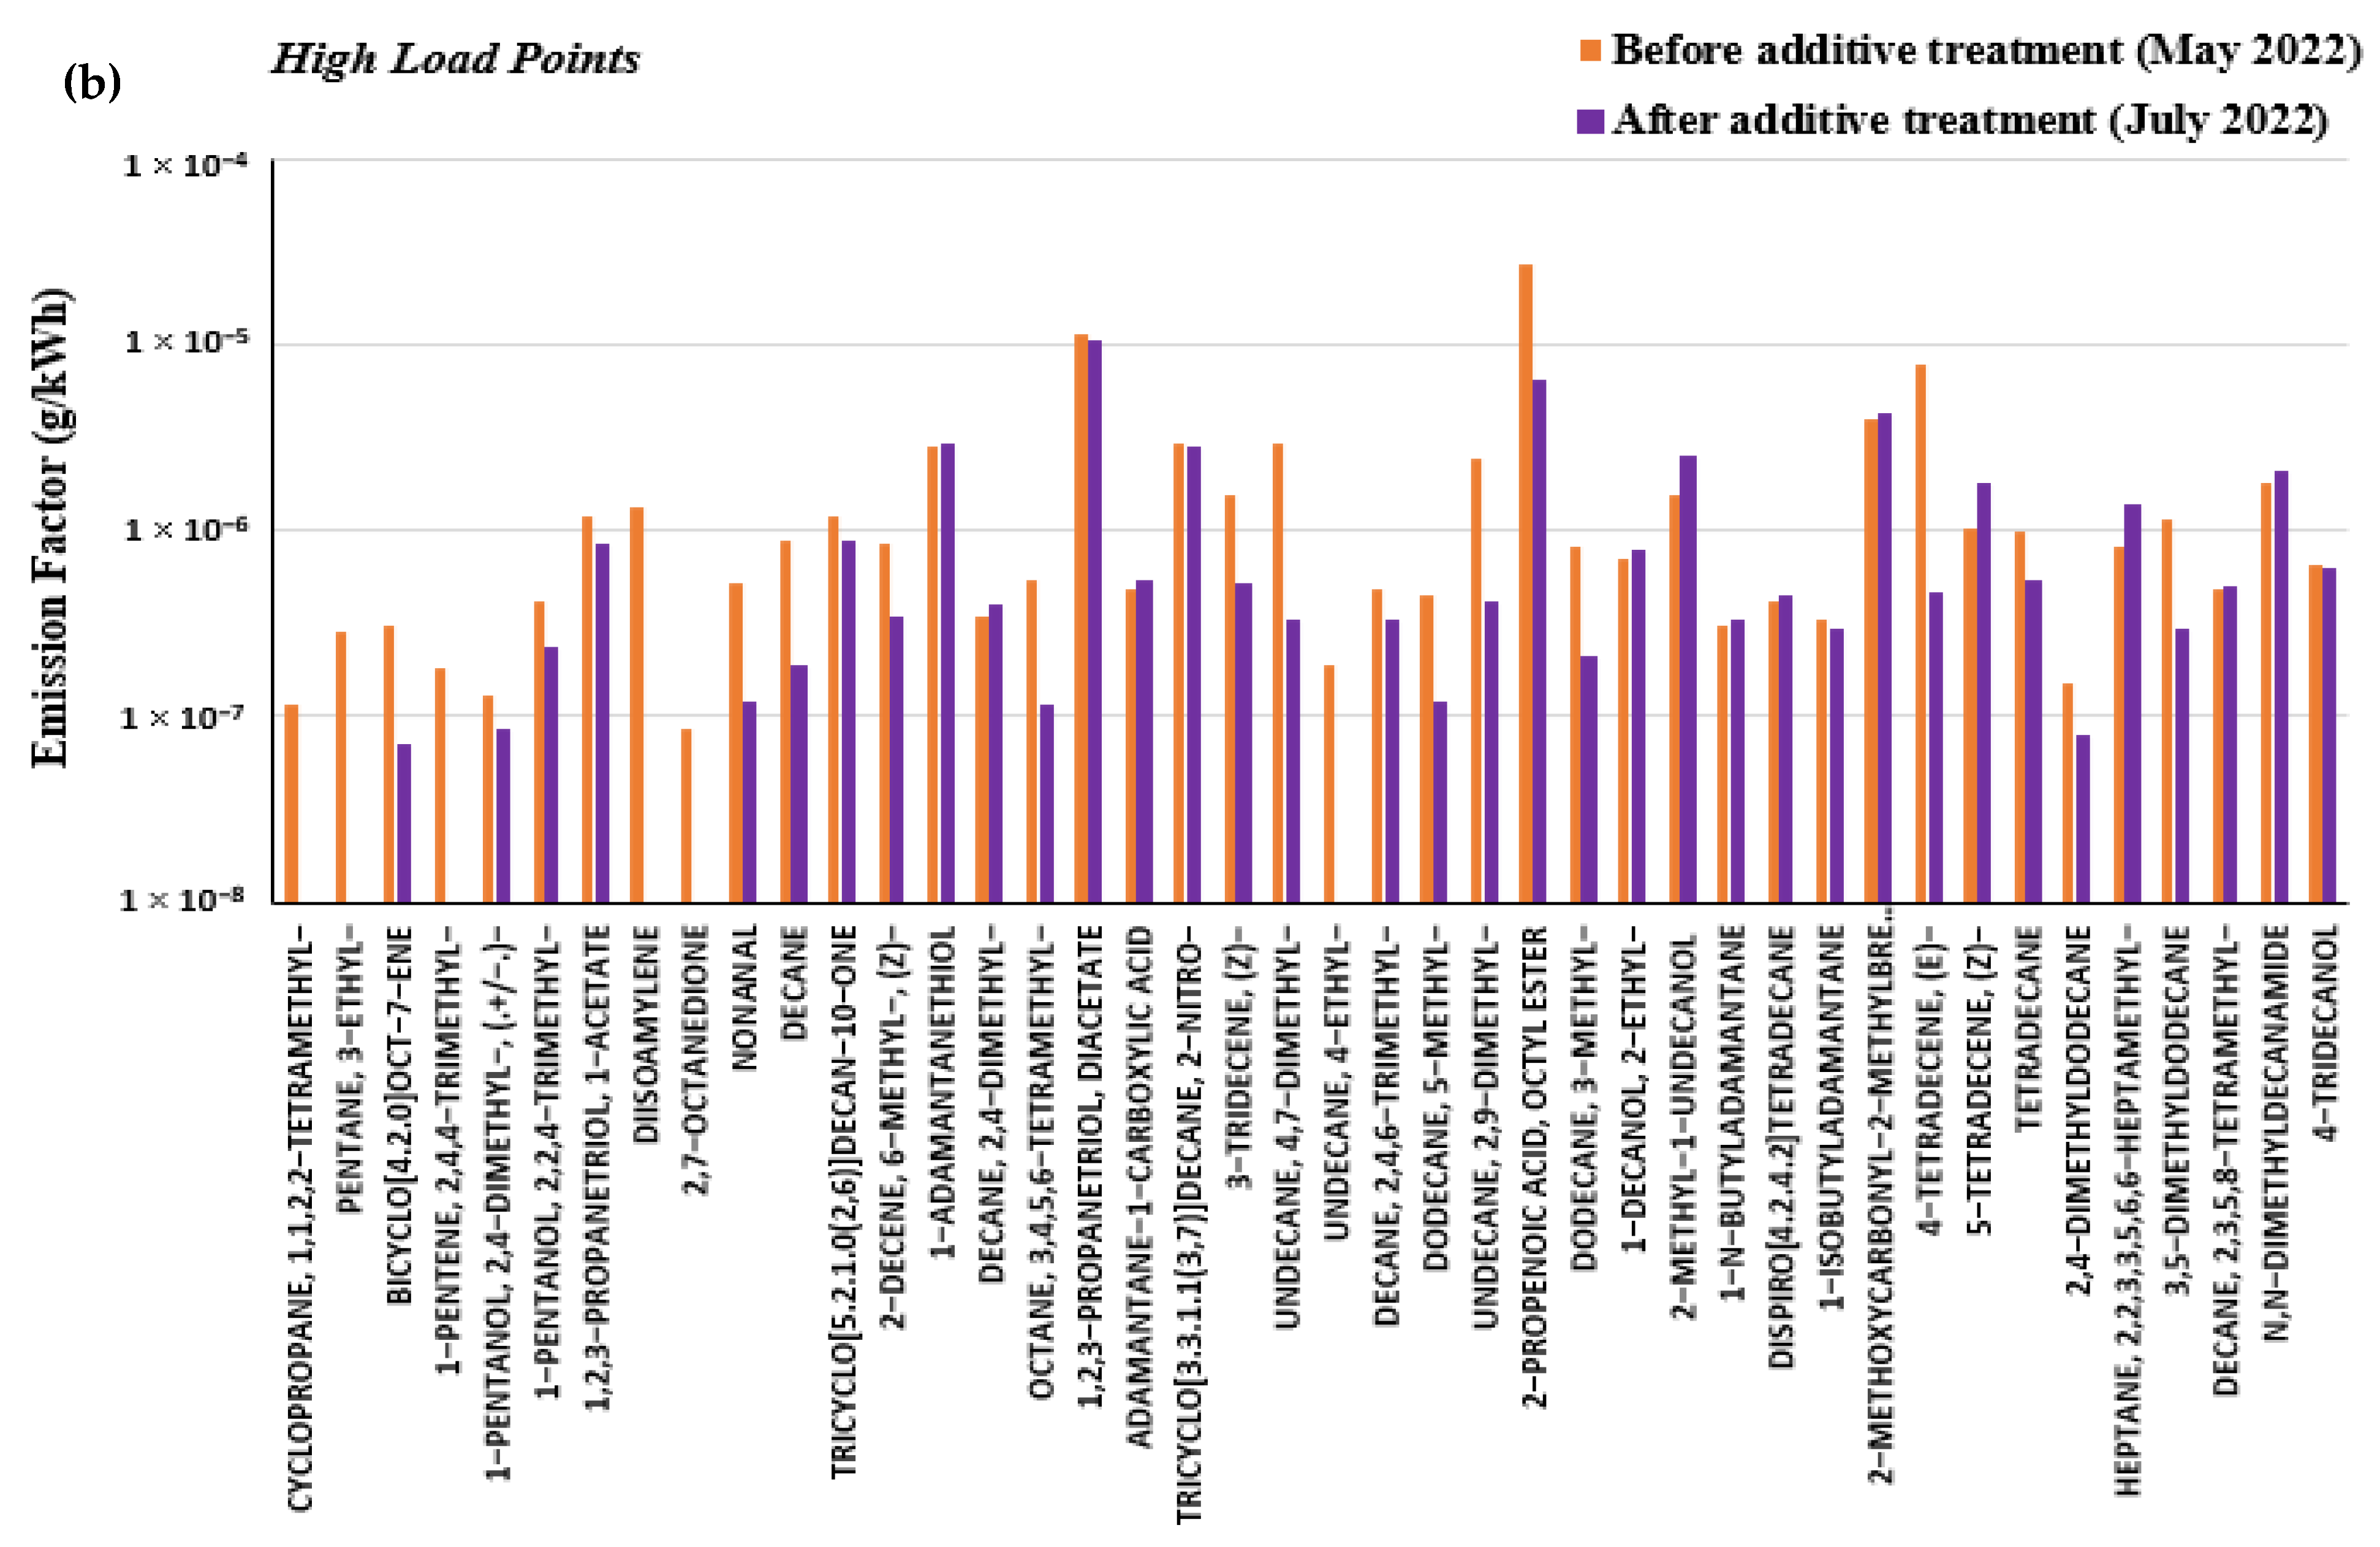
3.4. Effect of Marine Fuel Additive

As mentioned earlier in the experimental section, a fuel additive was tested in this study. The ability of this additive to reduce exhaust particulate emissions was evaluated during the July 2021 and July 2022 measurement campaigns.
The use of this marine fuel additive led to a significant decrease in emission factors (in both PM and organic compounds EFs), particularly at low engine loads (Figure 4a). The emission factors of 3,5-dimethyldodecane, undecane, 2,9-dimethyl- and 4-Tetradecene, for instance, decreased by a factor of 111, 58, and 110, respectively, at low loads and by a factor of 4, 6, and 17 at high loads, respectively, after the use of this additive (see Supplementary Materials, Figure S10a,b). The additive had a minimal effect at high loads (Figure 4b).
The t-test showed that at high loads, the emission factor values before using the additive were significantly higher than those after the use of this additive, with an average confidence level of 91.3% and a minimum of 88.9% recorded for 4-ethylundecane.
Adding the marine fuel additive decreased the total emission factors ( E F T O C s ) by a factor of 56 at low-load points. At high loads, the additive had no effect on the E F T O C s , and the values of E F T O C s before and after adding the additive were similar.
The representation of emission concentrations before and after additive treatment based on the soot mass (g/g) and sampled gas volume (g/m3) are depicted in Supplementary Materials Figure S8 and Figure S9, respectively.
Figures S8a and S9a show that representing emissions based on soot mass and sampled gas volume reduced the gap in concentration ratios before and after additive treatment for low load conditions. The emission factor ratios before and after additive treatment for the main compounds such as 1,2,3-propanetriol,1-acetate; 1-adamentanethiol; 1,2,3-propanetriol,diacetate; tricyclo [3.3.1.1(3,7)]decane,2-nitro-; 2-propenoic acid, octyl ester; 2-methyl-1-undecanol; 2-methoxycarbonyl-2-methylbrendane; 5-tetradecene, (Z)-; and 4-tridecanol were 76, 58, 52, 56, 91, 109, 56, 101, and 102 at low engine loads (Supplementary Materials, Figure S10a). Meanwhile, the concentration ratios based on the mass of soot and sampled gas volume for these same compounds were (2.4–2.3), (1.8–1.7), (1.7–1.6), (1.8–1.7), (2.9–2.7), (3.5–3.3), (1.8–1.7), (3.2–3.0), and (3.3–3.1), respectively.
At high loads, as previously noted, the additive had a minimal effect. The changes in concentration ratios before and after treatment, relative to soot mass and the sampled gas volume, were minimal (Figure S8b and Figure S9b, respectively). Unlike at low loads, the emission factors for the identified compounds at high loads are quite comparable before and after additive treatment. The same is true for the particle emission factors (Table 2).

3.5. Toxicity

Previous epidemiological and toxicological studies have indicated that the chemical components of fine particulate matter generated by ships, such as elemental and organic carbon, metals, and polycyclic aromatic hydrocarbons, can induce biological and toxic effects, including oxidative stress and cytotoxicity [94,95]. Particulate matter emissions from ships are associated with increased cardiovascular hospitalizations and are estimated to cause approximately 60,000 annual cardiopulmonary and lung cancer deaths, predominantly along the coastal zones of Europe, East Asia, and South Asia [4,95].
A summary of the hazards and toxic effects of the various organic compounds identified in our study, based on a literature review, is presented in Supporting Materials Table S8.
All the analyzed compounds can cause serious health problems, depending on exposure. As an example, 2-methyl-1-undecanol (C12H26O) and n,n-dimethyldecanamide (C12H25ON), in addition to being harmful to aquatic life, with long-lasting effects, may cause skin, eye, and respiratory irritation.
The organic compounds analyzed in the gaseous phase such as Methylcyclohexane (C7H14), heptane (C7H16), 3-methylhexane (C7H16), 2-methylheptane (C8H18), 3-methylheptane (C8H18), octane (C8H18), and nonane (C9H20) also present significant hazards. These mentioned compounds are highly flammable (liquid and vapor), may be fatal if swallowed and enter airways, cause skin irritation, may cause drowsiness or dizziness, and they are very toxic to aquatic life, with long-lasting effects.

4. Conclusions

This study focused on developing a methodology to characterize particulate chemical emissions from the main engine of a passenger vessel operating under real-world conditions, including at berth, during maneuvers, and while cruising. The EFs of PM and organic species adsorbed on the particles were determined while the ship was burning Marine Gas Oil under different operating conditions: (i) low engine loads, i.e., at berth at 4% load and 400 rpm and during maneuvers at 14% load and 800 rpm, and (ii) high engine load, i.e., during cruising at 68% load and 1000 rpm. The total E F P M ranged from 0.02 to 0.03 g/kWh at high engine loads but exhibited significant variability under low-load conditions, ranging from 0.02 to 2.83 g/kWh. These values are consistent with those reported in the literature. Alkanes were the most abundant organic compounds in terms of number, while esters dominated in emission factors, contributing to about 50% of the total E F O C i d and 3–11% of the total E F T O C s . A noticeable increase in organic compound EFs was observed at lower engine loads. The effect of a marine fuel additive was also evaluated. The use of this additive led to a significant reduction in both particulate matter and organic compound emission factors, particularly at low engine loads. Furthermore, the additive reduced total emission factors ( E F T O C s ) by a factor of 56 at low-load conditions, with no significant effect observed at high loads.

Supplementary Materials

The following supporting information can be downloaded at: https://www.mdpi.com/article/10.3390/atmos16020126/s1, Figure S1: Photograph of the Fromveur 2 during a routine voyage; Figure S2: The route provided by the Fromveur 2; Figure S3: Photograph of the sampling setup on board the Fromveur 2; Figure S4: (a) A view of the sampling line, seen from the rear of the ship, (b) a view of the installation of the Pitot tube; Figure S5: Emission concentrations as function of total soot mass. May 2022 measurement campaign (a), July 2022 measurement campaign (b); Figure S6: Emission concentrations as function of sampled gas volume. May 2022 measurement campaign (a), July 2022 measurement campaign (b); Figure S7: Emission factor ratios at low loads and high loads (EFLow load/EFHigh load), May 2022 campaign (a) and July 2022 measurement campaign (b); Figure S8: Comparison of emission concentrations as a function of total soot mass before and after additive treatment. Low-load points (a), high-load points (b); Figure S9: Comparison of emission concentrations as a function of sampled gas volume before and after additive treatment. Low-load points (a), high-load points (b); Figure S10: Decrease in emission factors after additive treatment (Ratio: EFBefore additive treatment/EFAfter additive treatment): low-load points (a), high-load points (b); Table S1: Main specifications of the fuel used in this study; Table S2: Physical and chemical properties of the marine fuel additive; Table S3: Extraction yields of doped filters (wt.%); Table S4: Chemicals used in this work; Table S5: Composition (µg) of the identified chemical species_July 2021 measurement campaign; Table S6: Composition (µg) and emission factors (µg/kWh) of the identified chemical species_May 2022 measurement campaign; Table S7: Composition (µg) and emission factors (µg/kWh) of the identified chemical species_July 2022 measurement campaign; Table S8: Toxicity of some organic compounds identified in the particulate and gaseous emissions in this study.

Author Contributions

Conceptualization, A.J., A.V., L.L.C. and R.M.; methodology, A.J. and L.L.C.; validation, A.J., A.V., R.M. and L.L.C.; formal analysis, R.M.; resources, B.S. and A.J.; data curation, R.M.; writing—original draft preparation, R.M.; writing—review and editing, R.M., A.J., A.V. and L.L.C.; supervision, A.J., A.V. and L.L.C.; project administration, A.J. and B.S.; funding acquisition, A.J. and B.S. All authors have read and agreed to the published version of the manuscript.

Funding

This research was funded by the French project ADEME CORTEA CAPNAV, grant number 1966C0011.

Institutional Review Board Statement

Not applicable.

Informed Consent Statement

Not applicable.

Data Availability Statement

All data relevant to the interpretation of the results are available in the article and the Supplementary Materials.

Acknowledgments

The authors are grateful to ADEME for the financial and operational support and to all the crew members of the Fromveur 2-Penn Ar Bed, who welcomed and assisted us on board this vessel. We would also like to thank the entire technical team at the DSEE department of IMT-Atlantique for their support and assistance in contributing to the measurement campaigns and in adapting the sample analysis protocols.

Conflicts of Interest

The authors declare no conflicts of interest.

References

  1. Kiliç, A.; Deniz, C. Inventory of Shipping Emissions in Izmit Gulf, Turkey. Environ. Prog. Sustain. Energy 2010, 29, 221–232. [Google Scholar] [CrossRef]
  2. ICCT (The International Council on Clean Transportation). Air Pollution and Greenhouse Gas Emissions from Ocean-Going Ships: Impacts, Mitigation Options and Opportunities for Managing Growth. Marit. Stud. 2007, 153, 3–10. [Google Scholar]
  3. Papaefthimiou, S.; Maragkogianni, A.; Andriosopoulos, K. Evaluation of Cruise Ships Emissions in the Mediterranean Basin: The Case of Greek Ports. Int. J. Sustain. Transp. 2016, 10, 985–994. [Google Scholar] [CrossRef]
  4. Corbett, J.J.; Winebrake, J.J.; Green, E.H.; Kasibhatla, P.; Eyring, V.; Lauer, A. Mortality from Ship Emissions: A Global Assessment. Environ. Sci. Technol. 2007, 41, 8512–8518. [Google Scholar] [CrossRef]
  5. Eyring, V.; Isaksen, I.S.A.; Berntsen, T.; Collins, W.J.; Corbett, J.J.; Endresen, O.; Grainger, R.G.; Moldanova, J.; Schlager, H.; Stevenson, D.S. Transport Impacts on Atmosphere and Climate: Shipping. Atmos. Environ. 2010, 44, 4735–4771. [Google Scholar] [CrossRef]
  6. Olivié, D.J.L.; Cariolle, D.; Teyssèdre, H.; Salas, D.; Voldoire, A.; Clark, H.; Saint-Martin, D.; Michou, M.; Karcher, F.; Balkanski, Y.; et al. Modeling the Climate Impact of Road Transport, Maritime Shipping and Aviation over the Period 1860–2100 with an AOGCM. Atmos. Chem. Phys. 2012, 12, 1449–1480. [Google Scholar] [CrossRef]
  7. Liu, H.; Fu, M.; Jin, X.; Shang, Y.; Shindell, D.; Faluvegi, G.; Shindell, C.; He, K. Health and Climate Impacts of Ocean-Going Vessels in East Asia. Nat. Clim. Change 2016, 6, 1037–1041. [Google Scholar] [CrossRef]
  8. Gaston, C.J.; Quinn, P.K.; Bates, T.S.; Gilman, J.B.; Bon, D.M.; Kuster, W.C.; Prather, K.A. The Impact of Shipping, Agricultural, and Urban Emissions on Single Particle Chemistry Observed Aboard the R/V Atlantis during CalNex. J. Geophys. Res. Atmos. 2013, 118, 5003–5017. [Google Scholar] [CrossRef]
  9. Aksoyoglu, S.; Baltensperger, U.; Prévôt, A.S.H. Contribution of Ship Emissions to the Concentration and Deposition of Air Pollutants in Europe. Atmos. Chem. Phys. 2016, 16, 1895–1906. [Google Scholar] [CrossRef]
  10. Marelle, L.; Thomas, J.L.; Raut, J.-C.; Law, K.S.; Jalkanen, J.-P.; Johansson, L.; Roiger, A.; Schlager, H.; Kim, J.; Reiter, A.; et al. Air Quality and Radiative Impacts of Arctic Shipping Emissions in the Summertime in Northern Norway: From the Local to the Regional Scale. Atmos. Chem. Phys. 2016, 16, 2359–2379. [Google Scholar] [CrossRef]
  11. Becagli, S.; Anello, F.; Bommarito, C.; Cassola, F.; Calzolai, G.; Di Iorio, T.; di Sarra, A.; Gómez-Amo, J.-L.; Lucarelli, F.; Marconi, M.; et al. Constraining the Ship Contribution to the Aerosol of the Central Mediterranean. Atmos. Chem. Phys. 2017, 17, 2067–2084. [Google Scholar] [CrossRef]
  12. Liu, Z.; Lu, X.; Feng, J.; Fan, Q.; Zhang, Y.; Yang, X. Influence of Ship Emissions on Urban Air Quality: A Comprehensive Study Using Highly Time-Resolved Online Measurements and Numerical Simulation in Shanghai. Environ. Sci. Technol. 2017, 51, 202–211. [Google Scholar] [CrossRef] [PubMed]
  13. Brandt, J.; Silver, J.D.; Christensen, J.H.; Andersen, M.S.; Bønløkke, J.H.; Sigsgaard, T.; Geels, C.; Gross, A.; Hansen, A.B.; Hansen, K.M.; et al. Assessment of Past, Present and Future Health-Cost Externalities of Air Pollution in Europe and the Contribution from International Ship Traffic Using the EVA Model System. Atmos. Chem. Phys. 2013, 13, 7747–7764. [Google Scholar] [CrossRef]
  14. Broome, R.A.; Cope, M.E.; Goldsworthy, B.; Goldsworthy, L.; Emmerson, K.; Jegasothy, E.; Morgan, G.G. The Mortality Effect of Ship-Related Fine Particulate Matter in the Sydney Greater Metropolitan Region of NSW, Australia. Environ. Int. 2016, 87, 85–93. [Google Scholar] [CrossRef]
  15. Aakko-Saksa, P.; Koponen, P.; Roslund, P.; Laurikko, J.; Nylund, N.-O.; Karjalainen, P.; Rönkkö, T.; Timonen, H. Comprehensive Emission Characterisation of Exhaust from Alternative Fuelled Cars. Atmos. Environ. 2020, 236, 117643. [Google Scholar] [CrossRef]
  16. Hakkarainen, H.; Aakko-Saksa, P.; Sainio, M.; Ihantola, T.; Rönkkö, T.J.; Koponen, P.; Rönkkö, T.; Jalava, P.I. Toxicological Evaluation of Exhaust Emissions from Light-Duty Vehicles Using Different Fuel Alternatives in Sub-Freezing Conditions. Part. Fibre Toxicol. 2020, 17, 17. [Google Scholar] [CrossRef]
  17. Alander, T.J.A.; Leskinen, A.P.; Raunemaa, T.M.; Rantanen, L. Characterization of Diesel Particles: Effects of Fuel Reformulation, Exhaust Aftertreatment, and Engine Operation on Particle Carbon Composition and Volatility. Environ. Sci. Technol. 2004, 38, 2707–2714. [Google Scholar] [CrossRef]
  18. Lack, D.A.; Cappa, C.D.; Langridge, J.; Bahreini, R.; Buffaloe, G.; Brock, C.; Cerully, K.; Coffman, D.; Hayden, K.; Holloway, J.; et al. Impact of Fuel Quality Regulation and Speed Reductions on Shipping Emissions: Implications for Climate and Air Quality. Environ. Sci. Technol. 2011, 45, 9052–9060. [Google Scholar] [CrossRef]
  19. Ntziachristos, L.; Saukko, E.; Lehtoranta, K.; Rönkkö, T.; Timonen, H.; Simonen, P.; Karjalainen, P.; Keskinen, J. Particle Emissions Characterization from a Medium-Speed Marine Diesel Engine with Two Fuels at Different Sampling Conditions. Fuel 2016, 186, 456–465. [Google Scholar] [CrossRef]
  20. Wu, D.; Li, Q.; Ding, X.; Sun, J.; Li, D.; Fu, H.; Teich, M.; Ye, X.; Chen, J. Primary Particulate Matter Emitted from Heavy Fuel and Diesel Oil Combustion in a Typical Container Ship: Characteristics and Toxicity. Environ. Sci. Technol. 2018, 52, 12943–12951. [Google Scholar] [CrossRef]
  21. Lyyränen, J.; Jokiniemi, J.; Kauppinen, E.I.; Joutsensaari, J. Aerosol Characterisation in Medium-Speed Diesel Engines Operating with Heavy Fuel Oils. J. Aerosol Sci. 1999, 30, 771–784. [Google Scholar] [CrossRef]
  22. Sarvi, A.; Fogelholm, C.-J.; Zevenhoven, R. Emissions from Large-Scale Medium-Speed Diesel Engines: 2. Influence of Fuel Type and Operating Mode. Fuel Process. Technol. 2008, 89, 520–527. [Google Scholar] [CrossRef]
  23. Petzold, A.; Weingartner, E.; Hasselbach, J.; Lauer, P.; Kurok, C.; Fleischer, F. Physical Properties, Chemical Composition, and Cloud Forming Potential of Particulate Emissions from a Marine Diesel Engine at Various Load Conditions. Environ. Sci. Technol. 2010, 44, 3800–3805. [Google Scholar] [CrossRef] [PubMed]
  24. Mohd Noor, C.W.; Noor, M.M.; Mamat, R. Biodiesel as Alternative Fuel for Marine Diesel Engine Applications: A Review. Renew. Sustain. Energy Rev. 2018, 94, 127–142. [Google Scholar] [CrossRef]
  25. Kasper, A.; Aufdenblatten, S.; Forss, A.; Mohr, M.; Burtscher, H. Particulate Emissions from a Low-Speed Marine Diesel Engine. Aerosol Sci. Technol. 2007, 41, 24–32. [Google Scholar] [CrossRef]
  26. Agrawal, H.; Malloy, Q.G.J.; Welch, W.A.; Wayne Miller, J.; Cocker, D.R. In-Use Gaseous and Particulate Matter Emissions from a Modern Ocean Going Container Vessel. Atmos. Environ. 2008, 42, 5504–5510. [Google Scholar] [CrossRef]
  27. Agrawal, H.; Welch, W.A.; Miller, J.W.; Cockert, D.R. Emission Measurements from a Crude Oil Tanker at Sea. Environ. Sci. Technol. 2008, 42, 7098–7103. [Google Scholar] [CrossRef]
  28. Murphy, S.M.; Agrawal, H.; Sorooshian, A.; Padró, L.T.; Gates, H.; Hersey, S.; Welch, W.A.; Lung, H.; Miller, J.W.; Cocker, D.R.; et al. Comprehensive Simultaneous Shipboard and Airborne Characterization of Exhaust from a Modern Container Ship at Sea. Environ. Sci. Technol. 2009, 43, 4626–4640. [Google Scholar] [CrossRef]
  29. Moldanová, J.; Fridell, E.; Popovicheva, O.; Demirdjian, B.; Tishkova, V.; Faccinetto, A.; Focsa, C. Characterisation of Particulate Matter and Gaseous Emissions from a Large Ship Diesel Engine. Atmos. Environ. 2009, 43, 2632–2641. [Google Scholar] [CrossRef]
  30. Endresen, Ø.; Bakke, J.; Sørgård, E.; Flatlandsmo Berglen, T.; Holmvang, P. Improved Modelling of Ship SO2 Emissions—A Fuel-Based Approach. Atmos. Environ. 2005, 39, 3621–3628. [Google Scholar] [CrossRef]
  31. Henein, N.A. Analysis of Pollutant Formation and Control and Fuel Economy in Diesel Engines. Progress Energy Combust. Sci. 1976, 1, 165–207. [Google Scholar] [CrossRef]
  32. Cheng, X.; Chen, L.; Hong, G.; Yan, F.; Dong, S. Modeling Study of Soot Formation and Oxidation in DI Diesel Engine Using an Improved Soot Model. Appl. Therm. Eng. 2014, 62, 303–312. [Google Scholar] [CrossRef]
  33. Lehtoranta, K.; Aakko-Saksa, P.; Vesala, H.; Järvinen, A.; Peitz, D.; Jokiluoma, J. Reducing Particle Emissions from Marine Engines—Fuel Choices and Technology Pathways: 30th CIMAC Congress 2023. In Proceedings of the 30th CIMAC World Congress, Busan, Republic of Korea, 12–16 June 2023. [Google Scholar]
  34. Ristovski, Z.D.; Miljevic, B.; Surawski, N.C.; Morawska, L.; Fong, K.M.; Goh, F.; Yang, I.A. Respiratory Health Effects of Diesel Particulate Matter. Respirology 2012, 17, 201–212. [Google Scholar] [CrossRef] [PubMed]
  35. Aakko-Saksa, P.T.; Lehtoranta, K.; Kuittinen, N.; Järvinen, A.; Jalkanen, J.-P.; Johnson, K.; Jung, H.; Ntziachristos, L.; Gagné, S.; Takahashi, C.; et al. Reduction in Greenhouse Gas and Other Emissions from Ship Engines: Current Trends and Future Options. Progress Energy Combust. Sci. 2023, 94, 101055. [Google Scholar] [CrossRef]
  36. Sofiev, M.; Winebrake, J.J.; Johansson, L.; Carr, E.W.; Prank, M.; Soares, J.; Vira, J.; Kouznetsov, R.; Jalkanen, J.-P.; Corbett, J.J. Cleaner Fuels for Ships Provide Public Health Benefits with Climate Tradeoffs. Nat. Commun. 2018, 9, 406. [Google Scholar] [CrossRef]
  37. Olmer, N.; Comer, B.; Roy, B.; Mao, X.; Rutherford, D. Greenhouse Gas. Emissions from Global Shipping, 2013–2015 Detailed Methodology; International Council on Clean Transportation: Washington, DC, USA, 2017. [Google Scholar]
  38. Xi, J.; Zhong, B.-J. Soot in Diesel Combustion Systems. Chem. Eng. Technol. 2006, 29, 665–673. [Google Scholar] [CrossRef]
  39. Alcalde-Santiago, V.; Bailón-García, E.; Davó-Quiñonero, A.; Lozano-Castelló, D.; Bueno-López, A. Three-Dimensionally Ordered Macroporous PrOx: An Improved Alternative to Ceria Catalysts for Soot Combustion. Appl. Catal. B Environ. 2019, 248, 567–572. [Google Scholar] [CrossRef]
  40. Ghadikolaei, M.A.; Yung, K.-F.; Cheung, C.S.; Lau, P.-C. Chemical Properties and Composition of PM Emitted from a Diesel Engine Fueled with Ternary Fuel (Diesel-Biodiesel-Ethanol) in Blended and Fumigation Modes. Fuel 2019, 251, 368–382. [Google Scholar] [CrossRef]
  41. Bockhorn, H. (Ed.) Soot Formation in Combustion: Mechanisms and Models; Springer Series in Chemical Physics; Springer: Berlin/Heidelberg, Germany, 1994; Volume 59, ISBN 978-3-642-85169-8. [Google Scholar]
  42. Richter, H.; Howard, J.B. Formation of Polycyclic Aromatic Hydrocarbons and Their Growth to Soot—A Review of Chemical Reaction Pathways. Progress Energy Combust. Sci. 2000, 26, 565–608. [Google Scholar] [CrossRef]
  43. Tree, D.R.; Svensson, K.I. Soot Processes in Compression Ignition Engines. Progress Energy Combust. Sci. 2007, 33, 272–309. [Google Scholar] [CrossRef]
  44. Omidvarborna, H.; Kumar, A.; Kim, D.-S. Recent Studies on Soot Modeling for Diesel Combustion. Renew. Sustain. Energy Rev. 2015, 48, 635–647. [Google Scholar] [CrossRef]
  45. Jiaqiang, E.; Xu, W.; Ma, Y.; Tan, D.; Peng, Q.; Tan, Y.; Chen, L. Soot Formation Mechanism of Modern Automobile Engines and Methods of Reducing Soot Emissions: A Review. Fuel Process. Technol. 2022, 235, 107373. [Google Scholar] [CrossRef]
  46. Yin, Z.; Liu, S.; Tan, D.; Zhang, Z.; Wang, Z.; Wang, B. A Review of the Development and Application of Soot Modelling for Modern Diesel Engines and the Soot Modelling for Different Fuels. Process Saf. Environ. Prot. 2023, 178, 836–859. [Google Scholar] [CrossRef]
  47. International Maritime Organization. Third IMO GHG Study 2014 Executive Summary and Final Report; International Maritime Organization: London, UK, 2014; Available online: https://greenvoyage2050.imo.org/wp-content/uploads/2021/01/third-imo-ghg-study-2014-executive-summary-and-final-report.pdf (accessed on 17 January 2025).
  48. Winkel, R.; Weddige, U.; Johnsen, D.; Hoen, V.; Papaefthimiou, S. Shore Side Electricity in Europe: Potential and Environmental Benefits. Energy Policy 2016, 88, 584–593. [Google Scholar] [CrossRef]
  49. Mestl, T.; Løvoll, G.; Stensrud, E.; Le Breton, A. The Doubtful Environmental Benefit of Reduced Maximum Sulfur Limit in International Shipping Fuel. Environ. Sci. Technol. 2013, 47, 6098–6101. [Google Scholar] [CrossRef]
  50. Lehtoranta, K.; Kuittinen, N.; Vesala, H.; Koponen, P. Methane Emissions from a State-of-the-Art LNG-Powered Vessel. Atmosphere 2023, 14, 825. [Google Scholar] [CrossRef]
  51. Lin, C.-Y. Strategies for Promoting Biodiesel Use in Marine Vessels. Mar. Policy 2013, 40, 84–90. [Google Scholar] [CrossRef]
  52. Johari, A.; Nyakuma, B.B.; Mohd Nor, S.H.; Mat, R.; Hashim, H.; Ahmad, A.; Yamani Zakaria, Z.; Tuan Abdullah, T.A. The Challenges and Prospects of Palm Oil Based Biodiesel in Malaysia. Energy 2015, 81, 255–261. [Google Scholar] [CrossRef]
  53. Dharma, S.; Masjuki, H.H.; Ong, H.C.; Sebayang, A.H.; Silitonga, A.S.; Kusumo, F.; Mahlia, T.M.I. Optimization of Biodiesel Production Process for Mixed Jatropha Curcas–Ceiba Pentandra Biodiesel Using Response Surface Methodology. Energy Convers. Manag. 2016, 115, 178–190. [Google Scholar] [CrossRef]
  54. Ni, P.; Wang, X.; Li, H. A Review on Regulations, Current Status, Effects and Reduction Strategies of Emissions for Marine Diesel Engines. Fuel 2020, 279, 118477. [Google Scholar] [CrossRef]
  55. Svanberg, M.; Ellis, J.; Lundgren, J.; Landälv, I. Renewable Methanol as a Fuel for the Shipping Industry. Renew. Sustain. Energy Rev. 2018, 94, 1217–1228. [Google Scholar] [CrossRef]
  56. Yu, H.; Duan, S.; Sun, P. Comparative Analysis between Natural Gas/Diesel (Dual Fuel) and Pure Diesel on the Marine Diesel Engine. J. Eng. Res. 2015, 3, 37. [Google Scholar] [CrossRef]
  57. Afon, Y.; Ervin, D. An Assessment of Air Emissions from Liquefied Natural Gas Ships Using Different Power Systems and Different Fuels. J. Air Waste Manag. Assoc. 2008, 58, 404–411. [Google Scholar] [CrossRef] [PubMed]
  58. Peng, W.; Yang, J.; Corbin, J.; Trivanovic, U.; Lobo, P.; Kirchen, P.; Rogak, S.; Gagné, S.; Miller, J.W.; Cocker, D. Comprehensive Analysis of the Air Quality Impacts of Switching a Marine Vessel from Diesel Fuel to Natural Gas. Environ. Pollut. 2020, 266, 115404. [Google Scholar] [CrossRef] [PubMed]
  59. Grönholm, T.; Mäkelä, T.; Hatakka, J.; Jalkanen, J.-P.; Kuula, J.; Laurila, T.; Laakso, L.; Kukkonen, J. Evaluation of Methane Emissions Originating from LNG Ships Based on the Measurements at a Remote Marine Station. Environ. Sci. Technol. 2021, 55, 13677–13686. [Google Scholar] [CrossRef]
  60. Sagin, Y.V.Z. and S.V. Enhancing Fuel Efficiency and Environmental Specifications of a Marine Diesel When Using Fuel Additives. Indian J. Sci. Technol. 2016, 9, 353–362. [Google Scholar] [CrossRef]
  61. Jang, S.H.; Choi, J.H. Comparison of Fuel Consumption and Emission Characteristics of Various Marine Heavy Fuel Additives. Appl. Energy 2016, 179, 36–44. [Google Scholar] [CrossRef]
  62. Tan, J.C.; Opris, C.N.; Baumgard, K.J.; Johnson, J.H. A Study of the Regeneration Process in Diesel Particulate Traps Using a Copper Fuel Additive; SAE International: Warrendale, PA, USA, 1996. [Google Scholar]
  63. Higgins, B.; Siebers, D.; Mueller, C.; Aradi, A. Effects of an Ignition-Enhancing, Diesel-Fuel Additive on Diesel-Spray Evaporation, Mixing, Ignition, and Combustion. In Symposium (International) on Combustion; Elsevier: Amsterdam, The Netherlands, 1998; Volume 27, pp. 1873–1880. [Google Scholar] [CrossRef]
  64. Guerry, E.S.; Raihan, M.S.; Srinivasan, K.K.; Krishnan, S.R.; Sohail, A. Injection Timing Effects on Partially Premixed Diesel–Methane Dual Fuel Low Temperature Combustion. Appl. Energy 2016, 162, 99–113. [Google Scholar] [CrossRef]
  65. Valentine, J.M.; Peter-Hoblyn, J.D.; Acres, G.K. Emissions Reduction and Improved Fuel Economy Performance from a Bimetallic Platinum/Cerium Diesel Fuel Additive at Ultra-Low Dose Rates; SAE International: Warrendale, PA, USA, 2000. [Google Scholar]
  66. Han, W.; Nam, J.; Lee, D. A Study on the Variation of Physical & Chemical Properties with Refining Treatment and Additive Mixture for Marine Fuel Oil. Engineering, Environmental Science. 2007. Available online: https://api.semanticscholar.org/CorpusID:106765195 (accessed on 17 January 2025).
  67. Babushok, V.I.; Tsang, W.; McNesby, K.L. Additive Influence on Polycyclic Aromatic Hydrocarbon Formation. Proc. Combust. Inst. 2002, 29, 2315–2323. [Google Scholar] [CrossRef]
  68. Pedrozo, V.B.; May, I.; Dalla Nora, M.; Cairns, A.; Zhao, H. Experimental Analysis of Ethanol Dual-Fuel Combustion in a Heavy-Duty Diesel Engine: An Optimisation at Low Load. Appl. Energy 2016, 165, 166–182. [Google Scholar] [CrossRef]
  69. Wang, J.; Yang, F.; Ouyang, M. Dieseline Fueled Flexible Fuel Compression Ignition Engine Control Based on In-Cylinder Pressure Sensor. Appl. Energy 2015, 159, 87–96. [Google Scholar] [CrossRef]
  70. Li, J.; Yang, W.M.; An, H.; Chou, S.K. Modeling on Blend Gasoline/Diesel Fuel Combustion in a Direct Injection Diesel Engine. Appl. Energy 2015, 160, 777–783. [Google Scholar] [CrossRef]
  71. Huang, C.; Hu, Q.; Wang, H.; Qiao, L.; Jing, S.; Wang, H.; Zhou, M.; Zhu, S.; Ma, Y.; Lou, S.; et al. Emission Factors of Particulate and Gaseous Compounds from a Large Cargo Vessel Operated under Real-World Conditions. Environ. Pollut. 2018, 242, 667–674. [Google Scholar] [CrossRef] [PubMed]
  72. Celo, V.; Dabek-Zlotorzynska, E.; McCurdy, M. Chemical Characterization of Exhaust Emissions from Selected Canadian Marine Vessels: The Case of Trace Metals and Lanthanoids. Environ. Sci. Technol. 2015, 49, 5220–5226. [Google Scholar] [CrossRef]
  73. Sippula, O.; Stengel, B.; Sklorz, M.; Streibel, T.; Rabe, R.; Orasche, J.; Lintelmann, J.; Michalke, B.; Abbaszade, G.; Radischat, C.; et al. Particle Emissions from a Marine Engine: Chemical Composition and Aromatic Emission Profiles under Various Operating Conditions. Environ. Sci. Technol. 2014, 48, 11721–11729. [Google Scholar] [CrossRef]
  74. Winnes, H.; Fridell, E. Particle Emissions from Ships: Dependence on Fuel Type. J. Air Waste Manag. Assoc. 2009, 59, 1391–1398. [Google Scholar] [CrossRef]
  75. Agrawal, H.; Welch, W.A.; Henningsen, S.; Miller, J.W.; Cocker III, D.R. Emissions from Main Propulsion Engine on Container Ship at Sea. J. Geophys. Res. Atmos. 2010, 115, D23205. [Google Scholar] [CrossRef]
  76. Moldanová, J.; Fridell, E.; Winnes, H.; Holmin-Fridell, S.; Boman, J.; Jedynska, A.; Tishkova, V.; Demirdjian, B.; Joulie, S.; Bladt, H.; et al. Physical and Chemical Characterisation of PM Emissions from Two Ships Operating in European Emission Control Areas. Atmos. Meas. Tech. 2013, 6, 3577–3596. [Google Scholar] [CrossRef]
  77. Chu-Van, T.; Ristovski, Z.; Pourkhesalian, A.M.; Rainey, T.; Garaniya, V.; Abbassi, R.; Jahangiri, S.; Enshaei, H.; Kam, U.-S.; Kimball, R.; et al. On-Board Measurements of Particle and Gaseous Emissions from a Large Cargo Vessel at Different Operating Conditions. Environ. Pollut. 2018, 237, 832–841. [Google Scholar] [CrossRef]
  78. Anderson, M.; Salo, K.; Hallquist, Å.M.; Fridell, E. Characterization of Particles from a Marine Engine Operating at Low Loads. Atmos. Environ. 2015, 101, 65–71. [Google Scholar] [CrossRef]
  79. Reda, A.A.; Schnelle-Kreis, J.; Orasche, J.; Abbaszade, G.; Lintelmann, J.; Arteaga-Salas, J.M.; Stengel, B.; Rabe, R.; Harndorf, H.; Sippula, O.; et al. Gas Phase Carbonyl Compounds in Ship Emissions: Differences between Diesel Fuel and Heavy Fuel Oil Operation. Atmos. Environ. 2015, 112, 370–380. [Google Scholar] [CrossRef]
  80. Balzani Lööv, J.M.; Alfoldy, B.; Beecken, J.; Berg, N.; Berkhout, A.J.C.; Duyzer, J.; Gast, L.F.L.; Hjorth, J.; Jalkanen, J.-P.; Lagler, F.; et al. Field Test of Available Methods to Measure Remotely SO2 and NOX Emissions from Ships. Atmos. Meas. Tech. Discuss. 2013, 6, 9735–9782. [Google Scholar]
  81. Westerlund, J.; Hallquist, M.; Hallquist, Å.M. Characterization of Fleet Emissions from Ships through Multi-Individual Determination of Size-Resolved Particle Emissions in a Coastal Area. Atmos. Environ. 2015, 112, 159–166. [Google Scholar] [CrossRef]
  82. Alföldy, B.; Lööv, J.B.; Lagler, F.; Mellqvist, J.; Berg, N.; Beecken, J.; Weststrate, H.; Duyzer, J.; Bencs, L.; Horemans, B.; et al. Measurements of Air Pollution Emission Factors for Marine Transportation in SECA. Atmos. Meas. Tech. 2013, 6, 1777–1791. [Google Scholar] [CrossRef]
  83. Cooper, D.A. Exhaust Emissions from Ships at Berth. Atmos. Environ. 2003, 37, 3817–3830. [Google Scholar] [CrossRef]
  84. Schrooten, L.; De Vlieger, I.; Panis, L.I.; Chiffi, C.; Pastori, E. Emissions of Maritime Transport: A European Reference System. Sci. Total Environ. 2009, 408, 318–323. [Google Scholar] [CrossRef]
  85. Zhang, F.; Chen, Y.; Tian, C.; Lou, D.; Li, J.; Zhang, G.; Matthias, V. Emission Factors for Gaseous and Particulate Pollutants from Offshore Diesel Engine Vessels in China. Atmos. Chem. Phys. 2016, 16, 6319–6334. [Google Scholar] [CrossRef]
  86. Zhang, F.; Chen, Y.; Chen, Q.; Feng, Y.; Shang, Y.; Yang, X.; Gao, H.; Tian, C.; Li, J.; Zhang, G.; et al. Real-World Emission Factors of Gaseous and Particulate Pollutants from Marine Fishing Boats and Their Total Emissions in China. Environ. Sci. Technol. 2018, 52, 4910–4919. [Google Scholar] [CrossRef]
  87. Zhang, F.; Chen, Y.; Cui, M.; Feng, Y.; Yang, X.; Chen, J.; Zhang, Y.; Gao, H.; Tian, C.; Matthias, V.; et al. Emission Factors and Environmental Implication of Organic Pollutants in PM Emitted from Various Vessels in China. Atmos. Environ. 2019, 200, 302–311. [Google Scholar] [CrossRef]
  88. Sagot, B. CAPNAV: CAractérisation des Émissions Particulaires des NAVires-Application à des Navires à Passagers. 2023, Volume 81. Available online: https://librairie.ademe.fr/mobilite-et-transports/6685-caracterisation-des-emissions-particulaires-des-navires-application-a-des-navires-a-passagers.html (accessed on 17 January 2025).
  89. Chen, L.; Song, D.; Tian, Y.; Ding, L.; Yu, A.; Zhang, H. Application of On-Line Microwave Sample-Preparation Techniques. TrAC Trends Anal. Chem. 2008, 27, 151–159. [Google Scholar] [CrossRef]
  90. Rogge, W.F.; Hildemann, L.M.; Mazurek, M.A.; Cass, G.R.; Simoneit, B.R.T. Sources of Fine Organic Aerosol. 2. Noncatalyst and Catalyst-Equipped Automobiles and Heavy-Duty Diesel Trucks. Environ. Sci. Technol. 1993, 27, 636–651. [Google Scholar] [CrossRef]
  91. Chevron. Diesel Fuels Technical Review (FTR-2); Chevron Products Company: San Ramon, CA, USA, 2007. [Google Scholar]
  92. Schauer, J.J.; Kleeman, M.J.; Cass, G.R.; Simoneit, B.R.T. Measurement of Emissions from Air Pollution Sources. 2. C1 through C30 Organic Compounds from Medium Duty Diesel Trucks. Environ. Sci. Technol. 1999, 33, 1578–1587. [Google Scholar] [CrossRef]
  93. Zielinska, B.; Campbell, D.; Lawson, D.R.; Ireson, R.G.; Weaver, C.S.; Hesterberg, T.W.; Larson, T.; Davey, M.; Liu, L.-J.S. Detailed Characterization and Profiles of Crankcase and Diesel Particular Matter Exhaust Emissions Using Speciated Organics. Environ. Sci. Technol. 2008, 42, 5661–5666. [Google Scholar] [CrossRef]
  94. Son, J.-Y.; Lee, J.-T.; Kim, K.-H.; Jung, K.; Bell, M.L. Characterization of Fine Particulate Matter and Associations between Particulate Chemical Constituents and Mortality in Seoul, Korea. Environ. Health Perspect. 2012, 120, 872–878. [Google Scholar] [CrossRef]
  95. Tian, L.; Ho, K.; Louie, P.K.K.; Qiu, H.; Pun, V.C.; Kan, H.; Yu, I.T.S.; Wong, T.W. Shipping Emissions Associated with Increased Cardiovascular Hospitalizations. Atmos. Environ. 2013, 74, 320–325. [Google Scholar] [CrossRef]
Figure 1. Schematic diagrams of sampling setup.
Atmosphere 16 00126 g001
Figure 2. Exhaust mass flow rate variations during a routine operation. Data obtained through post-processing Pitot measurements_ July 2022.
Atmosphere 16 00126 g002
Figure 3. Emission factors of the particle-bound chemical species given as g/kWh. May 2022 campaign (a) and July 2022 measurement campaign (b).
Atmosphere 16 00126 g003
Figure 4. Comparison of emission factors before and after additive treatment. Low-load points (a) and high-load points (b).
Atmosphere 16 00126 g004aAtmosphere 16 00126 g004b
Table 1. Major technical specifications of the main port engine.
SpecificationsPort Engine
ManufacturerABC, Anglo Belgium Corporation
Model8 DZC-1000-166-A
TypeStraight-eight engine
4-stroke turbocharged diesel cycle
mechanical direct injection
one injector pump per cylinder
Rated speed1000 rpm
Nominal power1650 kW
Test cycleE3
NOX emission value E3 = 7.6 g/kWh
Table 2. Sampling conditions and GC-MS-FID analysis results.
Measurement CampaignJuly 2021May 2022July 2022
Engine load (Low/High)LowHighLowHighLowHigh
Operation modeAt berth,
departure,
arrival
CruisingAt berth,
departure,
arrival
CruisingAt berth,
departure,
arrival
Cruising
Average exhaust mass flow rate (kg/h)3218
(±2426)
10,212
(±1300)
2923
(±1637)
9993
(±2039)
5403
(±1243)
13,137
(±1173)
Average exhaust gas flow rate (m3/h)4593
(±3463)
16,806
(±2139)
4060
(±2274)
16,560
(±3379)
8273
(±1903)
21,641
(±1932)
Average engine power (kW)48.5
(±37)
1071.8
(±136)
5.4
(±3)
1039.8
(±212)
368.2
(±85)
1499.7
(±134)
Total mass of soot (mg)ndnd53
(±0.1)
25
(±0.1)
47.5
(±0.1)
22.6
(±0.1)
Sampled gas volume (m3)ndnd14.113.611.817.2
E F O C i d (µg/kWh)ndnd10,200
(±5713)
84.2
(±17)
169.1
(±39)
44.0
(±4)
E F T O C s (µg/kWh)ndnd97,328
(±54,510)
414
(±84)
1738
(±400)
597
(±53)
E F P M (g/kWh)ndnd2.83
(±1.590)
0.03
(±0.006)
0.09
(±0.021)
0.02
(±0.002)
Number of detected OCs315166267237315302
Number of identified OCs303045423836
Identification rate (wt.%)7.14.410.520.39.77.4
nd = not determined.
Disclaimer/Publisher’s Note: The statements, opinions and data contained in all publications are solely those of the individual author(s) and contributor(s) and not of MDPI and/or the editor(s). MDPI and/or the editor(s) disclaim responsibility for any injury to people or property resulting from any ideas, methods, instructions or products referred to in the content.

