Article

Inter-Monthly Variations in CO2 and CH4 Fluxes in a Temperate Forest: Coupling Dynamics and Environmental Drivers

1
College of the Environment and Ecology, Xiamen University, Xiamen 361102, China
2
Key Laboratory of Ecosystem Network Observation and Modeling, Institute of Geographic Sciences and Natural Resources Research, Chinese Academy of Sciences, Beijing 100101, China
3
College of Resources and Environment, University of Chinese Academy of Sciences, Beijing 100049, China
4
Xiamen Environmental Monitoring Station, Xiamen 361021, China
*
Author to whom correspondence should be addressed.
Atmosphere 2025, 16(12), 1326; https://doi.org/10.3390/atmos16121326
Submission received: 26 September 2025 / Revised: 13 November 2025 / Accepted: 20 November 2025 / Published: 24 November 2025

Abstract

Climate change, driven largely by anthropogenic greenhouse gas emissions, is a major global issue. Long-term high-frequency measurements of gas fluxes remain limited, especially outside the growing season. This study addresses two key gaps: the absence of continuous annual data capturing diurnal and seasonal variations, and the biases from suboptimal sampling timing. Using automated chambers, we monitored soil CO2 and CH4 fluxes throughout 2016 in a temperate forest on Changbai Mountain, China. Our results showed a strong negative correlation between annual CO2 and CH4 fluxes, with a slope of −0.21 and R2 of 0.70. This relationship persisted from March to November but was absent during the winter and April. Both gases exhibited the largest diurnal variations in summer. Statistical analysis identified 16:00 as the optimal single sampling time for estimating daily mean fluxes in most months. CO2 fluxes were primarily governed by temperature but modulated by VWC (soil volumetric water content). They were suppressed during summer drought and enhanced during winter freeze–thaw cycles. CH4 uptake rates were strongly dependent on VWC throughout the growing season, while their temperature response underwent a reversal from positive in summer to negative in winter. Decision tree analysis revealed nonlinear threshold responses. CO2 fluxes exhibited three temperature thresholds between 5.30 and 15.64 °C and two VWC thresholds between 0.30 and 0.42 m3 m−3. CH4 fluxes showed five temperature thresholds ranging from 2.34 to 15.71 °C and seven VWC thresholds from 0.11 to 0.44 m3 m−3. The strongest anticorrelation between CH4 flux and temperature occurred at intermediate VWC levels. This study provides detailed characteristics of greenhouse gas fluxes based on complete annual high-frequency data. It emphasizes the importance of year-round monitoring and offers improved sampling strategies and mechanistic insights for better flux monitoring and climate prediction.

1. Introduction

In the global carbon cycle, CO2 and CH4, as the two primary greenhouse gases, collectively contributed approximately 0.7 °C and 0.5 °C to global warming, respectively, between 2010 and 2019 [1]. Their dynamic interactions exert a profound influence on the climate system. Temperate forests, which serve as important carbon sinks, store approximately 10% of global forest carbon stocks [2]. The temperate Korean pine-broadleaf mixed forests in Northeast China constitute 27% of the national forest area [3], and are recognized for their particularly valuable soil carbon flux characteristics [4,5,6]. Although forest soils act as CO2 sources and CH4 sinks under well-drained conditions [7,8], the scarcity of CH4 flux data, driven by higher monitoring costs compared to CO2 [9], has resulted in significant knowledge gaps concerning their climate change responses [10,11]. Research across Arctic permafrost regions has demonstrated a substantial underestimation of winter CO2 emissions. A synthesis of data from 104 sites revealed that the magnitude of this underestimation reaches 41% [12], underscoring the systematic biases introduced by inadequate observational coverage.
Previous studies have established the central regulatory role of soil temperature (Ts) and soil moisture in greenhouse gas exchange rates [13,14,15,16]. Moderate warming and increased humidity can simultaneously enhance CO2 emissions and CH4 uptake by activating microbial activity [17,18,19]. A global meta-analysis indicates that warming has increased CH4 uptake by 36% [20], a finding which provides critical evidence for predicting the impacts of future climate change. The interaction between soil temperature and moisture exerts a complex, often non-linear control on greenhouse gas fluxes. This control frequently manifests as threshold responses; for example, temperature-induced water stress can inhibit organic matter mineralization, thereby reducing CO2 emissions [21] and potentially reversing CH4 sink–source dynamics [22]. Similarly, under high temperatures, soil water stress can suppress microbial activity, counteracting the temperature-driven stimulation of CO2 emissions [21]. Conversely, under extremely wet conditions, oxygen diffusion is limited, suppressing both CO2 emissions and CH4 oxidation [23,24]. Under such oxygen-limited, anaerobic conditions, elevated temperatures can further stimulate CH4 production by enhancing anaerobic microbial processes [19,25]. These effects are further complicated by critical thresholds [26] and by synergistic or antagonistic interactions between Ts and soil volumetric water content (VWC) [10,11,27,28,29]. These interactions often manifest as threshold responses, where the sensitivity of gas fluxes to one factor changes dramatically beyond a critical value of the other [26,28]. Therefore, identifying these critical thresholds is essential for elucidating the interactive regulatory mechanisms. Particularly noteworthy is the strongly inverse relationship between soil CO2 and CH4 flux dynamics [30], which may offer new insights for extrapolating historical CH4 fluxes using readily measurable CO2 fluxes [30]. However, the mechanistic basis for this inverse correlation remains unclear.
This study addresses two key methodological challenges: the scarcity of long-term continuous observations, particularly during non-growing seasons and at monthly scales [3,10,29], and the substantial influence of sampling timing on data reliability. The critical importance of accounting for diurnal variation is well-established. Seminal studies demonstrated that ignoring diurnal flux dynamics introduces significant bias in cumulative carbon flux estimates, establishing that soil CO2 fluxes must be measured through the use of an elevated sampling density or at representative times rather than through arbitrary single measurements [31,32,33]. The pronounced diurnal dynamics of soil CH4 fluxes similarly necessitate careful sampling design [34,35]. Building upon this methodological foundation, studies across diverse ecosystems have identified optimal observation windows for daily mean CO2 fluxes to be 8:00–10:00 and 18:00–20:00 [36]. For instance, a distinctive bimodal pattern has been observed in cold-temperate forests, with CO2 reaching its daily mean at 10:00 and 17:00, and CH4 at 10:00 [37]. Moreover, these peak times vary significantly across ecosystems: as seen in agricultural systems (peaking at 10:00 for both CO2 and CH4 daily means) [38], tropical rainforests (9:00 for CO2 versus 12:00 for CH4 daily means) [39], and grasslands (which exhibit high variability in CO2 peaks at 7:00–9:00, 15:00–17:00, and 15:00–19:00) [40]. These ecosystem-specific patterns underscore the critical need for optimized sampling protocols. Collectively, these foundational and ecosystem-specific studies provide a robust methodological basis for subsequent research aimed at quantifying and validating optimal sampling time windows across diverse ecosystems.
This study extends the analysis to a monthly resolution using 2016 in situ observations from broadleaf-Korean pine forests on Changbai Mountain. Our objectives are to (1) resolve diurnal CO2/CH4 flux dynamics at monthly scales, (2) identify optimal daily sampling windows (including peaks and troughs) to improve chamber method monitoring accuracy, and (3) quantify Ts–VWC regulatory effects on flux coupling using Pearson correlation and stepwise regression. Furthermore, we developed a model to predict global warming potential (GWP). These findings will advance the understanding of temperate forest carbon cycles and provide a scientific basis supporting climate policy development.

2. Materials and Methods

2.1. Study Site

This research was conducted in a mixed Korean pine-broadleaf forest in the Changbai Mountain region (42°24′9″ N, 128°05′45″ E), Northeast China, at an elevation of 738 m. The study site is the 1-ha Standard Plot No. 1 (CBS-1), which is a designated long-term ecological research site in the core protected area and has been maintained with protective fencing since 1998. This old-growth forest, undisturbed for over 200 years, has an average tree height of 25 m and a canopy density of 0.8 [41]. The stand is primarily composed of Pinus koraiensis Sieb. et Zucc., along with the codominant species Tilia amurensis Rupr. and Quercus mongolica Fisch. ex Ledeb., with respective stand densities of 98.9, 117.1, and 37.1 trees ha−1 [3]. The region has a continental temperate climate with monsoon features, characterized by long, cold winters. The average annual temperature is 3.6 °C, with monthly temperatures ranging from −23.3 to −16.1 °C in January and from 8.7 to 19.3 °C in July. The mean annual precipitation is 713 mm. The dominant soil type is dark brown forest soil, classified as Cambisols (World Reference Base for Soil Resources, 2022) [42].

2.2. Experiment Design

Soil-atmosphere CO2 and CH4 exchanges were continuously monitored using eight automated non-transparent flux chambers. Each chamber featured a circular base (20 cm internal diameter) that was inserted 10 cm into the soil, penetrating the organic horizon to contact the mineral soil layer. Chamber locations were selected in representative areas according to their distance from large trees, sparse vegetation cover, and uniform litter distribution. These eight chambers (C1–C8) were arranged in a radial pattern with 2 m intervals beyond the canopy boundary (Figure 1). To ensure that measured fluxes originated primarily from soil processes rather than from fresh litter decomposition or live plant photosynthesis, the ground area enclosed by each chamber was maintained clear of litter and vegetation throughout the study period. Gas concentrations were measured using a mid-infrared laser absorption spectrometer (Model: 907–0010, Los Gatos Research Inc., San Jose, CA, USA). The system employed a sequential measurement protocol: each chamber was sealed for 3 min during measurement, and all eight chambers were measured sequentially in a continuous 30-min cycle, yielding 48 daily measurements per chamber. Annual data gaps accounted for 12.8% of CO2 flux and 12.7% of CH4 flux measurements, primarily due to equipment failure or power interruptions. A rigorous QA/QC protocol was applied to distinguish biological fluxes from technical artifacts while preserving ecologically meaningful natural variability, including extreme events. The process involved: (1) removing fluxes derived from concentration time series showing clear instrumental errors (e.g., sudden jumps or drops indicative of sensor malfunctions or chamber leaks); and (2) excluding extreme outliers that were physically implausible within the ecosystem context. Total gas exchange was quantified by temporally integrating the validated flux data across diurnal and monthly intervals. To monitor environmental conditions at the dominant source depth of soil respiration, near-surface (5 cm) soil temperature (Ts, °C) and volumetric water content (VWC, % vol) were recorded using three sensors (CS655, Campbell Sci. Inc., Logan, UT, USA). The sensors were installed in the central area among the chambers (Figure 1), approximately 1–2 m from any adjacent chamber base ring, and set to log data at 30-min intervals.

2.3. Data Processing and Analysis

Subsurface environment CO2 and CH4 emission rates were determined by linear regression of gas concentration changes over time using the following equation:
F C O 2 / C H 4 = 10 V P a m b ( 1 W 0 1000000 ) C t R S ( T a + 273.15 )
The fluxes of CO2 ( F C O 2 , μmol m−2 s−1) and CH4 ( F C H 4 , nmol m−2 s−1) were derived from temporal gas concentration variations within the chambers. Calculations incorporated chamber-specific parameters, including chamber volume (V, cm3), ambient pressure ( P a m b , kPa), air temperature ( T a , °C), water vapor mixing ratio ( W 0 , μmol mol−1), and collar cross-sectional area (S, cm2). Gas mixing ratios were quantified in parts per million (ppm) for CO2 and parts per billion (ppb) for CH4. The rate of change in the water-vapor-corrected, dry-air mole mixing ratio, C t (conceptually analogous to d w d t ), constitutes the central term for calculating the flux and was adjusted for water vapor interference under standardized reference conditions: standard pressure ( P 0 = 101.325 kPa), reference temperature ( T 0 = 273.15 K), and the molar volume of an ideal gas ( V 0 = 22.414 L mol−1). The universal gas constant (R) was set at 8.314 Pa m3 mol−1 K−1, and the collar area was 298.51 cm2. Flux directions were defined as positive for soil emissions and negative for atmospheric uptake. All gas flux measurements were rigorously validated to ensure accuracy and reliability. Instruments were regularly calibrated with certified standard gases and cross-validated against laboratory standards before, during, and after field deployment.
The annual CO2 and CH4 emissions were quantified by integrating monthly flux measurements through the following formulations:
F C O 2 = i = 1 n F i × t i × M × 8.64 × 10 2 ,
F C H 4 = i = 1 n ( F i × t i ) × M × 8.64 × 10 5
F C O 2 and F C H 4 (in g m−2) represent annual cumulative fluxes of CO2 and CH4. Fi denotes the mean daily flux values (μmol m−2 s−1 for CO2 and nmol m−2 s−1 for CH4) in the i-th month, derived either from continuous 24-h measurements or representative sampling time points reflecting the daily mean. t i denotes the total days per month, while M corresponds to the molecular weights of CO2 and CH4. For unit conversion, the factor 8.64 × 10⁻² is applied for CO2, while 8.64 × 10⁻⁵ is used for CH4.
The 100-year global warming potential (GWP100) was calculated by converting cumulative CH4 emissions to CO2-equivalents using a GWP factor of 25 (relative to CO2 = 1). The formula for calculating GWP100 (g CO2 eq m−2) for CO2 and CH4 is as follows [6,43]:
G W P 100 C O 2 + C H 4 = F C O 2 + F C H 4 × 25

2.4. Statistical Analyses

By implementing a comprehensive data validation protocol, we successfully differentiated authentic flux variations from equipment-induced anomalies while maintaining the integrity of natural temporal patterns. To enable cross-seasonal and cross-study comparisons based on representative diurnal patterns, we calculated monthly diurnal averages for Ts, VWC, CO2, and CH4 fluxes. Fluxes were derived from daily variations, with daytime (6:00–17:00) and nighttime (18:00–5:00) periods used to identify time points closest to the daily mean, following a standardized protocol [44,45]. Linear regression (y = a + bx) was used to assess monthly/annual CH4–CO2 flux relationships, categorized as: synergistic effect (positive, p < 0.05), trade-off effect (negative, p < 0.05), or random relationship (p > 0.05). Due to violations of parametric test assumptions (normality and homoscedasticity) caused by spatiotemporal variability, climate outliers, and microbial nonlinearity, we applied non-parametric methods. The Kruskal-Wallis test was used to assess variations in flux distributions across diel periods (daytime, nighttime, and daily averages) and hourly intervals, with Wilcoxon post-hoc tests employed to identify significant differences (non-rankable data were excluded). Relationships between gas fluxes (CO2 and CH4) and soil factors (Ts and VWC at 5 cm) were quantified using Pearson correlation and multiple linear regression after the removal of non-significant (p > 0.05) or multicollinear (VIF > 10) predictors. The regression models evaluated (1) the effects of Ts, VWC, and CO2 on CH4 fluxes and (2) the effects of Ts, VWC, and CH4 on CO2 fluxes, with all model fit statistics (including R2, F, and p-values) reported. We identified significant thresholds (p < 0.001) in soil CO2 and CH4 flux responses to Ts and VWC by employing decision tree regression in R v4.3.1, utilizing the ‘rpart’ package with a minimum node size of 30 and a complexity parameter of 0.01. Threshold validity was evaluated using 10-fold cross-validation with three criteria: (1) a >5% decrease in Gini impurity, ensuring statistical substance; (2) inter-node flux differences exceeding 20% of the total standard deviation, guaranteeing ecological relevance; and (3) >80% consistency across cross-validation folds, verifying robustness against data subset variations. While linear models with interaction terms can test for simple synergistic effects, we specifically employed decision tree regression to investigate the more complex, non-linear, and interactive effects of Ts and VWC, as this method is uniquely suited to identify critical thresholds and conditional relationships. The stepwise regression models were thus designed to pinpoint the primary direct influences of the predictors. All statistical analyses were performed using R v4.3.1 at a significance level of p < 0.05 [46], following standard protocols for environmental data transformation and model validation.

3. Results

3.1. Environmental Factors and Coupling of CO2 and CH4 Fluxes

The lowest monthly mean soil temperature (Ts) was recorded in January, while the lowest volumetric water content (VWC) occurred in February. In contrast, the highest monthly mean Ts was recorded in July and August, and the peak VWC was observed in April and September (Figure 2). Throughout the study period, the monthly mean Ts ranged from −1.6 to 17.8 °C. From April to October, Ts exhibited distinct unimodal diurnal patterns, typically peaking between 7:00 and 9:00 and reaching a trough between 16:00 and 18:00. The remaining five months showed minimal diurnal thermal variation. The monthly mean VWC ranged from 0.09 to 0.46 m3 m−3. Pronounced unimodal diurnal variations in VWC were observed in July (peaking at 4:00 with a trough at 19:00) and August (with a single peak at 11:00). Other months maintained relatively stable moisture levels (Figure 2).
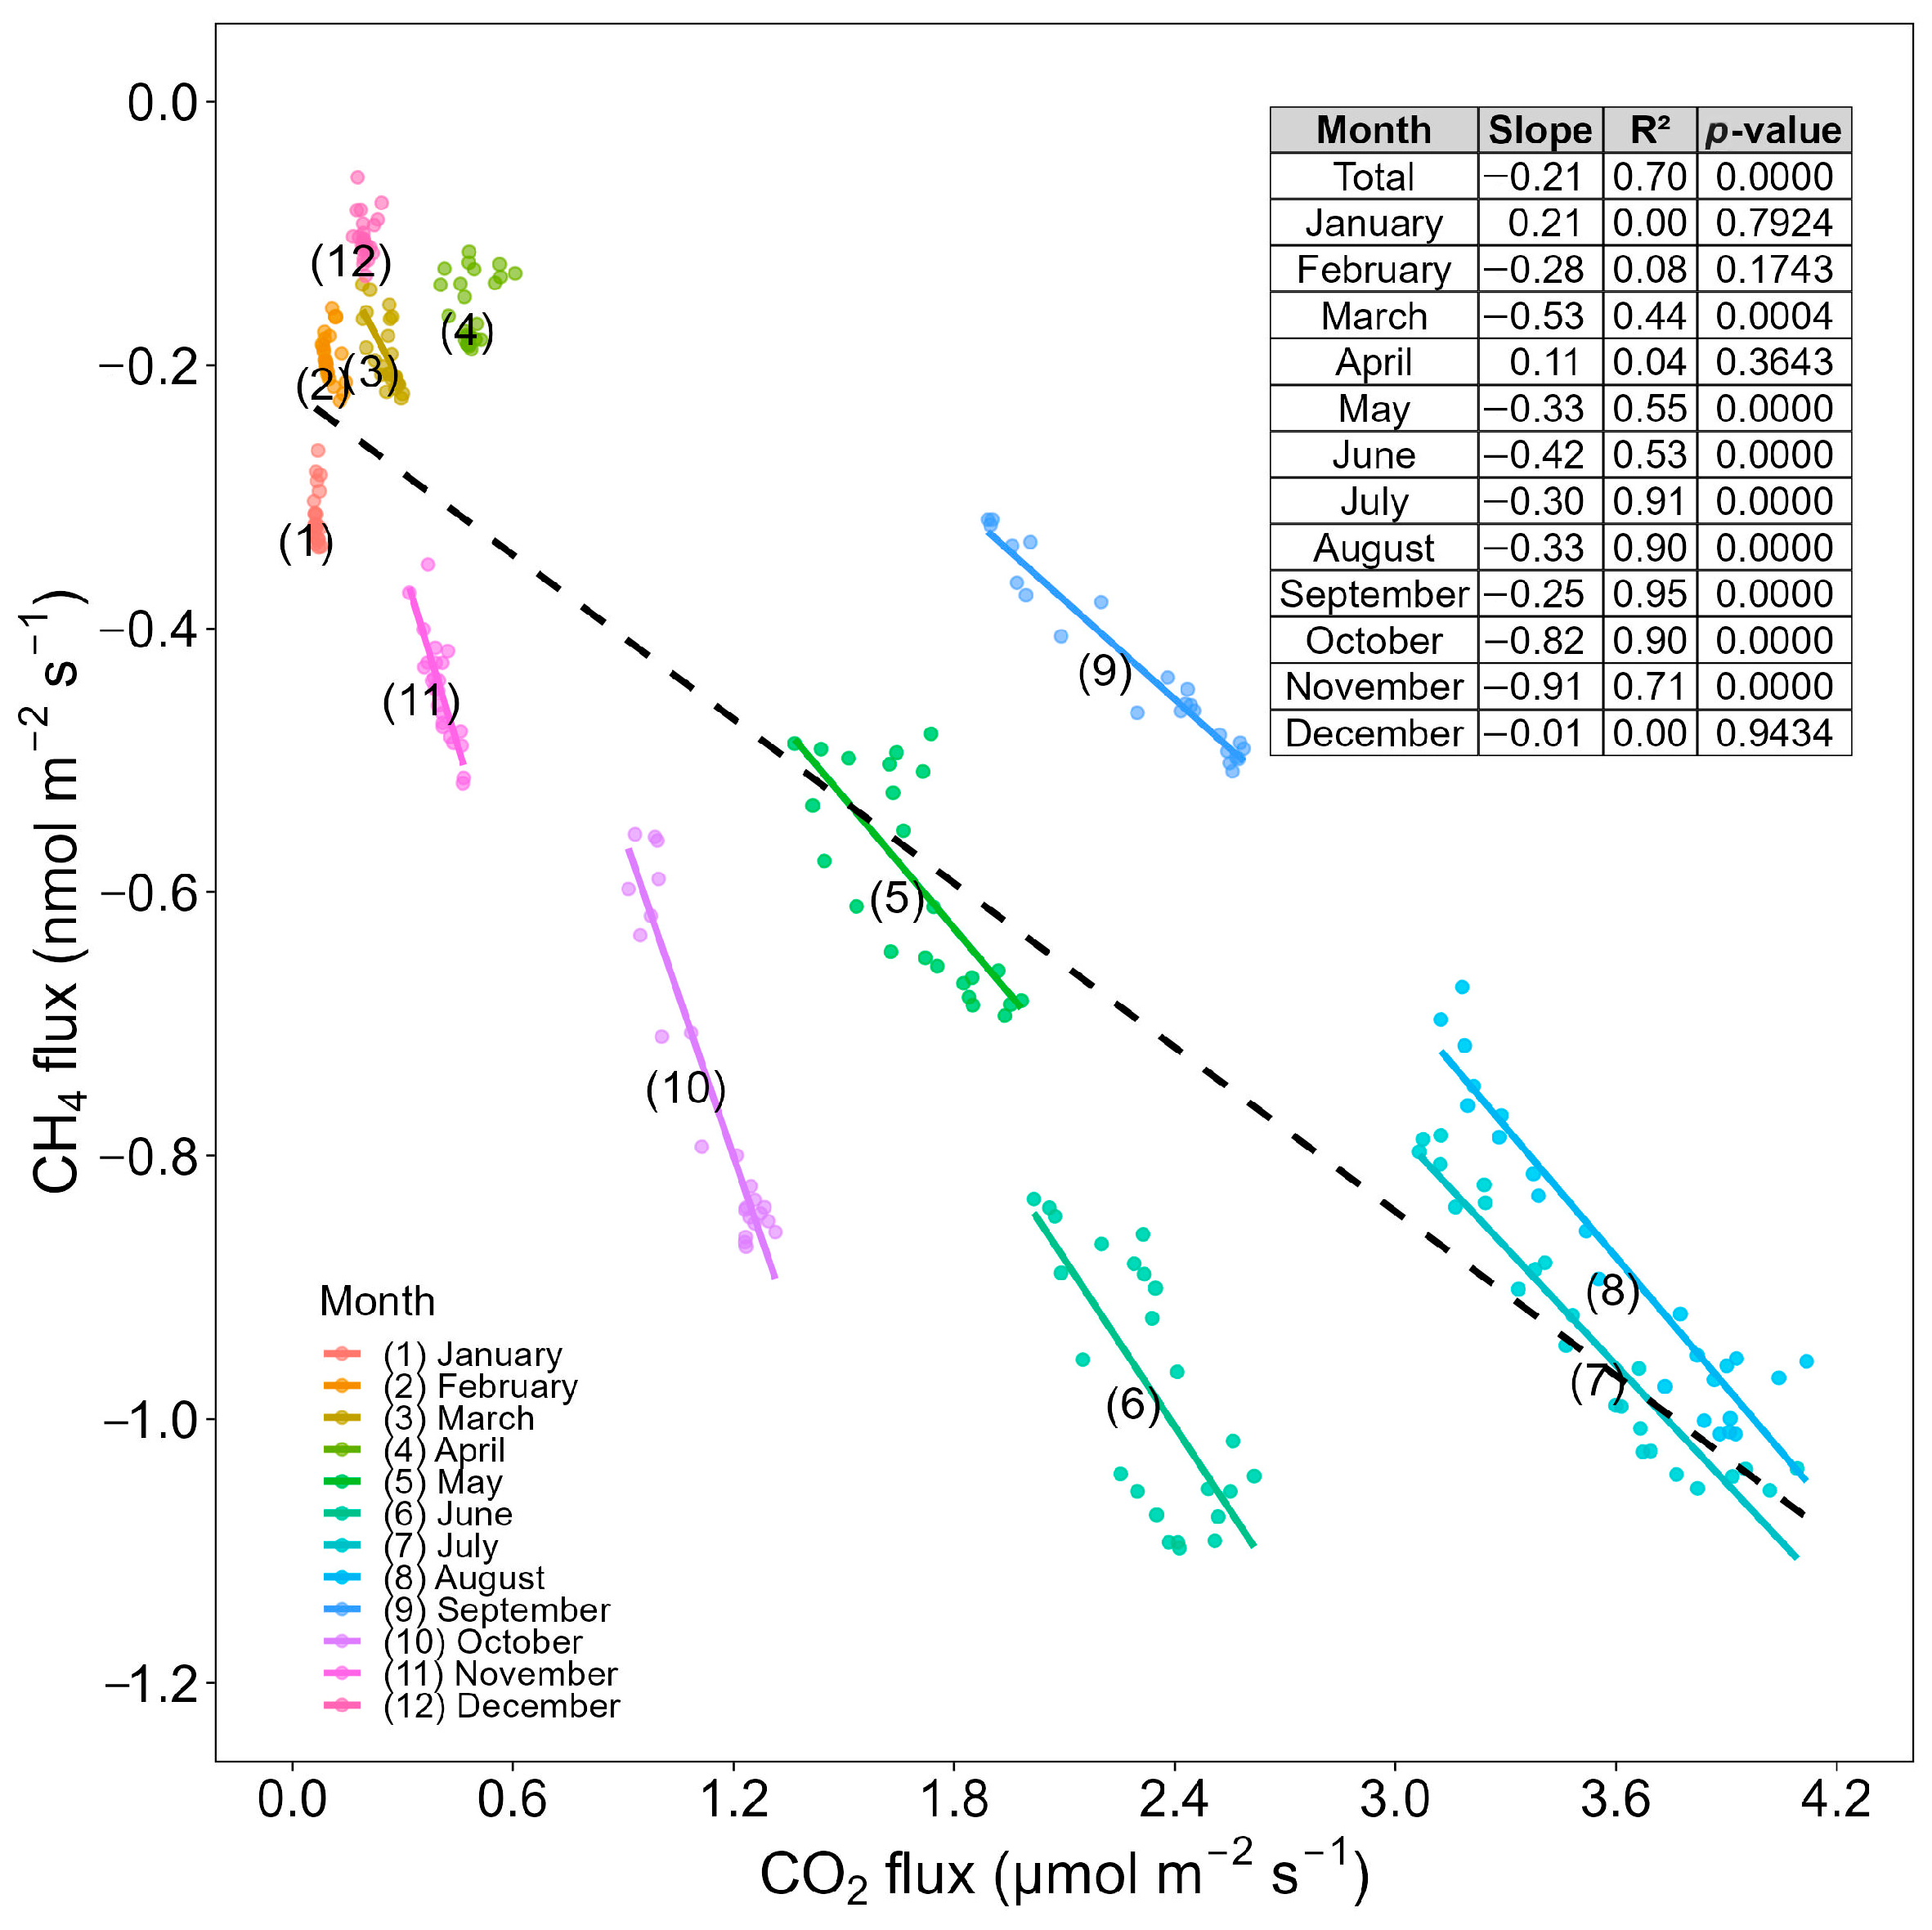
Figure 3 illustrates two distinct coupling regimes between CO2 and CH4 fluxes, where the slope of linear regression quantifies coupling strength/direction and the coefficient of determination (R2) indicates goodness-of-fit: (1) Significant trade-off effects (negative coupling, p < 0.05) were evident in the aggregated annual and monthly data from March to November (except April), with peak correlations observed in October (slope = −0.82, R2 = 0.90) and the July–September period (R2 ≥ 0.90); (2) Decoupled relationships (p > 0.05) were observed in April and from December to February. The persistent annual negative coupling (slope = −0.21, R2 = 0.70, p < 0.0001) indicates a fundamental inverse correlation between these greenhouse gas fluxes throughout the monitoring period.

3.2. Diel Patterns of CO2 and CH4 Fluxes and the Determination of Optimal Sampling Time

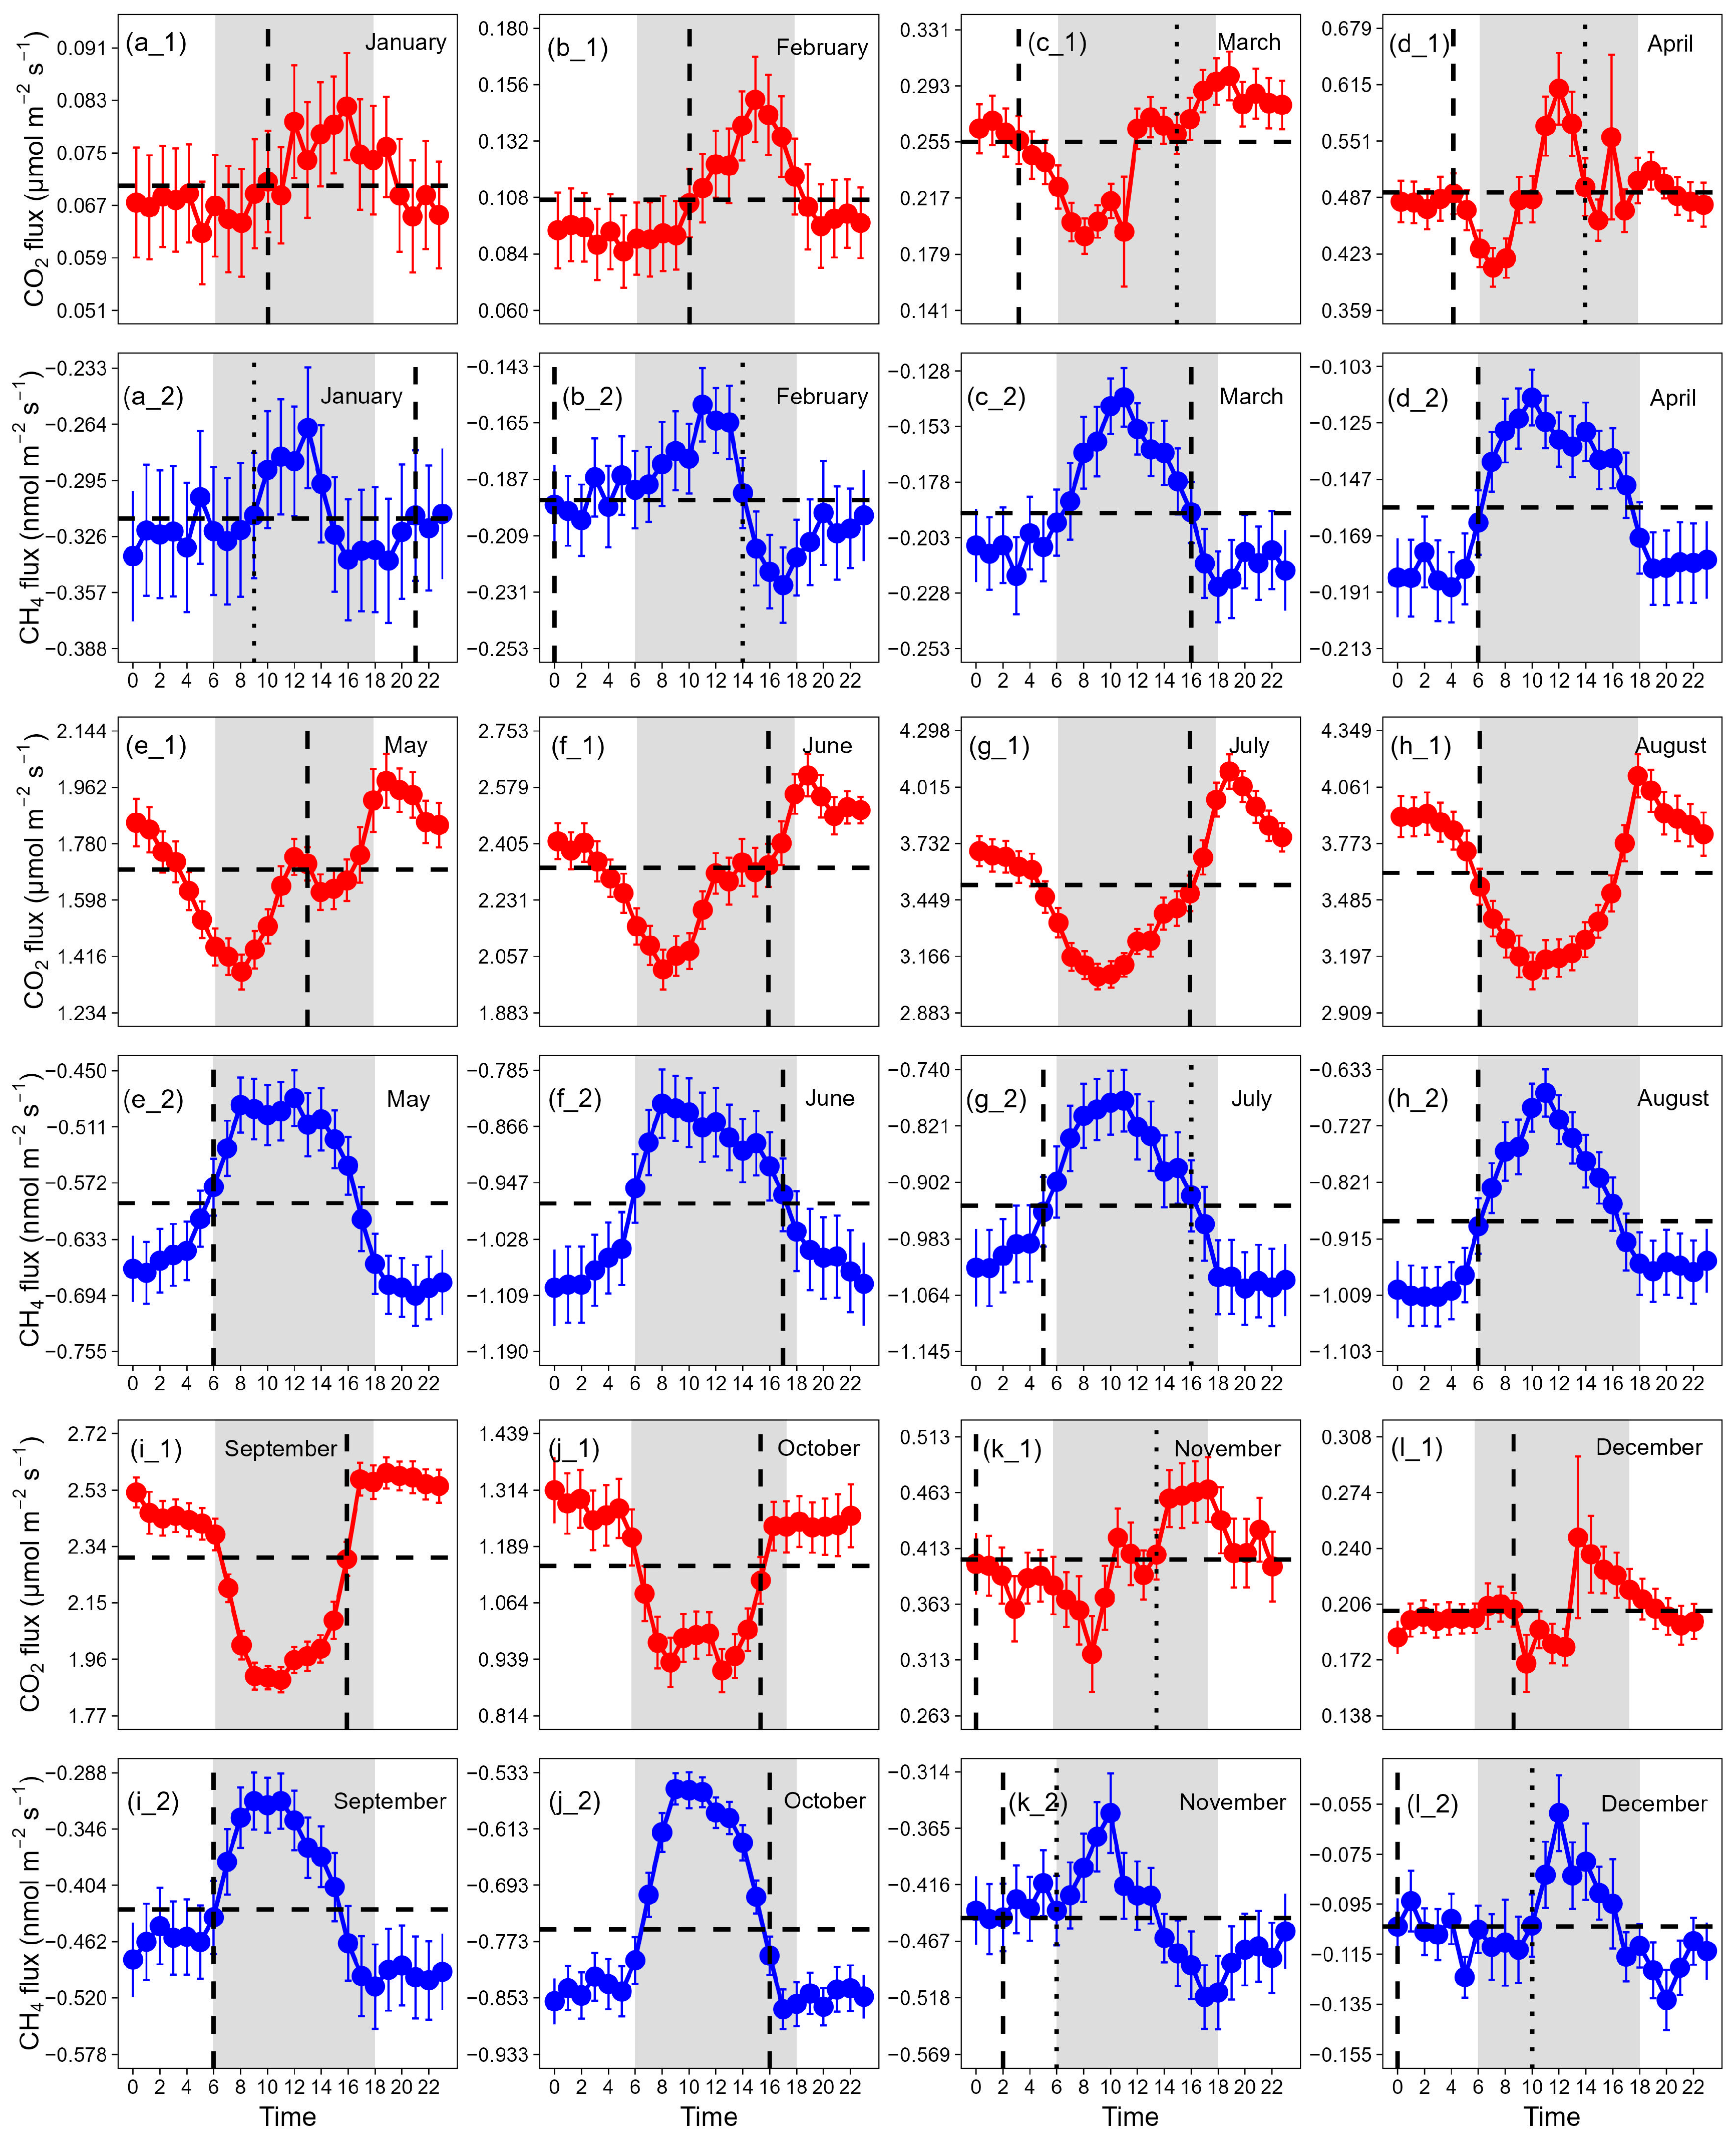
This study identified significant diurnal and seasonal variations in CO2 (net emission) and CH4 (net uptake) fluxes, revealing both shared patterns and unique characteristics (Figure 4). CO2 fluxes exhibited significant diurnal variations, with the most pronounced daily fluctuations occurring during summer (July: 3.06–4.09 μmol m−2 s−1; amplitude 1.03 μmol m−2 s−1) and the lowest flux levels recorded in winter (January: 0.06−0.08 μmol m−2 s−1; amplitude 0.02 μmol m−2 s−1) (Figure 4(a_1,g_1)). Similarly, CH4 uptake displayed a comparable seasonal pattern, with maximal variation in summer (August: −1.01 to −0.67 nmol m−2 s−1; amplitude 0.34 nmol m−2 s−1) and minimal variation in winter (February: −0.23 to −0.16 nmol m−2 s−1; amplitude 0.07 nmol m−2 s−1) (Figure 4(b_2,h_2)). Distinct diurnal patterns were observed for each gas. Both gases exhibited unimodal diurnal patterns during specific periods (CO2: January–February and July–September; CH4: March–October), but diverged in other seasons, with CO2 showing multi-peak fluctuations in spring and autumn (March–June and October–December) and CH4 displaying complex variations in winter (November–February) (Figure 4). The phase of diurnal cycles also differed fundamentally. CO2 fluxes peaked during winter daytime but exhibited enhanced nighttime emissions in warmer months. In contrast, CH4 consistently showed maximal uptake during daytime throughout the year, with reduced uptake at night. The timing of fluxes approaching daily means varied significantly between gases: CO2 peaked in the morning (December–February, August), afternoon (May–July, September–October), or late at night (March–April, November), while CH4 peaked in the morning (April–May, August–September), afternoons (March, June, October), or at night (July, November–February). These behaviors produced contrasting diurnal geometries: a V−shaped curve (with daytime emission troughs) for CO2 versus an inverted V–shaped curve (with daytime peaks) for CH4 (Figure 4).
Nonparametric analyses (Kruskal-Wallis and Wilcoxon tests) at the annual scale revealed marked dissimilarities (p < 0.01) in the diurnal patterns of CO2 and CH4 exchange (Table S1). Specifically, CO2 fluxes exhibited substantially larger variations during daytime compared to nocturnal CH4 fluxes. Methane fluxes also displayed highly significant divergence (p < 0.0001) between 24-h averages and daylight-period means. Monthly analyses (Table S2) indicated that CO2 fluxes exhibited highly significant differences (p < 0.01) in eight months (February–March and May–October), whereas CH4 fluxes displayed significant variations in all months except January and November. The diurnal variation analysis confirmed distinct patterns for both gases (Table S1). For CO2, the most substantial deviations from daily means occurred at 7:00–10:00 and 18:00–19:00, while fluxes during other periods remained relatively stable. Our assessment of daytime periods (6:00, 11:00–17:00) identified 16:00 as the optimal time for CO2 monitoring, as fluxes at this hour were closest to the daily mean (Table 1). For CH4, measurements during the 6:00–7:00 and 15:00–16:00 daytime intervals showed no statistically significant deviation from 24-h average values (Table 1 and Table S1), suggesting these as suitable monitoring windows. Critically, our analysis identifies 16:00 as a uniquely optimal observation time that simultaneously fulfills daily mean representativeness criteria for both CO2 and CH4 fluxes. This singular time point enables the reliable capture of daily mean values for both greenhouse gases, thereby offering a practical strategy to significantly improve the efficiency and accuracy of concurrent flux monitoring programs while reducing sampling effort.
Table 2 demonstrates the significant influence of sampling time on the accuracy of GWP100 estimation. Compared to 24-h continuous measurements, the conventional 9:00−12:00 sampling method significantly underestimated annual GWP100 totals, with CO2 contributions reduced by 10.66% (1681.20 vs. 1881.71 g CO2 eq m−2) and CH4 contributions by 17.20% (5.24 vs. 6.33 g CO2 eq m−2). This systematic underestimation was most pronounced from May to September, peaking in September (16.89% for combined CO2 + CH4), likely due to incomplete capture of diurnal photosynthesis–respiration dynamics. In contrast, the 16:00 single-measurement approach showed excellent accuracy at the annual scale (0.05% deviation) but greater seasonal variability, overestimating fluxes in winter (January: 16.79%; February: 34.59%) while maintaining high accuracy from June to September. A key methodological insight was that CO2 estimates exhibited wider variation than CH4 for both sampling methods. The 9:00–12:00 method showed deviations ranging from −16.91% to 8.97% for CO2 versus −25.11% to −7.56% for CH4, while the 16:00 method ranged from −2.89% to 34.26% for CO2 versus −12.11% to 14.53% for CH4, collectively indicating the greater sensitivity of CO2 fluxes to sampling time. These results confirm the critical impact of sampling strategy on GWP100 accuracy. Whereas 16:00 measurements provide superior annual estimates, their seasonal variability limits their application for seasonal analysis. The 9:00–12:00 method requires systematic calibration due to its consistent underestimation. Therefore, sampling protocols should be selected based on research objectives—whether focusing on annual budgets or seasonal dynamics—with multi-temporal sampling recommended for comprehensive assessments. This work provides critical operational guidelines for optimizing GHG flux monitoring and enhancing the reliability of climate change research.

3.3. Environmental Factors Influencing CO2 and CH4 Emissions

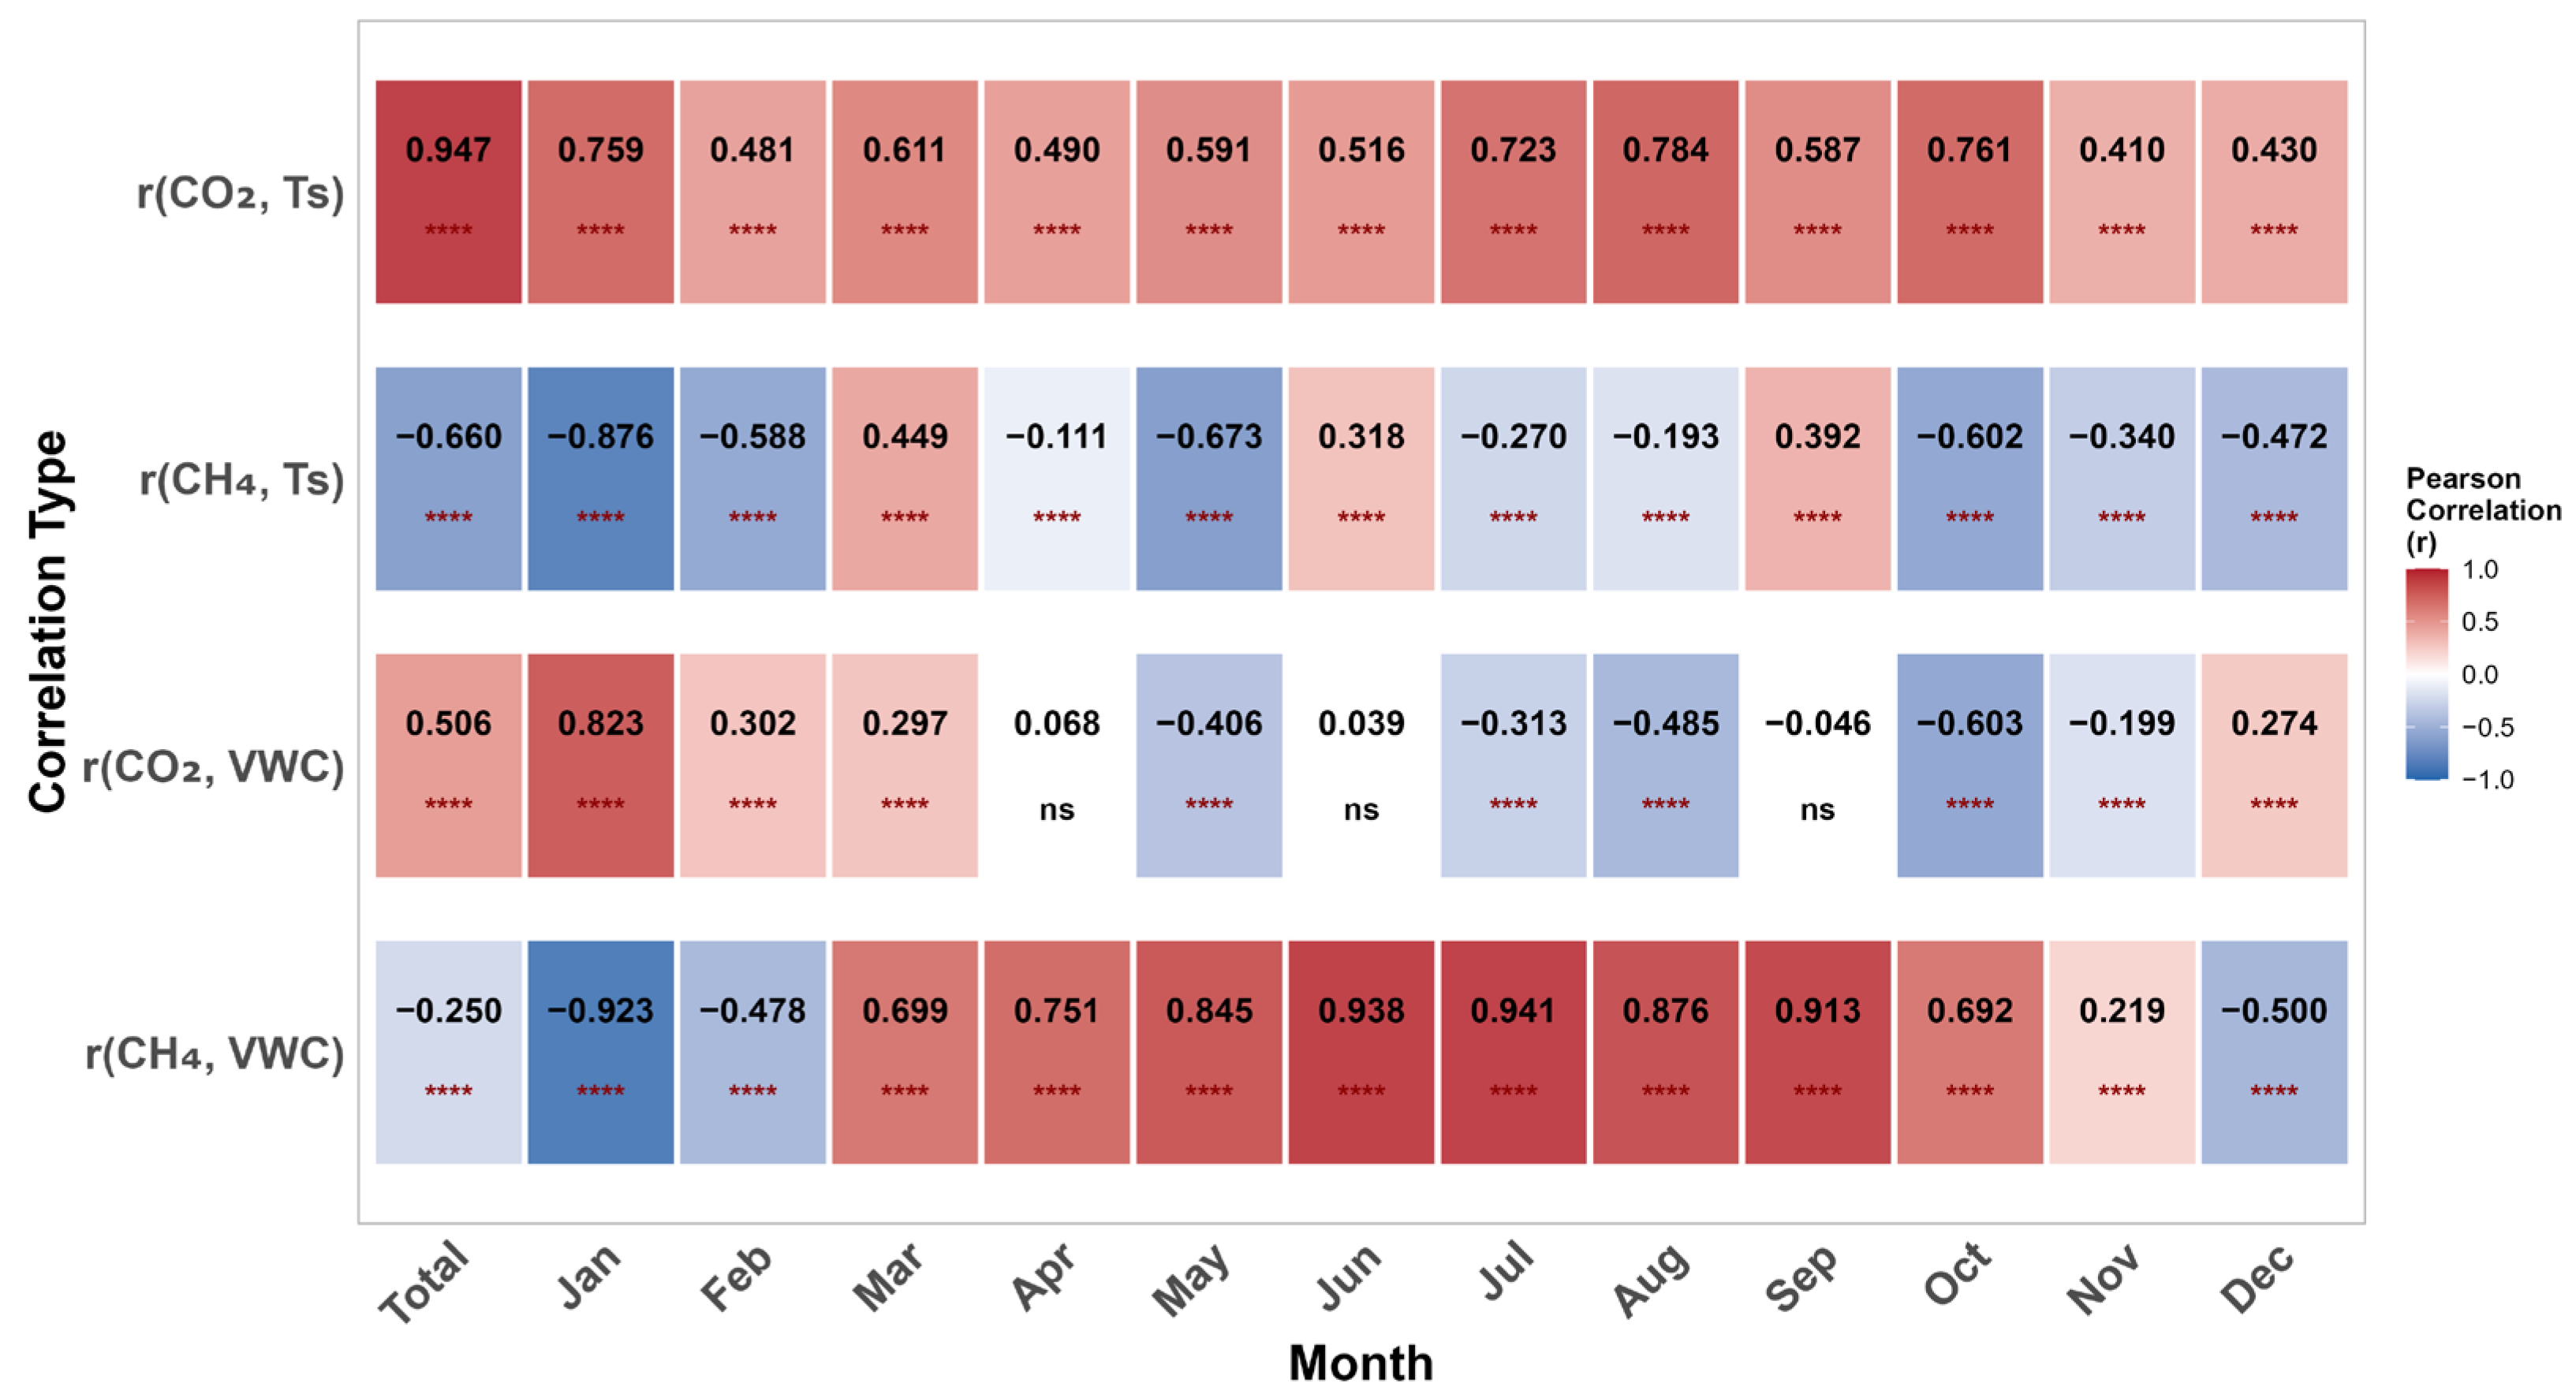
This study systematically investigated the seasonal environmental drivers of soil CO2 and CH4 fluxes using Pearson correlation (Figure 5) and regression analyses (Table 3). The results revealed distinct regulatory patterns for CO2 and CH4 fluxes, with clear seasonal variations in their environmental controls. Based on Pearson correlation analysis, CO2 fluxes were consistently positively correlated with Ts across all months (p < 0.0001; Figure 5). This strong temperature dependence was further confirmed by multiple regression analysis, which revealed significant positive correlations from March to December, with a peak in August (r = 0.784, coefficient = 0.341; Table 3). The effects of VWC exhibited a seasonal reversal: positive correlations with CO2 flux dominated in winter (December–April), while negative effects were predominant during the growing season (except June; Figure 5). Notably, Ts and VWC exhibited a synergistic relationship. Although high temperatures during the growing season were associated with apparent negative VWC–CO2 correlations (Figure 5), the regression analysis that controlled for temperature revealed that VWC promoted emissions (Table 3), indicating that moisture-limiting conditions prevailed under high temperatures. In winter, freeze–thaw cycles mediated a dual regulatory role: short-term stimulation led to positive VWC–CO2 correlations (Figure 5), but moisture ultimately inhibited emissions (February coefficient = −2.142; December coefficient = −0.912; Table 3). This apparent paradox between analytical results reflects time-scale-dependent environmental interactions, whereby short−term (daily) temperature effects mask moisture’s regulatory influence at the seasonal scale. Regression modeling performed best in January (R2 = 0.828) and August (R2 = 0.815), while December exhibited the weakest model fit (R2 = 0.307; Table 3).
CH4 fluxes exhibited pronounced seasonal plasticity, primarily driven by variations in Ts and VWC. Pearson correlation analysis showed that CH4 flux was significantly positively correlated with Ts in March, June, and September (r = 0.449, 0.318, and 0.392, respectively; p < 0.0001) but was inversely related to Ts during the remaining months (most strikingly in January, r = −0.876) and on an annual basis (p < 0.001) (Figure 5). Regression analysis further elucidated these drivers. VWC emerged as a critical modulator, exerting strong positive effects on CH4 flux from March to October (r = 0.692–0.941, p < 0.0001). The correlation peaked in July (r = 0.941), while the maximum regression coefficient was recorded in October (8.510), underscoring the role of anaerobic conditions in methanogenesis (Figure 5, Table 3). Conversely, significant inhibitory effects characterized the winter months, evidenced by a strong negative correlation in January (r = −0.923) and a highly negative coefficient in February (−5.067) (Figure 5, Table 3). Predictive models achieved optimal explanatory power during June to September (R2 > 0.886) (Table 3).
Notably, a bidirectional inhibitory interplay between greenhouse gases was observed (Table 3). CH4 flux exerted a year-round suppressive effect on CO2 efflux, which was most pronounced in July (coefficient = −2.321). Reciprocally, CO2 flux consistently suppressed CH4 uptake, with the strongest inhibition occurring in January (coefficient = −0.968).
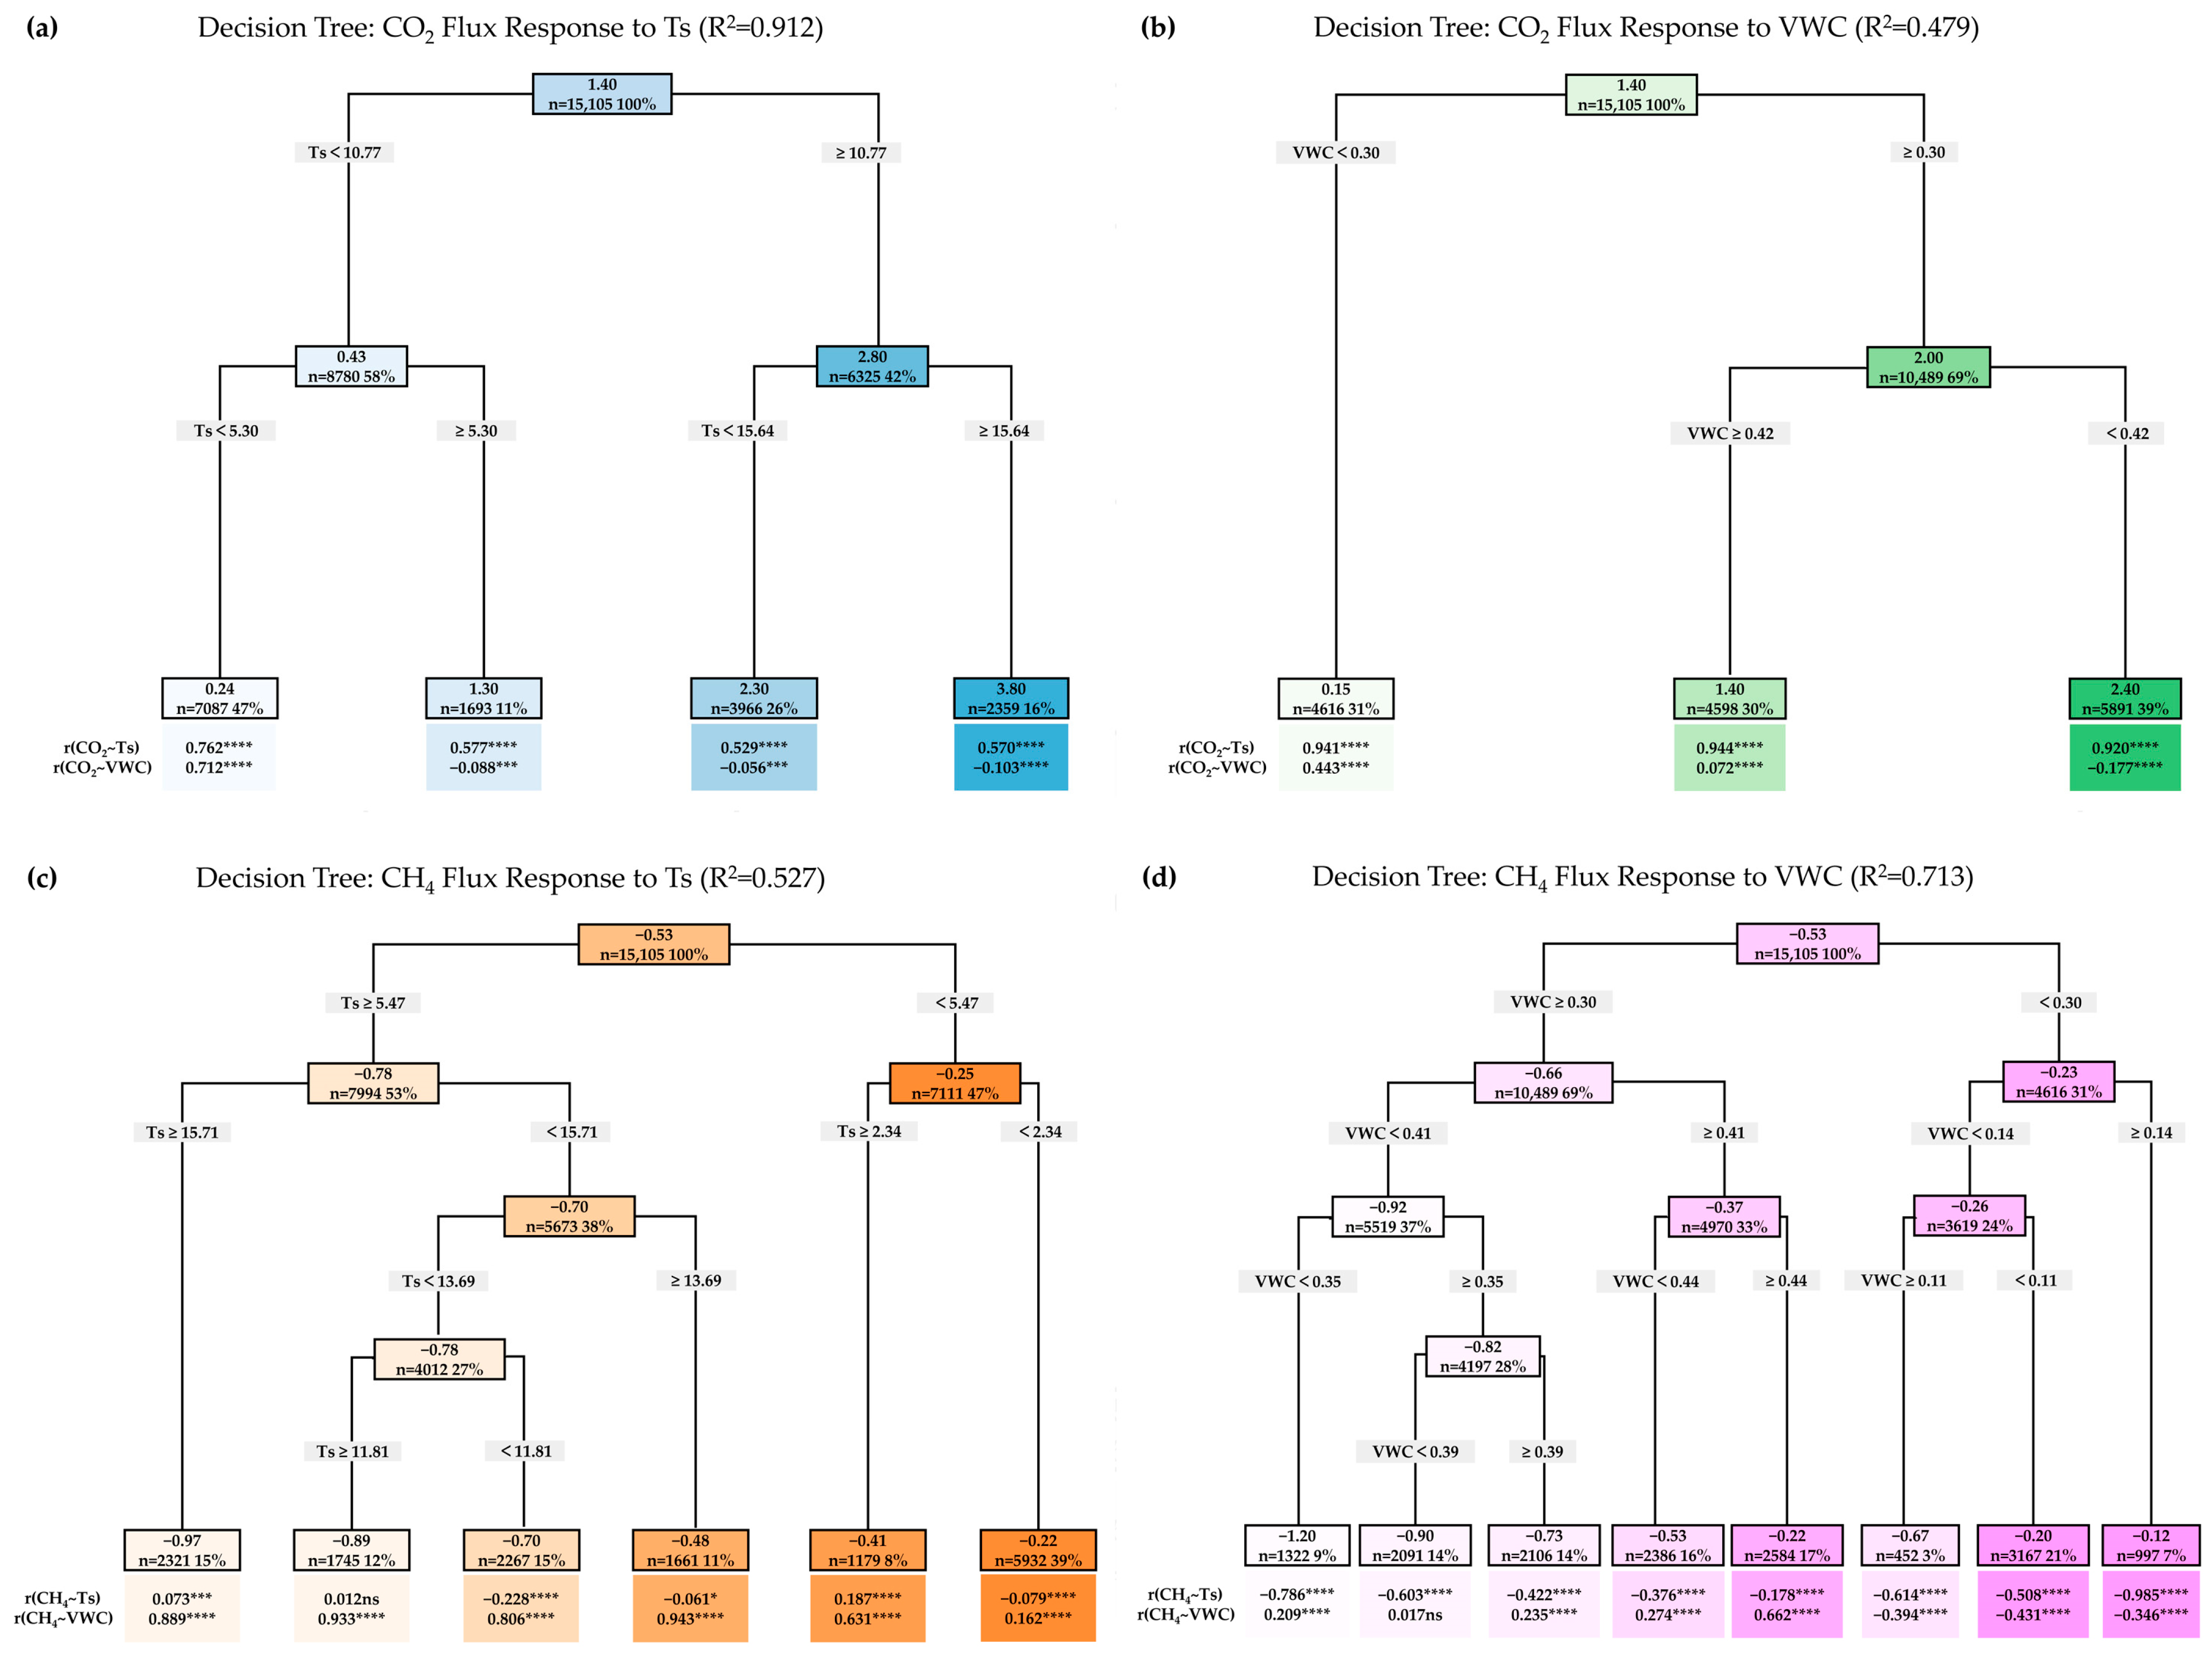
Univariate decision tree analysis revealed threshold response characteristics of soil CO2 and CH4 fluxes to Ts and VWC (Figure 6). For CO2 fluxes, three discrete Ts thresholds were identified at 5.30 °C, 10.77 °C, and 15.64 °C (R2 = 0.912) (Figure 6a). Across Ts gradients, the CO2−VWC correlation shifted from positive at low temperatures (−2.62 to 5.30 °C) to negative at higher temperatures. Two significant VWC thresholds were identified at 0.30 and 0.42 m3 m−3 (R2 = 0.479) (Figure 6b). As VWC increased, CO2 fluxes exhibited robust positive correlations with Ts (r = 0.92–0.94, p < 0.0001) (Figure 6b). CH4 fluxes showed more complex responses, with five Ts thresholds (2.34−15.71 °C, R2 = 0.527) and seven VWC thresholds (0.11–0.44 m3 m−3, R2 = 0.713) (Figure 6c,d). The CH4−Ts correlation alternated between positive and negative with temperature variation, while the positive CH4–VWC correlation strengthened (r = 0.162−0.943), reaching its peak at 13.69−15.71 °C before slightly declining (Figure 6c). With increasing VWC, the CH4-VWC relationship transitioned from a negative to a positive correlation (Figure 6d), indicating weakening negative and strengthening positive correlations. Furthermore, CH4 fluxes maintained negative correlations with Ts that followed a unimodal pattern, with the strongest correlation occurring at intermediate VWC (0.14–0.30 m3 m−3; r = −0.985, p < 0.0001) (Figure 6d).

4. Discussion

4.1. Diurnal and Seasonal Characteristics of CO2 and CH4 Emissions

Our investigation demonstrated distinct temporal variations in CO2 and CH4 exchange dynamics across the monitored ecosystem. CO2 emissions showed strong seasonal variability, peaking at 1.03 μmol m−2 s−1 in summer (July) and reaching minimal levels of 0.02 μmol m−2 s−1 in winter (January). Similarly, CH4 uptake exhibited maximum absorption rates of 0.34 nmol m−2 s−1 in summer (August) and minimum values of 0.07 nmol m−2 s−1 in winter (February), consistent with established patterns in temperate forest ecosystems [47,48,49]. Comparative analysis of seasonal contributions revealed distinct patterns. The winter period (December–February) accounted for only 2.33% of annual CO2 flux, significantly lower than the 5–10% reported for temperate deciduous forests in the U.S. [47], while the CH4 uptake proportion (10.19%) was consistent with literature values (10–15%). For extended dormant seasons, our measurements (6.37% CO2 and 20.75% CH4 for November–March; 9.35% CO2 and 23.33% CH4 for November–April) showed lower CO2 contributions and CH4 uptake at the lower end of the reported range. Specifically, European beech forests showed higher dormant season (November–March) contributions for both CO2 (16.4%) and CH4 (21.4–31.6%) [48], while broadleaf-Korean pine forests in northeastern China showed intermediate values (9.6–11.4% for CO2 and 27.4–40.5% for CH4 during November–April) [3]. Furthermore, the observed CH4 uptake (16.03–36.13%) exhibited greater spatial and temporal variability compared to Chinese (<20%) [25] and Swiss subalpine (14.4–18.4%) [49] forest sites. Diurnal flux patterns revealed contrasting behaviors: CO2 exhibited V-shaped variations with daytime minima, characterized by winter daytime peaks and enhanced summer nighttime emissions, while CH4 exhibited inverted V-shaped patterns with daytime absorption minima. A notable finding was the strengthened coupling between CO2 and CH4 during the seasonal transition (September to October), with the regression slope increasing from −0.25 to −0.82. This enhanced coupling resulted from synergistic environmental controls: declining October temperatures suppressed soil respiration (reducing CO2 emissions), while September-accumulated soil moisture sustained anaerobic conditions for CH4 production [16], creating a “cooling-inhibits-CO2, wetness-promotes-CH4” pattern that reflects alternating temperature-moisture dominance [25]. Additionally, the convergence of diurnal phases of both gases in October synchronized their inverse diurnal variations, thereby intensifying their statistical coupling. A focused comparison during the summer months (July–September) revealed key differences from previous temperate forest studies: (1) unlike reports of no significant diurnal pattern for CH4 flux [25], our data showed pronounced unimodal diurnal variation (Figure 4(g_2–i_2)); (2) in contrast to the CO2 flux pattern observed at Harvard Forest with peaks at 14:00–16:00 [50], our site exhibited a characteristic V-shaped curve with suppressed daytime and enhanced nighttime emissions (Figure 4(g_1–i_1)). These discrepancies likely reflect fundamental differences in carbon cycling processes across forest types and environmental conditions. Our findings suggest that climate warming could substantially alter non-growing season carbon flux contributions, highlighting the need for continued monitoring.

4.2. Optimal Sampling Time for CO2 and CH4 Fluxes

We found that the optimal timing for flux observations varied considerably across studies. The Harvard Forest study recommended 10:00–14:00 [50], while global analyses advocated 10:00 measurements [44], and China’s Qinling Temperate Forest used traditional 9:00–12:00 sampling [39,51]. Our data showed 16:00 sampling yielded minimal deviations from daily means (0.05% for CO2, 0.02% for CH4). In contrast, conventional 9:00–12:00 sampling [3,39,51] systematically underestimated GWP, with deviations up to 10.66% for CO2 and 17.20% for CH4, peaking at 16.89% in September. Seasonal analysis further showed that the conventional morning sampling technique accounted for 10.22% of the aggregate annual GWP during the non-growing season, while the 16:00 method estimated 10.58%, which was closely comparable to the measured value of 9.31%, indicating slight overestimation in the afternoon sampling. This suggests that while 16:00 sampling provides superior annual estimates, it may slightly overestimate non-growing season contributions. Traditional low-frequency manual sampling may introduce annual cumulative flux deviations of ±19% [25], underscoring the necessity for optimized sampling strategies. Considering operational feasibility and data accuracy, we recommend: (1) a single 16:00 sampling for annual studies, and (2) multi-temporal sampling for seasonal dynamics studies, especially given CO2 fluxes’ time-sensitive biases (up to 34.26%). We also recommend consulting high-frequency monitoring data [25,49]. Winter observations (January–February) require caution due to 16:00 method overestimations (16.79–34.59%). These findings support a flexible flux-monitoring framework, allowing researchers to optimize time windows, frequencies, and tools based on study objectives.

4.3. Driving Factors and Correlation Mechanisms of CO2 and CH4 Emissions

We elucidated distinct seasonal patterns and differential regulatory mechanisms of soil-atmosphere CO2 and CH4 exchange dynamics in temperate forest ecosystems. Ts and moisture (VWC) significantly modulated seasonal variations in both CO2 and CH4 fluxes [52]. Minimum fluxes for both gases occurred during January–February, coinciding with minimal Ts and VWC levels, while peak fluxes occurred in July–August under maximum Ts and VWC conditions. Using univariate decision tree analysis, we characterized threshold responses of soil CO2 and CH4 fluxes to Ts and VWC. Our findings generally align with previous studies, though with some specific differences. We observed a consistent, significant positive correlation between CO2 fluxes and Ts throughout the year, consistent with findings from Harvard Forest and temperate montane beech forests [48,49,50]. Specifically, CO2 fluxes showed distinct Ts thresholds at 5.30, 10.77, and 15.64 °C, which fall within the established critical range (5–15 °C) for soil respiration [53].
Soil moisture differentially affected the two greenhouse gases. CO2 fluxes exhibited distinct seasonal reversals in moisture response, while CH4 fluxes showed stronger moisture sensitivity [25,50]. Our analysis identified two critical VWC thresholds (0.30 and 0.42 m3 m−3). To interpret these thresholds, we reference the concept of water-filled pore space (WFPS), which represents the proportion of soil pore volume occupied by water and directly regulates gas diffusion and microbial activity. Moderate moisture (40–70% WFPS) optimizes CO2 emissions through balanced water-oxygen availability [54]. Soil respiration peaked at moderate moisture but declined under drought or waterlogging, consistent with incubation study results [55]. During the growing season, CH4 fluxes showed a strong positive correlation with VWC, supporting previous reports of high humidity suppressing methane oxidation [25,50]. In contrast, winter exhibited distinct regulatory patterns: CH4 fluxes showed a strong negative correlation with VWC, while CO2 fluxes maintained a positive correlation. These divergent responses indicate differential freeze–thaw effects on microbial communities [25]. Mechanistically, elevated soil moisture restricts oxygen diffusion, thereby reducing the temperature sensitivity of microbial respiration, as quantified by the Q10 factor (the factor by which the reaction rate increases with a 10 °C temperature rise) [56,57]. Below 0.25 m3 m−3 VWC (60% WFPS), aerobic respiration dominates (>85% of CO2 emissions). Conversely, above 0.40 m3 m−3 VWC (90% WFPS), methanogenesis increases CH4 emissions by 3–5 fold [57]. This dichotomy reveals a critical VWC threshold regulating CH4 fluxes: negative correlations in dry soils (due to aerobic suppression of methanogens/oxidation) versus positive correlations in waterlogged soils (due to anaerobic stimulation of methanogenesis). The strongest inverse correlation between CH4 flux and Ts (r = −0.985) occurred at intermediate VWC, indicating optimal methane-oxidizing bacteria activity in balanced oxygen-moisture conditions [58,59]. These results highlight complex Ts–VWC interactions regulating greenhouse gas fluxes with distinct seasonal dynamics.
Our decision tree analysis provides compelling evidence that CO2 and CH4 fluxes are interactively regulated by Ts and VWC—a relationship that transcends simple linear correlations. The interdependent nature of their effects is demonstrated by the presence of multiple significant thresholds for each (Figure 6), revealing how the influence of one factor is conditional upon the state of the other. For CO2, the correlation with VWC shifts from positive at low temperatures to negative at high temperatures (Figure 6a,b), indicating that warming can exacerbate the inhibitory effect of water stress on microbial respiration. For CH4, the thermal response of methane oxidation is strongly modulated by soil moisture, as evidenced by the complex pattern of multiple Ts and VWC thresholds. These findings align with established knowledge that the temperature sensitivity of heterotrophic soil respiration is modulated by soil moisture [55]. This sensitivity is part of a broader complex interplay further shaped by oxygen availability and microbial activity. The non-linear response of biological processes to moisture availability, governed by specific thresholds [56], is a recurring ecosystem pattern, as similarly observed in other systems, such as Sphagnum mosses, whose photosynthetic recovery from drought is constrained by species-specific moisture thresholds. In summary, the threshold-based interactions revealed by our analysis provide a mechanistically explicit understanding of the coupled Ts–VWC regulatory system governing both gases.
Flux coupling analysis revealed consistent negative correlations between CO2 emissions and CH4 uptake from March to November (excluding April), with peaks in October and July–September, reflecting synchronized microbial-mediated gas dynamics [50]. It is important to note that while this aerobic negative correlation is notable, it mainly occurs in well-drained temperate forests with moderate to low nitrogen availability [47,60], as ecosystem type strongly modulates these interactions [61]. The response is driven by the coordinated activity of aerobic microbes, including methanotrophs, to common environmental factors. The consistent inverse flux relationship across years is consistent with observations in grasslands, alpine meadows, and other forests [30,62,63], though it is absent in temperate montane beech forests [48]. A seasonal divergence emerged: growing-season coupling reflects microbial processes, whereas winter exhibits diminished biological activity and stronger abiotic regulation. Soil moisture plays a primary regulatory role. Under waterlogged or saturated conditions, anaerobic environments suppress aerobic respiration and stimulate methanogenesis, thereby reversing the CO2–CH4 relationship from negative to positive [47,64]. Freeze–thaw cycles are another key driver of spring and winter decoupling [20,65]. During these periods, the release of dissolved organic carbon (DOC) can enhance heterotrophic respiration, leading to CO2 spikes [41,65], while concurrently inhibiting the activity of methane monooxygenase [41]. The lag in CH4 uptake is primarily attributable to three factors: (1) limited O2 diffusion under high moisture conditions following thawing [20,66], where a drop in O2 below 5% leads to complete cessation of CH4 oxidation and a 60% decline in CO2 emissions [47]; (2) slower reactivation of methanotrophs compared to respiratory bacteria [20,47]; and (3) greater low-temperature adaptation of methanotrophs relative to methanogenic archaea [60,66,67]. Nitrogen also plays a critical role: elevated levels promote nitrite-dependent anaerobic methane oxidation (n-DAMO), consuming CH4 and producing CO2, resulting in a positive correlation [68]. A structural equation model confirmed that soil NO3 modulates both CO2 (λ = 0.51) and CH4 (λ = −0.39) fluxes via n-DAMO [68].
In summary, a three-tier regulatory system modulates greenhouse gas fluxes via the interactive effects of temperature, moisture, and gas diffusion. CO2 flux is predominantly driven by temperature, with soil water availability acting as the primary constraint in summer, while freeze–thaw cycles dominate flux dynamics in winter. CH4 production requires anaerobic conditions and exhibits seasonal temperature sensitivity, increasing in summer and decreasing in winter, which reflects microbial community adaptation. The antagonistic relationship between CO2 and CH4 fluxes varies seasonally, indicating regulation by processes such as substrate competition and microbial interactions. These mechanisms refine our ability to predict carbon–climate feedback and establish the CO2–CH4 flux relationship as a dynamic indicator of carbon cycle activity and redox state. Future work should develop multi-biome networks integrating functional gene assays (targeting pmoA/mcrA) and continuous redox monitoring to elucidate mechanisms and system-specific applications [61].

4.4. Mechanisms Underlying Differences in Temporal Variability Between CH4 and CO2 Fluxes

The greater temporal variability in CH4 versus CO2 fluxes—evident in their diel patterns, complex environmental responses, and predictive relationships—stems from fundamental differences in their biogeochemical processes. This observation is consistent with the recognized dynamic nature of soil methane cycling and can be explained by two interrelated mechanisms. First, CH4 fluxes display a more sensitive, nonlinear, and “switch-like” response to environmental drivers. Our decision-tree analysis (Figure 6) identified a multi-threshold response pattern for CH4, which functions analogously to a sensitive switch. This mechanistic insight suggests that even minor moisture fluctuations, such as those caused by altered precipitation patterns [41], can trigger sharp transitions between net CH4 uptake and emission. This phenomenon is attributable to the established role of soil moisture as the primary control on CH4 dynamics [20]. In contrast, CO2 fluxes respond to moisture variations more gradually and continuously, reflecting a direct dependence on metabolic rates that exhibit greater stability during abrupt environmental perturbations. Second, the microbial foundations and their interactions with plant activity differ fundamentally between the two gas fluxes. CH4 uptake relies on highly specialized methanotrophs, whose activity depends critically on oxygen diffusion through soil pores and is strongly modulated by plant-mediated rhizosphere processes [45]. In contrast, CO2 production originates from respiratory processes in roots and a diverse heterotrophic microbial community, which constitutes a more buffered and functionally redundant system. Furthermore, methanotrophs reactivate and recover more slowly than general heterotrophic microorganisms following disturbances such as rainfall events [41], thereby further destabilizing the CH4 sink. Collectively, the interplay between these specialized microorganisms and dynamic plant-soil processes explains the more pronounced hysteresis and fluctuations in CH4 fluxes following disturbances. This inherent microbial and physiological instability amplifies the disparity in temporal variability between the two gases, thereby fundamentally limiting the accuracy of CH4 flux predictions at fine temporal scales.

4.5. Research Perspectives

This study offers mechanistic insights into the temporal dynamics of greenhouse gas fluxes, although its findings are subject to several limitations. First, the logistical constraints of operating our automated chamber system, which required a continuous power supply, necessitated the concentration of measurements within a single, representative plot. While this design was optimal for achieving high-temporal-resolution monitoring and process-based investigation, it limits the spatial representativeness of our absolute flux values for the entire forest landscape. Future studies would benefit from distributed sampling designs to capture broader spatial heterogeneity. Beyond this spatial limitation, our understanding of the underlying biogeochemical mechanisms is constrained by insufficient data on microbial community structure, key functional genes (e.g., pmoA, mcrA), and other potential drivers. Previous studies have demonstrated that microbial biomass [65], root activity [66], and snow cover [12,64] play critical roles in regulating CO2 and CH4 fluxes; however, these factors were not measured and thus not within the scope of the present analysis. Moreover, the use of only single-site and single-year (2016) data limits the exploration of interannual variability and broader applicability. Future work should establish cross-ecosystem, multi-year observation networks to concurrently monitor environmental variables (e.g., soil temperature, moisture, redox potential, snow dynamics) and biological factors (e.g., microbial biomass, community composition, root activity), alongside flux measurements. Such multi-year datasets are crucial for examining how interannual climate variation shapes flux–environment relationships. More attention should also be given to interactive controls—such as how snow cover affects freeze–thaw cycles and microbial activity during winter carbon release [12,64], or how root exudates and microbial functional communities collectively influence CH4 uptake [66]. Further microbial investigations should quantify key functional genes related to methane oxidation and production to clarify the roles of aerobic and n-DAMO pathways [68]. Finally, integrating such multi-source, long-term datasets with process-based models will improve the representation of non-growing season processes, microbial mechanisms, and multi-factor interactions, thereby enhancing predictive capability under diverse climates and ecosystems. These integrated approaches will advance systematic understanding of multi-scale drivers of greenhouse gas fluxes, ultimately helping to explain interannual dynamics and ecosystem differences and supporting more reliable Earth system models.

5. Conclusions

Based on long-term monitoring in a temperate forest, this study reveals a tripartite regulatory mechanism governing soil CO2 and CH4 fluxes through interactions among temperature, VWC, and gas dynamics. CO2 fluxes were primarily driven by temperature but also modulated by VWC, which acted as a limiting factor during summer drought and was found to enhance emissions during winter freeze–thaw cycles. A temperature-sensitive carbon release threshold was also identified. CH4 uptake showed strong dependence on VWC during the growing season, while its temperature response shifted seasonally, being positive in summer and negative in winter, suggesting adaptation of methanotrophic communities. A persistent antagonistic interaction between the two gases exhibited seasonal asynchrony, pointing to possible substrate competition or microbial cross-regulation. Decision-tree analysis identified multiple environmental thresholds: CO2 responded to three temperature thresholds, ranging from 5.30 to 15.64 °C, and two VWC thresholds, between 0.30 and 0.42 m3 m−3. CH4 was influenced by five temperature thresholds, from 2.34 to 15.71 °C, and seven VWC thresholds, spanning 0.11 to 0.44 m3 m−3. The strongest anticorrelation between CH4 and temperature occurred at intermediate VWC levels, specifically between 0.14 and 0.30 m3 m−3, with a correlation coefficient of −0.985, highlighting the role of VWC in mediating metabolic shifts. Diurnal variability peaked in summer, and 16:00 was identified as the optimal sampling time for estimating daily mean fluxes. This time point minimized annual bias to just 0.05%, in contrast to conventional morning sampling (9:00–12:00), which underestimated annual emissions by 10.66% for CO2 and 17.20% for CH4. Higher variability in winter necessitates a sampling strategy tailored to the specific temporal scope of the investigation, whether aimed at annual or seasonal estimates. These findings establish a mechanistic framework for understanding nonlinear soil carbon–climate feedback. The thresholds and temporal dynamics identified here contribute to refined greenhouse gas monitoring protocols and improved parameterization of process-based models, thereby enhancing predictive accuracy of carbon cycling in temperate forests under climate change.

Supplementary Materials

The following supporting information can be downloaded at: https://www.mdpi.com/article/10.3390/atmos16121326/s1, Table S1. Differences in CO2 and CH4 fluxes between daily averages (full-day) vs. day-time/nighttime values and hourly vs. daily averages (0−23) at the annual scale (Kruskal–Wallis and Wilcoxon tests); Table S2. Monthly differences in CO2 and CH4 fluxes between daily averages (full-day) and day-time/nighttime values (Kruskal–Wallis and Wilcoxon tests).

Author Contributions

Conceptualization, L.Z. and C.G.; methodology and software, C.G. and F.K.; resources and supervision, S.L.; project administration and funding acquisition, L.Z.; data curation, C.G. and L.Z.; formal analysis and writing—original draft preparation, C.G. and F.K.; writing—review and editing, L.Z., S.L. and F.K. All authors have read and agreed to the published version of the manuscript.

Funding

This research was supported by the National Natural Science Foundation of China (grant numbers 42301348, 32171560, 42141005).

Institutional Review Board Statement

Not applicable.

Informed Consent Statement

Not applicable.

Data Availability Statement

The data supporting this study are available from the corresponding author upon reasonable request.

Acknowledgments

The authors gratefully acknowledge Haoyu Deng (Key Laboratory of Land Surface Pattern and Simulation, Institute of Geographic Sciences and Natural Resources Research, Chinese Academy of Sciences, Beijing 100101, China; denghy@igsnrr.ac.cn) for his assistance in securing funding (National Natural Science Foundation of China, grant number 42301348) and for his contributions to the preparation of the manuscript, including writing, language editing, and proofreading.

Conflicts of Interest

The authors declare no conflicts of interest.

References

  1. IPCC. Summary for policymakers. In Climate Change 2021: The Physical Science Basis. Contribution of Working Group I to the Sixth Assessment Report of the Intergovernmental Panel on Climate Change; Masson-Delmotte, V.P., Pirani, Z.A., Connors, S.L., Péan, C., Berger, S., Caud, N., Chen, Y., Goldfarb, L., Gomis, M.I., Huang, M., et al., Eds.; Cambridge University Press: Cambridge, UK, 2021. [Google Scholar]
  2. Lal, R. Forest soils and carbon sequestration. For. Ecol. Manag. 2005, 220, 242–258. [Google Scholar] [CrossRef]
  3. Xu, X.; Xu, T.; Yue, J. Effect of In Situ Large Soil Column Translocation on CO2 and CH4 Fluxes under Two Temperate Forests of Northeastern China. Forests 2023, 14, 1531. [Google Scholar] [CrossRef]
  4. Zhou, Y.; Hagedorn, F.; Zhou, C.; Jiang, X.; Wang, X.; Li, M.-H. Experimental warming of a mountain tundra increases soil CO2 effluxes and enhances CH4 and N2O uptake at Changbai Mountain, China. Sci. Rep. 2016, 6, 21108. [Google Scholar] [CrossRef]
  5. Guo, C.Y.; Zhang, L.M.; Li, S.G.; Chen, Y.X. Freeze-Thaw Events Change Soil Greenhouse Gas Fluxes Through Modifying Soil Carbon and Nitrogen Cycling Processes in a Temperate Forest in Northeastern China. Forests 2024, 15, 2082. [Google Scholar] [CrossRef]
  6. Guo, C.Y.; Zhang, L.M.; Li, S.G.; Li, Q.K.; Dai, G.H. Comparison of Soil Greenhouse Gas Fluxes during the Spring Freeze-Thaw Period and the Growing Season in a Temperate Broadleaved Korean Pine Forest, Changbai Mountains, China. Forests 2020, 11, 1135. [Google Scholar] [CrossRef]
  7. Yu, L.J.; Huang, Y.; Zhang, W.; Li, T.T.; Sun, W.J. Methane uptake in global forest and grassland soils from 1981 to 2010. Sci. Total Environ. 2017, 607, 1163–1172. [Google Scholar] [CrossRef]
  8. Ni, X.Y.; Groffman, P.M. Declines in methane uptake in forest soils. Proc. Natl. Acad. Sci. USA 2018, 115, 8587–8590. [Google Scholar] [CrossRef] [PubMed]
  9. Sha, L.; Teramoto, M.; Noh, N.J.; Hashimoto, S.; Yang, M.; Sanwangsri, M.; Liang, N. Soil carbon flux research in the Asian region: Review and future perspectives. J. Agric. Meteorol. 2021, 77, 24–51. [Google Scholar] [CrossRef]
  10. Heinzle, J.; Kitzler, B.; Zechmeister-Boltenstern, S.; Tian, Y.; Kengdo, S.K.; Wanek, W.; Borken, W.; Schindlbacher, A. Soil CH4 and N2O response diminishes during decadal soil warming in a temperate mountain forest. Agric. For. Meteorol. 2023, 329, 109287. [Google Scholar] [CrossRef]
  11. Martins, C.S.C.; Nazaries, L.; Delgado-Baquerizo, M.; Macdonald, C.A.; Anderson, I.C.; Hobbie, S.E.; Venterea, R.T.; Reich, P.B.; Singh, B.K. Identifying environmental drivers of greenhouse gas emissions under warming and reduced rainfall in boreal-temperate forests. Funct. Ecol. 2017, 31, 2356–2368. [Google Scholar] [CrossRef]
  12. Natali, S.; Watts, J.; Rogers, B.; Potter, S.; Ludwig, S.; Selbmann, A.; Sullivan, P.F.; Abbott, B.W.; Arndt, K.A.; Birch, L.; et al. Large loss of CO2 in winter observed across the northern permafrost region. Nat. Clim. Change 2019, 9, 852–857. [Google Scholar] [CrossRef]
  13. Luo, G.J.; Kiese, R.; Wolf, B.; Butterbach-Bahl, K. Effects of soil temperature and moisture on methane uptake and nitrous oxide emissions across three different ecosystem types. Biogeosciences 2013, 10, 3205–3219. [Google Scholar] [CrossRef]
  14. Oertel, C.; Matschullat, J.; Zurba, K.; Zimmermann, F.; Erasmi, S. Greenhouse gas emissions from soils—A review. Geochemistry 2016, 76, 327–352. [Google Scholar] [CrossRef]
  15. Petrakis, S.; Seyfferth, A.; Kan, J.; Inamdar, S.; Vargas, R. Influence of experimental extreme water pulses on greenhouse gas emissions from soils. Biogeochemistry 2017, 133, 147–164. [Google Scholar] [CrossRef]
  16. Liu, L.; Estiarte, M.; Peñuelas, J. Soil moisture as the key factor of atmospheric CH4 uptake in forest soils under environmental change. Geoderma 2019, 355, 113920. [Google Scholar] [CrossRef]
  17. Curiel Yuste, J.; Baldocchi, D.D.; Gershenson, A.; Goldstein, A.; Misson, L.; Wong, S. Microbial soil respiration and its dependency on carbon inputs, soil temperature and moisture. Glob. Change Biol. 2007, 13, 2018–2035. [Google Scholar] [CrossRef]
  18. Fang, Y.; Gundersen, P.; Zhang, W.; Zhou, G.; Christiansen, J.R.; Mo, J.; Dong, S.; Zhang, T. Soil–atmosphere exchange of N2O, CO2 and CH4 along a slope of an evergreen broad-leaved forest in southern China. Plant Soil 2009, 319, 37–48. [Google Scholar] [CrossRef]
  19. McCalley, C.; Woodcroft, B.; Hodgkins, S.; Wehr, R.; Kim, E.; Mondav, R.; Crill, P.M.; Chanton, J.P.; Rich, V.I.; Tyson, G.W.; et al. Methane dynamics regulated by microbial community response to permafrost thaw. Nature 2014, 514, 478–481. [Google Scholar] [CrossRef] [PubMed]
  20. Shakoor, A.; Pendall, E.; Macdonald, C. Microbial mechanisms of interactive climate-driven changes in soil N2O and CH4 fluxes: A global meta-analysis. J. Environ. Manag. 2025, 376, 124380. [Google Scholar] [CrossRef]
  21. Zang, H.; Blagodatskaya, E.; Wen, Y.; Shi, L.; Cheng, F.; Chen, H.; Zhao, B.; Zhang, F.; Fan, M.; Kuzyakov, Y. Temperature sensitivity of soil organic matter mineralization decreases with long-term N fertilization: Evidence from four Q10 estimation approaches. Land Degrad. Dev. 2020, 31, 683–693. [Google Scholar] [CrossRef]
  22. Dijkstra, F.A.; Prior, S.A.; Runion, G.B.; Torbert, H.A.; Tian, H.; Lu, C.; Venterea, R.T. Effects of elevated carbon dioxide and increased temperature on methane and nitrous oxide fluxes: Evidence from field experiments. Front. Ecol. Environ. 2012, 10, 520–527. [Google Scholar] [CrossRef]
  23. Blankinship, J.C.; Brown, J.R.; Dijkstra, P.; Allwright, M.C.; Hungate, B.A. Response of terrestrial CH4 uptake to interactive changes in precipitation and temperature along a climatic gradient. Ecosystems 2010, 13, 1157–1170. [Google Scholar] [CrossRef]
  24. Sponseller, R.A. Precipitation pulses and soil CO2 flux in a Sonoran Desert ecosystem. Glob. Change Biol. 2007, 13, 426–436. [Google Scholar] [CrossRef]
  25. Liu, Y.; Christiansen, J.; Huang, K.; Liu, D.; Duan, Y.; Liu, G.; Gurmesa, G.A.; Fang, X.; Peng, S.; Fang, Y. Temperature and moisture both control net methane uptake in a temperate forest soil. Agric. For. Meteorol. 2025, 370, 110574. [Google Scholar] [CrossRef]
  26. Carey, J.C.; Tang, J.; Templer, P.H.; Kroeger, K.D.; Crowther, T.W.; Burton, A.J.; Dukes, J.S.; Emmett, B.; Frey, S.D.; Heskel, M.A.; et al. Temperature response of soil respiration largely unaltered with experimental warming. Proc. Natl. Acad. Sci. USA 2016, 113, 13797–13802. [Google Scholar] [CrossRef] [PubMed]
  27. Zou, J.L.; Tobin, B.; Luo, Y.Q.; Osborne, B. Differential responses of soil CO2 and N2O fluxes to experimental warming. Agric. For. Meteorol. 2018, 259, 11–22. [Google Scholar] [CrossRef]
  28. Yan, W.M.; Zhong, Y.Q.W.; Shangguan, Z.P.; Torn, M.S. Response of soil greenhouse gas fluxes to warming: A global meta-analysis of field studies. Geoderma 2022, 419, 115865. [Google Scholar] [CrossRef]
  29. Xu, X.K. Effect of freeze-thaw disturbance on soil C and N dynamics and GHG fluxes of East Asia forests: Review and future perspectives. Soil Sci. Plant Nutr. 2022, 68, 15–26. [Google Scholar] [CrossRef]
  30. Maier, M.; Cordes, M.; Osterholt, L. Soil respiration and CH4 consumption covary on the plot scale. Geoderma 2021, 382, 114702. [Google Scholar] [CrossRef]
  31. Davidson, E.A.; Savage, K.; Verchot, L.V.; Navarro, R. Minimizing artifacts and biases in chamber-based measurements of soil respiration. Agric. For. Meteorol. 2002, 113, 21–37. [Google Scholar] [CrossRef]
  32. Janssens, I.A.; Kowalski, A.S.; Longdoz, B.; Ceulemans, R. Assessing forest soil CO2 efflux: An in situ comparison of four techniques. Tree Physiol. 2000, 20, 23–32. [Google Scholar] [CrossRef]
  33. Rayment, M.; Jarvis, P. An improved open chamber system for measuring soil CO2 effluxes in the field. J. Geophys. Res.-Atmos. 1997, 102, 28779–28784. [Google Scholar] [CrossRef]
  34. Crill, P.; Bartlett, K.; Harriss, R.; Gorham, E.; Verry, E.; Sebacherl, D.; Madzar, L.; Sanner, W. Methane Flux From Minnesota Peatlands. Glob. Biogeochem. Cycles 1988, 2, 371–384. [Google Scholar] [CrossRef]
  35. Dannenberg, S.; Conrad, R. Effect of rice plants on methane production and rhizospheric metabolism in paddy soil. Biogeochemistry 1999, 45, 53–71. [Google Scholar] [CrossRef]
  36. Liu, X.; Zhang, W.; Zhang, B.; Yang, Q.; Chang, J.; Hou, K. Diurnal variation in soil respiration under different land uses on Taihang Mountain, North China. Atmos. Environ. 2016, 125, 283–292. [Google Scholar] [CrossRef]
  37. Ma, X.-Z.; Zhang, Q.-L.; Li, C.-S.; Chen, G.-W.; Wang, F. Temporal variation of soil greenhouse gases fluxes in a cold-temperate Larix gmelinii forest in Inner Mongolia, China. Yingyong Shengtai Xuebao 2012, 23, 2149–2156. [Google Scholar]
  38. Hall, M.K.D.; Winters, A.J.; Rogers, G.S. Variations in the Diurnal Flux of Greenhouse Gases from Soil and Optimizing the Sampling Protocol for Closed Static Chambers. Commun. Soil Sci. Plant Anal. 2014, 45, 2970–2978. [Google Scholar] [CrossRef]
  39. Yang, H.; Liu, S.; Li, Y.; Xu, H. Diurnal variations and gap effects of soil CO2, N2O and CH4 fluxes in a typical tropical montane rainforest in Hainan Island, China. Ecol. Res. 2018, 33, 379–392. [Google Scholar] [CrossRef]
  40. Yu, X.; Li, X.; Xu, L.; Wang, M.; Zhang, J.; Jiang, M.; Wang, G. Diurnal variation of soil CO2 efflux and its optimal measuring time-window of temperate meadow steppes in western Songnen Plain, China. Chin. Geogr. Sci. 2016, 26, 518–526. [Google Scholar] [CrossRef]
  41. Kong, Y.; Gong, S.; Zhu, L.; Wu, H.; Duan, K.; Cheng, W.; Khoroshaev, D.; Lai, Y.; Xu, X. Dynamics of Soil N2O and CO2 Emissions in Response to Freeze-Thaw Intensity and Moisture Variations: A Laboratory Experiment. Forests 2025, 16, 380. [Google Scholar] [CrossRef]
  42. Guo, C.Y.; Zhang, L.M.; Li, S.G.; Ke, F.X. Monthly Diurnal Variations in Soil N2O Fluxes and Their Environmental Drivers in a Temperate Forest in Northeastern China: Insights from Continuous Automated Monitoring. Forests 2025, 16, 766. [Google Scholar] [CrossRef]
  43. Li, Q.; Cui, K.; Lv, J.; Zhang, J.; Peng, C.; Li, Y.; Gu, Z.; Song, X. Biochar amendments increase soil organic carbon storage and decrease global warming potentials of soil CH4 and N2O under N addition in a subtropical Moso bamboo plantation. For. Ecosyst. 2022, 9, 100054. [Google Scholar] [CrossRef]
  44. Jian, J.; Steele, M.; Day, S.; Thomas, R.; Hodges, S. Measurement strategies to account for soil respiration temporal heterogeneity across diverse regions. Soil Biol. Biochem. 2018, 125, 167–177. [Google Scholar] [CrossRef]
  45. Xian, Y.; Li, J.; Zhang, Y.; Shen, Y.; Wang, X.; Huang, J.; Sui, P. Determining Suitable Sampling Times for Soil CO2 and N2O Emissions Helps to Accurately Evaluate the Ability of Rubber-Based Agroforestry Systems to Cope with Climate Stress. Forests 2024, 15, 950. [Google Scholar] [CrossRef]
  46. R Core Team. R: A Language and Environment for Statistical Computing; R Foundation for Statistical Computing: Vienna, Austria, 2023; Available online: https://www.R-project.org/ (accessed on 28 April 2025).
  47. Hopple, A.; Pennington, S.; Megonigal, J.; Bailey, V.; Bond-Lamberty, B. Root and Microbial Soil CO2 and CH4 Fluxes Respond Differently to Seasonal and Episodic Environmental Changes in a Temperate Forest. J. Geophys. Res.-Biogeosci. 2023, 128, e2022JG007233. [Google Scholar] [CrossRef]
  48. Machacova, K.; Warlo, H.; Svobodová, K.; Agyei, T.; Uchytilová, T.; Horácek, P.; Lang, F. Methane emission from stems of European beech (Fagus sylvatica) offsets as much as half of methane oxidation in soil. New Phytol. 2023, 238, 584–597. [Google Scholar] [CrossRef]
  49. Krebs, L.; Burri, S.; Feigenwinter, I.; Gharun, M.; Meier, P.; Buchmann, N. Forest-floor respiration, N2O fluxes, and CH4 fluxes in a subalpine spruce forest: Drivers and annual budgets. Biogeosciences 2024, 21, 2005–2028. [Google Scholar] [CrossRef]
  50. Jevon, F.; Gewirtzman, J.; Lang, A.; Ayres, M.; Matthes, J. Tree Species Effects on Soil CO2 and CH4 Fluxes in a Mixed Temperate Forest. Ecosystems 2023, 26, 1587–1602. [Google Scholar] [CrossRef]
  51. Pang, J.; Peng, C.; Wang, X.; Zhang, H.; Zhang, S. Soil-atmosphere exchange of carbon dioxide, methane and nitrous oxide in temperate forests along an elevation gradient in the Qinling Mountains, China. Plant Soil 2023, 488, 325–342. [Google Scholar] [CrossRef]
  52. Shao, G.D.; Martinson, G.O.; Corre, M.D.; Luo, J.; Niu, D.; Veldkamp, E. Conversion of cropland monoculture to agroforestry increases methane uptake. Agron. Sustain. Dev. 2025, 45, 1. [Google Scholar] [CrossRef]
  53. Laberge, S.; Courcot, B.; Trejo-Perez, R.; Belanger, N. Soil CO2 and CH4 response to experimental warming under various tree species compositions in a temperate hardwood forest. Discov. Soil 2025, 2, 21. [Google Scholar] [CrossRef] [PubMed]
  54. Gritsch, C.; Zimmermann, M.; Zechmeister-Boltenstern, S. Interdependencies between temperature and moisture sensitivities of CO2 emissions in European land ecosystems. Biogeosciences 2015, 12, 5981–5993. [Google Scholar] [CrossRef]
  55. Zhou, W.; Hui, D.; Shen, W. Effects of Soil Moisture on the Temperature Sensitivity of Soil Heterotrophic Respiration: A Laboratory Incubation Study. PLoS ONE 2014, 9, e92531. [Google Scholar] [CrossRef]
  56. Keane, B.; Shuttleworth, E.L.; Evans, M.G.; Ritson, J.P.; Harris, A.; Johnston, A.; Alderson, D.M.; Clay, G.D. Recovery of Sphagnum from drought is controlled by species-specific moisture thresholds. Sci. Rep. 2025, 15, 22167. [Google Scholar] [CrossRef]
  57. Schuur, E.; McGuire, A.; Schädel, C.; Grosse, G.; Harden, J.; Hayes, D.; Hugelius, G.; Koven, C.D.; Kuhry, P.; Lawrence, D.M.; et al. Climate change and the permafrost carbon feedback. Nature 2015, 520, 171–179. [Google Scholar] [CrossRef]
  58. Zhang, W.; Xin, H.; Li, Z.; Cui, Q.; Xu, B.; Tang, B.; Wang, Y.; Xu, C.; Xue, J. Responses of CO2 and CH4 in the alpine wetlands of the Tibetan Plateau to warming and nitrogen and phosphorus additions. Environ. Sci.-Process. Impacts 2024, 26, 1516–1525. [Google Scholar] [CrossRef] [PubMed]
  59. Dean, J.; Middelburg, J.; Röckmann, T.; Aerts, R.; Blauw, L.; Egger, M.; Jetten, M.S.M.; de Jong, A.E.E.; Meisel, O.H.; Rasigraf, O.; et al. Methane Feedbacks to the Global Climate System in a Warmer World. Rev. Geophys. 2018, 56, 207–250. [Google Scholar] [CrossRef]
  60. Bond-Lamberty, B.; Ballantyne, A.; Berryman, E.; Fluet-Chouinard, E.; Jian, J.; Morris, K.; Rey, A.; Vargas, R. Twenty Years of Progress, Challenges, and Opportunities in Measuring and Understanding Soil Respiration. J. Geophys. Res.-Biogeosci. 2024, 129, e2023JG007637. [Google Scholar] [CrossRef]
  61. Robertson, G.; Collins, S.; Foster, D.; Brokaw, N.; Ducklow, H.; Gragson, T.; Gries, C.; Hamilton, S.K.; McGuire, A.D.; Moore, J.C.; et al. Long-Term Ecological Research in a Human-Dominated World. Bioscience 2012, 62, 342–353. [Google Scholar] [CrossRef]
  62. Wu, X.; Yao, Z.; Brüggemann, N.; Shen, Z.Y.; Wolf, B.; Dannenmann, M.; Zheng, X.; Butterbach-Bahl, K. Effects of soil moisture and temperature on CO2 and CH4 soil atmosphere exchange of various land use/cover types in a semi-arid grassland in Inner Mongolia, China. Soil Biol. Biochem. 2010, 42, 773–787. [Google Scholar] [CrossRef]
  63. Maier, M.; Paulus, S.; Nicolai, C.; Stutz, K.P.; Nauer, P.A. Drivers of Plot-Scale Variability of CH4 Consumption in a Well-Aerated Pine Forest Soil. Forests 2017, 8, 193. [Google Scholar] [CrossRef]
  64. Gao, D.; Wang, W.; Gao, W.; Zeng, Q.; Liang, H. Greenhouse gas fluxes response to autumn freeze-thaw period in continuous permafrost region of Daxing’an Mountains, Northeast China. Environ. Sci. Pollut. Res. 2022, 29, 63753–63767. [Google Scholar] [CrossRef]
  65. Yang, S.; He, Z.; Chen, L. Elevated soil moisture amplified the effects of freeze-thaw cycles on soil CO2 and CH4 fluxes in subalpine forests. Ecol. Indic. 2023, 157, 111313. [Google Scholar] [CrossRef]
  66. Wigley, K.; Armstrong, C.; Smaill, S.; Reid, N.; Kiely, L.; Wakelin, S. Methane cycling in temperate forests. Carbon Balance Manag. 2024, 19, 37. [Google Scholar] [CrossRef] [PubMed]
  67. Mäkipää, R.; Abramoff, R.; Adamczyk, B.; Baldy, V.; Biryol, C.; Bosela, M.; Casals, P.; Yuste, J.C.; Dondini, M.; Filipek, S.; et al. How does management affect soil C sequestration and greenhouse gas fluxes in boreal and temperate forests?—A review. For. Ecol. Manag. 2023, 529, 120637. [Google Scholar] [CrossRef]
  68. Kazmi, F.; Mander, Ü.; Khanongnuch, R.; Öpik, M.; Ranniku, R.; Soosaar, K.; Masta, M.; Tenhovirta, S.A.M.; Kasak, K.; Ah-Peng, C.; et al. Distinct microbial communities drive methane cycling in below- and above-ground compartments of tropical cloud forests growing on peat. Environ. Microbiome 2025, 20, 54. [Google Scholar] [CrossRef]
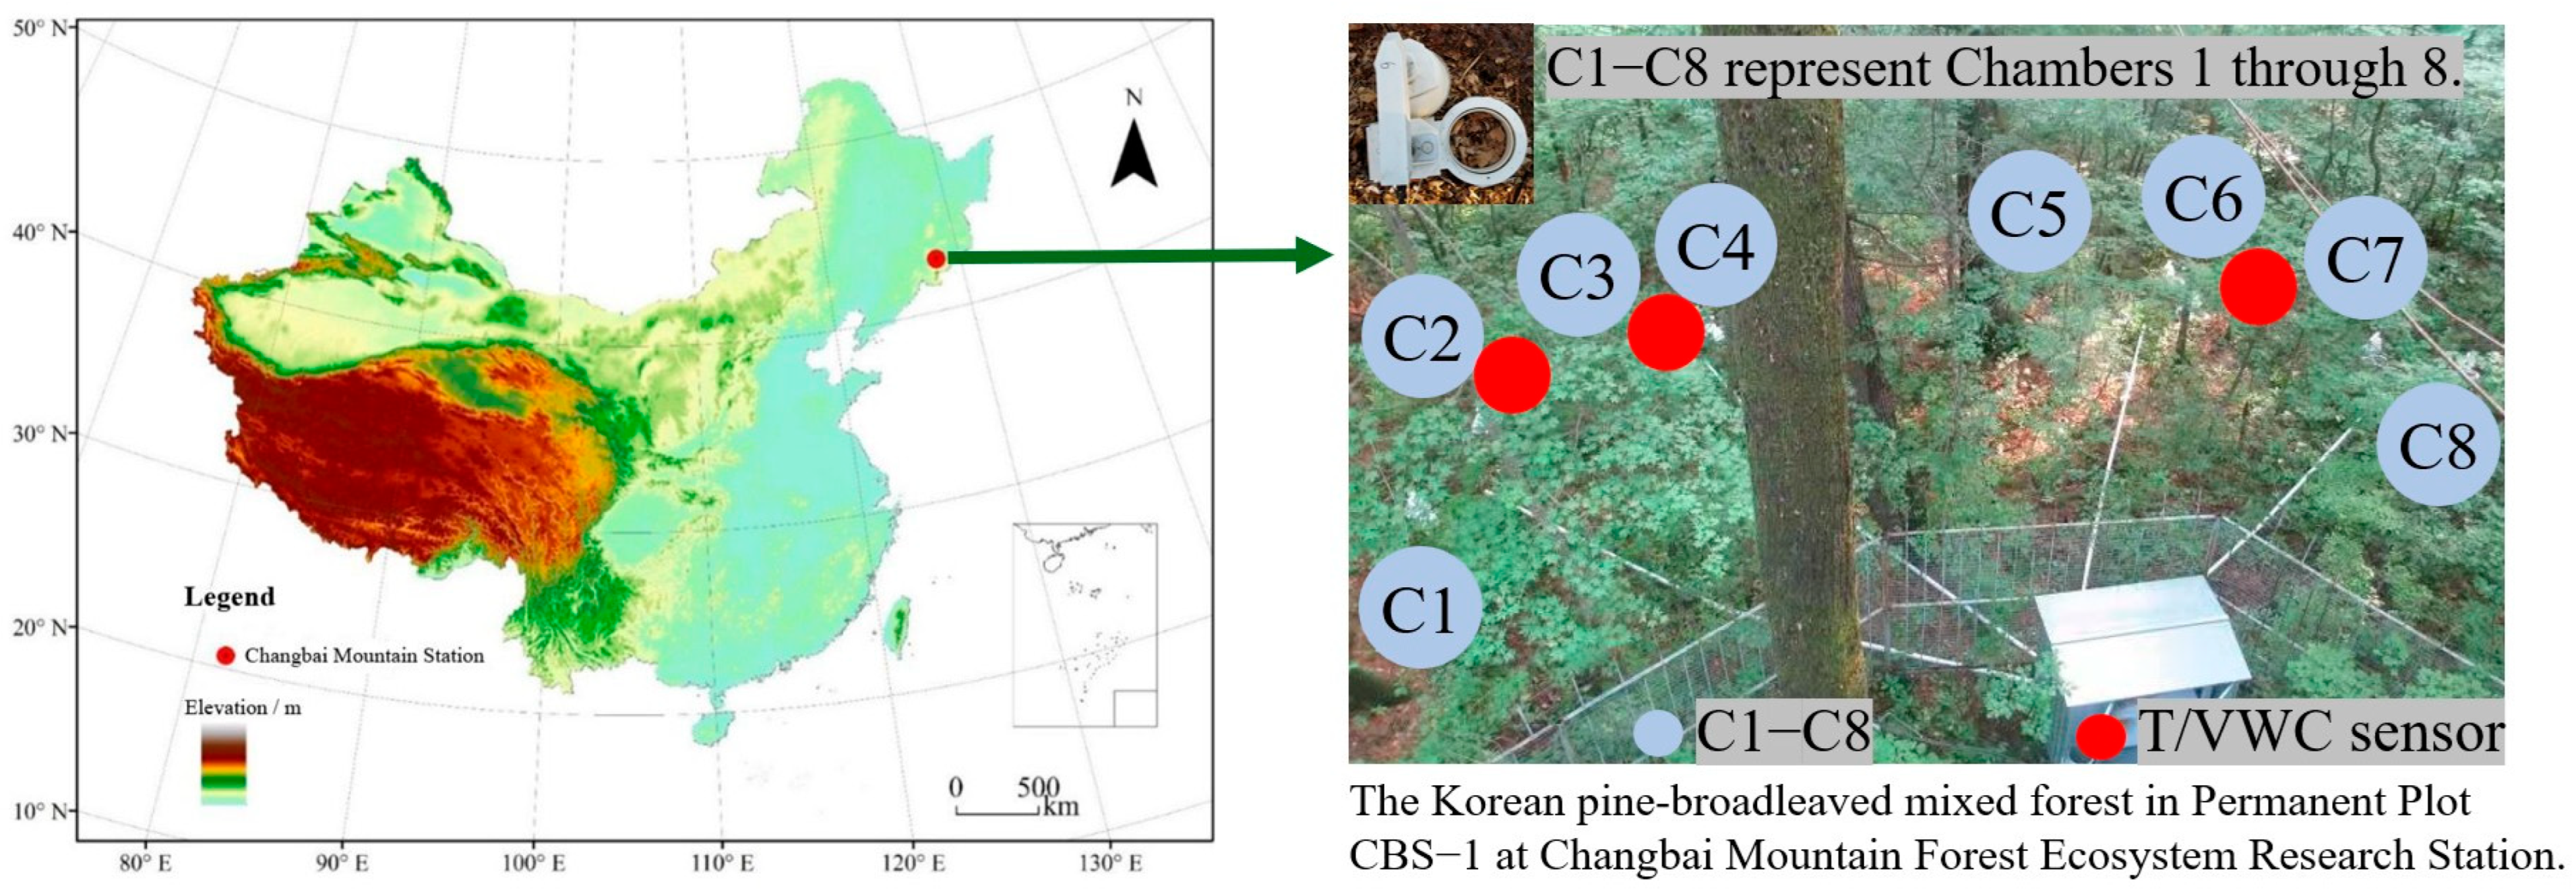
Figure 1. Study site location and spatial arrangement of automated dynamic chambers (C1–C8) at Changbai Mountain.
Atmosphere 16 01326 g001
Figure 2. Diurnal variations in (a) soil temperature (Ts) and (b,c) soil volumetric water content (VWC) at 5 cm depth for each month. The gray shaded areas represent the daytime period (6:00–17:00). The numbers in parentheses alongside the lines indicate the respective months. Data points show mean values with error bars representing ± SE.
Atmosphere 16 01326 g002
Figure 3. Coupling relationship between CO2 and CH4 fluxes. Colored points show monthly flux values (January to December, 1–12), with solid lines indicating monthly linear relationships that are statistically significant (p < 0.05). The black dashed line shows the annual (Total) linear relationship. Slope indicates regression rate, R2 shows the coefficient of determination, and p-value indicates statistical significance.
Atmosphere 16 01326 g003
Figure 4. Diurnal variation profiles of (a_1l_1) soil CO2 and (a_2l_2) CH4 fluxes across twelve months (January–December). Error bars show standard errors. Horizontal dashed lines indicate monthly mean fluxes; gray background denotes daylight (6:00–17:00). Vertical dashed lines show times nearest to 24-h mean values; dotted lines indicate nearest daytime means (6:00–17:00) when 24-h means occurred at night (18:00–5:00).
Atmosphere 16 01326 g004
Figure 5. Correlation analysis of annual (denoted as Total) and monthly soil CO2 and CH4 fluxes with Ts and VWC, using Pearson correlation coefficients. Asterisks denote statistical significance levels: ns for p ≥ 0.05; **** for p < 0.0001.
Atmosphere 16 01326 g005
Figure 6. Decision-tree diagram of threshold responses of soil (a,b) CO2 and (c,d) CH4 fluxes to Ts (°C) and VWC (m3 m−3). Boxes indicate mean CO2 and CH4 fluxes with sample sizes (n) and percentages; gray labels along the branches mark Ts or VWC threshold values. The following are shown below the diagram: Pearson correlation coefficients (r) between Ts/VWC and CO2/CH4 fluxes (significance levels: ns for p > 0.05; * for p < 0.05; *** for p < 0.001; **** for p < 0.0001).
Atmosphere 16 01326 g006
Table 1. Monthly CO2 and CH4 fluxes at selected sampling times (CO2: 6 (6:00), 11 (11:00), 12 (12:00), 13 (13:00), 14 (14:00), 15 (15:00), 16 (16:00), 17 (17:00); CH4: 6 (6:00), 7 (7:00), 15 (15:00), 16 (16:00)) compared to daily averages (0−23 (0:00−23:00)). Only significant Wilcoxon test results shown (p < 0.05). Significance levels: * for p < 0.05; ** for p < 0.01; **** for p < 0.0001.
ScaleGas FluxMonthKruskal–WallisWilcoxon
p-ValueSignificancePairwise Comparisonp-Value
MonthlyCO22<0.0001****6, 12, 13, 14, 15, 16, 17 vs. 0−23<0.05
3<0.0001****6, 17 vs. 0–23<0.05
40.0018**6, 11, 12 vs. 0–23<0.05
5<0.0001****6 vs. 0–23<0.05
6<0.0001****6, 11 vs. 0–23<0.05
7<0.0001****6, 11, 12, 13 vs. 0–23<0.05
8<0.0001****11, 12, 13, 14, 15 vs. 0–23<0.05
9<0.0001****11, 12, 13, 14, 15, 17 vs. 0–23<0.05
10<0.0001****11, 12, 13, 14, 15 vs. 0–23<0.05
110.0220*15, 16, 17 vs. 0–23<0.05
CH45<0.0001****15 vs. 0–23<0.05
Table 2. GWP100 estimation accuracy (g CO2 eq m−2) comparing two sampling methods with 24-h continuous data: (a) conventional 9:00–12:00 mean flux (daily proxy); (b) optimal 16:00 single measurement. Note: Total values represent 12-month cumulative sums. Values in parentheses indicate percentage deviations from observations (positive/negative: over-/underestimation).
MonthObserved Values9:00–12:00 Estimates (a)16:00 Estimates (b)
GWP100
CO2
GWP100
CH4
GWP100
CO2 + CH4
GWP100
CO2
GWP100
CH4
GWP100
CO2 + CH4
GWP100
CO2
GWP100
CH4
GWP100
CO2 + CH4
18.31−0.347.978.48 (2.06%)−0.31 (−7.56%)8.16 (2.47%)9.67 (16.40%)−0.36 (7.09%)9.30 (16.79%)
211.75−0.2011.5611.90 (1.24%)−0.17 (−13.09%)11.73 (1.48%)15.78 (34.26%)−0.22 (14.53%)15.55 (34.59%)
330.01−0.2129.8125.76 (−14.17%)−0.16 (−22.15%)25.60 (−14.12%)31.88 (6.20%)−0.21 (−0.17%)31.67 (6.24%)
456.19−0.1656.0261.22 (8.97%)−0.13 (−21.71%)61.09 (9.06%)63.33 (12.72%)−0.14 (−12.11%)63.19 (12.79%)
5200.01−0.64199.38186.54 (−6.74%)−0.53 (−17.29%)186.01 (−6.70%)195.84 (−2.08%)−0.59 (−6.78%)195.25 (−2.07%)
6265.87−1.01264.86246.55 (−7.27%)−0.88 (−12.64%)245.66 (−7.25%)266.65 (0.29%)−0.96 (−5.44%)265.70 (0.32%)
7415.29−1.00414.29368.42 (−11.29%)−0.85 (−14.79%)367.56 (−11.28%)410.34 (−1.19%)−0.99 (−1.62%)409.35 (−1.19%)
8426.99−0.95426.04373.85 (−12.44%)−0.76 (−19.55%)373.09 (−12.43%)414.66 (−2.89%)−0.92 (−3.11%)413.74 (−2.89%)
9262.52−0.44262.08218.14 (−16.91%)0.34 (−24.69%)217.81 (−16.89%)262.04 (−0.18%)−0.48 (8.10%)261.56 (−0.20%)
10135.00−0.81134.19115.11 (−14.73%)−0.61 (−25.11%)114.51 (−14.67%)131.23 (−2.79%)−0.85 (4.92%)130.38 (−2.83%)
1145.94−0.4645.4843.28 (−5.79%)−0.41 (−12.19%)42.88 (−5.73%)52.51 (14.29%)−0.51 (9.56%)52.00 (14.34%)
1223.82−0.1123.7121.95 (−7.86%)−0.10 (−13.80%)21.86 (−7.83%)26.75 (12.27%)−0.10 (−8.79%)26.65 (12.37%)
Total1881.71−6.331875.371681.20 (−10.66%)−5.24 (−17.20%)1675.95 (−10.63%)1880.68 (−0.05%)−6.33 (−0.02%)1874.35 (−0.05%)
Summary Statistics
Annual Bias (Total)−10.66% (CO2)−17.20% (CH4)−10.63% (CO2 + CH4)−0.05% (CO2)−0.02% (CH4)−0.05% (CO2 + CH4)
Seasonal Range of Deviation−16.91% to 8.97%−25.11% to −7.56%−16.89 to 9.06%−2.89% to 34.26%−12.11% to 14.53%−2.89% to 34.59%
Table 3. Stepwise regression estimates of annual (denoted as Total) and monthly soil CO2 (μmol m−2 s−1) and CH4 (nmol m−2 s−1) fluxes using (1) Ts (°C), VWC (m3 m−3), and CH4 and (2) Ts, VWC, and CO2. Asterisks denote statistical significance levels: * p < 0.05; ** p < 0.01; *** p < 0.001; **** p < 0.0001.
Gas FluxMonthFitted EquationR2Fp
CO2TotalCO2 flux = 0.474 **** + 0.187Ts **** − 1.517VWC **** − 0.179CH4 ****0.91654,037.3****
1CO2 flux = −0.084 **** − 0.024Ts **** + 0.581VWC *** − 0.219CH4 ****0.8282176.2****
2CO2 flux = 0.114 *** − 2.142VWC *** − 0.895CH4 ***0.512688.4***
3CO2 flux = 0.256 **** + 0.135Ts **** − 0.027VWC − 0.476CH4 ****0.579641.0****
4CO2 flux = −1.720 **** + 0.067Ts **** + 4.092VWC **** − 0.948CH4 ****0.332148.9****
5CO2 flux = −7.081 **** + 0.191Ts **** + 13.622VWC **** − 1.792CH4 ****0.552443.5****
6CO2 flux = −1.695 *** + 0.289Ts *** − 0.301CH4 ***0.322333.3***
7CO2 flux = −10.984 **** + 0.331Ts **** + 17.802VWC **** − 2.321CH4 ****0.7551410.4****
8CO2 flux = −10.175 **** + 0.341Ts **** + 14.631VWC **** − 2.187CH4 ****0.8152091.0****
9CO2 flux = −1.414 *** + 0.242Ts *** − 0.879CH4 ***0.5841007.8***
10CO2 flux = −4.839 **** + 0.136Ts **** + 10.101VWC **** − 1.148CH4 ****0.7711629.6****
11CO2 flux = −0.076 + 0.035Ts **** + 0.187VWC − 0.711CH4 ****0.731821.8****
12CO2 flux = 0.398 **** + 0.255Ts **** − 0.912VWC **** − 0.255CH4 ****0.307119.1****
CH4TotalCH4 flux = 0.071 *** − 0.050VWC * − 0.002CO20.0336.1**
1CH4 flux = −0.238 + 3.105VWC− 0.968CO2 ***0.19312.7***
2CH4 flux = 0.551 − 5.067VWC− 0.776CO2 ***0.50627.1***
3CH4 flux = −0.210 **** + 0.022Ts **** + 0.777VWC **** − 0.445CO2 ****0.620741.0****
4CH4 flux = −1.533 **** + 0.012Ts **** + 3.029VWC **** − 0.163CO2 ****0.641517.1****
5CH4 flux = −3.448 **** + 0.025Ts **** + 6.906VWC **** − 0.172CO2 ****0.8041478.3****
6CH4 flux = −4.067 **** + 0.069Ts **** + 6.875VWC **** − 0.151CO2 ****0.9084644.5****
7CH4 flux = −4.454 **** + 0.073Ts **** + 7.963VWC **** − 0.206CO2 ****0.9417242.1****
8CH4 flux = −4.609 **** + 0.089Ts **** + 7.633VWC **** − 0.240CO2 ****0.8943886.6****
9CH4 flux = −3.130 **** + 0.040Ts **** + 5.777VWC **** − 0.193CO2 ****0.8863593.9****
10CH4 flux = −4.057 **** + 0.046Ts **** + 8.510VWC **** − 0.397CO2 ****0.7201239.9****
11CH4 flux = −0.574 *** + 1.132VWC *** − 0.910CO2 ****0.716770.6****
12CH4 flux = 0.013 + 0.024Ts − 0.408VWC **** − 0.136CO2 ****0.289104.2****
Disclaimer/Publisher’s Note: The statements, opinions and data contained in all publications are solely those of the individual author(s) and contributor(s) and not of MDPI and/or the editor(s). MDPI and/or the editor(s) disclaim responsibility for any injury to people or property resulting from any ideas, methods, instructions or products referred to in the content.