3.2. Case Study 1: Winter 2010/2011
To evaluate the new automated CAP classification method the numerical results were compared with the qualitative evaluation test dataset, based on visual inspection, while also excluding the CAP cases with wind speeds exceeding the surface wind speed threshold. The results of this comparison are shown in
Table 3. This table shows the agreement (as a percentage) of the visually inspected CAP and non-CAP days to the numerical CAP classification results. In all locations, there is a 78% or better agreement using vertical profiles from three different sources (radiosonde, ERA, and ERA
Adj). The results based on radiosondes and ERA
Adj are generally similar, with the notable exception of the radiosonde-derived values in Denver. One downside of using the same potential temperature gradient threshold (
G) for both ERA and radiosondes is that it can have better agreement with one over the other. In this case, the value of
G that was selected is a better fit when using the ERA model than when using the radiosonde data in Denver. Comparing ERA and ERA
Adj, the ERA
Adj improves the percentage of CAPs identified in Boise and Medford. However, in two cities (Reno and Salt Lake City), ERA
Adj performs slightly worse compared to the unadjusted ERA. In Medford, the ERA
Adj increases the efficacy from 78% to 92%, which is a significant improvement. This difference indicates that ERA does not adequately simulate the atmospheric surface layer on the valley floor in Medford. This could be due, in part, to the horizontal resolution of ERA, because the Rogue River Valley is relatively small (i.e., <30 km across) and the 31 km horizontal resolution of ERA is too coarse to capture the terrain.
The impact of the surface wind speed criteria on CAP classification is an important factor in the new classification method. For this test case, 6% of the profiles would be classified differently without the wind speed criteria (i.e., would be classified as a CAP). However, on average, the agreement compared to the visually determined CAPs is similar. Using the wind speed criteria in the CAP classification had the largest difference in Denver. The agreement between the numerical method and radiosonde visual inspection decreased by 12% when the wind speed criteria were not used.
Visually comparing the vertical temperature and wind speed profiles from radiosonde observations and ERA
Adj provides more context for the results shown in
Table 3. While the majority of the time the new CAP classification method is suitable to use with profiles from both the radiosonde and ERA, there are cases when the new CAP determination method works with the radiosonde data, but not with ERA or ERA
Adj. The discrepancies in the CAP classification method will be investigated further using example temperature profiles.
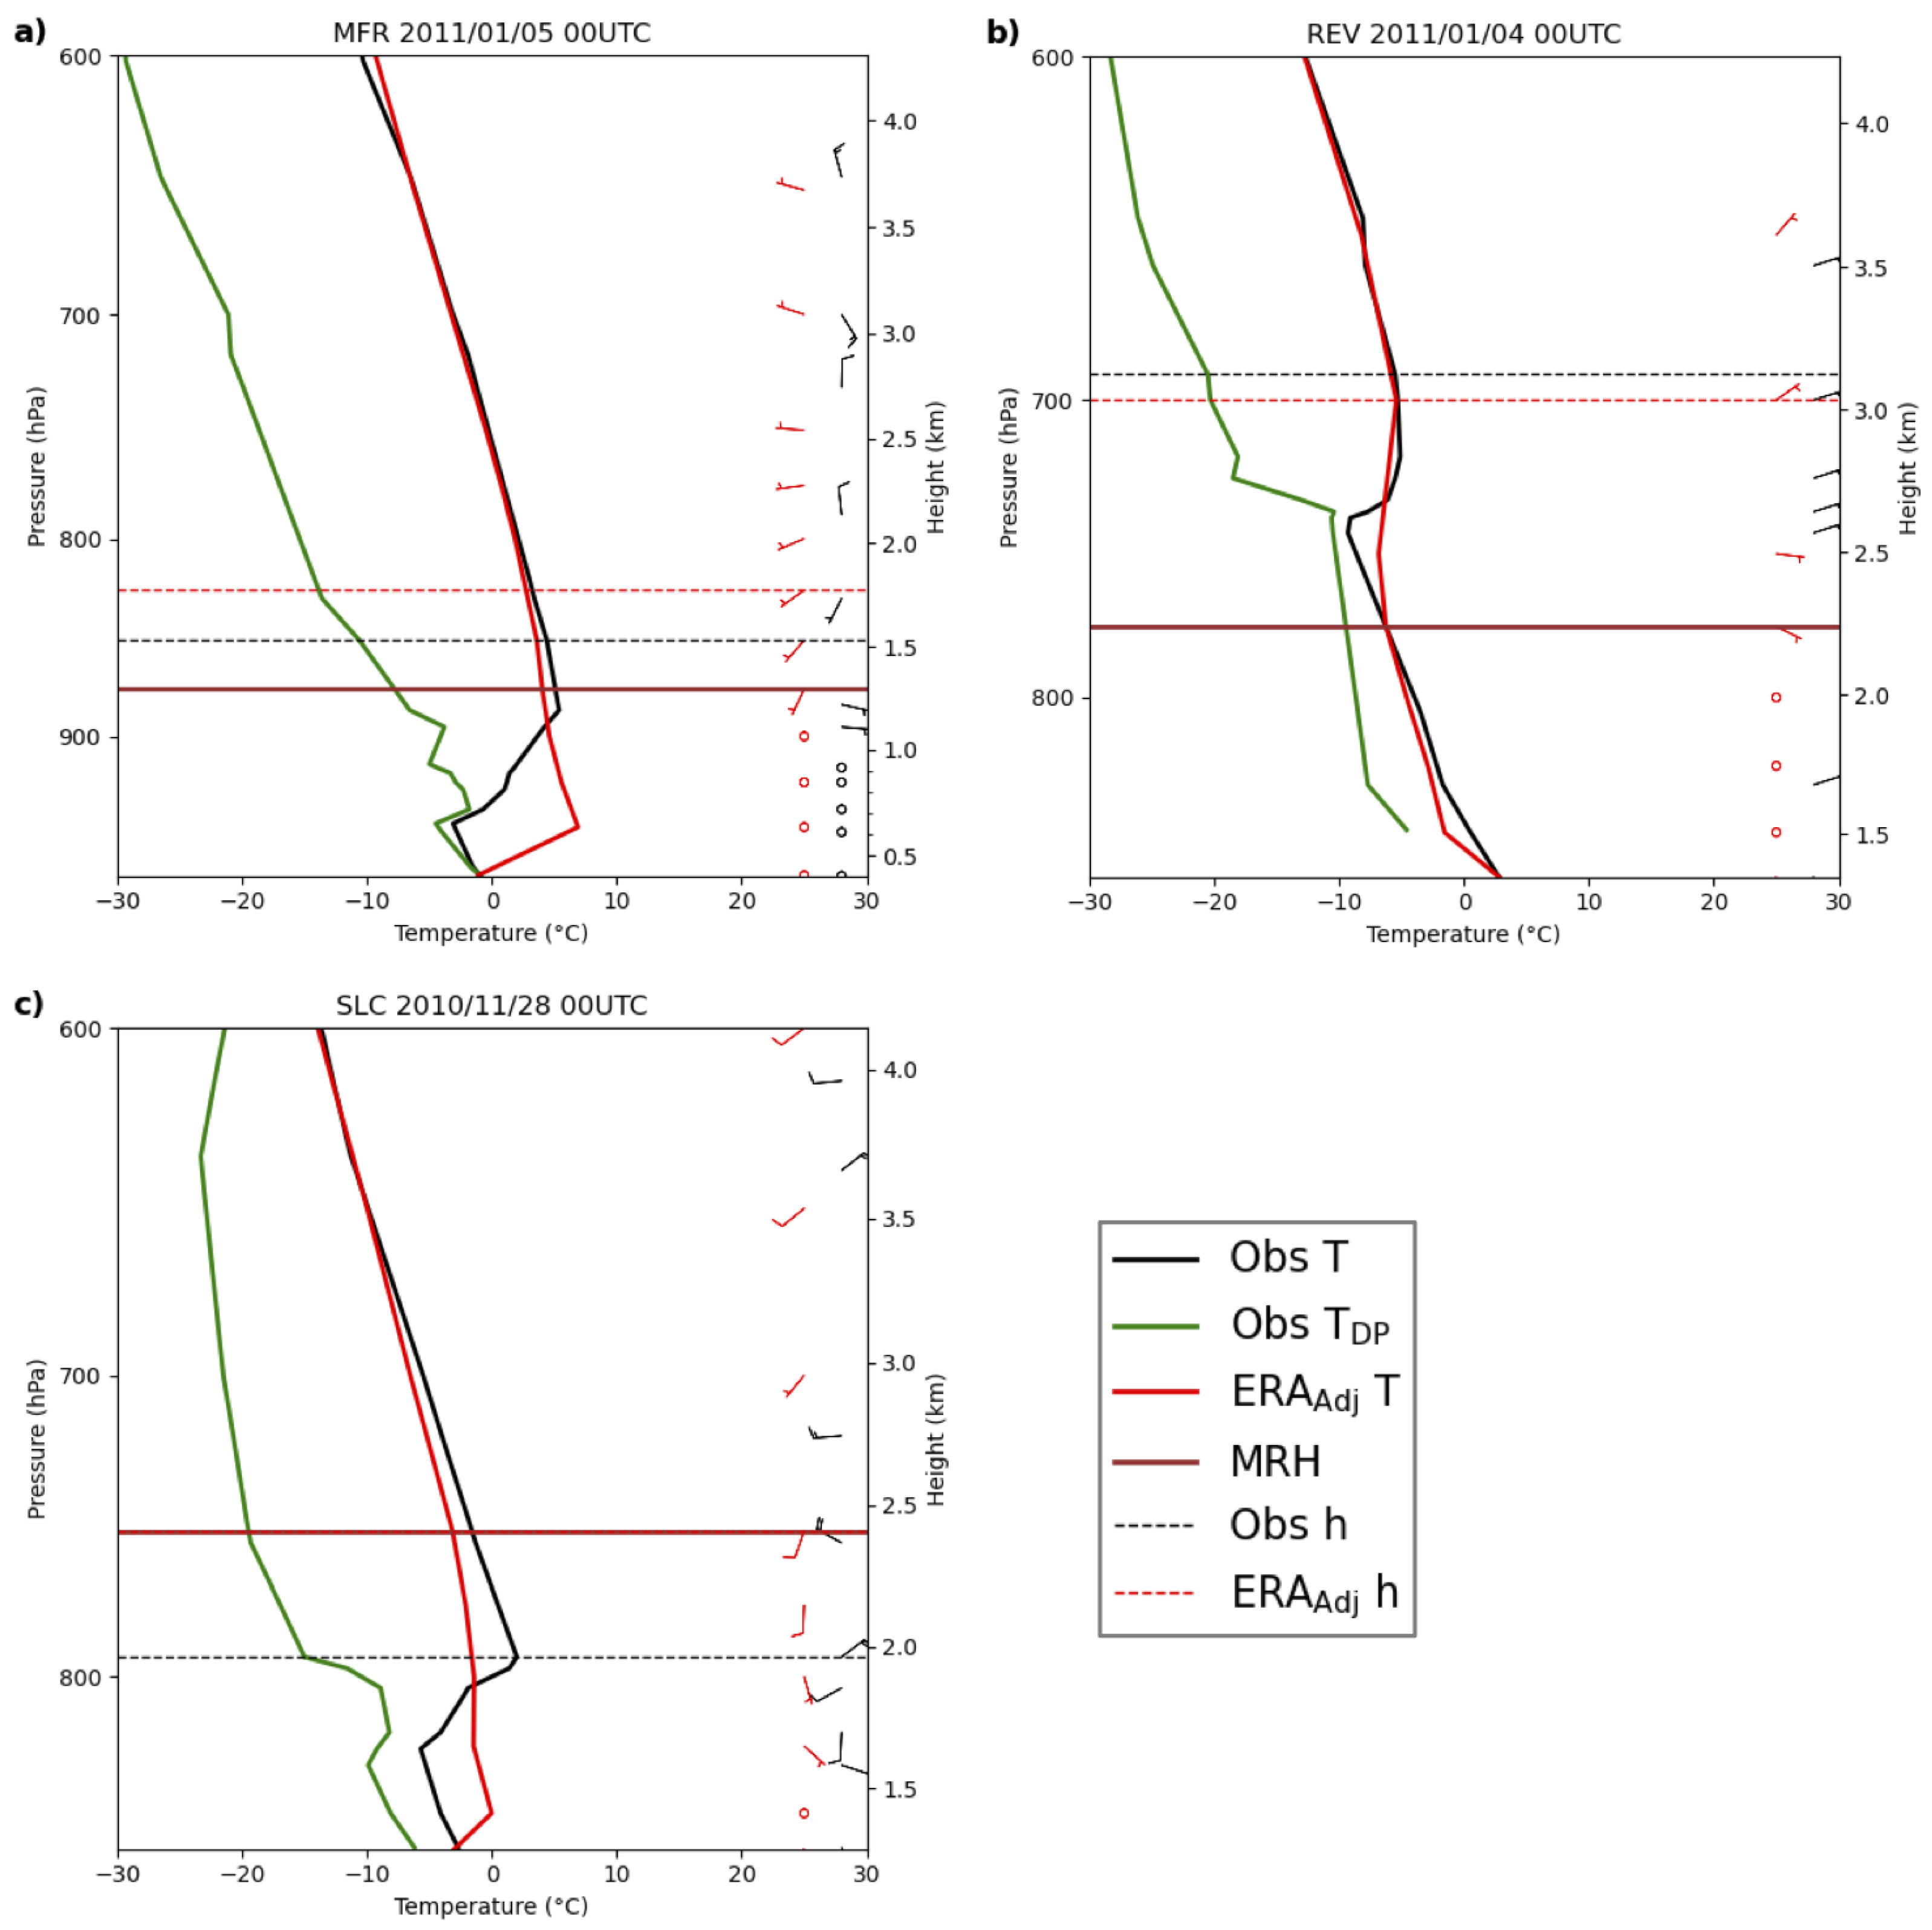
Figure 2a shows a plot from Medford on 5 January 2011.
in this example is 2.78 using ERA
Adj and 4.66 using the radiosonde, and both are well above the
thresholds in
Table 2 (1.41 and 1.23, respectively), indicating a CAP. The
integration heights for both the radiosonde and ERA
Adj are higher than the visualized inversion height in both examples. Also, the integration heights for both profiles are above the mean ridge height because there is a stable layer (with
>
G = 6 K km
−1) above the temperature inversion layer. The significant temperature change at the surface in the ERA
Adj temperature profile comes from appending the surface station data at the bottom of the model temperature profile. While not plotted, because above the surface ERA and ERA
Adj profiles are identical, ERA has a substantially weaker surface inversion than is indicated by the ERA
Adj profile (i.e., the surface temperature in ERA is greater than the temperature from the surface meteorological station).
Figure 2b shows an example of an elevated temperature inversion in Reno on 4 January 2011. Note that both the radiosonde and ERA
Adj have the same surface temperature value because both vertical temperature profiles have surface observations appended from the valley floor in Reno.
is 2.60 using ERA
Adj and 2.29 using the radiosonde. Both values are above the
threshold for Reno, as shown in
Table 2 (1.33 and 1.03 for ERA
Adj and radiosonde, respectively) and are considered CAPs. Additionally, the impacts of the coarse vertical resolution of ERA are evident in this figure, where the strength of the inversion is smoothed out in the ERA vertical temperature profile, but ERA still captures a stable layer at the same height.
Figure 2c shows a plot from Salt Lake City on 28 November 2010.
using ERA
Adj is 2.32 and 7.49 using the radiosonde. This is above the
threshold in
Table 2 (1.55 and 1.19, respectively) and both are classified as CAPs, but the difference in
is large. Visually, the difference is shown by a strong, stable layer above the surface in the radiosonde observations, while the ERA
Adj profile indicates a surface inversion. ERA
Adj, having the adjusted surface temperature observation, modifies the ERA model temperature profile so that it is labeled as a CAP. The integration height for ERA
Adj is much higher than the radiosonde integration height, which decreases
because the area above the surface inversion in ERA is only slightly stable. This is a case where the ERA model does not capture a strongly elevated inversion.
Using results from the Persistent Cold Air Pool Study (PCAPS [
20]), conducted during this winter in Salt Lake City, additional comparisons can be made. PCAPS has more vertical profile data than the twice-daily radiosondes from the airport, providing a more cohesive dataset to compare with the new CAP classification method. PCAPS also includes data that was not ingested in the ERA data assimilation process. Another test of our new CAP classification method is to compare the days we classify as CAPs during PCAPS to the CAP days identified by the PCAPS investigators. Our new CAP classification method using ERA and ERA
Adj captures 93% of the CAP days, while using the radiosonde captures 98%. It should be noted that the PCAPS CAP days are not necessarily the IOP days of the study but only the days where CAPs were observed. The failure of ERA to find every CAP day in the PCAPS study highlights a limitation of using coarse horizontal and vertical resolution model data, as some CAPs are missed because of model smoothing or uncertainties in the modeling the atmospheric surface layer in ERA.
3.3. Case Study 2: Winter 2015/2016
Similarly to the previous section, radiosonde profiles during winter 2015/2016 were visually inspected and categorized into CAP and non-CAP days if there was a stable atmospheric layer observed in the temperature profiles. The results from the qualitative, visual inspection were compared to the new CAP classification method, where the agreement between the two methods is shown in
Table 4. The ERA
Adj method performs similar, or slightly worse, to the ERA method in all cities, except Medford. However, on average, the radiosondes, ERA, and ERA
Adj all perform about the same.
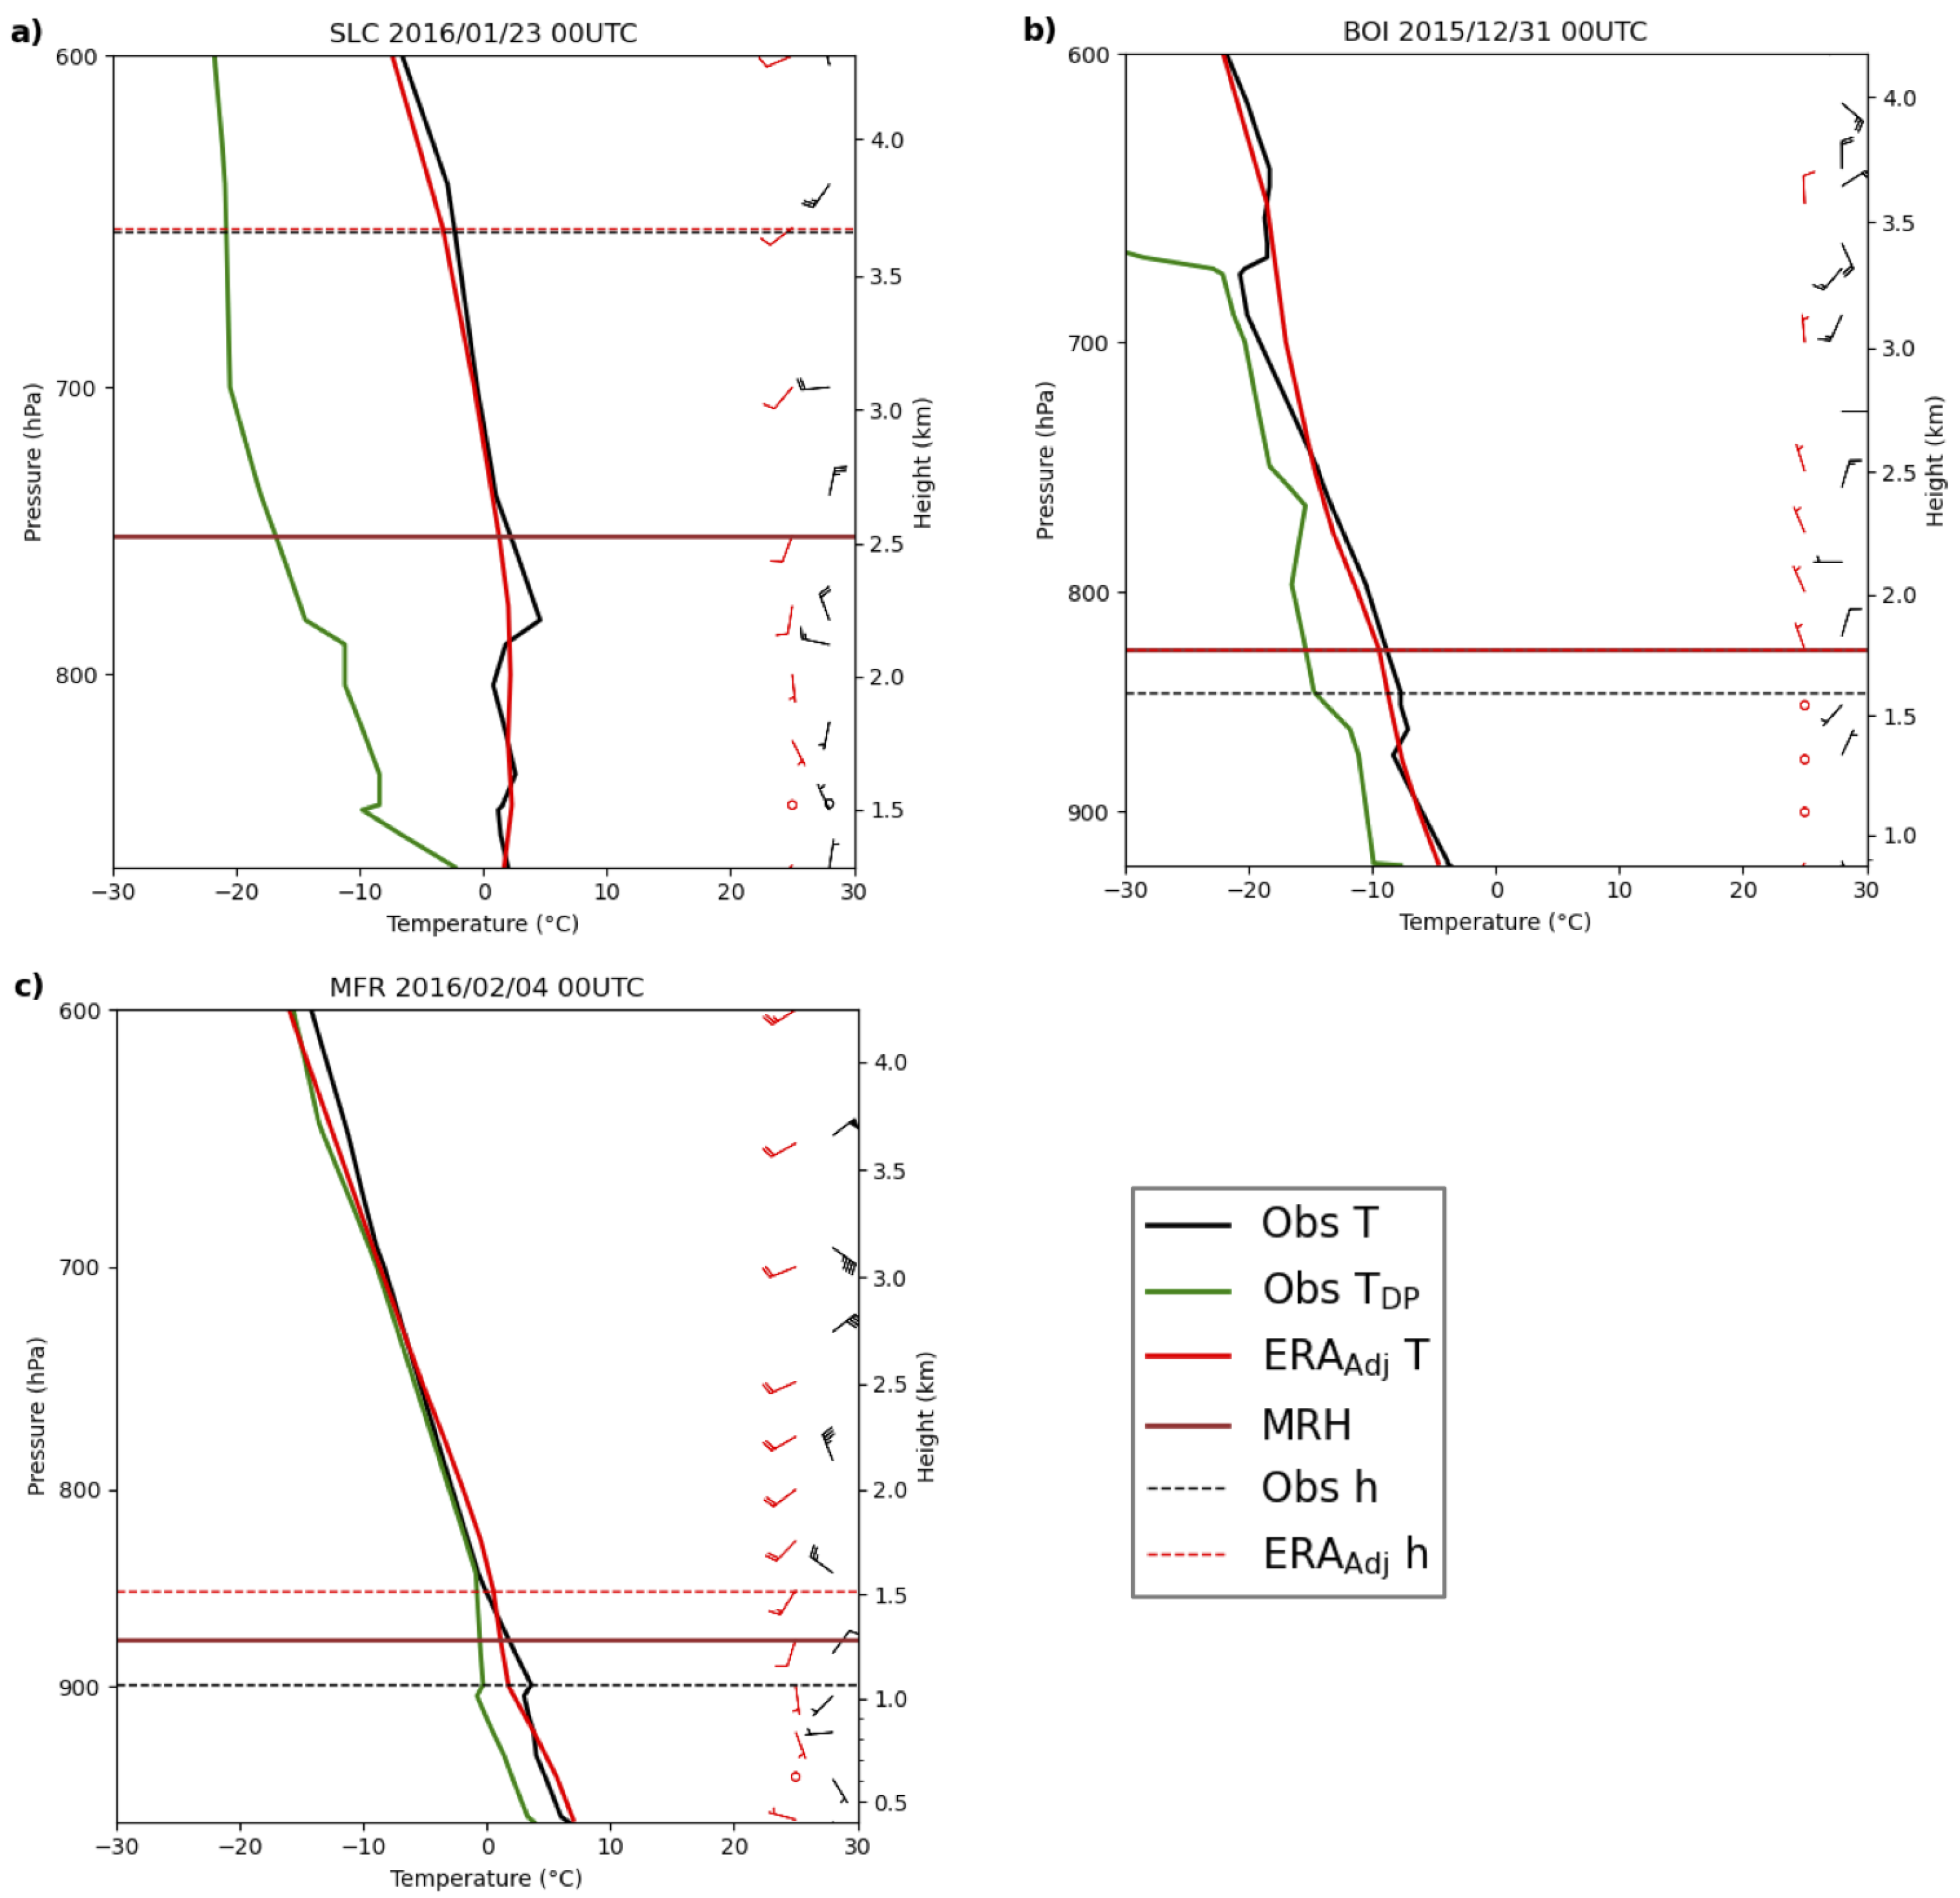
Figure 3a shows a plot from Salt Lake City on 23 January 2016. The radiosonde observations show a stable layer to about the mean ridge height, with two inversion layers above the surface, one starting at ∼1.5 km ASL and a second inversion layer starting at ∼2.0 km ASL. The integration height for the radiosonde profile captures both inversion layers. ERA smooths out these features and shows a nearly isothermal layer from the surface to ∼3.0 km ASL.
using the radiosonde is 2.32, well above the
threshold in
Table 2 (1.19). Using ERA
Adj,
is 2.18 which is also above the threshold of 1.55. The observed surface wind (approximately 5 m s
−1) is above the threshold of 4 m s
−1, which classifies both the ERA
Adj and radiosonde profiles as a non-CAP. This is an example of a CAP day where the wind speed threshold is too strict and is classified as a non-CAP.
Figure 3b shows a plot from Boise on 31 December 2015.
is 1.53 using ERA
Adj and 1.74 using the radiosonde. Both thresholds are above the thresholds outlined in
Table 2 (1.40 and 1.23 using ERA
Adj and the radiosonde, respectively). The radiosonde profile shows a temperature inversion, while ERA shows a slightly stable layer and does not capture the temperature inversion. Regardless of these differences, using our new classification method this case is successfully labeled as a CAP.
Figure 3c shows data from Medford on 4 February 2016.
is 1.49 using ERA
Adj and 2.19 using the radiosonde, so this example is classified as a CAP. The profiles have significant differences, however. The observations show a shallow elevated temperature inversion layer at ∼1 km ASL, with a thin unstable layer at the surface. While ERA
Adj does not have an inversion layer, there is an elevated slightly stable layer starting at ∼1 km ASL. If only data below the mean ridge height are considered,
is 1.08 using ERA
Adj, indicating that the layer is only slightly more stable than the SLR.
3.4. Case Study 3: Winter 2021/2022
Like the previous examples, the winter 2021/2022 radiosondes were visually inspected to classify each day as a CAP or non-CAP day. This qualitative, visual inspection dataset was compared to the results from the new CAP determination method.
Table 5 shows the agreement between days visually determined CAPs and non-CAPs to the automated CAP determination method. The agreement between the CAP determination method and the visually determined CAP and non-CAP days ranges from 84 to 98% for ERA and 87–98% for ERA
Adj, and 88–92% for the radiosonde observations. ERA
Adj performs better in Boise and Medford, while the unadjusted ERA model performs better in Las Vegas. However, results from ERA and ERA
Adj are similar. Medford again stands out where ERA
Adj performs better than ERA for CAP classification, which is likely due to the horizontal resolution of the ERA model in that region. The CAP determination using the radiosonde performs better or is equivalent to ERA or ERA
Adj in Salt Lake City, Boise, Las Vegas, and Denver. In contrast, CAP determination using the ERA model performs better in Reno (ERA and ERA
Adj similar) and Medford (ERA
Adj).
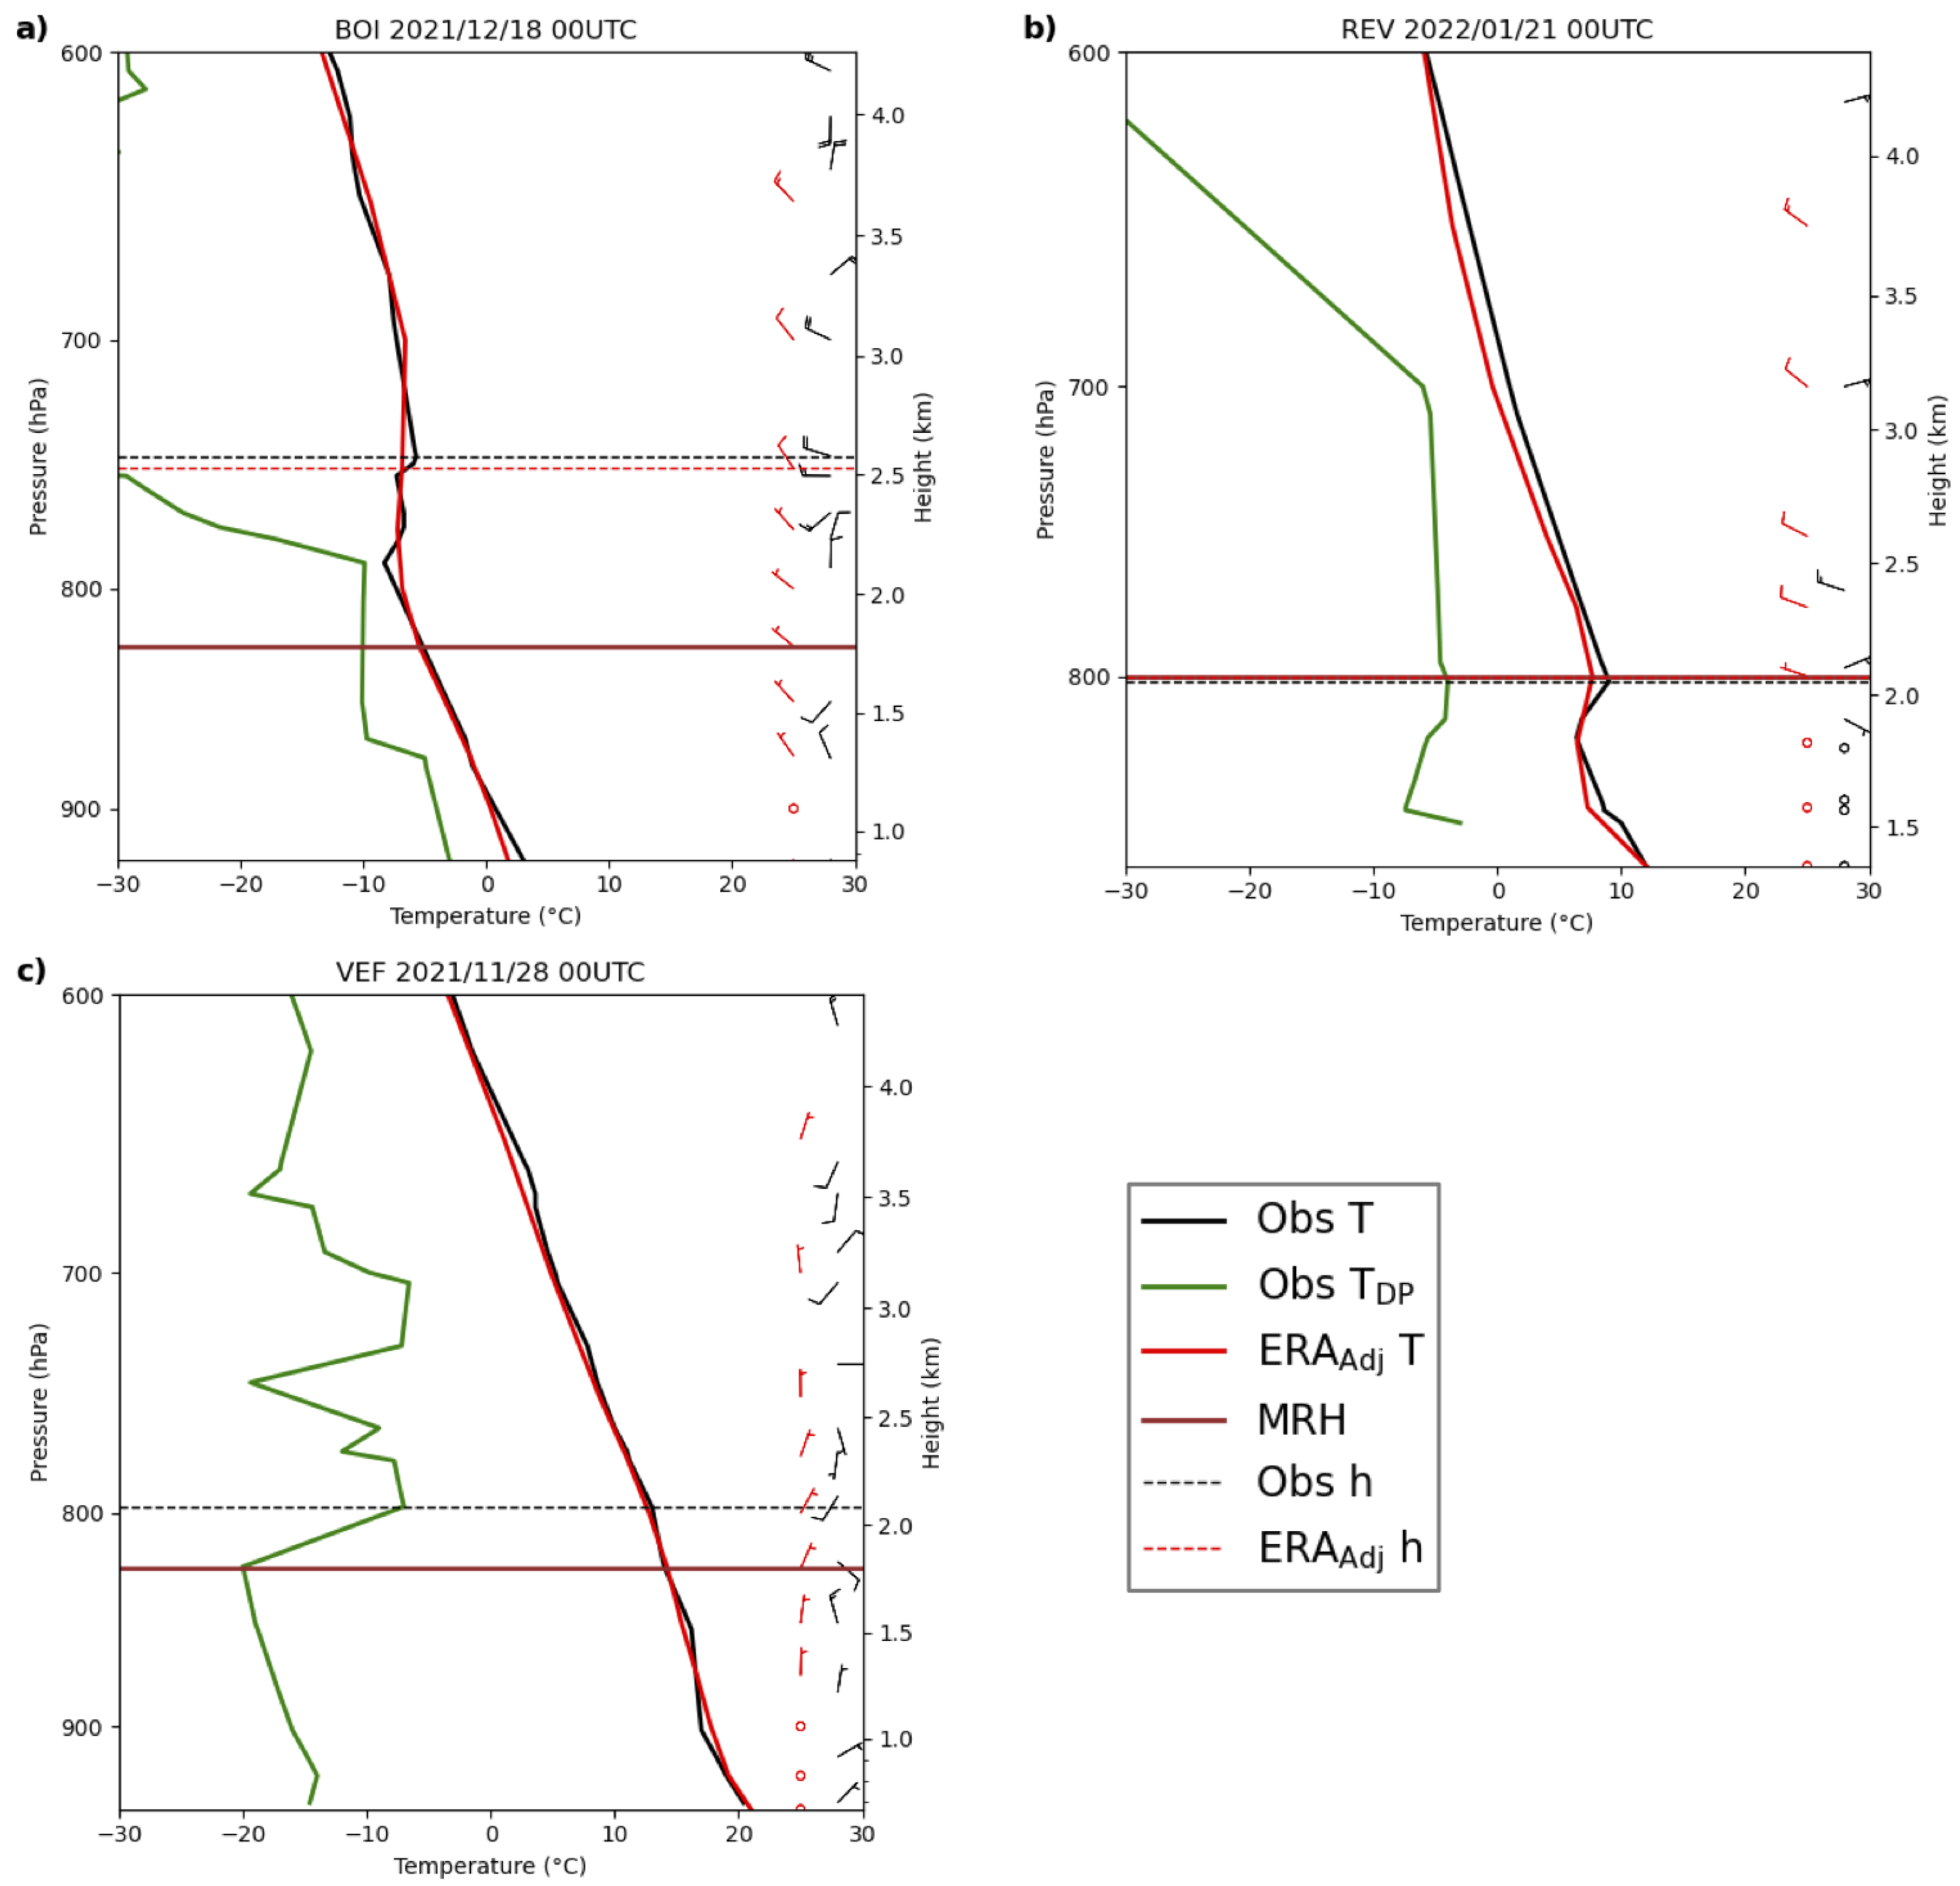
Figure 4a shows a plot from Boise on 18 December 2021.
using ERA
Adj is 1.84 and 2.08 using the radiosonde.
using ERA
Adj is above the CAP threshold listed in
Table 2 (1.40) and above the threshold (1.23) for the radiosonde. In the ERA
Adj profile, there is an isothermal stable layer from ∼2–3 km ASL. Approximately half of this isothermal layer extends above 1.5 times the mean ridge height, the height limit where the new CAP classification method stops searching for stable layers. However, because the bottom half of this elevated stable layer is below the maximum integration height it is captured in the
calculation and is why it is greater than one. This is an example of a CAP case that would be missed if only the layer below the mean ridge height was considered.
Figure 4b shows an elevated, relatively shallow, temperature inversion in the vertical temperature profile from Reno on 21 January 2022.
using ERA
Adj is 2.46 and 3.23 using the radiosonde. Both values are above the
threshold in
Table 2 (1.33 and 1.03, respectively), and both are labeled CAPs. ERA
Adj matches the shape of the vertical profile from radiosonde observations, and also captures the shallow elevated inversion layer at the top of the CAP. The integration height found for both the radiosonde and ERA
Adj are similar and correctly identifies the top of the stable layer. The CAP classification method correctly designates each profile as a CAP. This example also illustrates how using a method with variable integration height, which can go above the mean ridge height, can improve
calculations.
Figure 4c shows the temperature profile in Las Vegas on 28 November 2021.
using ERA
Adj is undefined as no point in the profile satisfies the potential temperature gradient criteria
G = 6 K km
−1 and therefore no integration height is found for the
calculation.
using the radiosonde is 1.60, which is above the CAP threshold of 1.08 from
Table 2. The observed and ERA
Adj modeled temperature profiles are similar. However, there are several small isothermal layers in the radiosonde temperature profiles that are not captured in the ERA
Adj temperature profile. Had
using ERA
Adj been calculated to the mean ridge height,
would be 1.42, which meets the threshold in
Table 2 (1.18). This is an example of the set value of G that is used to search for the integration height in the temperature profile failing to capture a CAP.
3.5. CAP and PCAP Summary Statistics
One objective of this work is to numerically quantify CAP days using large datasets, and to apply a new CAP classification method to regions without radiosonde observations. This section provides a summary of how many days in during winter were classified as CAPs. Additionally, discussion of how the results compare when using radiosonde observations and ERA model results is also given. Examining patterns between similar regions and year-to-year differences provides some insight into overall CAP formation and the effectiveness of the new CAP classification method, especially between using the ERA model and observations. Based on the test case results shown above, the radiosonde observations typically have the best agreement with manually determined CAPs over three winters, compared to ERA, where the number of CAP days is underestimated.
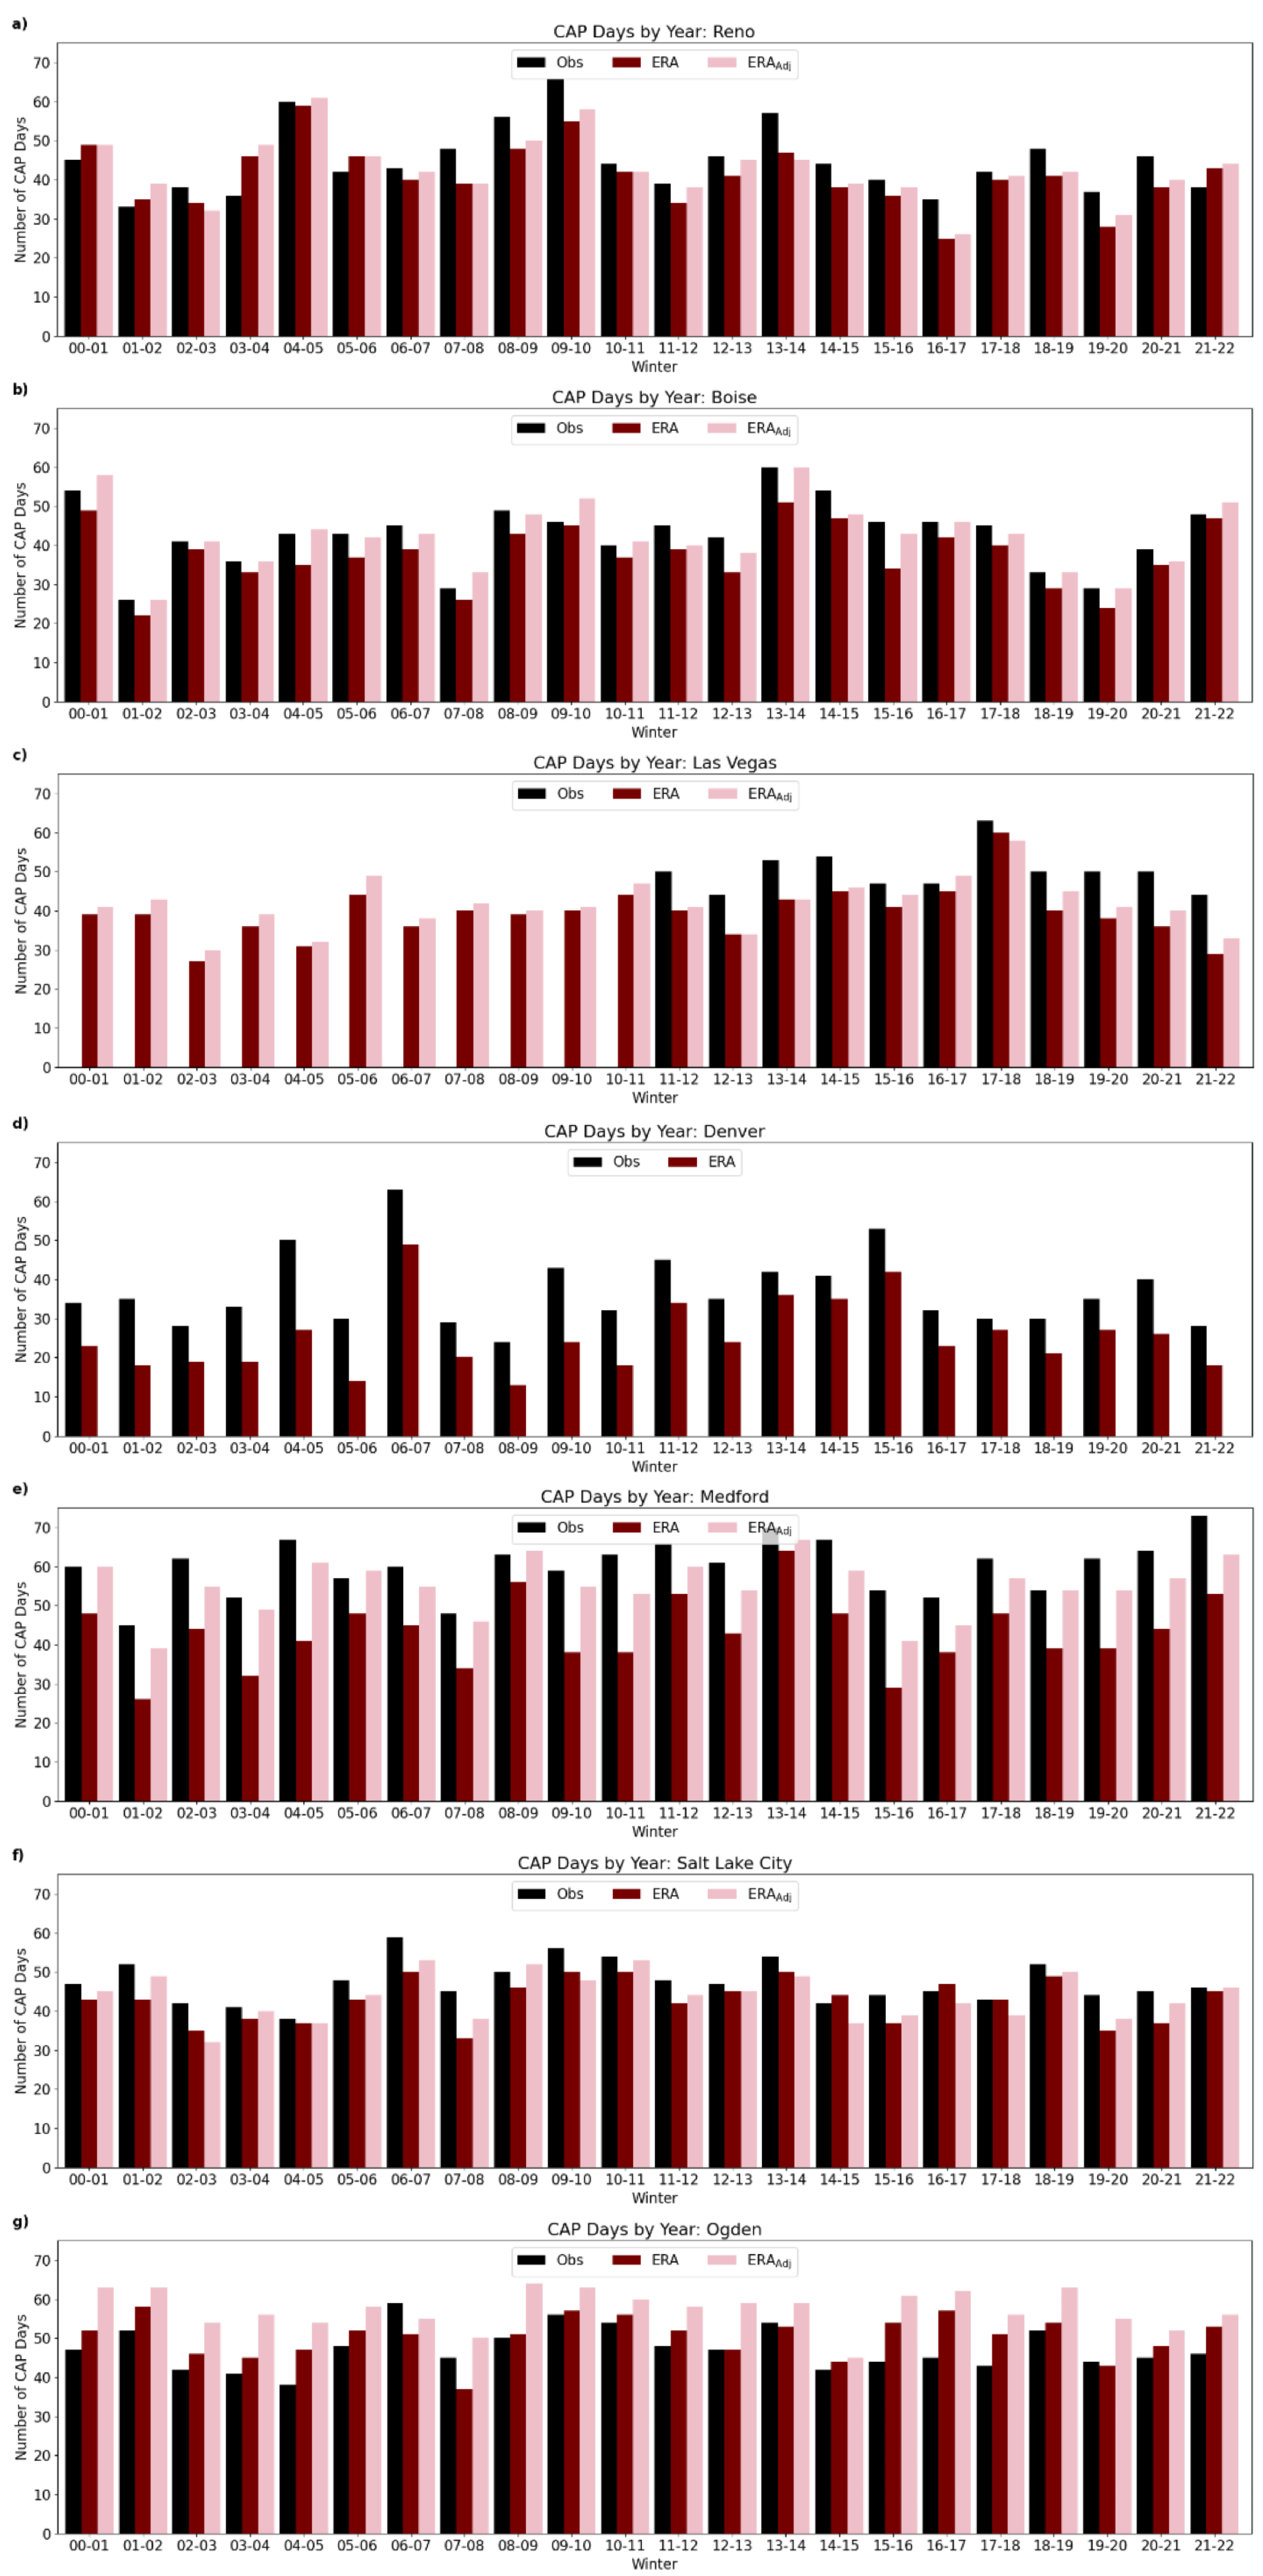
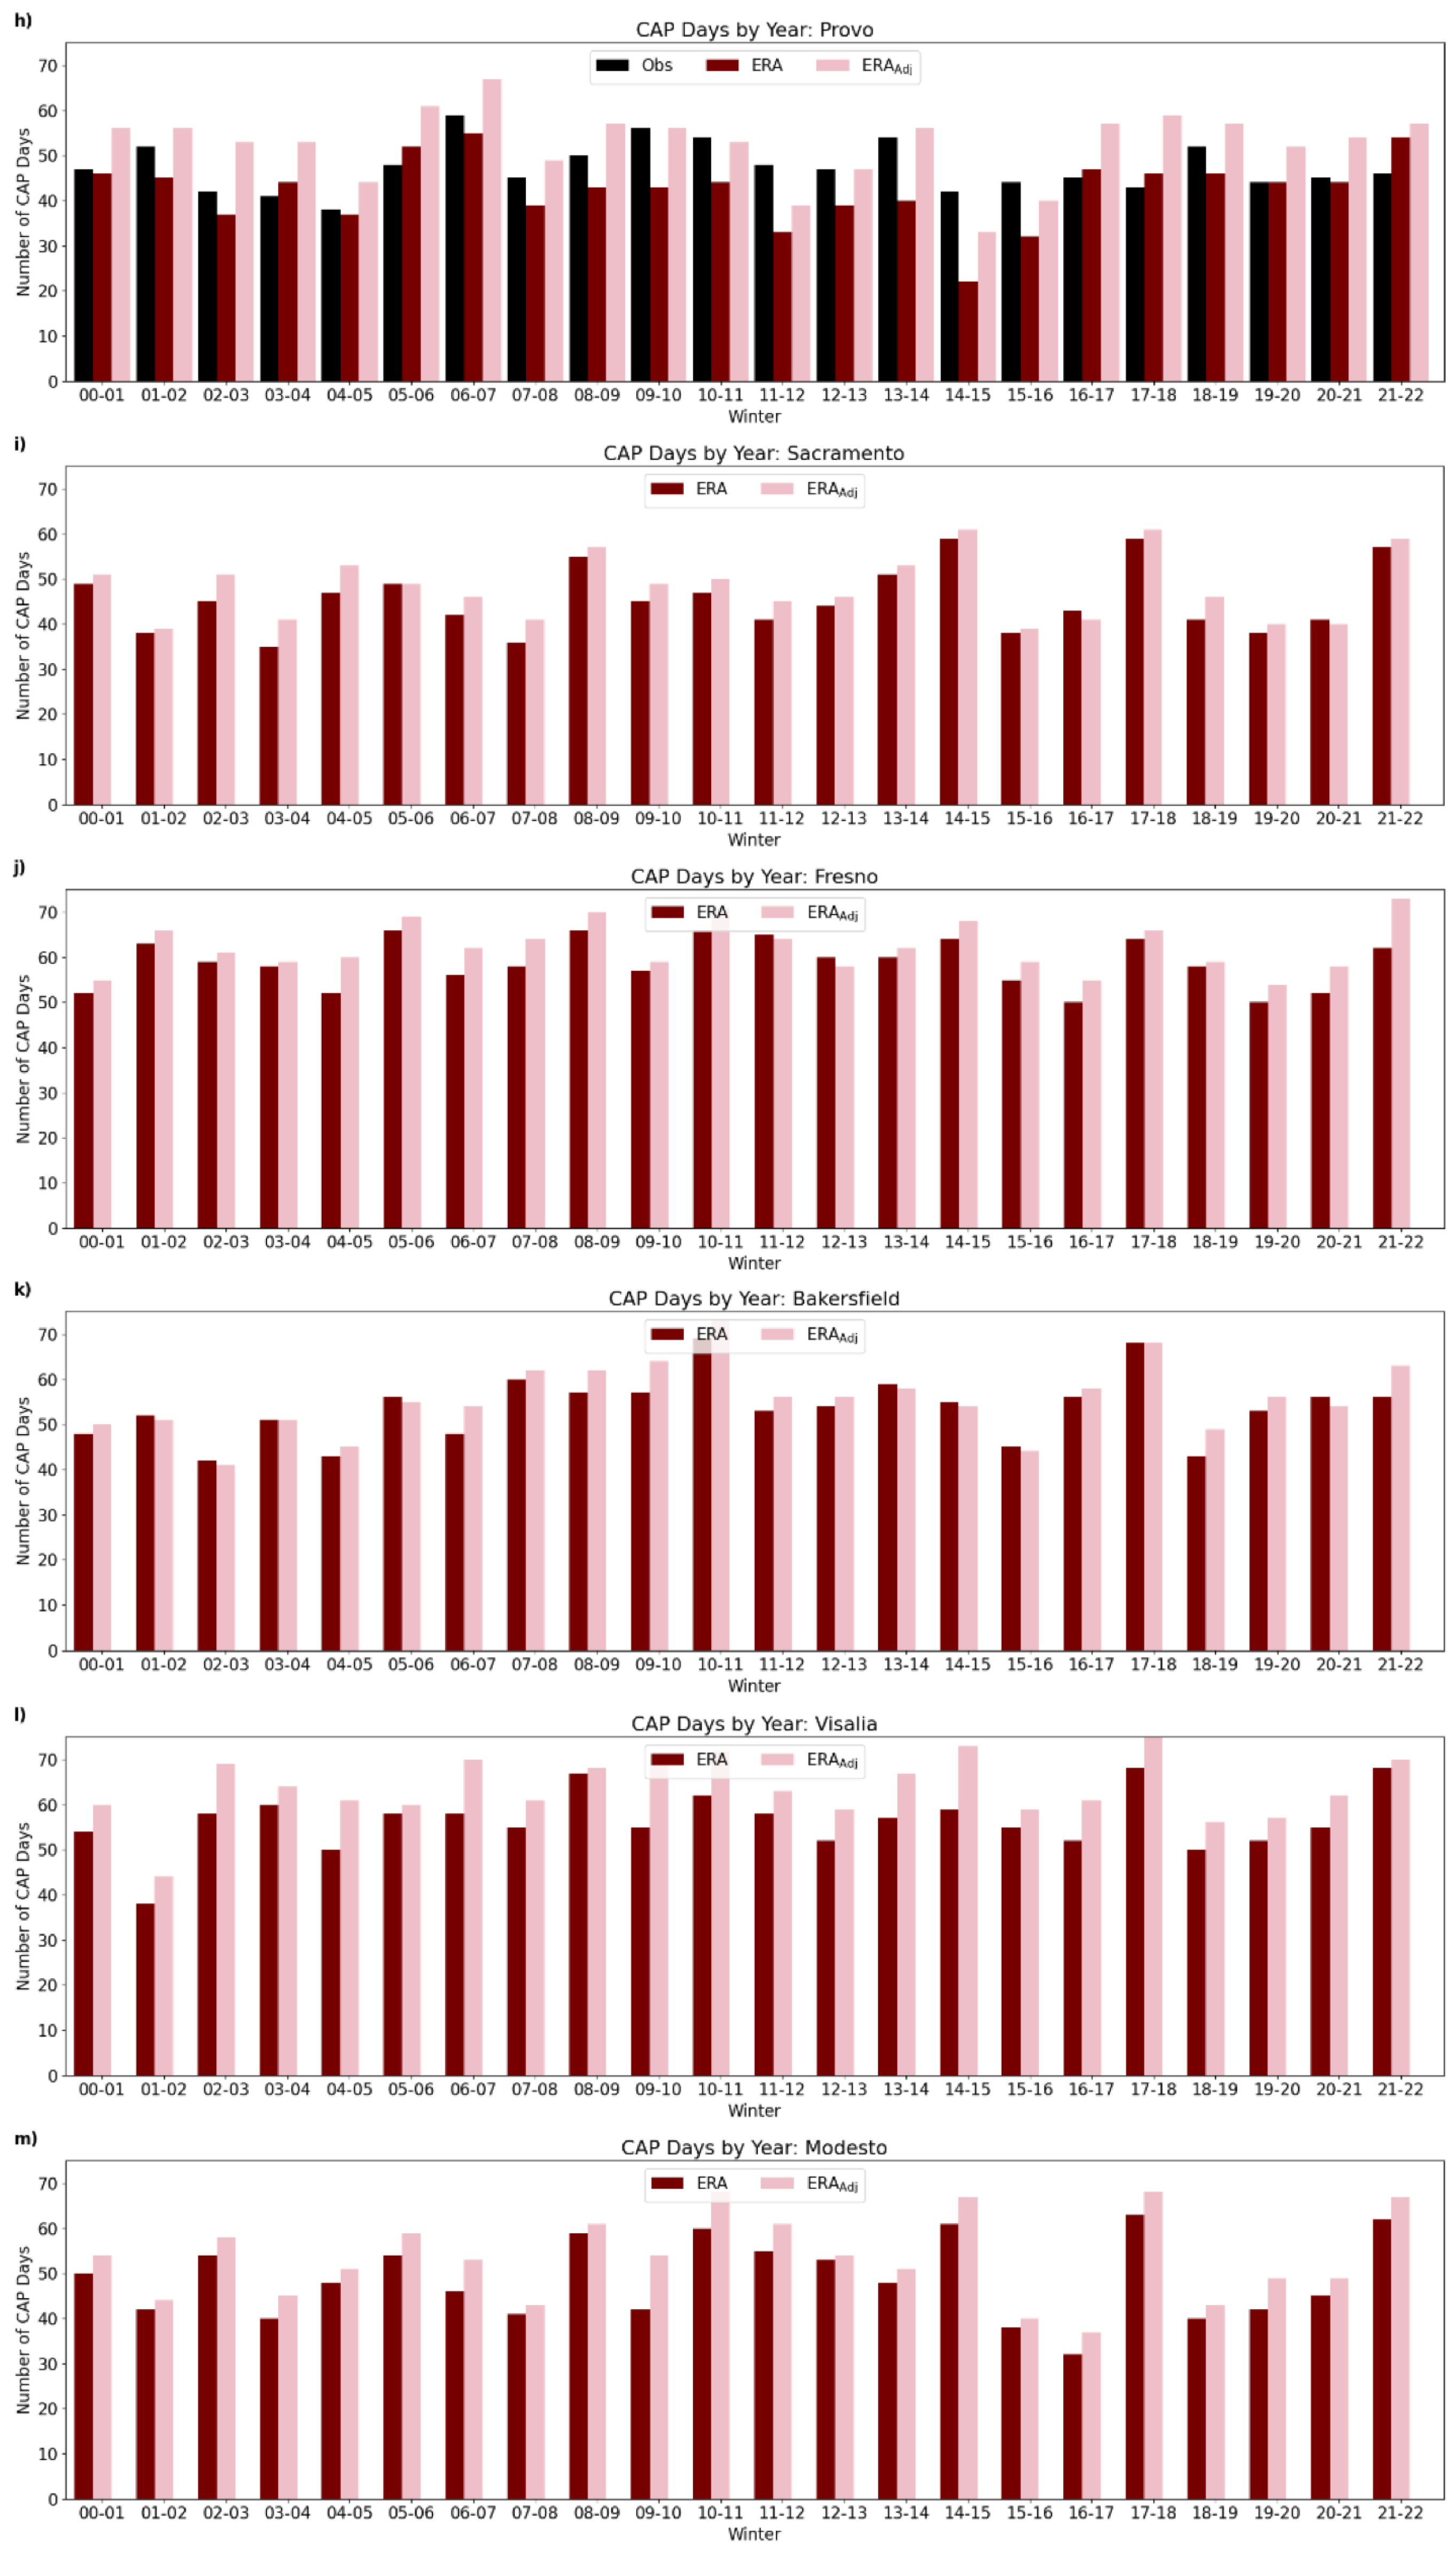
Figure 5 shows the number of CAP days per year for each location using radiosonde observations, ERA, and ERA
Adj. There is a common trend among most cities, where more CAPs are found using the radiosonde data compared to using ERA outputs. The two main reasons for this are vertical resolution differences, where ERA has coarser vertical resolution, and uncertainties in the ERA model with modeling the atmospheric surface layer.
When comparing the CAPs found using the Salt Lake City radiosonde data and CAPs found using ERAAdj in Ogden and Provo, Salt Lake City averages 44 CAPs per year, Ogden averages 47 per year, and Provo averages 44 per year. Ogden is in the same basin as Salt Lake City, so it is notable that, on average, slightly more CAPs are found there. Typically, ERA underestimates the number of CAP events, and in Ogden using ERAAdj has more CAPs than in Salt Lake City using radiosonde data. Investigating this further, model error could be a factor in this discrepancy because radiosonde data are assimilated into the ERA model, therefore, ERA should be most reliable near Salt Lake City (i.e., radiosonde launch location). However, this does not seem to be the case because both ERA and ERAAdj results in Salt Lake City show average yearly CAP days as 36 and 35, respectively. This is on average approximately 10 fewer CAPs per year than in Ogden and Provo using both ERA and ERAAdj, and in Salt Lake City using the radiosonde. Essentially, the Ogden and Provo ERA results match the CAP classification numbers from Salt Lake City radiosonde observations better than the Salt Lake City ERA results. Vertical resolution differences help explain the discrepancy between the radiosonde and ERA results, but they do not explain the differences between Salt Lake City, Ogden, and Provo. These differences could potentially come from the coarse horizontal resolution of the ERA model along the Wasatch Front.
Elsewhere, Denver has the lowest number of CAPs because it is not contained in a valley. Medford has the largest difference in CAP classifications between the ERA model results and the radiosonde, similar to the case study results discussed above. In Medford, the radiosonde finds a CAP, on average, for two-thirds of the winter days, which is mainly due to the deep, narrow Rogue River Valley where Medford is located. As mentioned above, the ERA model has high uncertainties in Medford because of the coarse horizontal resolution, so the large differences between the ERA and the radiosonde results are expected.
There are no radiosonde observations in the Central Valley, but based on the CAP classifications using the ERA model, the Central Valley locations have the most CAP days on average. There are often periods where the stable marine layer is active in a part of the valley, which results in more CAP days. There is some variability among the locations within the valley, but generally, the year-to-year trend is similar among all locations.
To classify PCAPs, Whiteman et al. (2014) [
2] proposed a method based on the
being greater than a CAP threshold value for more than 36 h. In this study, because we are only using the afternoon soundings, and we assume the morning sounding will also indicate a CAP, we classify a PCAP when there are two or more CAP days in a row. Knowing the number of PCAP days each year and investigating the PCAP climatology, including the number of PCAP versus CAP days for each location, can be insightful. For example, a year with a relatively dry winter could potentially have many PCAP events, as extended high pressure subsidence will increase the likelihood of PCAP events. Conversely, storms break up PCAPs resulting in fewer events, but snow cover can lead to stronger PCAP events.
The number of PCAP days by year in each location using radiosonde observations, ERA, and ERA
Adj is shown in
Figure S3. Similarly to the CAP results, the region-specific PCAP effects are apparent. In Salt Lake City, Reno, Boise, Las Vegas, Medford, Ogden, and Provo, the number of PCAP days follow a similar pattern to the number of CAP days. In Denver, there are fewer PCAP days compared to other locations, except during winter 2006–2007 and winter 2015/2016. Snow cover enhances CAP persistence due to the increased surface albedo [
21]. In Denver, based on snowfall data from the National Weather Service (NWS), 138.7 cm (54.6 in) of snowfall was recorded between 15 November 2006 and 15 February 2007. This is the second largest snowfall amount recorded over a 15 November to 15 February period since records began. Winters 2011–2012 and 2011–2012 also had significant snowfall in Denver, both of those winters also had notable increases in observed (i.e., radiosonde) CAP and PCAP days.
Another factor associated with an increase in the number of PCAP days, or increased PCAP length, is decreased precipitation, fewer storms, or drought. Drought in the western U.S. is associated with wintertime high-pressure ridges that block cyclonic activity [
22]. This blocking results in decreased storm activity and increased high-pressure subsidence that can lead to stable ABLs, resulting in CAPs with fewer opportunities to break up multi-day CAP events (i.e., PCAPs). This may explain the increase in PCAP days in Reno and Medford in winter 2013–2014. According to data from the NWS, this winter was notably dry with Reno reporting 50% of average precipitation on 15 February 2014, while Medford had received 25% of normal precipitation until early February. Fewer storms led to fewer opportunities for PCAPs to break up.
In all locations, there is significant variability in the number of PCAP days each winter. The year-to-year variability is beyond the scope of this investigation, but winters with fewer PCAPs could be associated with warmer temperatures, stormy weather, less snow cover, or cloudy CAPs, where several processes across atmospheric scales influence CAP formation and duration. There are more PCAP days using radiosondes versus ERA, as expected based on the results presented above where ERA underestimates the number of CAP events.
