Article

Hybrid VMD–BiGRU Framework for Multi-Step Forecasting of PM2.5 in Traffic-Intensive Cities of the Kingdom of Saudi Arabia

1
Department of Civil, Structural and Environmental Engineering, Trinity College Dublin, The University of Dublin, D02 PN40 Dublin, Ireland
2
Civil and Environmental Engineering Department, Faculty of Engineering—Rabigh Branch, King Abdulaziz University, Jeddah 21589, Saudi Arabia
3
Civil Engineering Department, Faculty of Engineering, Al-Baha University, Al-Baha 65779, Saudi Arabia
4
Department of Civil Engineering, Multimedia University of Kenya, P.O. Box 15653, Nairobi 00503, Kenya
5
Civil Engineering Department, Faculty of Engineering, Omdurman Islamic University, Omdurman 14416, Sudan
*
Author to whom correspondence should be addressed.
Atmosphere 2025, 16(12), 1324; https://doi.org/10.3390/atmos16121324 (registering DOI)
Submission received: 28 October 2025 / Revised: 17 November 2025 / Accepted: 20 November 2025 / Published: 24 November 2025
(This article belongs to the Section Air Quality)

Abstract

Fine particulate matter (PM2.5) poses major public health and environmental threats due to its capacity to enter deep respiratory passages and degrade urban air quality. In the Kingdom of Saudi Arabia (KSA), cities such as Riyadh, Dammam, and Jeddah show an elevated level of PM2.5 due to rapid urban growth, dense traffic activity, and wide industrial operations. This study proposes a hybrid Variational Mode Decomposition–Bidirectional Gated Recurrent Unit (VMD–BiGRU) framework for multi-horizon PM2.5 forecasts based on daily data from January 2022 to September 2024. The daily PM2.5 series was split through VMD into Intrinsic Mode Functions (IMFs) that represent multi-scale temporal patterns. A seven-day ahead forecast was carried out, and model performance was compared with VMD–GRU, VMD–LSTM, and VMD–TCN. For Riyadh, RMSE values for t + 1, t + 2, and t + 3 were 9.25, 12.26, and 16.05 µg/m3, with R2 above 0.90 up to the third day. For Dammam, RMSE values for the same horizons were 4.46, 7.24, and 11.34 µg/m3, and R2 remained above 0.90 up to the fourth day. For Jeddah, the corresponding values were 3.97, 6.09, and 9.36 µg/m3, and R2 remained above 0.90 up to the fourth day. The hybrid VMD–BiGRU model achieved higher accuracy for short horizons (t + 1 to t + 3). The study establishes a basis that aids short-term PM2.5 prediction and improves air quality assessment across major urban centers in KSA.

1. Introduction

1.1. PM2.5: The Invisible Threat

Fine particulate matter (PM2.5) is among the most hazardous air pollutants because its microscopic size and toxic composition pose a serious threat to human health and the environment [1]. These particles with diameters below 2.5 μm can bypass natural respiratory barriers, travel deep into the lungs, and cross the thin alveolar walls. Once they enter the bloodstream, these particles can cause systemic inflammation and lead to widespread adverse health effects throughout the body [2,3]. Breathing in high levels of PM2.5 over time significantly raises the risk of developing serious health conditions, including heart and lung disease, stroke, cancer, and can ultimately lead to a shorter lifespan [4,5,6]. The World Health Organization (WHO) air quality guidelines stipulate that, for PM2.5, the annual average must not exceed 5 µg/m3, and the 24 h average of 15 µg/m3 should be breached no more than 3 to 4 times annually [7].
Cities with intense traffic and high vehicular density often record elevated PM2.5 levels due to continuous exhaust emissions, tire and brake wear, and road surface abrasion [8,9]. Such urban areas frequently exceed recommended thresholds, which results in greater risks to both public health and air quality. In Gulf Cooperation Council (GCC) countries, emissions from the transportation sector, mainly from motor vehicles, form a major cause of ambient PM2.5 and related health risks. Among these nations, Qatar and Kuwait record higher PM2.5 levels compared with Oman and Bahrain. These differences reflect variation in vehicle fleet composition, fuel quality, and the strictness of emission control measures across the region [10].
In the Kingdom of Saudi Arabia (KSA), major cities such as Riyadh, Jeddah, and Dammam have PM2.5 levels that stayed elevated for most part of the year [11,12,13]. For instance, for the years 2022–2023 (Figure 1), air quality data in the Kaggle repository, taken from the General Authority of Meteorology and Environmental Protection (https://www.kaggle.com/datasets/datasetengineer/riyadh-air-quality-dataset-2021-2023-by-kapsarc/data) (accessed on 21 August 2025), shows that daily average PM2.5 levels in these three cities remained high, which can be attributed to both anthropogenic and natural sources. Major human-related emission sources include industrial production, high vehicle density, continuous urban development, and large-scale petrochemical processing [13,14]. Arid weather conditions worsen the situation. Frequent wind-blown dust events, most common in summer and at seasonal transitions, increase particulate concentration in the atmosphere. The synergistic interaction of these emissions creates complex spatio-temporal pollution profiles and presents great challenges for atmospheric modeling, regulatory compliance, and public health risk mitigation.
Consequently, the development of a reliable PM2.5 forecasting framework is important for proactive public health advisories, emission regulation, and strategic environmental management. However, the characteristically non-stationary and multi-scale nature of PM2.5 time series data necessitates the application of sophisticated modeling techniques capable of concurrently capturing both transient variations and consistent temporal patterns with high fidelity. Several recent studies have highlighted the advancement of decomposition-based, Machine Learning (ML) and hybrid Deep Learning (DL) methods for addressing the non-linear and non-stationary behavior of PM2.5 concentration data. Table 1 illustrates these representative PM2.5 forecasting studies conducted across different regions.
Although past studies on PM2.5 prediction have covered several cities across Asia, Europe, and North America, only a small group of studies has examined air quality in the KSA. ML-based PM2.5 time series analysis across KSA locations remains limited. This gap establishes the need for a framework that produces multi-horizon forecasts for major KSA cities and that captures the complex temporal structure within PM2.5 series.

1.2. Rationale of Proposed Study

This study introduces a Variational Mode Decomposition–Bidirectional Gated Recurrent Unit (VMD–BiGRU) framework [30] for the multi-step forecasting of PM2.5 concentrations across Riyadh, Jeddah, and Dammam. The VMD algorithm decomposes the original PM2.5 time series into multiple Intrinsic Mode Functions (IMFs), each representing distinct frequency components that capture underlying temporal structures and multi-scale variability [31]. Subsequently, a BiGRU network is applied to each IMF to learn bidirectional temporal dependencies, which allows the model to capture sequential relationships from both forward and backward directions within each decomposed component [32]. The hyperparameters of BiGRU are tuned via Bayesian Optimization (BO) [33]. To the best of our knowledge, this work presents the first application of a hybrid VMD–BiGRU framework optimized for multi-step PM2.5 prediction in the KSA. The proposed framework is evaluated against hybrid VMD–GRU [34], VMD–LSTM [35], and VMD–TCN [36] models for multi-horizon forecasts up to seven days ahead. The main contributions of this study are as follows:
  • Application of the VMD approach to extract multi-scale temporal components from complex PM2.5 time series data in Riyadh, Jeddah, and Dammam, KSA.
  • Development of a hybrid VMD–BiGRU framework optimized through Bayesian Optimization (BO) for short-term PM2.5 prediction.
  • Implementation of a one- to seven-day ahead multi-step forecasting scheme to evaluate short-term PM2.5 prediction performance across the three cities.
  • Comparison of the proposed VMD–BiGRU framework with competitive models, including VMD–GRU, VMD–LSTM, and VMD–TCN, to assess predictive accuracy and stability.
The reminder of the paper is organized as follows: Section 2 describes the study area, dataset, and theoretical foundation of the VMD–BiGRU framework. Section 3 shows the model implementation, experimental setup, and performance evaluation process. Section 4 concludes the study with key findings, recommendations, and limitations.

2. Materials and Methods

2.1. Study Location and Data

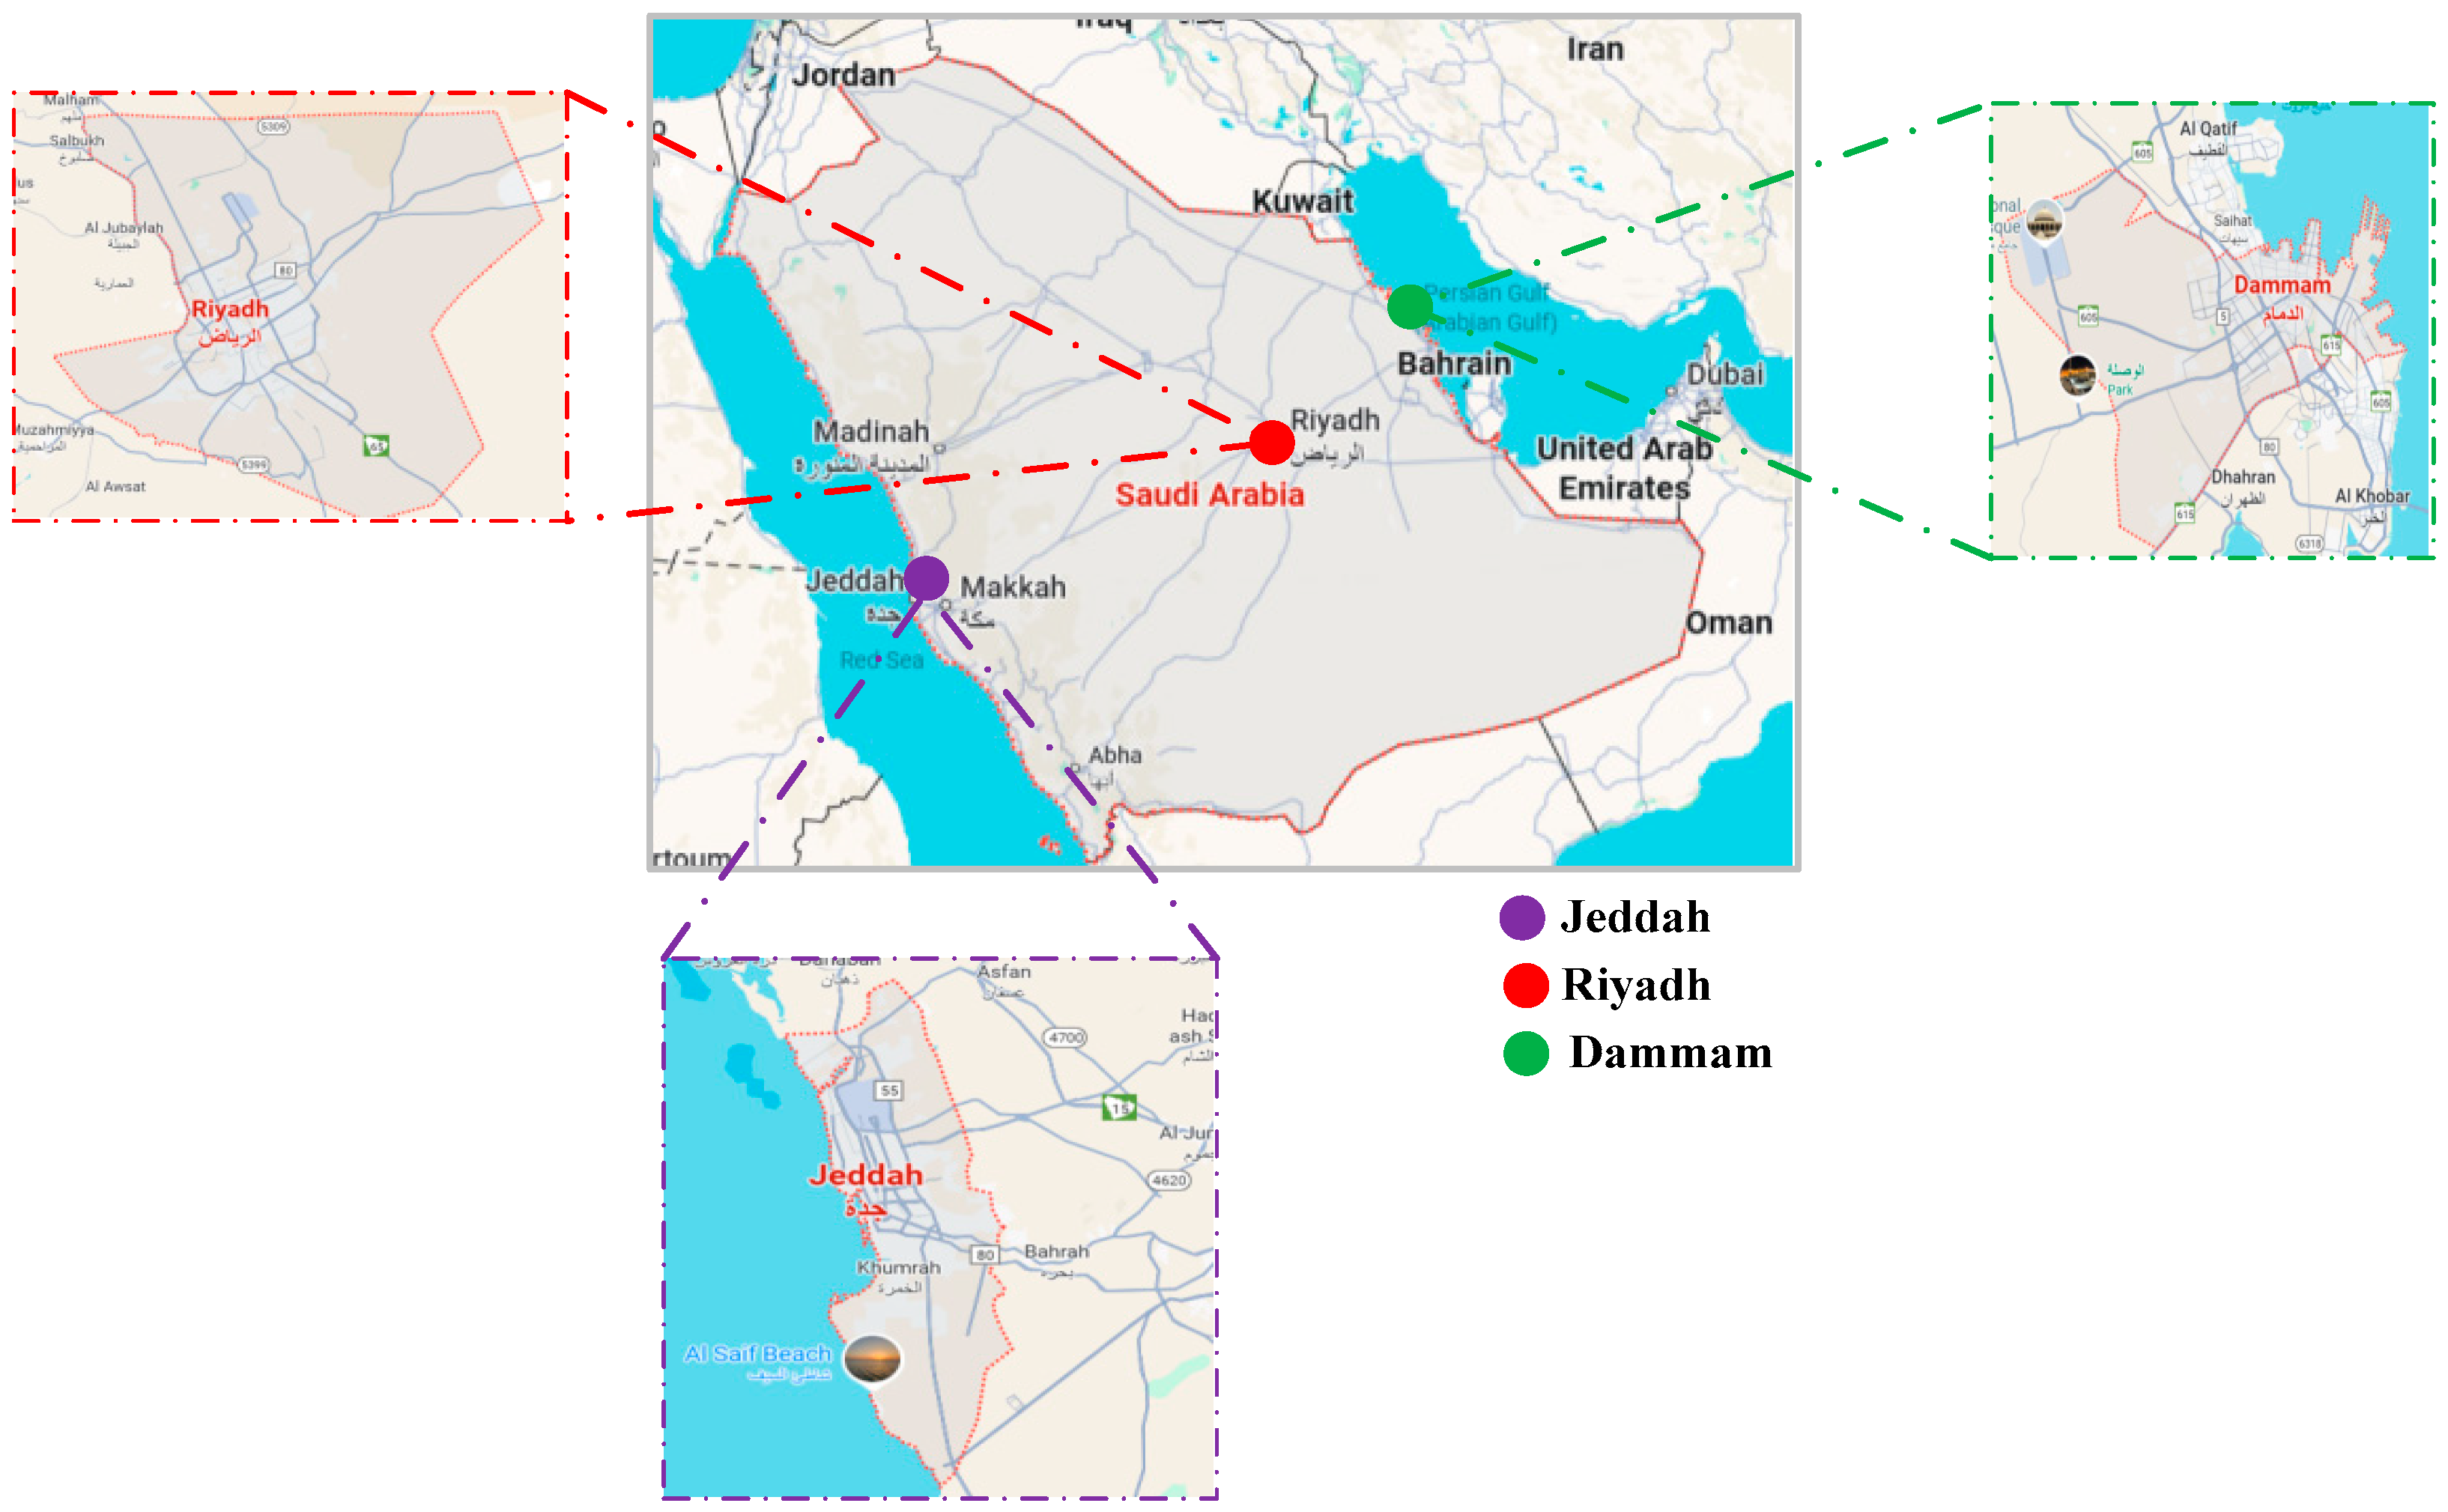
This study analyzes air quality data from three major cities in the KSA including the capital Riyadh, the coastal commercial hub Jeddah, and the eastern province industrial center Dammam. The dataset comprises daily PM2.5 measurements from January 2022 through September 2024, sourced from the General Authority of Meteorology and Environmental Protection. The dataset is available through the Kaggle repository as discussed in Section 1.1. Each of the three major cities holds a geographically strategic position that shapes its air quality characteristics, as depicted in Figure 2. Riyadh is located at 24.7136° N, 46.6753° E and serves as the capital city of KSA. It experiences elevated PM2.5 concentrations primarily driven by dense traffic networks, extensive construction activities, power generation demands, and surrounding industrial zones [37]. Jeddah is located at 21.4858° N, 39.1925° E. It is the main commercial hub on the western coast and gateway to the holy city of Makkah [14,38]. The PM2.5 levels of the city are significantly affected by vehicular emissions from intense commercial activity, port operations along the Red Sea, and frequent dust resuspension driven by coastal wind. Similarly, Dammam is located at 26.3927° N, 49.9777° E. It is a major industrial and port city on the eastern coast, which has a significant PM2.5 emission profiles dominated by petrochemical industries, heavy transport networks, and extensive marine operations associated with Gulf port activities [39].
The spatial diversity, economic activity, and climatic variation across these three cities provide a comprehensive basis for analyzing PM2.5 behavior under different environmental and anthropogenic conditions. The availability of continuous multi-year observations allows a detailed assessment of temporal dynamics and the development of data-driven prediction models. Based on this foundation, the next section presents the theoretical structure and formulation of the proposed VMD–BiGRU framework for multi-step PM2.5 prediction.

2.2. Theoretical Overview of the VMD–BiGRU Framework

The proposed VMD–BiGRU framework combines signal decomposition and bidirectional DL to perform multi-step PM2.5 time series forecasting. The framework consists of three key stages: (1) VMD approach for the generation of optimal IMFs; (2) BiGRU-based learning for modeling temporal dependencies within each IMF and its hyperparameter tuning via BO; and (3) Signal reconstruction to obtain the final predicted PM2.5 series.

2.2.1. PM2.5 Time Series Decomposition via VMD

The first stage of the proposed hybrid framework functions as a signal preprocessing module, which decomposes the original PM2.5 time series into a set of finite, band-limited IMFs, each associated with a distinct frequency component. This decomposition improves feature distinction, reduces spectral overlap, and strengthens the model capability to extract temporal patterns. VMD aims to decompose a real-valued input signal y ( t ) into L sub-signals v l ( t ) l = 1 L , each centered around an estimated angular frequency ψ l . The constrained variational formulation is expressed in Equation (1).
min v l , Ψ l l = 1 L t η t + j π t × v l t e j ψ l t 2 2 s . t .   l = 1 L v l t = y t
The goal of Equation (1) is to identify the optimal set of modes v l t that collectively reconstruct the original signal while minimizing the overall bandwidth across modes. To solve this constrained problem, an augmented Lagrangian formulation is introduced, transforming the constrained optimization into an unconstrained one for iterative computation, as in Equation (2).
γ v l , ψ l , λ =   α l = 1 L t η t + j π t × v l t e j ψ l t 2 2 + y t l = 1 L v l t 2 2 + λ t , y t l = 1 L v l t
where α represents the quadratic penalty factor that enforces the narrowband constraint, and λ t is the Lagrange multiplier used for penalizing reconstruction errors.

2.2.2. BO-Optimized BiGRU-Based LEARNING

Following the VMD decomposition in Section 2.2.1, each IMF is used as an independent input sequence to a BiGRU network. This step focuses on temporal modeling and prediction for each component, where the BiGRU captures the dynamic dependencies within both forward and backward time directions. The purpose of applying BiGRU to each IMF is to extract short- and long-term temporal relations embedded within the decomposed sub-series. The bidirectional mechanism improves predictive accuracy by using temporal information from both past and future observations within each IMF before aggregation.
Let v l ( t ) denote the l th IMF derived from the VMD step. For each IMF, the BiGRU processes sequential input data v l ( t ) t = 1 T , where T is the total number of time steps. The BiGRU cell consists of two gating units, i.e., the update gate and the reset gate that regulate the flow of information across time. The update gate, Z t , controls how much of the past state should be carried forward to the current state, defined as Equation (3).
Z t = σ W z v l t + U z H t 1 + b z
where W z and U z are the weight matrices for the input and hidden layers, b z is the bias vector, H t 1 denotes the previous hidden state.
A higher Z t value indicates stronger retention of historical information, while lower values emphasize new input features. The reset gate, R t , determines how much of the previous information should be forgotten when processing new input as shown in Equation (4).
R t = σ W r v l t + U r H t 1 + b r
This gate provides selective memory reset that helps the model adapt to abrupt variation in PM2.5 levels often caused by meteorological fluctuation or emission events. After applying the reset operation, a candidate activation H ~ t is computed using Equation (5).
H ~ t = tanh W h v l t + U h R t H t 1 + b h
where tanh denotes the hyperbolic tangent activation introducing non-linearity, and represents element-wise multiplication.
This candidate state integrates the new input with selectively filtered memory from previous states. The final hidden state at time t is then updated by interpolating between the previous hidden state and the candidate activation, controlled by the update gate as shown in Equation (6).
H t = 1 Z t H t 1 + Z t H ~ t
This adaptive combination allows the BiGRU to balance between memory preservation and new information assimilation as well as allows stability and responsiveness in sequential learning.
To optimize predictive performance and avoid manual hyperparameter tuning, BO is employed to determine the optimal BiGRU configuration [40], which includes learning rate, number of hidden units, batch size, and dropout rate. The optimization objective is formulated as Equation (7).
θ = arg min θ Θ   E p f | D f θ
where θ represents the set of BiGRU hyperparameters, f θ denotes the validation loss function, p f | D is the posterior distribution over the objective function given prior evaluations.
The Bayesian framework applies a Gaussian Process (GP) as a probabilistic surrogate model to balance exploration and exploitation during the optimization phase. The GP forms a posterior distribution over the objective function and locates areas of the parameter space with high potential for improvement while avoiding evaluations in less promising regions. This adaptive search process leads to faster convergence toward the optimal parameter set that reduces forecast error and improves both accuracy and computational efficiency in model tuning [41,42].

2.2.3. Predicted Signal Reconstruction

After the decomposition and temporal modeling stages, the final step of the proposed framework involves reconstructing the predicted PM2.5 signal from the outputs of all IMF-specific BiGRU sub-models. Each IMF, decomposed through VMD and independently forecasted using an optimized BiGRU, represents a distinct frequency component of the original signal. The reconstruction step aggregates these predicted components to form the final PM2.5 concentration forecast. Let v ^ 1 t , v ^ 2 t , , v ^ L t denote the predicted IMFs corresponding to the L decomposed modes obtained from the BiGRU models. The final predicted PM2.5 series, y ^ t , is expressed as the sum of all predicted components as shown in Equation (8).
y ^ t = l = 1 L v ^ l t
where y ^ t is the reconstructed PM2.5 concentration at time t, v ^ l t is the predicted value of the l th IMF

2.3. Performance Measures

The performance of the proposed hybrid VMD-BiGRU framework was assessed using four standard evaluation measures including Mean Absolute Error (MAE), Mean Squared Error (MSE), Root Mean Squared Error (RMSE), and the coefficient of determination (R2) as shown in Table 2. Each of these measures reflects a different dimension of predictive accuracy and quantifies how much the predicted PM2.5 values differ from the actual observations.

3. Results and Discussion

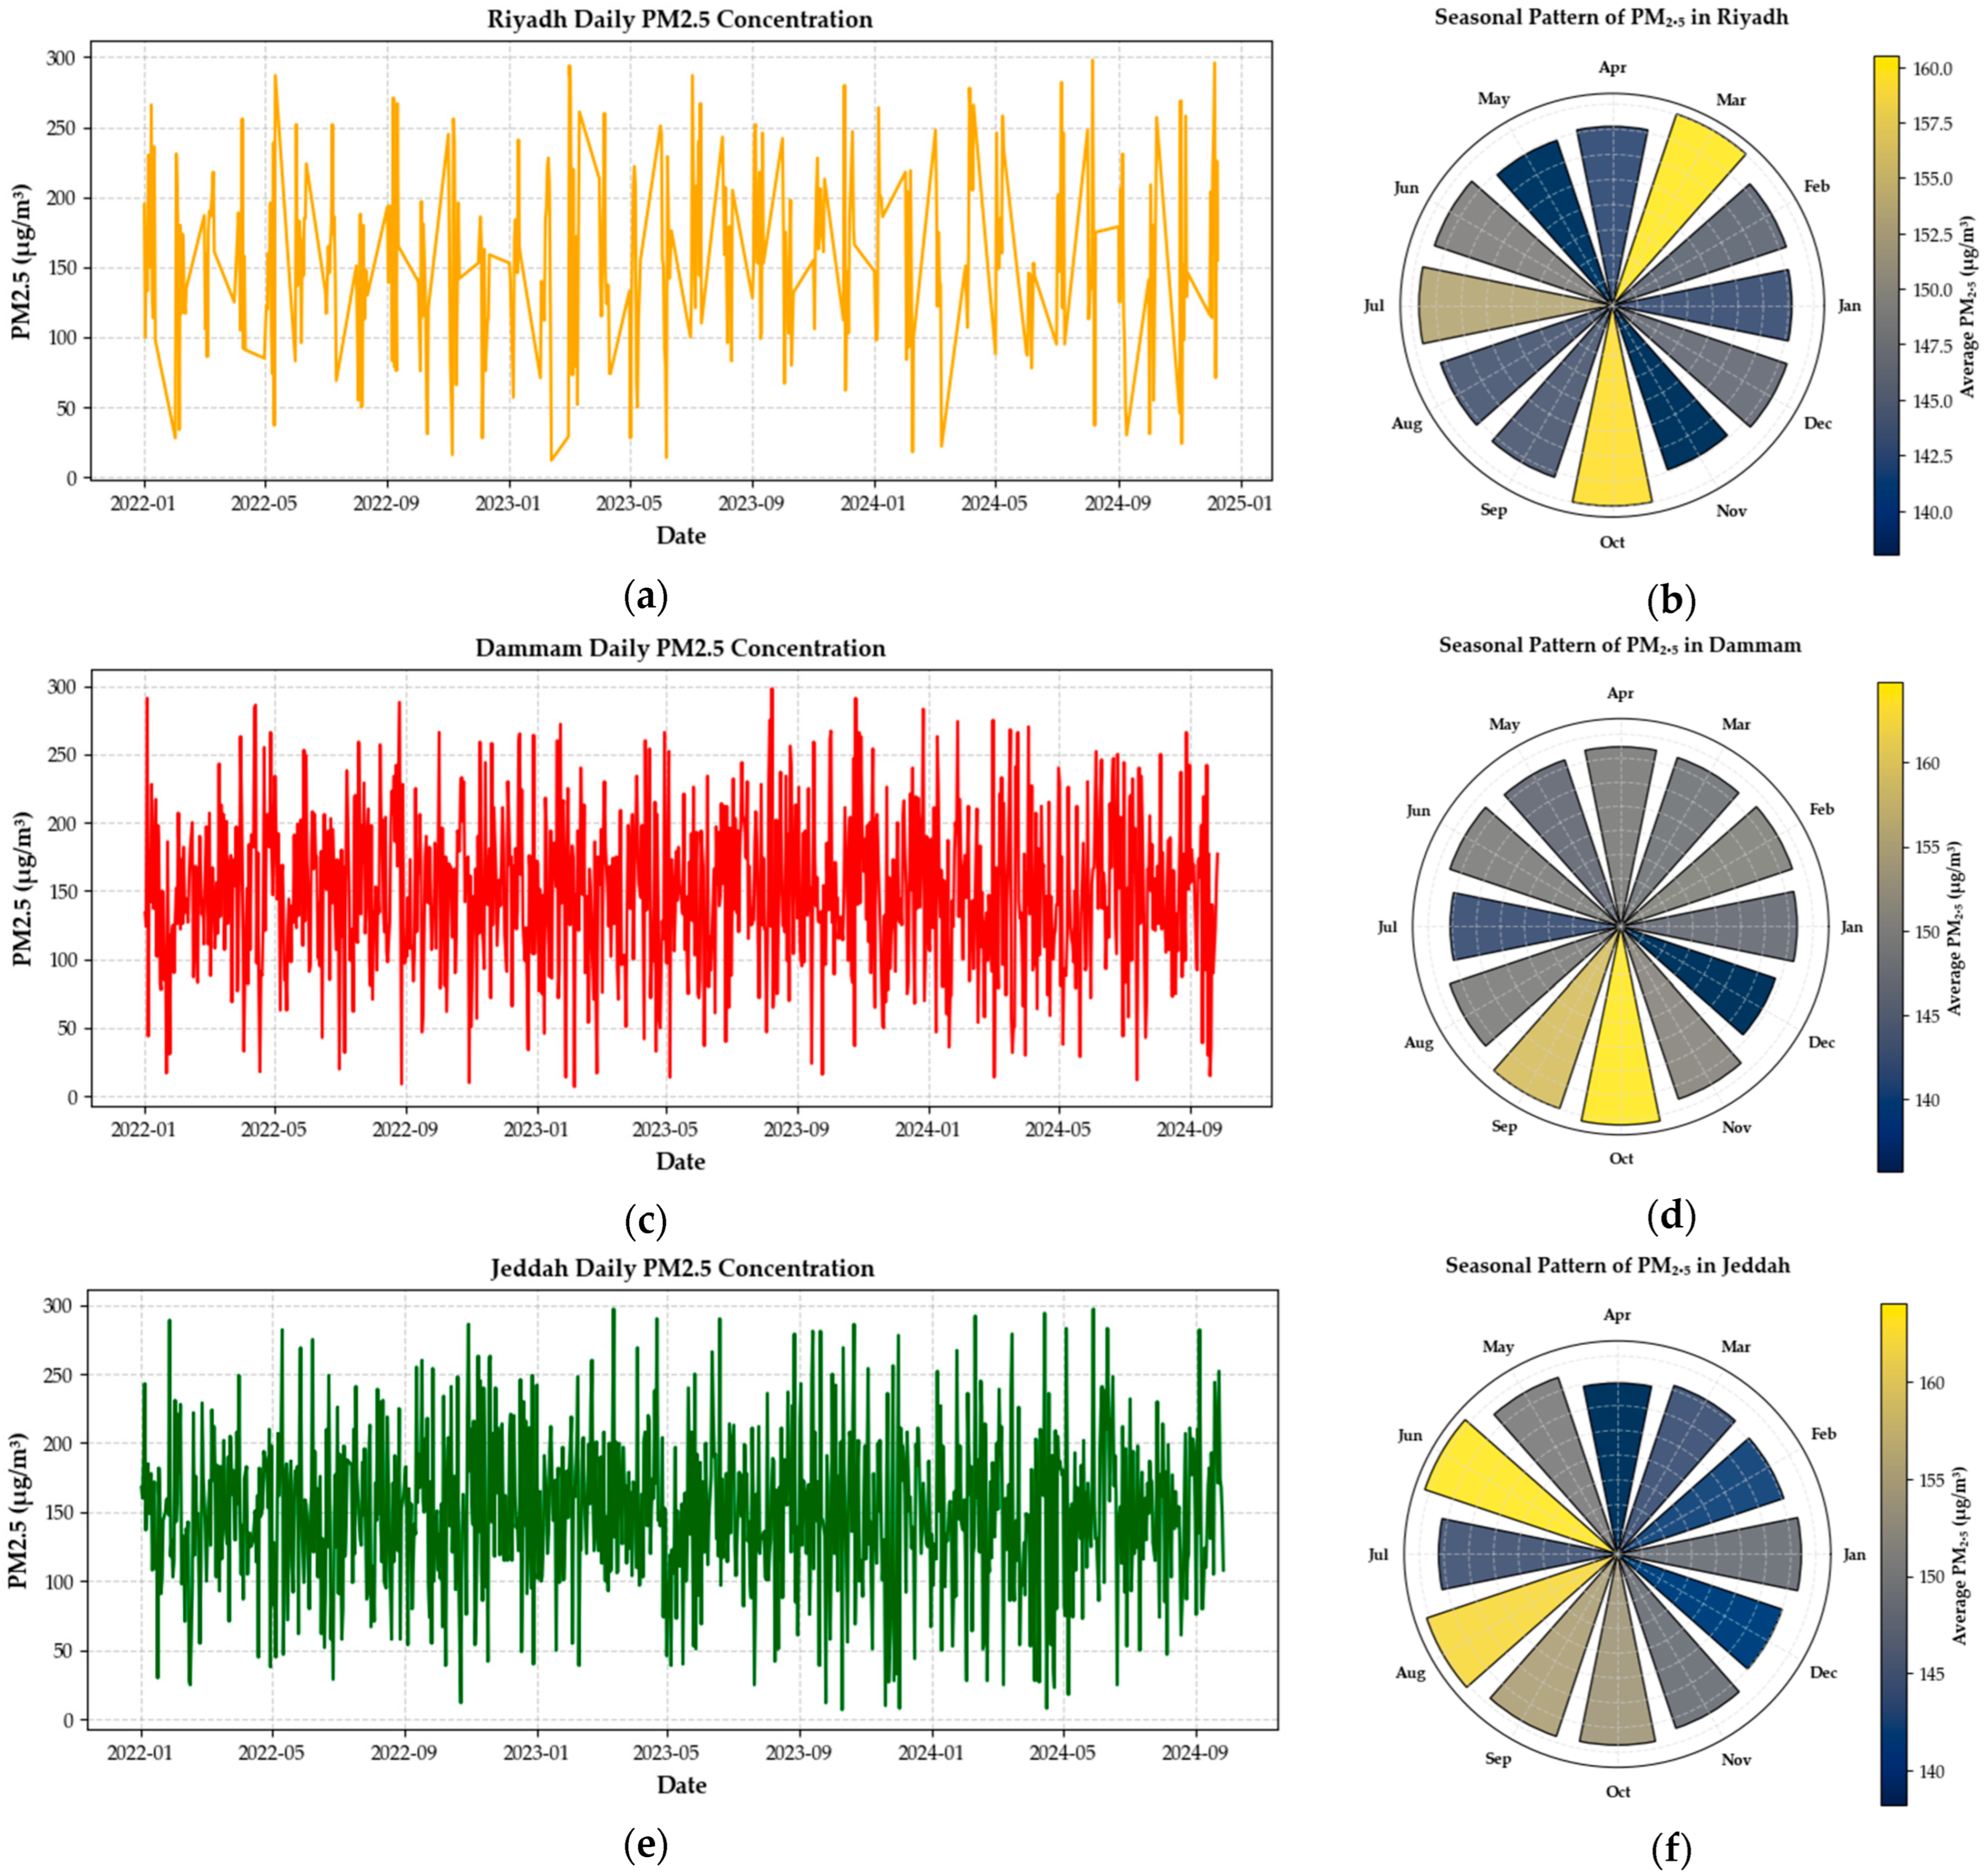
The average daily PM2.5 concentration profiles for Riyadh, Dammam, and Jeddah from 2022 to 2024 show clear temporal variations across all three cities. Figure 3 indicates that PM2.5 levels generally range between 50 µg/m3 and 250 µg/m3, reflecting repeated high pollution episodes. Among these cities, Riyadh shows the widest daily variation, influenced by heavy traffic, industrial activity, and dust resuspension. Dammam maintains a more stable yet high baseline, which reflects the impact of petrochemical industries and port operations along the Gulf coast. In contrast, Jeddah records lower peaks, which suggests partial dispersion from coastal winds and sea breezes.
The seasonal polar plots in Figure 3 further illustrate the monthly variations in PM2.5. Riyadh records higher concentrations during winter and early spring (January–March) due to weaker wind circulation and temperature inversions that restrict pollutant dispersion. Dammam reaches its peak during late summer and early autumn (August–October), likely because of stagnant weather and industrial activity along the coast. Jeddah shows higher concentrations from spring to early summer (April–July), which can be linked to regional dust inflow and limited dispersion caused by coastal air circulation.
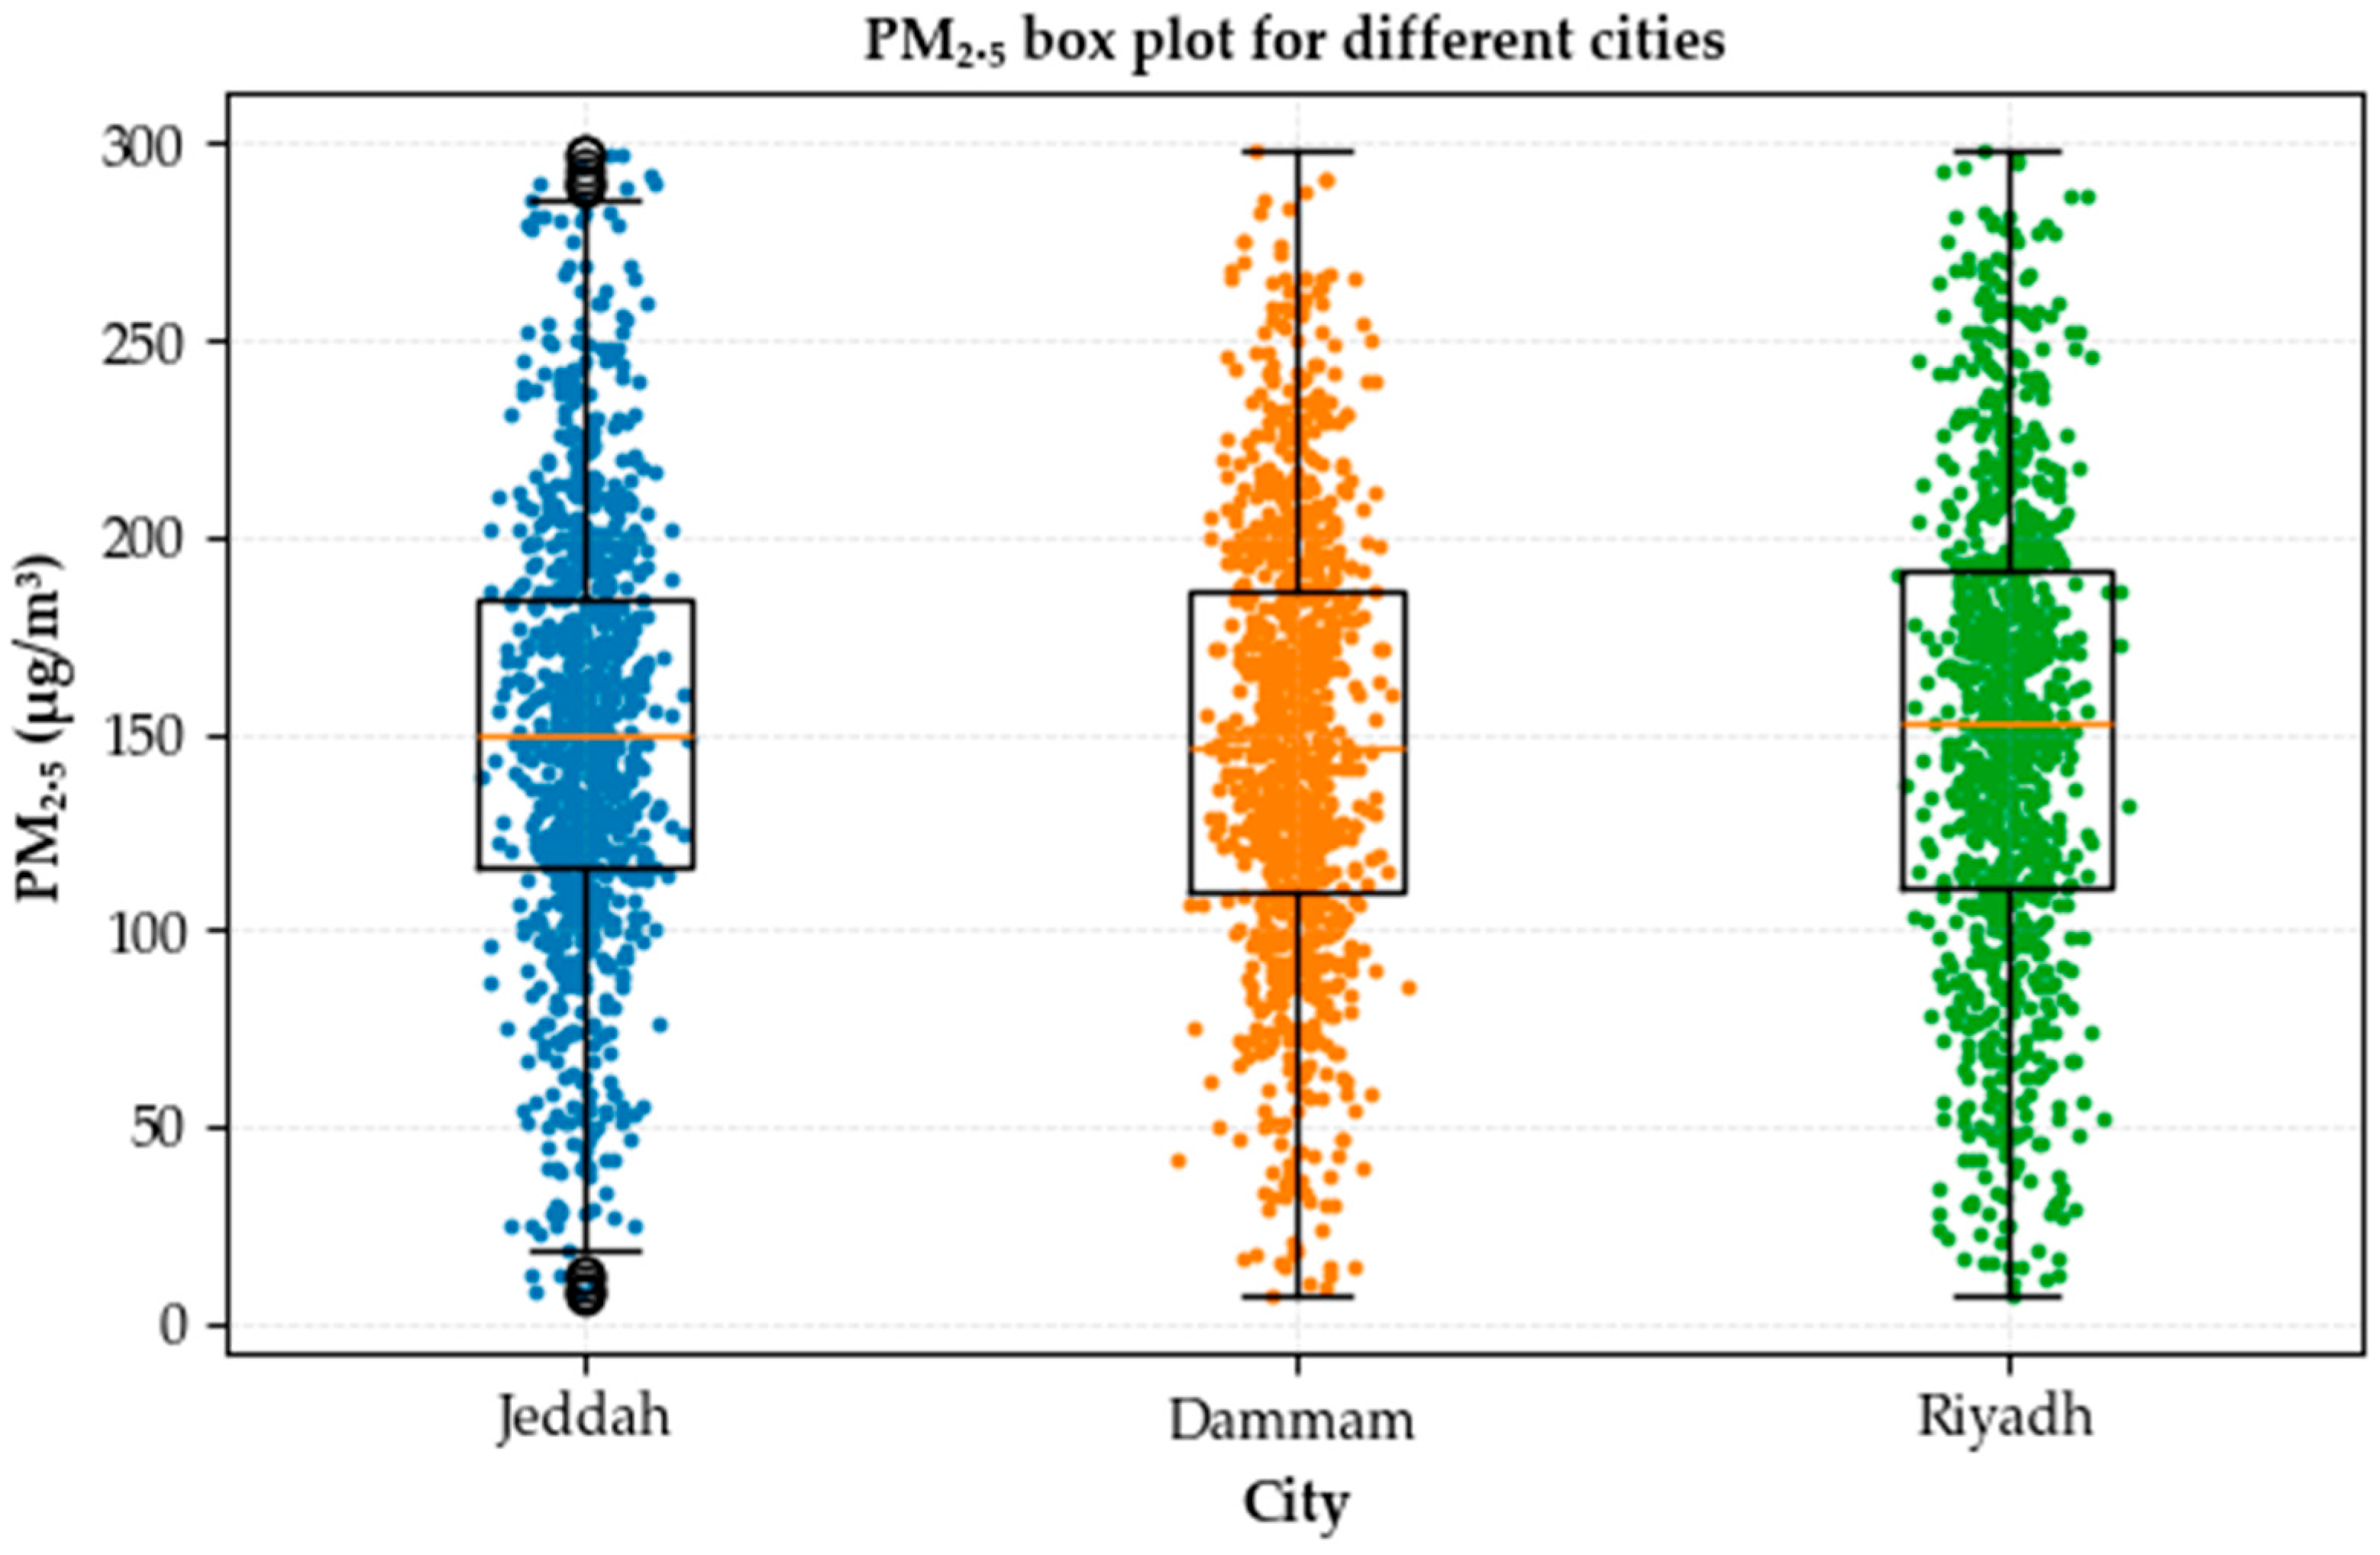
Furthermore, Figure 4 shows that the overall PM2.5 patterns for Riyadh, Dammam and Jeddah remain broadly similar, with all three cities recording values from close to 0 µg/m3 up to nearly 300 µg/m3. The central boxes for each city fall within roughly 130–180 µg/m3, and the medians lie near the middle of these ranges. Slight differences appear in the spread, with Riyadh showing a marginally wider distribution, Dammam holding a moderate range and Jeddah presenting a slightly more compact pattern. Despite these minor variations, the three cities display comparable upper and lower limits, which shows no large difference in PM2.5 concentration patterns across the observed period.
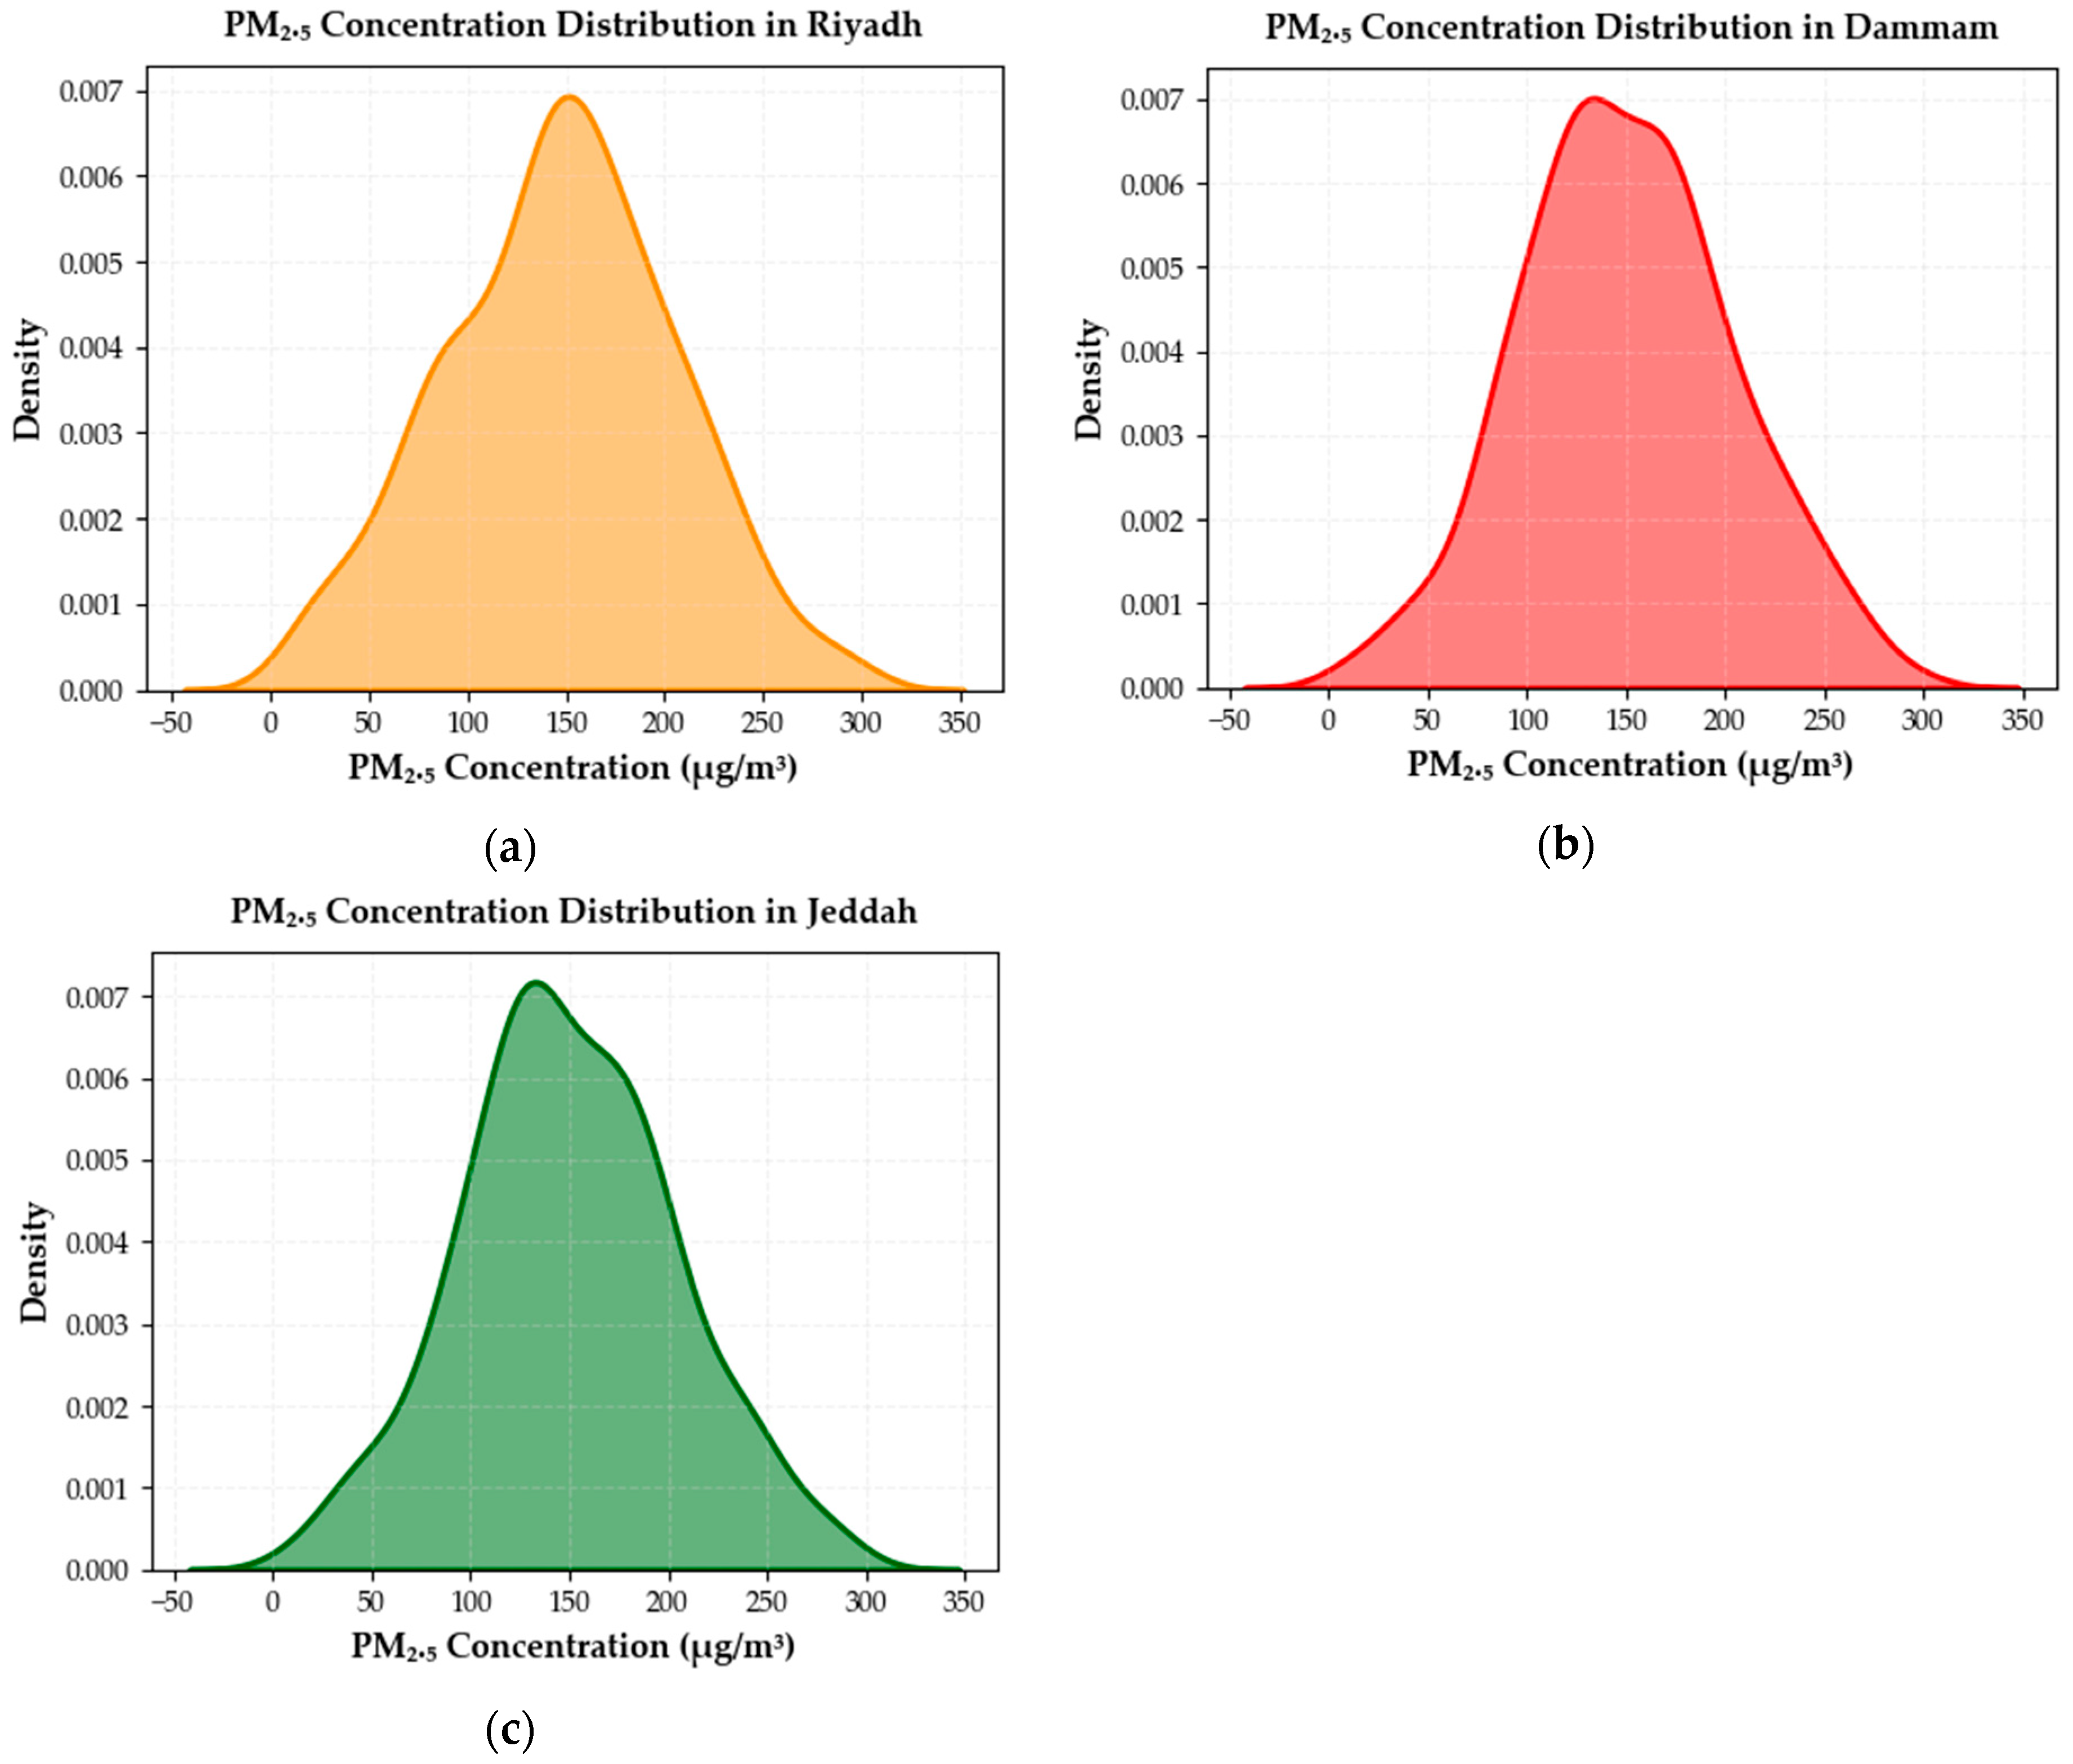
The probability density distributions of PM2.5 concentrations for Riyadh, Dammam, and Jeddah are shown in Figure 5. All three cities display a single dominant peak within the range of 120–150 µg/m3, which shows that most daily PM2.5 values lie in this interval. The curve for Riyadh has a slightly wider spread that reflects greater fluctuation and higher extreme values, while those for Dammam and Jeddah are narrower and indicate a tighter concentration range. The peak heights are nearly the same for all three cities, but the right tails extend toward higher concentration values, which reveals the presence of high-pollution days in each location.

3.1. Multi-Horizon Performance Assessment of VMD-BiGRU Framework

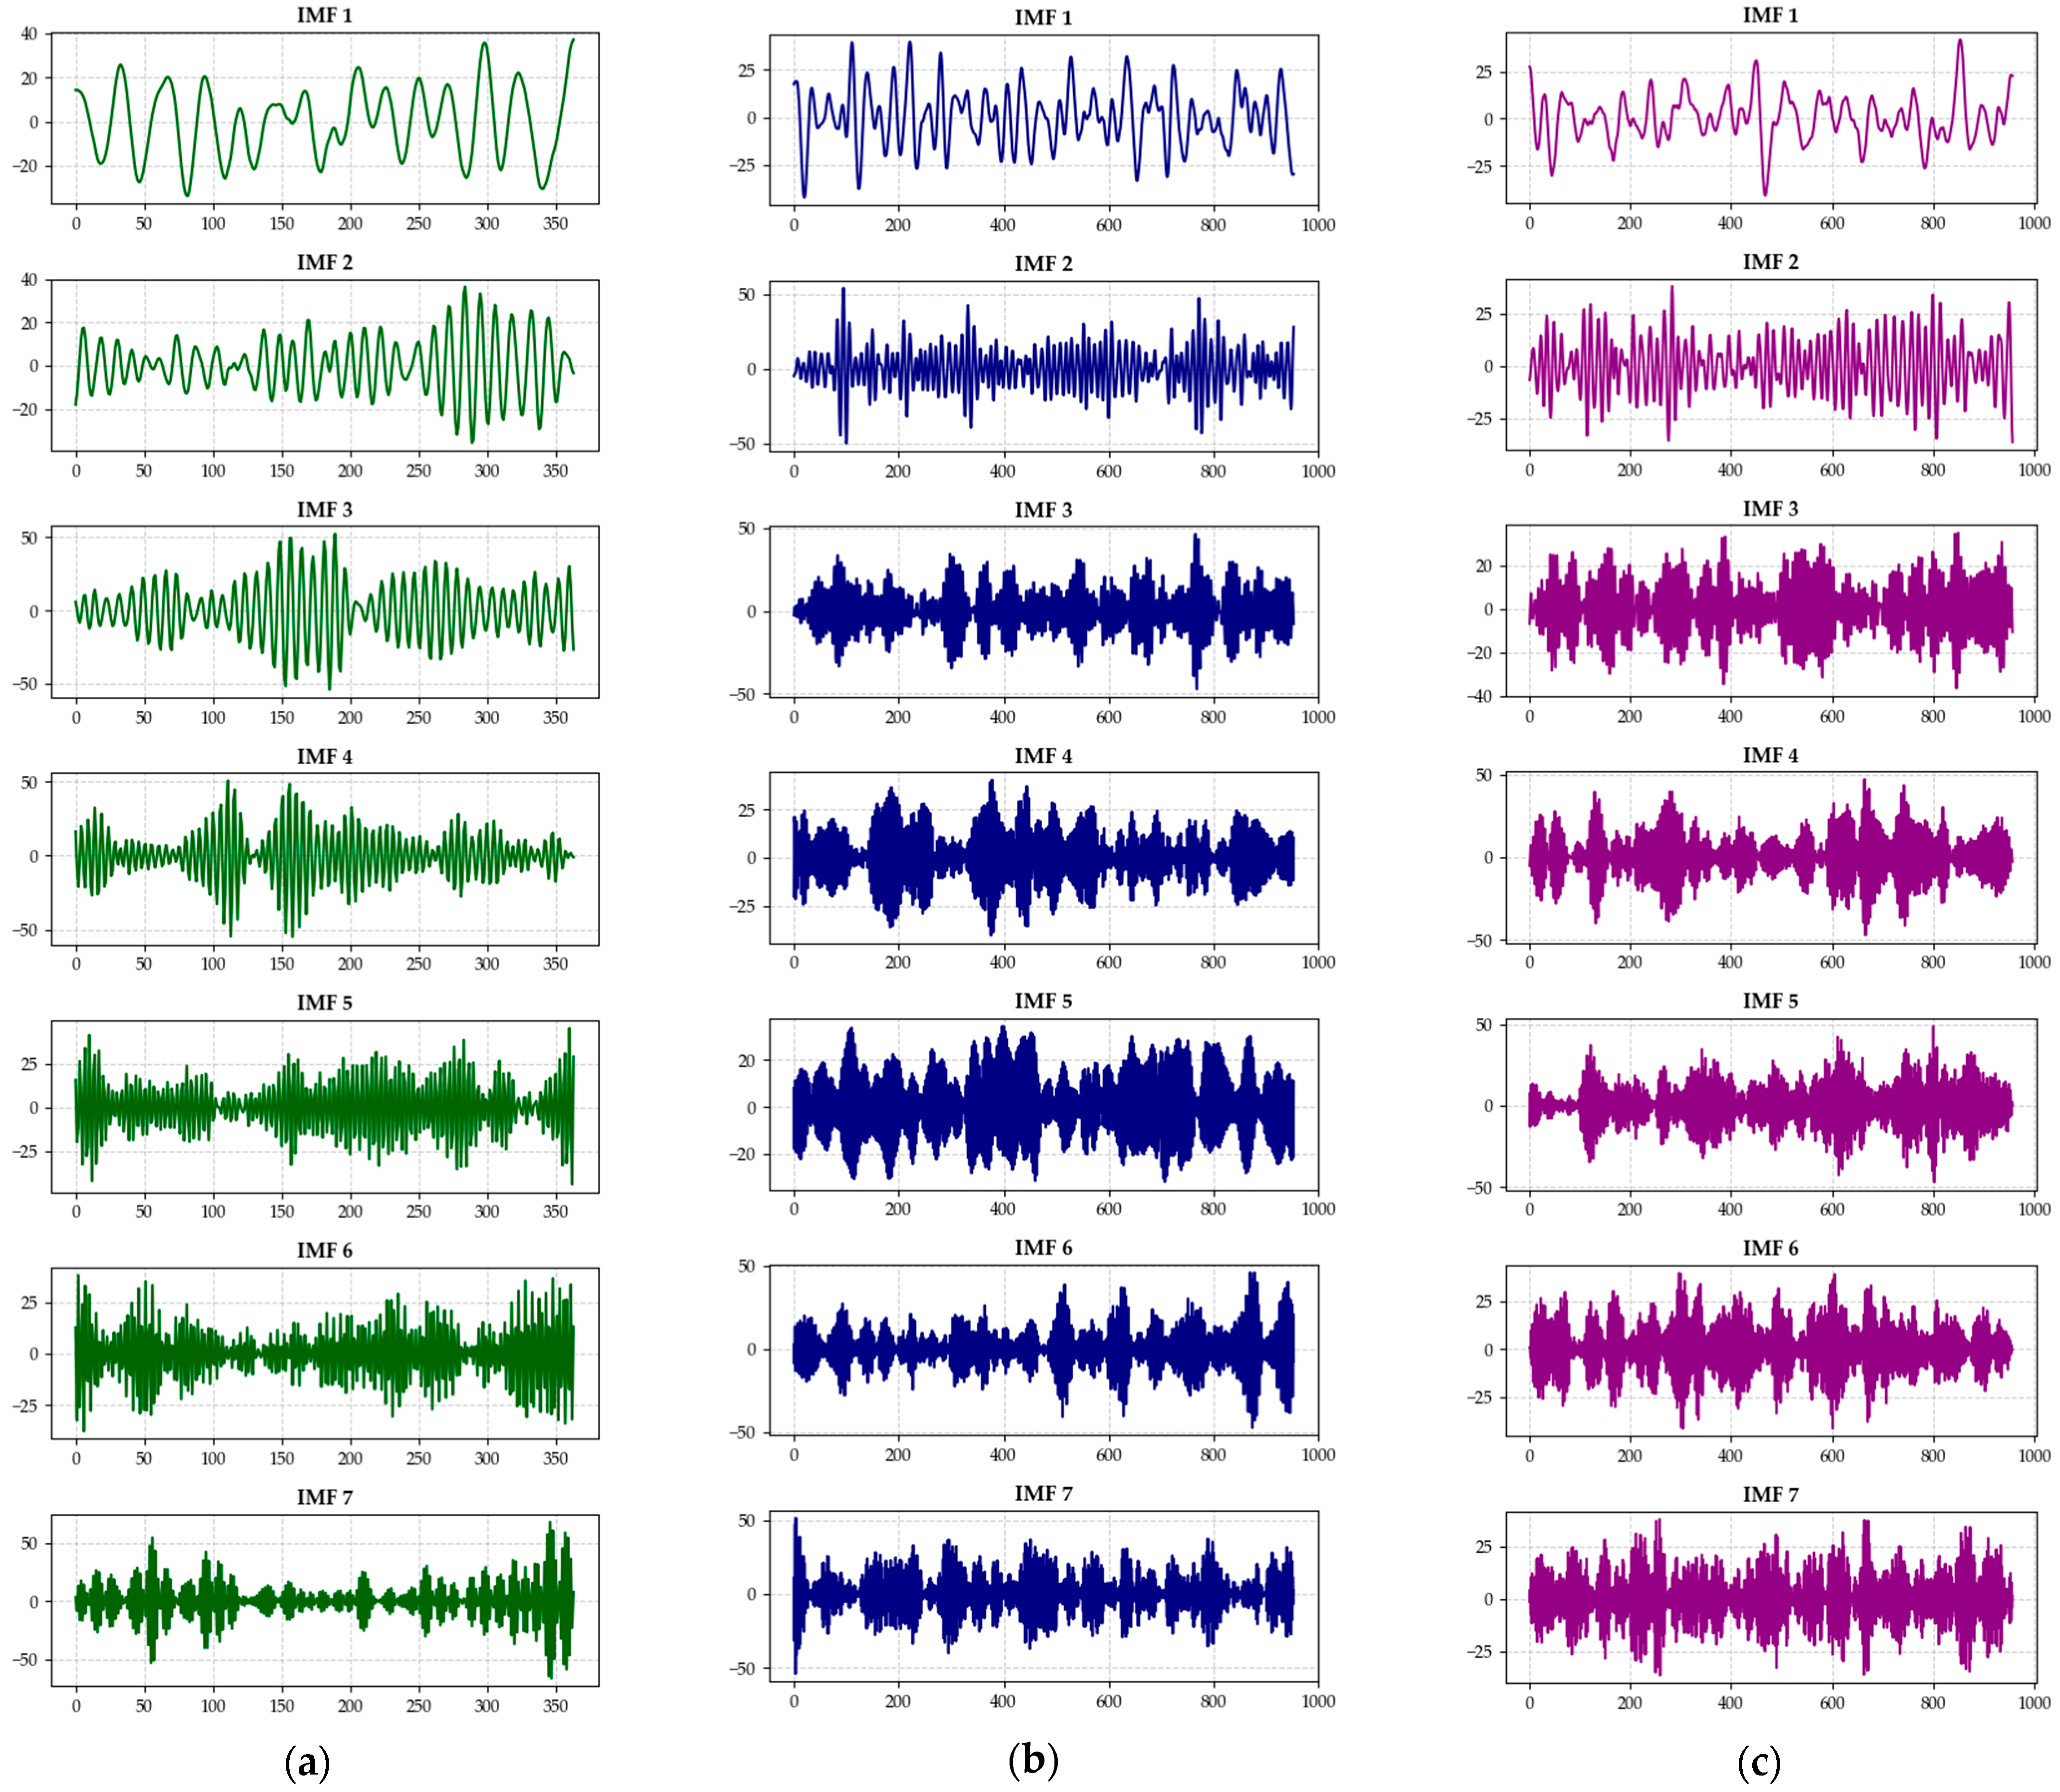
To better analyze the complex temporal patterns in PM2.5 concentration data, the original signals for Riyadh, Dammam, and Jeddah were decomposed into seven optimal IMFs using the VMD strategy, as shown in Figure 6. This decomposition separates the composite signal into multiple frequency components, which helps in identifying both short-term and long-term variations in air quality. Each IMF represents a distinct frequency mode within the original signal. IMF1 and IMF2 capture high-frequency oscillations that correspond to short-term fluctuations in PM2.5 levels, while IMF3 to IMF5 represent medium-frequency variations associated with weekly or monthly changes. The final components, IMF6 and IMF7, show low-frequency patterns that illustrate long-term trends and gradual baseline shifts.
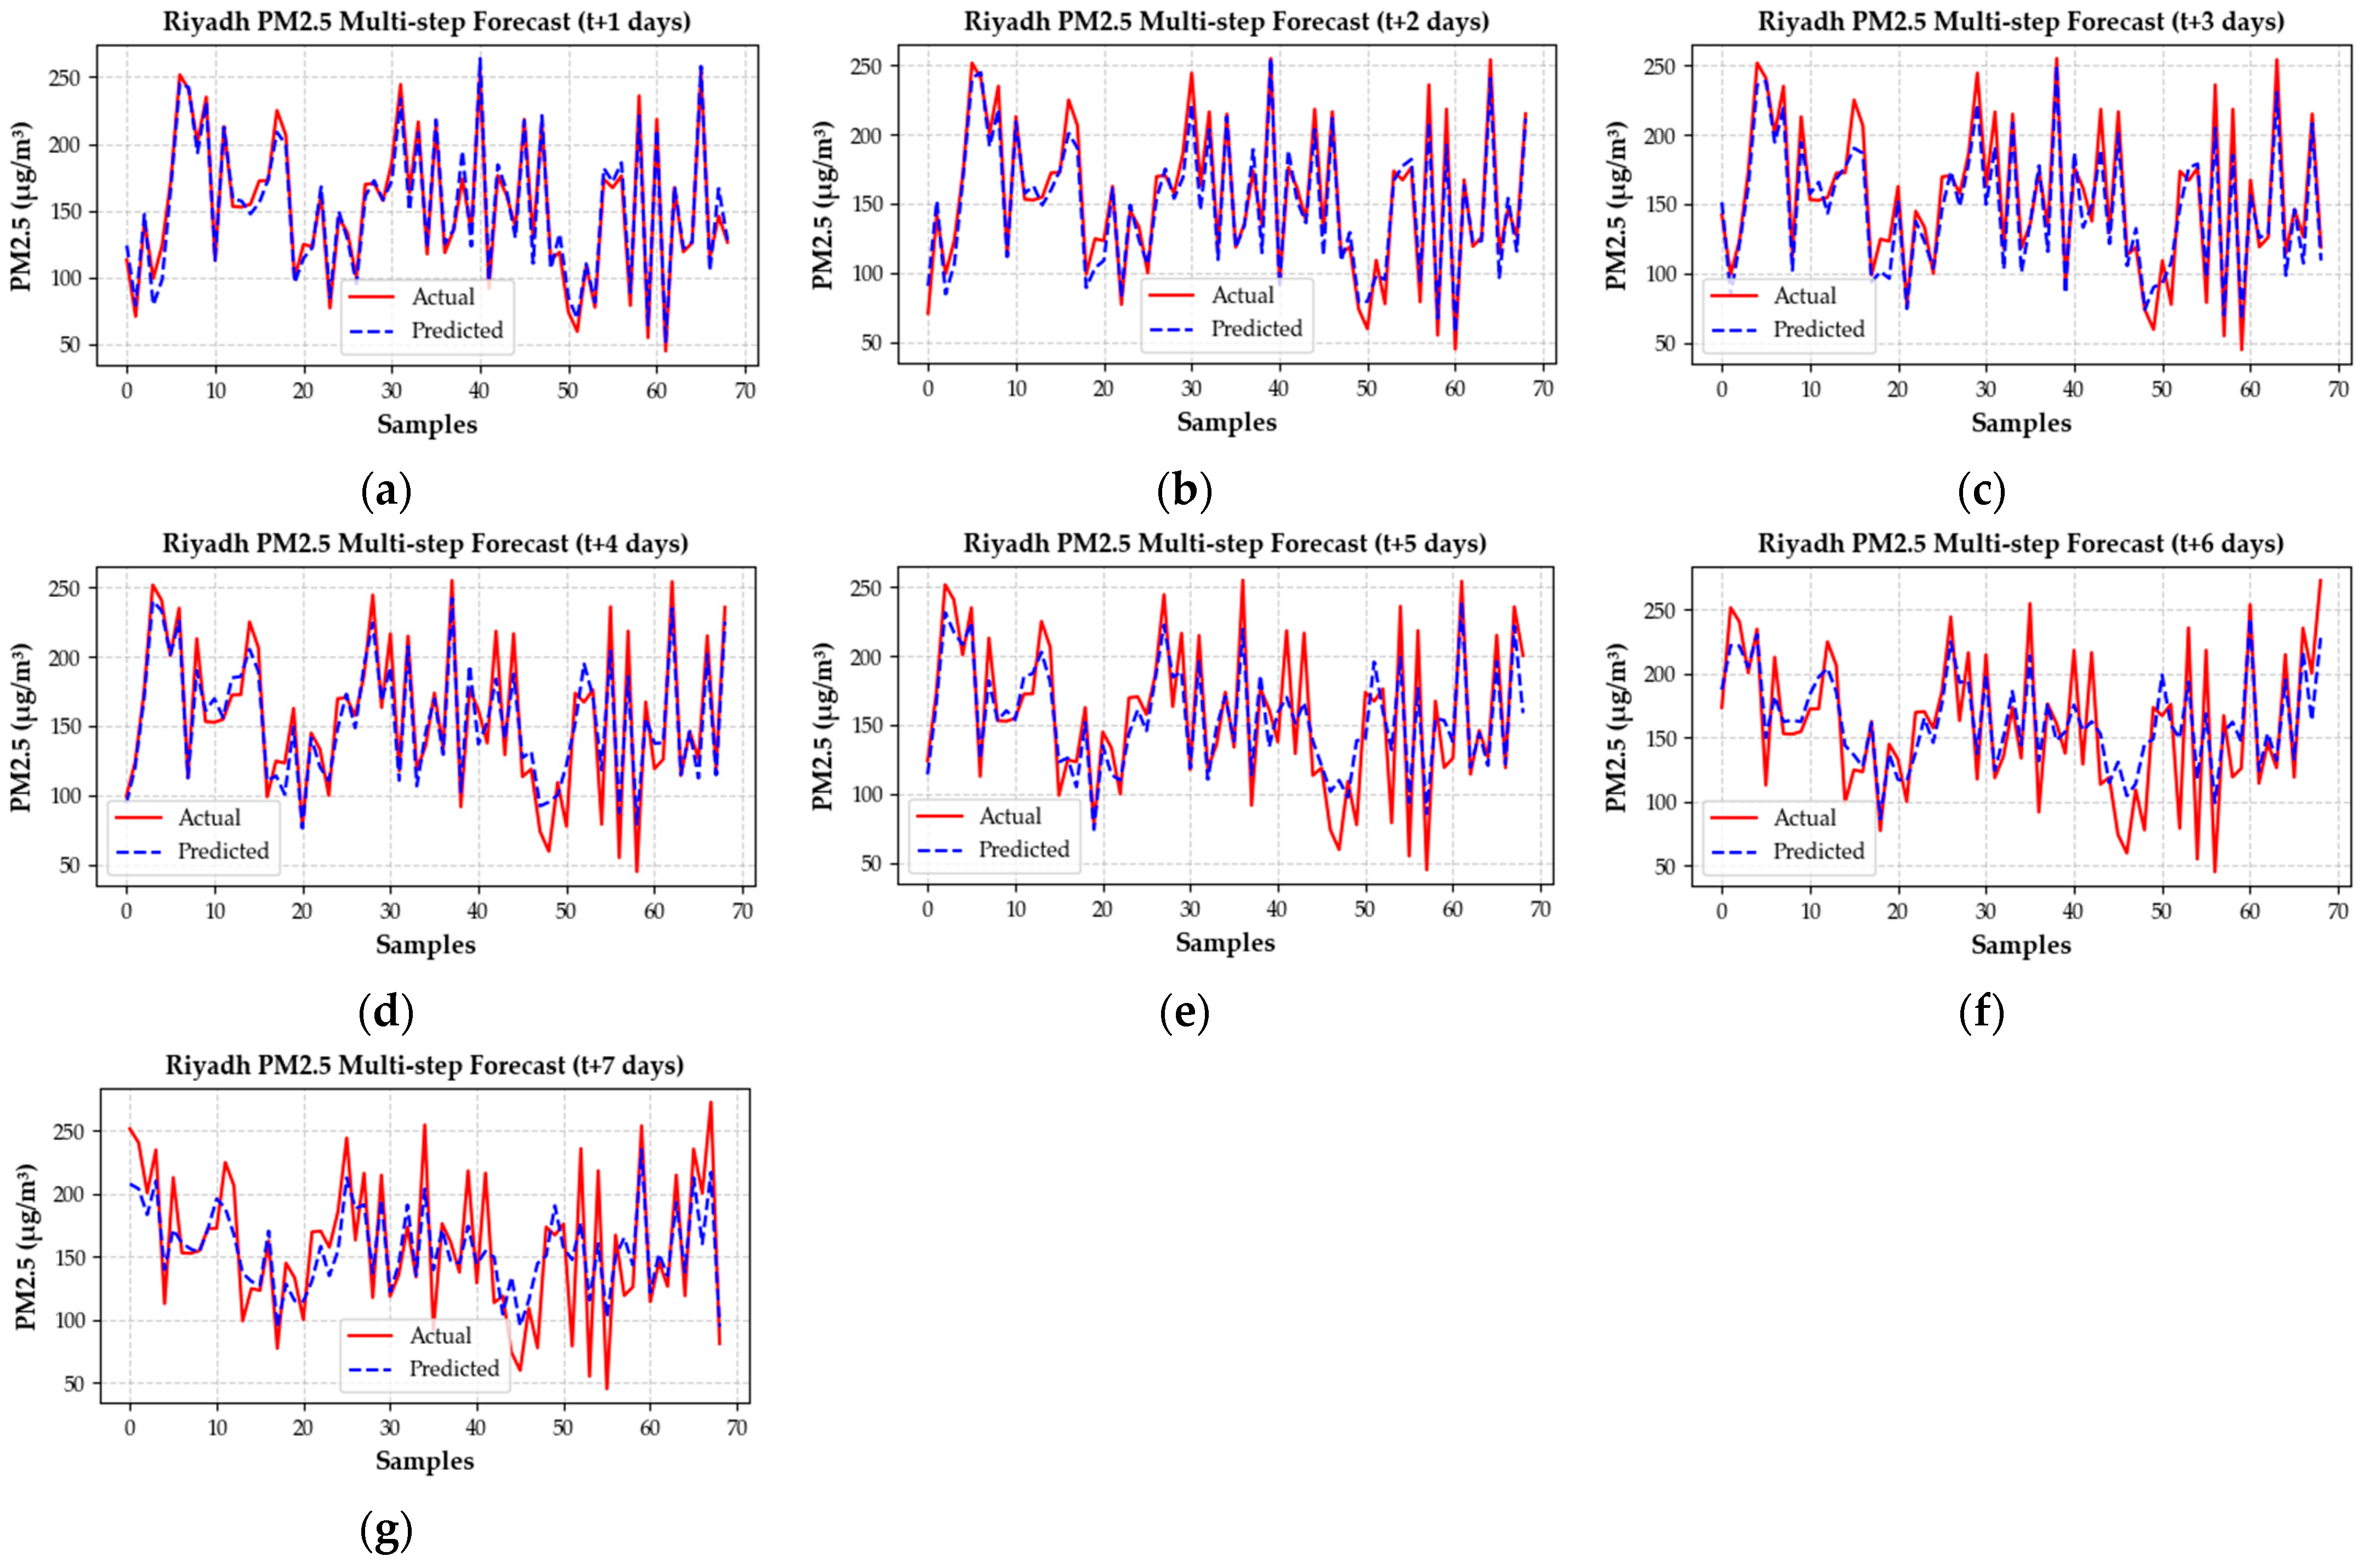
The performance assessment of the VMD–BiGRU model for Riyadh is summarized in Table 3. The results show that the model achieves strong predictive accuracy across short-term horizons, with an RMSE of 9.25 µg/m3, MAE of 7.37 µg/m3, and R2 of 0.969 for the one-day-ahead forecast (t + 1). As the forecast horizon extends, a gradual increase in error values is evident, accompanied by a steady decline in model fit. The RMSE rises from 9.25 µg/m3 at t + 1 to 32.03 µg/m3 at t + 7, while the MAE increases from 7.37 µg/m3 to 26.21 µg/m3, which represented a relative rise of about 3.5 times over the forecast range. The R2 value decreases from 0.969 at t + 1 to 0.664 at t + 7, which indicates that the predictive strength weakens as the horizon lengthens.
Figure 7 presents the multi-step forecasting performance of the VMD–BiGRU model for Riyadh from one to seven days ahead. The model shows strong alignment between the actual and predicted PM2.5 values for short-term horizons (t + 1 to t + 3), where both curves follow similar fluctuation patterns with minimal deviation. As the forecast horizon extends (t + 4 to t + 7), the prediction still follows the overall trend of the observed data, though slight increases in residual variance and peak mismatches appear, which is expected for longer-term forecasts. The model accurately tracks the main peaks and troughs up to the seventh day, which indicates that the VMD–BiGRU framework captures both short-term variations and broader temporal behavior of PM2.5 levels in Riyadh.
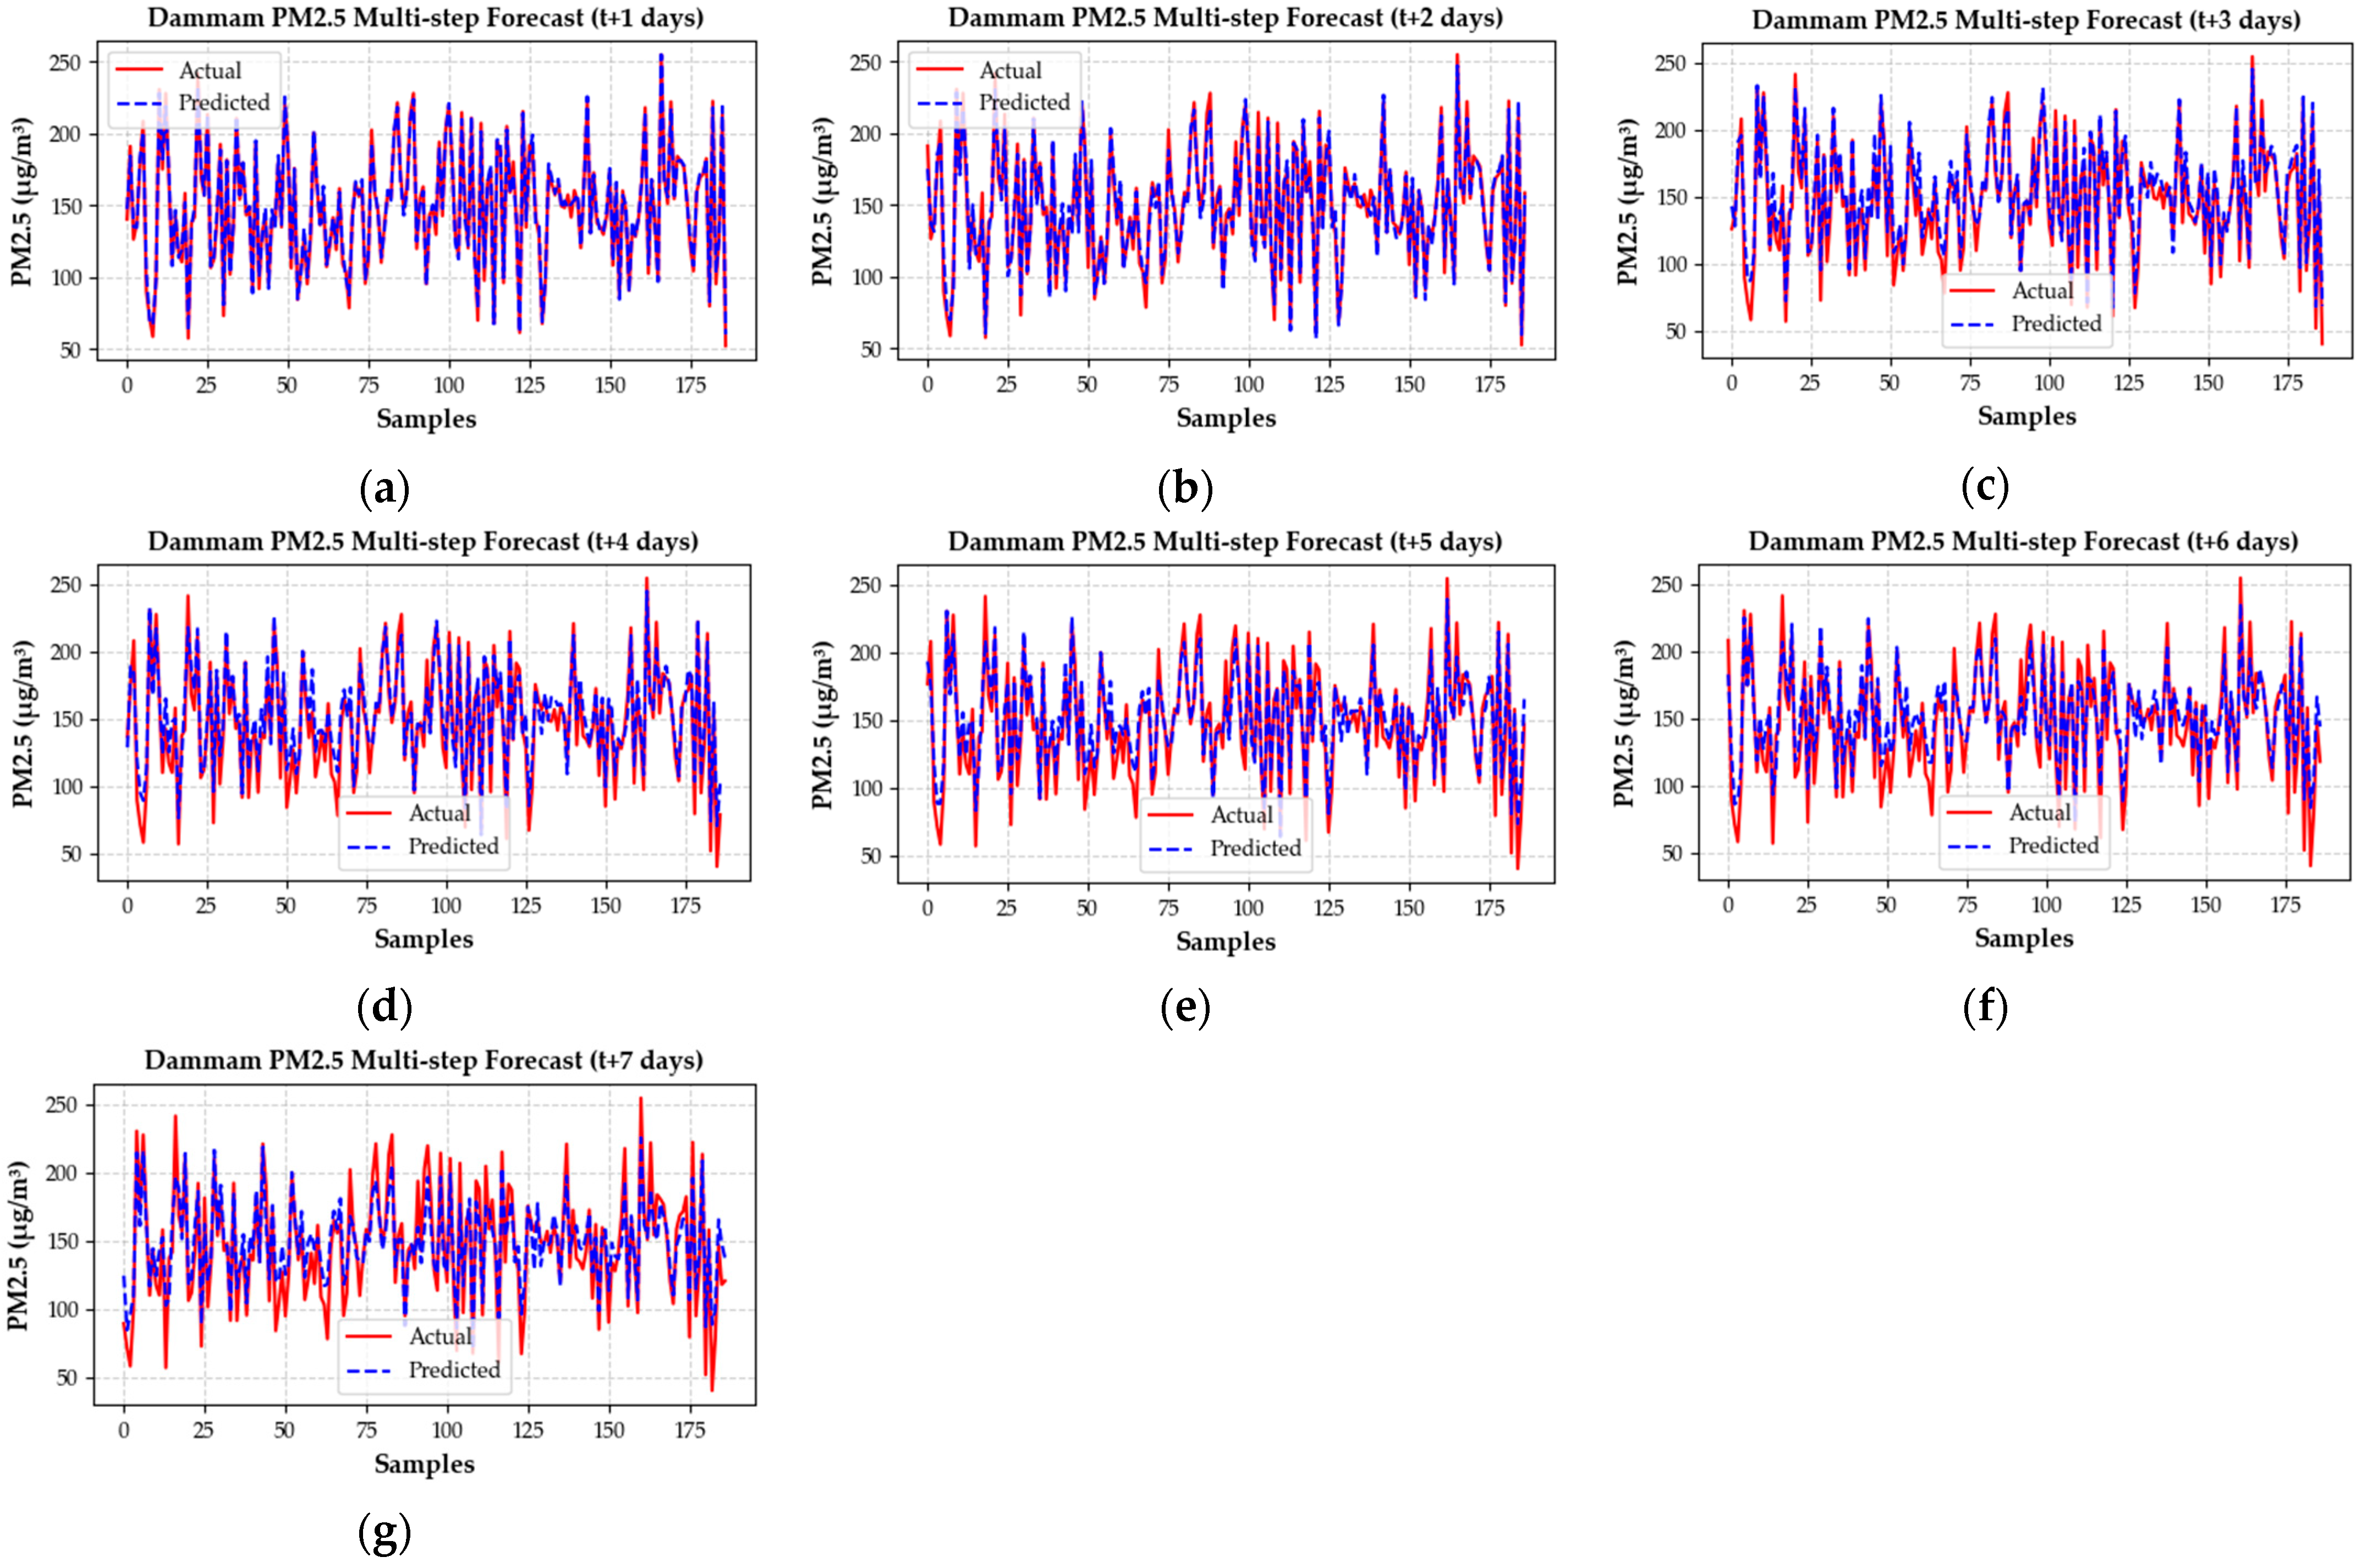
The performance evaluation of the VMD–BiGRU model for Dammam is summarized in Table 4. The model shows high predictive accuracy for short-term horizons, where RMSE and MAE are 4.46 µg/m3 and 3.60 µg/m3 respectively, with an R2 value of 0.989 for the one-day-ahead forecast (t + 1). As the prediction window extends, the errors gradually increase and the coefficient of determination declines, showing a reduction in predictive precision over longer horizons. RMSE rises from 4.46 µg/m3 at t + 1 to 17.75 µg/m3 at t + 7, while MAE increases from 3.60 µg/m3 to 14.23 µg/m3. The R2 value decreases from 0.989 to 0.826, which reflects a moderate weakening in correlation with the observed data. Figure 8 illustrates that the model tracks the actual PM2.5 trends effectively up to t + 4 days, with minor deviations becoming visible beyond that range.
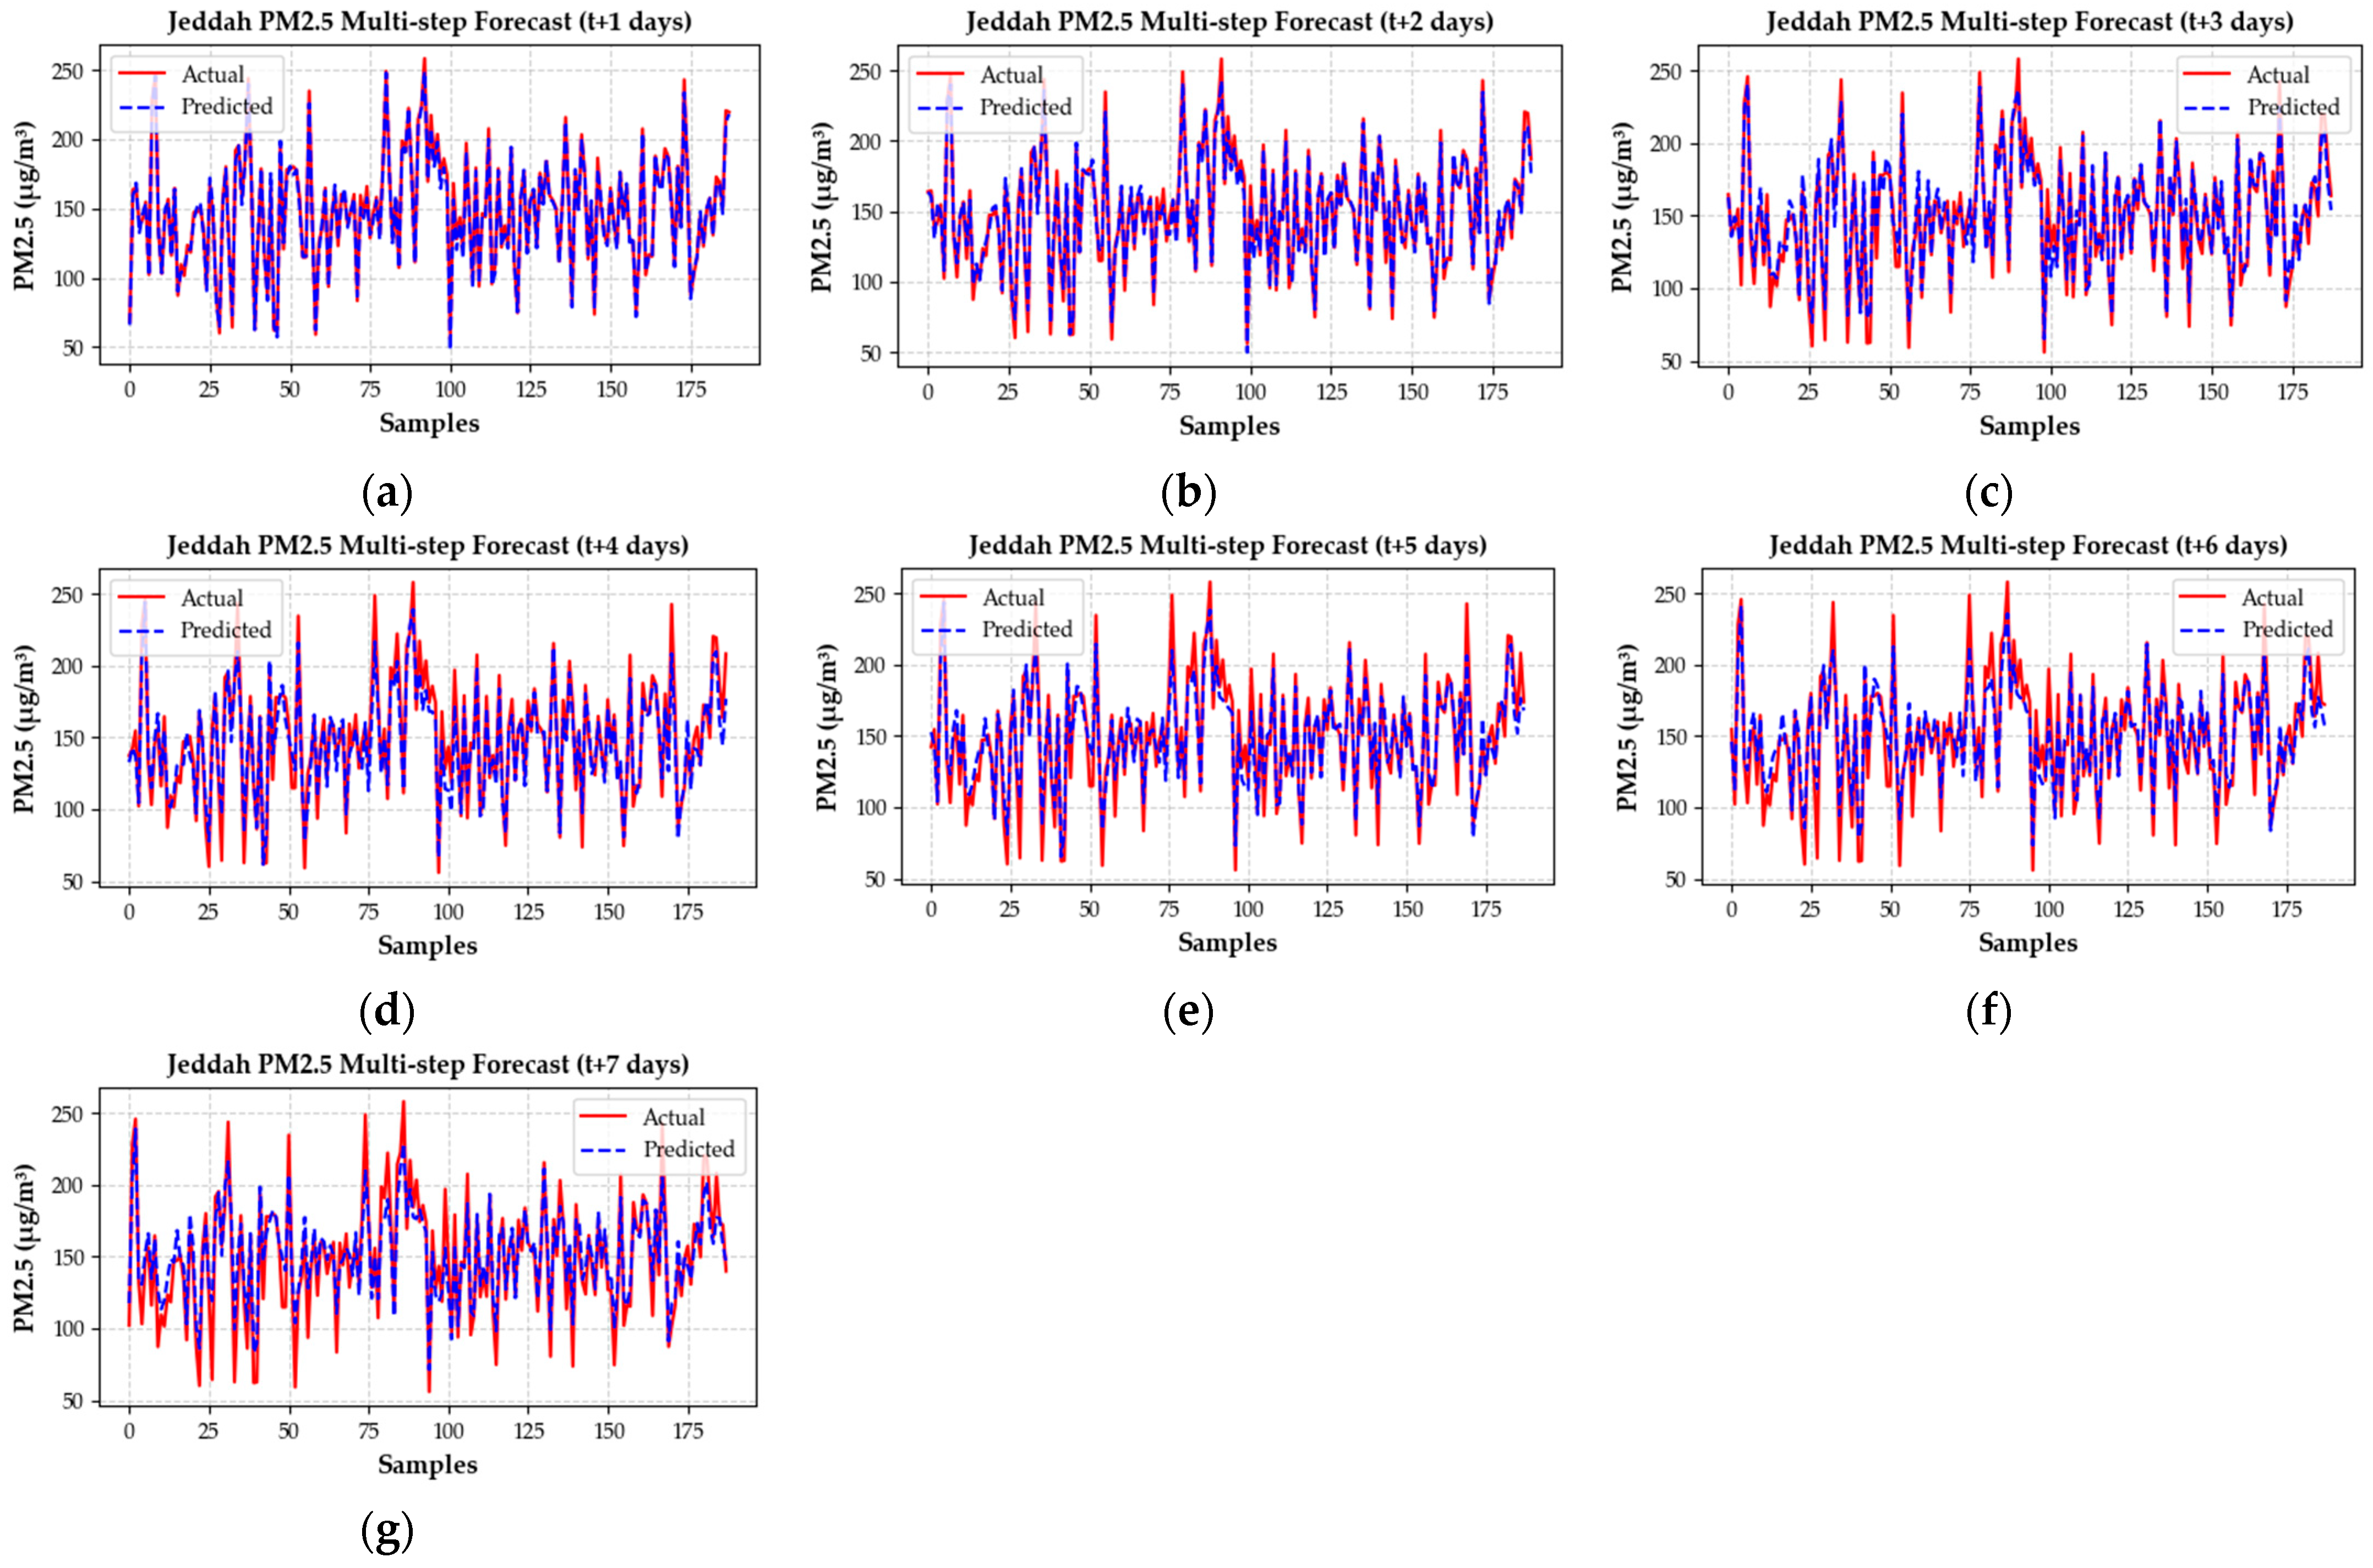
Table 5 presents the performance assessment of the VMD–BiGRU model for Jeddah. The model attains strong predictive accuracy in short-term forecasts, with the one-day-ahead horizon (t + 1) yielding an RMSE of 3.97 µg/m3, an MAE of 3.10 µg/m3, and an R2 of 0.991. As the forecast period extends, a gradual increase in error values occurs, with RMSE rising to 15.88 µg/m3 and MAE reaching 12.05 µg/m3 at t + 7, while R2 decreases to 0.853. Despite the reduction in performance at longer horizons, the model retains a strong ability to represent the temporal evolution of PM2.5 concentrations. Figure 9 shows that the predicted curves closely follow the observed data for up to four days ahead, with clear alignment in both amplitude and pattern. Beyond this range, slight divergence appears at higher values, yet the general forecast trend stays accurate. This confirms that the VMD–BiGRU framework can predict multi-step PM2.5 variations in Jeddah effectively.

3.2. Comparison with Other Models

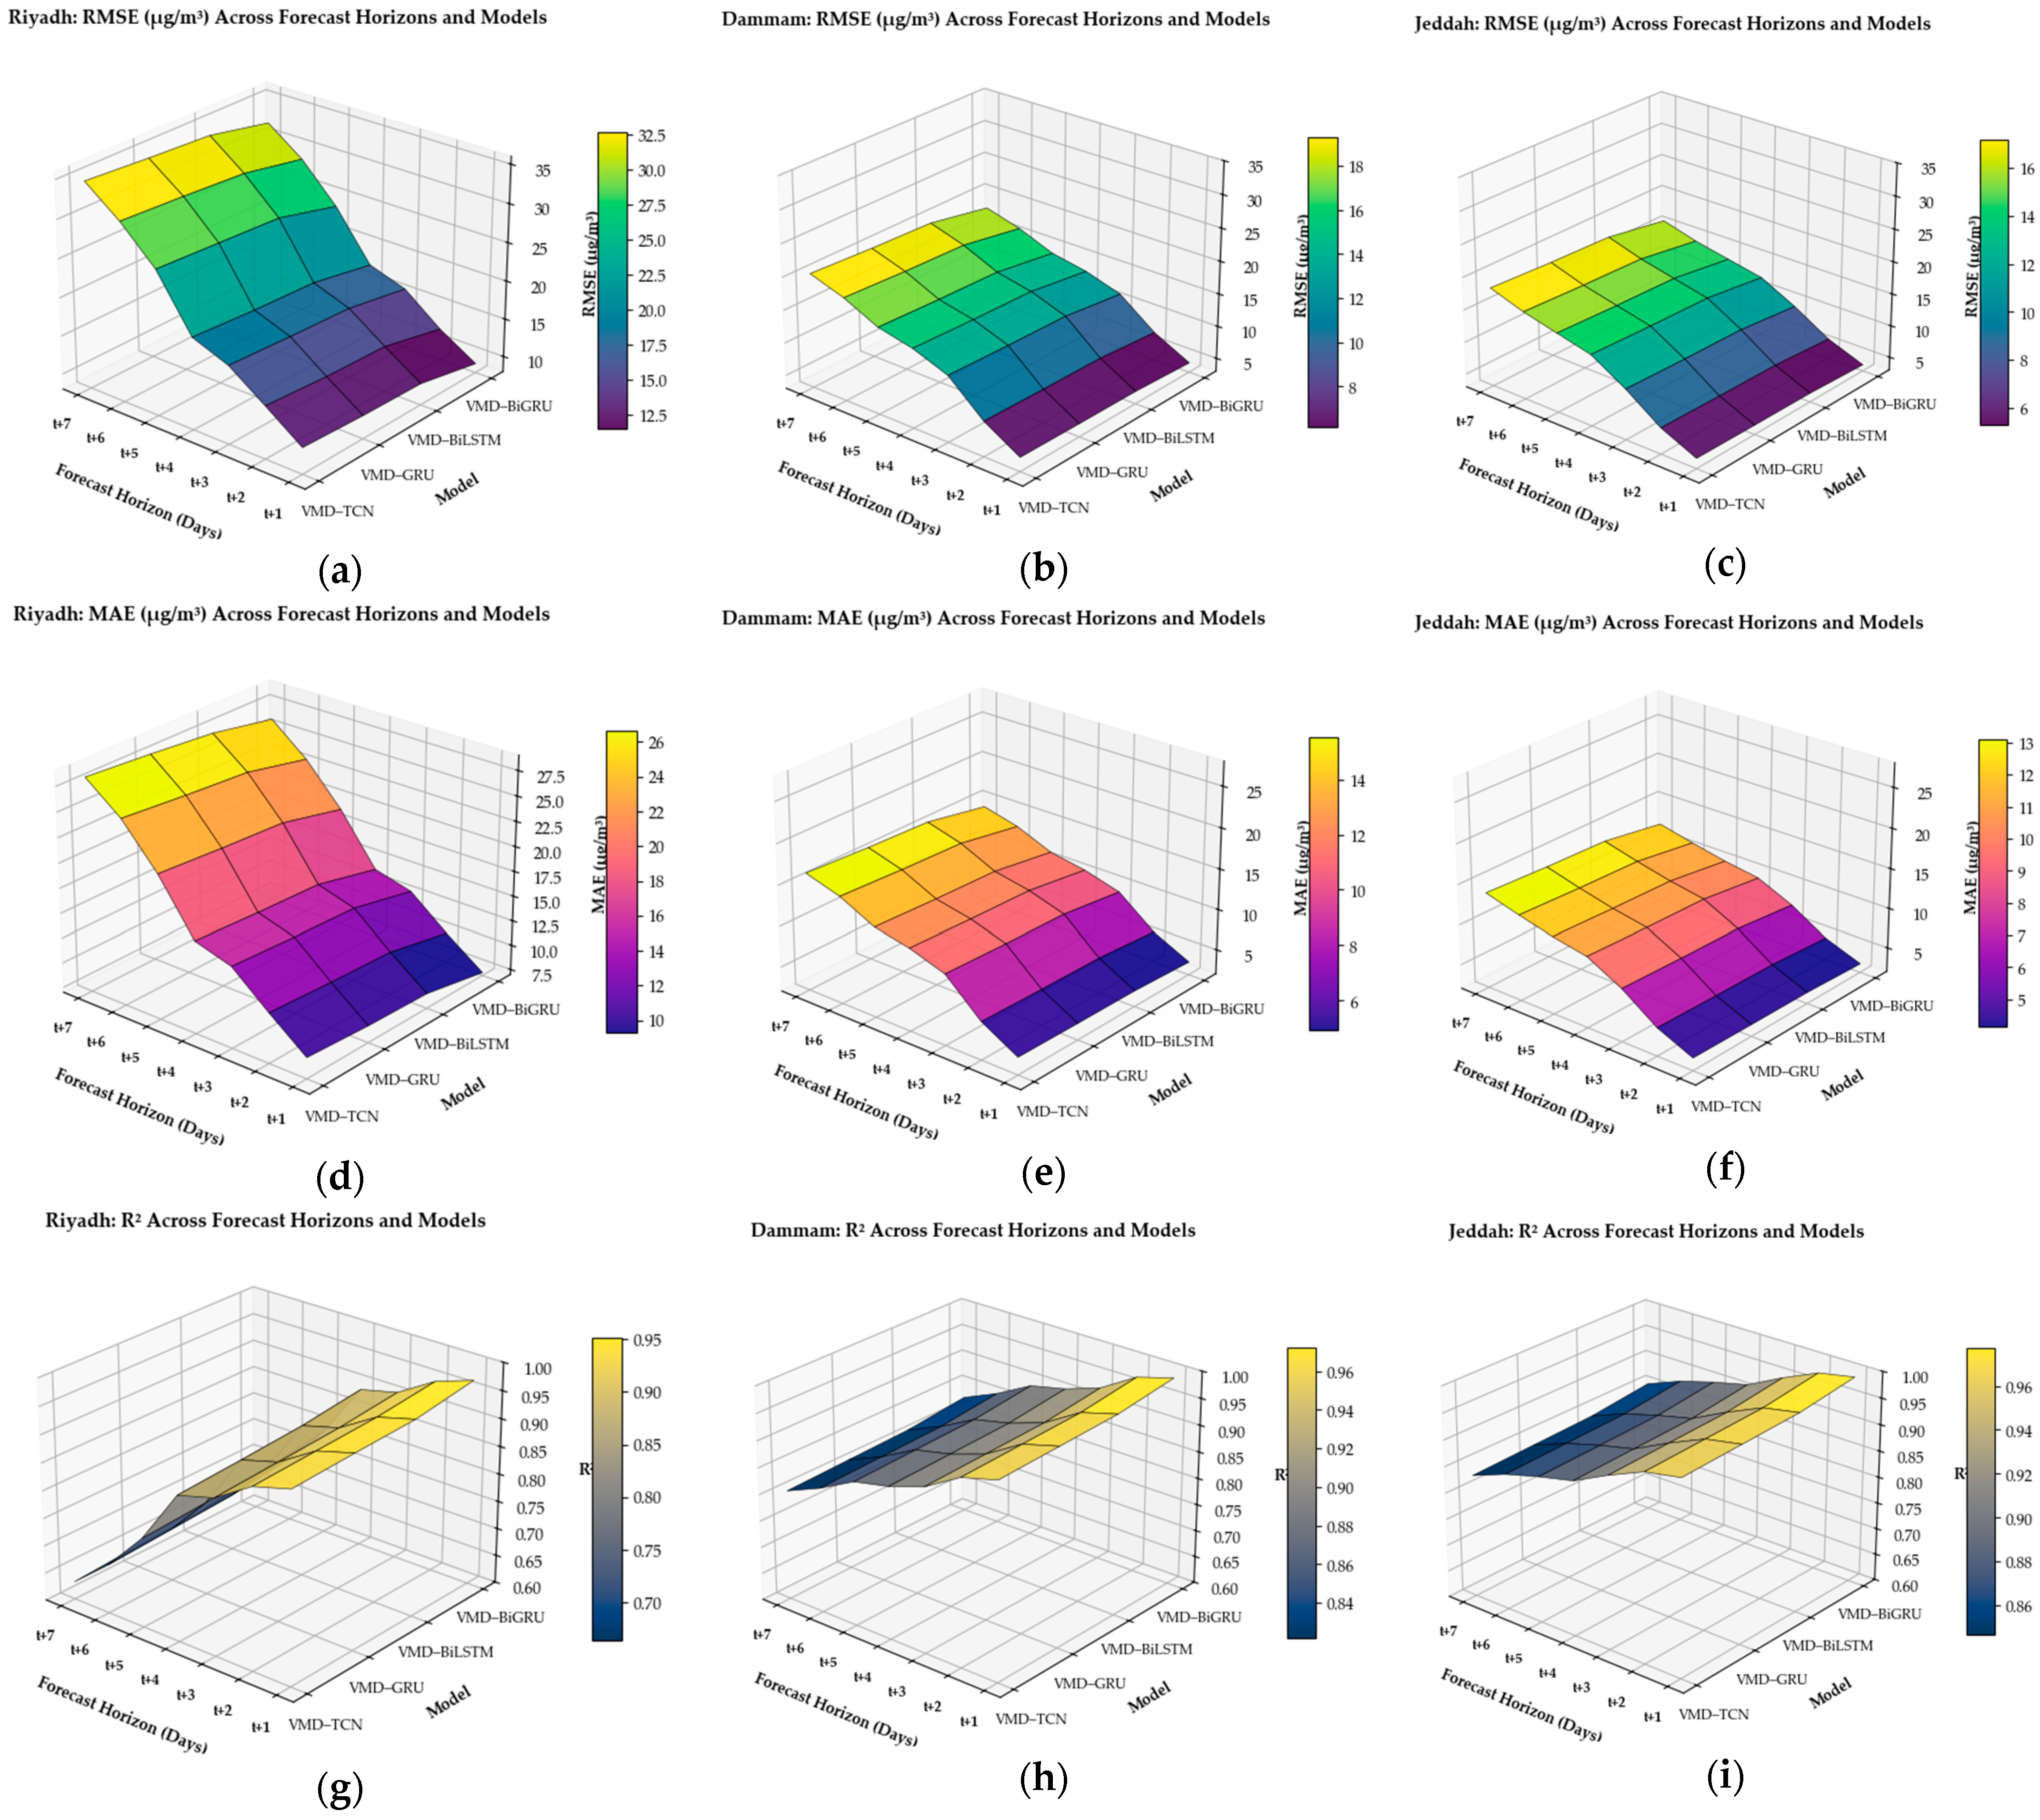
Figure 10 compares the performance of the VMD–BiGRU model with three other hybrid configurations including VMD–BiLSTM, VMD–GRU, and VMD–TCN across seven forecast horizons for Riyadh, Dammam, and Jeddah. Each 3-dimensional surface plot depicts how model accuracy changes with forecast length and type. In case of RMSE and MAE plots (Figure 10a–f), the VMD–BiGRU records the lowest error values across all horizons and cities. The surfaces for BiLSTM, GRU, and TCN rise gradually above that of the BiGRU, which indicates higher prediction errors, especially beyond the three-day horizon. The difference is most visible in Riyadh, where the BiGRU surface remains distinctly lower, while Dammam and Jeddah show smaller yet clear margins. The upward slope from VMD–BiGRU to VMD–TCN shows that the BiGRU captures temporal dependencies more effectively and maintains better accuracy as the forecast length increases. In case of R2 surface plots (Figure 10g–i), the VMD–BiGRU yields higher values and shows a closer match between observed and predicted PM2.5 values. The gap between BiGRU and other models becomes more noticeable at longer horizons, which indicates that alternative architectures lose predictive precision more quickly. Table A1 in Appendix A provides the data for the 3D plots.

4. Conclusions and Recommendations

This study developed a VMD–BiGRU hybrid model for the short- and medium-term forecasting of PM2.5 concentrations across three major Saudi cities including Riyadh, Dammam, and Jeddah. The model decomposed the PM2.5 time series into distinct frequency components using VMD before applying the BiGRU network for prediction. The results demonstrated that the VMD–BiGRU model effectively captured complex temporal dependencies and non-linear dynamics in air pollution data.
Among the tested configurations, the VMD–BiGRU outperformed the comparative hybrid models such as VMD–BiLSTM, VMD–GRU, and VMD–TCN across all metrics. For Riyadh, RMSE ranged from 9.25 to 32.03 µg/m3, MAE from 7.37 to 26.21 µg/m3, and R2 from 0.969 to 0.664 across the seven-day forecast horizon. Dammam achieved RMSE values between 4.46 and 17.75 µg/m3, MAE from 3.60 to 14.23 µg/m3, and R2 between 0.989 and 0.826. Data from Jeddah resulted in the lowest overall errors, with RMSE between 3.97 and 15.88 µg/m3, MAE between 3.10 and 12.05 µg/m3, and R2 between 0.991 and 0.853. These outcomes show the better predictive capability of the VMD–BiGRU model for both short- and mid-range PM2.5 forecasting. Furthermore, the multi-step forecasting results showed that the model retained strong accuracy up to three days ahead, while longer horizons (t + 5 to t + 7) experienced gradual error amplification due to cumulative uncertainty. The combination of VMD and BiGRU provided smoother decomposition, better convergence, and enhanced adaptability to urban-scale variations in PM2.5 concentrations.
The present study has certain limitations as well. It used only PM2.5 concentration data and did not include external factors that can influence pollutant behavior. The dataset focused on three major cities, which may not reflect variations across the entire country. Future research can integrate meteorological and emission-related variables such as wind speed, humidity, temperature, and traffic intensity into the hybrid framework to capture pollutant dispersion mechanisms more effectively. Extending this framework to different other pollutants including NO2, SO2, and O3 may also broaden its applicability for comprehensive air quality assessment.

Author Contributions

Conceptualization, A.K.; Data curation, S.A.; Formal analysis, A.K.; Investigation, R.N.A. and C.M.M.; Project administration, S.A.; Resources, R.N.A.; Software, R.N.A. and S.T.; Supervision, A.K.; Validation, S.A.; Visualization, S.T.; Writing—review and editing, C.M.M. All authors have read and agreed to the published version of the manuscript.

Funding

This research received no external funding.

Institutional Review Board Statement

Not applicable.

Informed Consent Statement

Not applicable.

Data Availability Statement

No new data were created or analyzed in this study.

Conflicts of Interest

The authors declare no conflicts of interest.

Appendix A

Table A1. Three-dimensional plot dataset.
Models and Indicatort + 1t + 2t + 3t + 4t + 5t + 6t + 7
VMD–BiGRU_RMSE9.212.115.817.423.728.531.9
VMD–BiGRU_MAE7.3101314192326
VMD–BiGRU_R20.970.9470.9060.890.7920.7170.665
VMD–BiLSTM_RMSE10.813.917.218.925.830.133.6
VMD–BiLSTM_MAE8.511.314.415.520.524.427.2
VMD–BiLSTM_R20.9530.9350.8940.8760.7760.7020.645
VMD–GRU_RMSE1114.217.619.326.330.734.1
VMD–GRU_MAE8.711.614.715.820.924.927.8
VMD–GRU_R20.9480.9290.8870.8680.7680.6950.639
VMD–TCN_RMSE11.414.818.119.926.831.234.7
VMD–TCN_MAE9.11215.116.221.425.528.3
VMD–TCN_R20.9420.9230.880.8610.7610.6880.632

References

  1. Rao, M.N.; Ghude, S.S.; Nivdange, S.S.; Panchang, R.; Pipal, A.S.; Mukherjee, A.; Sharma, H.; Kumar, V. Characterization and health risk assessment of airborne microplastics in Delhi NCR. Sci. Rep. 2025, 15, 25662. [Google Scholar] [PubMed]
  2. Zaręba, Ł.; Piszczatowska, K.; Dżaman, K.; Soroczynska, K.; Motamedi, P.; Szczepański, M.J.; Ludwig, N. The relationship between fine particle matter (PM2.5) exposure and upper respiratory tract diseases. J. Pers. Med. 2024, 14, 98. [Google Scholar] [CrossRef]
  3. Hu, A.; Li, R.; Chen, G.; Chen, S. Impact of respiratory dust on health: A comparison based on the toxicity of PM2.5, silica, and nanosilica. Int. J. Mol. Sci. 2024, 25, 7654. [Google Scholar] [CrossRef]
  4. Ghosh, S.; Sinha, D. Indian perspective of PM2.5 attributed human health hazards during 2010–2025. Air Qual. Atmos. Health 2025, 18, 2765–2804. [Google Scholar] [CrossRef]
  5. Henning, R.J. Particulate matter air pollution is a significant risk factor for cardiovascular disease. Curr. Probl. Cardiol. 2024, 49, 102094. [Google Scholar] [CrossRef]
  6. Xu, X.; Huang, L.; Yao, L.; Yoshida, Y.; Long, Y. Rising socio-economic costs of PM2.5 pollution and medical service mismatching. Nat. Sustain. 2025, 8, 265–275. [Google Scholar] [CrossRef]
  7. World Health Organization. WHO Global Air Quality Guidelines: Particulate Matter (PM2.5 and PM10), Ozone, Nitrogen Dioxide, Sulfur Dioxide and Carbon Monoxide; World Health Organization: Geneva, Switzerland, 2021.
  8. Penkała, M.; Ogrodnik, P.; Rogula-Kozłowska, W. Particulate matter from the road surface abrasion as a problem of non-exhaust emission control. Environments 2018, 5, 9. [Google Scholar] [CrossRef]
  9. Sun, J.; Ho, S.S.H.; Niu, X.; Xu, H.; Qu, L.; Shen, Z.; Cao, J.; Chuang, H.-C.; Ho, K.-F. Explorations of tire and road wear microplastics in road dust PM2.5 at eight megacities in China. Sci. Total Environ. 2022, 823, 153717. [Google Scholar] [CrossRef]
  10. Meo, S.A.; Shaikh, N.; Meo, A.S. Effect of particulate matter (PM2.5, PM10) on deaths and disability-adjusted life years (DALYs) in Gulf Cooperation Council countries: Global burden of disease time trend analysis 1990–2021. Pak. J. Med. Sci. 2025, 41, 2875–2882. [Google Scholar] [CrossRef] [PubMed]
  11. Alanzi, T.; Aljarbooa, N.; AlSalem, F.; Sawan, R.; Albalawi, B.; Ababtain, G.; Taha, R.; Toonsi, M.; Aloufi, M.; Alsharifa, H. Public perceptions and practices on air quality and respiratory health: Insights from a cross-sectional study in Saudi Arabia. J. Med. Life 2025, 18, 315. [Google Scholar] [CrossRef] [PubMed]
  12. Alharbi, H.A.; Rushdi, A.I.; Bazeyad, A.; Al-Mutlaq, K.F. Temporal Variations, Air Quality, Heavy Metal Concentrations, and Environmental and Health Impacts of Atmospheric PM2.5 and PM10 in Riyadh City, Saudi Arabia. Atmosphere 2024, 15, 1448. [Google Scholar] [CrossRef]
  13. Munir, S.; Siddiqui, M.H.; Habeebullah, T.M.; Zamreeq, A.O.; Al-Zahrani, N.E.; Khalil, A.A.; Islam, M.N.; Baligh, A.A.; Ismail, M.; Al-Boqami, S.Z. Variability and Trends of PM2.5 Across Different Climatic Zones in Saudi Arabia: A Spatiotemporal Analysis. Atmosphere 2025, 16, 463. [Google Scholar] [CrossRef]
  14. Abdelmaksoud, A.; Halawani, R.; Almehmadi, F.; Quicksall, A. Characterization of PM2.5 Trace Metals from the Urban-Coastal Area of Jeddah, Saudi Arabia. Water Air Soil Pollut. 2025, 236, 550. [Google Scholar] [CrossRef]
  15. Zhang, L.; Liu, J.; Feng, Y.; Wu, P.; He, P. PM2.5 concentration prediction using weighted CEEMDAN and improved LSTM neural network. Environ. Sci. Pollut. Res. 2023, 30, 75104–75115. [Google Scholar] [CrossRef]
  16. Ban, W.; Shen, L. PM2.5 prediction based on the CEEMDAN algorithm and a machine learning hybrid model. Sustainability 2022, 14, 16128. [Google Scholar] [CrossRef]
  17. Zeng, Q.; Wang, L.; Zhu, S.; Gao, Y.; Qiu, X.; Chen, L. Long-term PM2.5 concentrations forecasting using CEEMDAN and deep Transformer neural network. Atmos. Pollut. Res. 2023, 14, 101839. [Google Scholar] [CrossRef]
  18. Ameri, R.; Hsu, C.-C.; Band, S.S.; Zamani, M.; Shu, C.-M.; Khorsandroo, S. Forecasting PM 2.5 concentration based on integrating of CEEMDAN decomposition method with SVM and LSTM. Ecotoxicol. Environ. Saf. 2023, 266, 115572. [Google Scholar] [CrossRef] [PubMed]
  19. Zhao, N.; Liu, Y.; Vanos, J.K.; Cao, G. Day-of-week and seasonal patterns of PM2.5 concentrations over the United States: Time-series analyses using the Prophet procedure. Atmos. Environ. 2018, 192, 116–127. [Google Scholar] [CrossRef]
  20. Masood, A.; Ahmad, K. Data-driven predictive modeling of PM2.5 concentrations using machine learning and deep learning techniques: A case study of Delhi, India. Environ. Monit. Assess. 2023, 195, 60. [Google Scholar] [CrossRef]
  21. Patel, R.; Kumar, A.; Yadav, J.; Singh, M. Stacked deep learning ensemble for time series prediction of PM2.5 levels in Bihar. Urban Clim. 2025, 62, 102521. [Google Scholar] [CrossRef]
  22. Sharma, D.; Thapar, S.; Masood, A.; Sachdeva, K. Fourier-Enhanced Deep Learning and Machine Learning Models for Predicting Multi-Scale PM2.5 Dynamics in Megacities: A Case Study of Delhi. Earth Syst. Environ. 2025, 1–26. [Google Scholar] [CrossRef]
  23. Vignesh, P.P.; Jiang, J.H.; Kishore, P. Predicting PM2.5 concentrations across USA using machine learning. Earth Space Sci. 2023, 10, e2023EA002911. [Google Scholar] [CrossRef]
  24. Qamar, M.S.; Munir, M.F.; Waseem, A. AI for Cleaner Air: Predictive Modeling of PM2.5 Using Deep Learning and Traditional Time-Series Approaches. Comput. Model. Eng. Sci. 2025, 144, 3557. [Google Scholar] [CrossRef]
  25. Bhatti, U.A.; Yan, Y.; Zhou, M.; Ali, S.; Hussain, A.; Qingsong, H.; Yu, Z.; Yuan, L. Time series analysis and forecasting of air pollution particulate matter (PM2.5): An SARIMA and factor analysis approach. IEEE Access 2021, 9, 41019–41031. [Google Scholar] [CrossRef]
  26. Kleine Deters, J.; Zalakeviciute, R.; Gonzalez, M.; Rybarczyk, Y. Modeling PM2.5 urban pollution using machine learning and selected meteorological parameters. J. Electr. Comput. Eng. 2017, 2017, 5106045. [Google Scholar] [CrossRef]
  27. Abdulraheem, K.A.; Aina, Y.A.; Mustapha, I.B.; Adekunle, B.S.; Jimoh, H.O.; Adeniran, J.A.; Olaleye, A.A.; Hamid-Mosaku, I.A.; Nasiru, A.I.; Abimbola, I. Modelling spatiotemporal concentrations of PM2.5 over Nigerian cities using machine learning algorithms and open-source data. Model. Earth Syst. Environ. 2025, 11, 36. [Google Scholar] [CrossRef]
  28. Abuouelezz, W.; Ali, N.; Aung, Z.; Altunaiji, A.; Shah, S.B.; Gliddon, D. Exploring PM2.5 and PM10 ML forecasting models: A comparative study in the UAE. Sci. Rep. 2025, 15, 9797. [Google Scholar] [CrossRef]
  29. Zaman, N.A.F.K.; Kanniah, K.D.; Kaskaoutis, D.G.; Latif, M.T. Evaluation of machine learning models for estimating PM2.5 concentrations across Malaysia. Appl. Sci. 2021, 11, 7326. [Google Scholar] [CrossRef]
  30. Zhu, Q.; Zhang, F.; Liu, S.; Wu, Y.; Wang, L. A hybrid VMD–BiGRU model for rubber futures time series forecasting. Appl. Soft Comput. 2019, 84, 105739. [Google Scholar] [CrossRef]
  31. Li, S.; Tang, B.; Deng, X. A Hybrid Method Combining Variational Mode Decomposition and Deep Neural Networks for Predicting PM2.5 Concentration in China. IEEE Access 2025, 13, 51956–51968. [Google Scholar] [CrossRef]
  32. Alsulami, B.T.; Khattak, A. Integrated OVMD-BiGRU-SMAC Framework for Forecasting Construction Accidents in the Kingdom of Saudi Arabia. IEEE Access 2025, 13, 124543–124555. [Google Scholar] [CrossRef]
  33. Khattak, A.; Chan, P.-W.; Chen, F.; Peng, H. Estimating turbulence intensity along the glide path using wind tunnel experiments combined with interpretable tree-based machine learning algorithms. Build. Environ. 2023, 239, 110385. [Google Scholar] [CrossRef]
  34. Zhang, S.; Luo, J.; Wang, S.; Liu, F. Oil price forecasting: A hybrid GRU neural network based on decomposition–reconstruction methods. Expert Syst. Appl. 2023, 218, 119617. [Google Scholar] [CrossRef]
  35. Han, L.; Zhang, R.; Wang, X.; Bao, A.; Jing, H. Multi-step wind power forecast based on VMD-LSTM. IET Renew. Power Gener. 2019, 13, 1690–1700. [Google Scholar] [CrossRef]
  36. Geng, G.; He, Y.; Zhang, J.; Qin, T.; Yang, B. Short-term power load forecasting based on PSO-optimized VMD-TCN-attention mechanism. Energies 2023, 16, 4616. [Google Scholar] [CrossRef]
  37. Alharbi, H.A.; Rushdi, A.I.; Bazeyad, A.; Al-Mutlaq, K.F. Polycyclic Aromatic Hydrocarbons in Atmospheric PM2.5 and PM10 of Riyadh City, Saudi Arabia: Levels, Temporal Variation, and Health Impacts. Toxics 2025, 13, 424. [Google Scholar] [CrossRef] [PubMed]
  38. Shaltout, A.A.; Ali, S.S.; Dhaif-allah, R.; Alzahrani, E. Elemental Variability of PM 2.5 aerosols in Old Jeddah, Saudi Arabia. Atmosphere 2022, 13, 2043. [Google Scholar]
  39. Alwadei, M.; Srivastava, D.; Alam, M.S.; Shi, Z.; Bloss, W.J. Chemical characteristics and source apportionment of particulate matter (PM2.5) in Dammam, Saudi Arabia: Impact of dust storms. Atmos. Environ. X 2022, 14, 100164. [Google Scholar] [CrossRef]
  40. Li, X.; Zhou, S.; Wang, F. A CNN-BiGRU sea level height prediction model combined with bayesian optimization algorithm. Ocean. Eng. 2025, 315, 119849. [Google Scholar] [CrossRef]
  41. Lu, Q.; Polyzos, K.D.; Li, B.; Giannakis, G.B. Surrogate modeling for Bayesian optimization beyond a single Gaussian process. IEEE Trans. Pattern Anal. Mach. Intell. 2023, 45, 11283–11296. [Google Scholar] [CrossRef]
  42. Lim, Y.-F.; Ng, C.K.; Vaitesswar, U.; Hippalgaonkar, K. Extrapolative Bayesian optimization with Gaussian process and neural network ensemble surrogate models. Adv. Intell. Syst. 2021, 3, 2100101. [Google Scholar] [CrossRef]
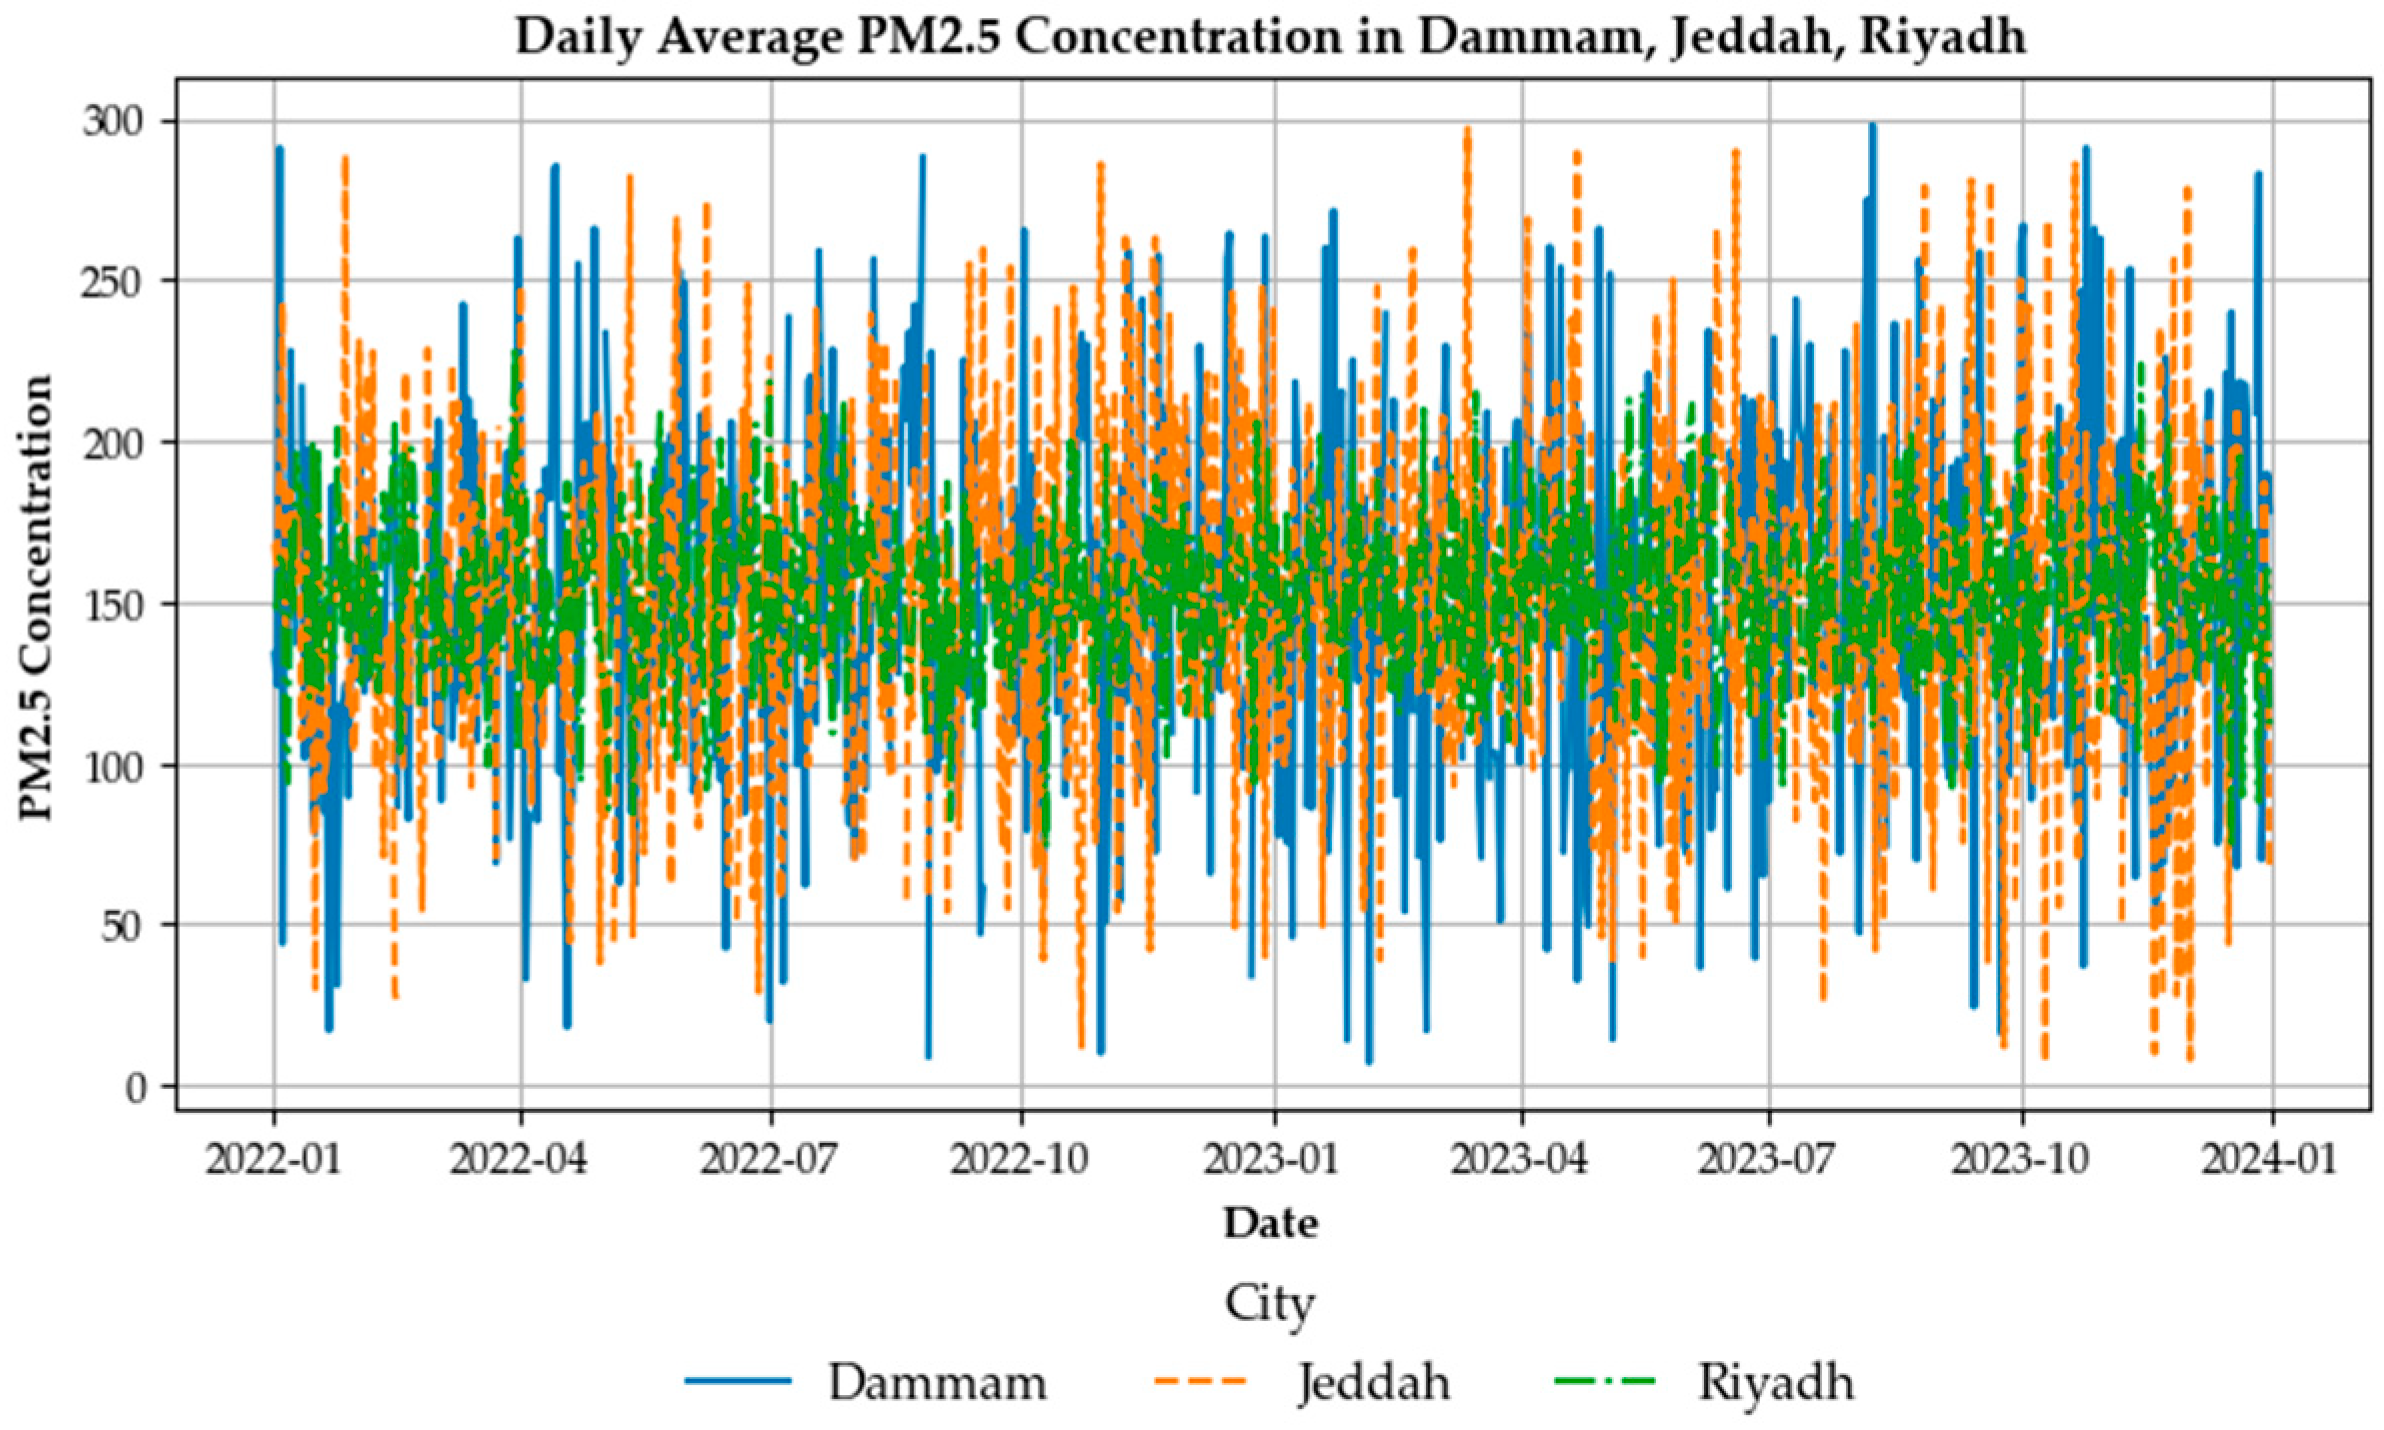
Figure 1. Daily average PM2.5 in 2022–2023 in three major cities of KSA.
Atmosphere 16 01324 g001
Figure 2. Major cities and their location in KSA.
Atmosphere 16 01324 g002
Figure 3. Daily and seasonal variations of PM2.5 concentrations in major cities of KSA: (a) Riyadh daily PM2.5 concentration, (b) seasonal pattern of PM2.5 in Riyadh, (c) Dammam daily PM2.5 concentration, (d) seasonal pattern of PM2.5 in Dammam, (e) Jeddah daily PM2.5 concentration, and (f) seasonal pattern of PM2.5 in Jeddah.
Atmosphere 16 01324 g003
Figure 4. Comparative box plots of PM2.5 data across Riyadh, Dammam and Jeddah.
Atmosphere 16 01324 g004
Figure 5. Probability density distribution of daily PM2.5 concentrations in the three major cities of KSA; (a) Riyadh; (b) Dammam, (c) Jeddah.
Atmosphere 16 01324 g005
Figure 6. VMD decomposition of daily PM2.5 concentration signals for the three major cities; (a) Riyadh, (b) Dammam; (c) Jeddah.
Atmosphere 16 01324 g006
Figure 7. Multi-step PM2.5 forecasting for Riyadh based on VMD-BiGRU; (a) 1-day-ahead forecast, (b) 2-day-ahead forecast; (c) 3-day-ahead forecast; (d) 4-day-ahead forecast, (e) 5-day-ahead forecast; (f) 6-day-ahead forecast; (g) 7-day-ahead forecast.
Atmosphere 16 01324 g007
Figure 8. Multi-step PM2.5 forecasting for Dammam based on VMD-BiGRU; (a) 1-day-ahead forecast, (b) 2-day-ahead forecast; (c) 3-day-ahead forecast; (d) 4-day-ahead forecast, (e) 5-day-ahead forecast; (f) 6-day-ahead forecast; (g) 7-day-ahead forecast.
Atmosphere 16 01324 g008
Figure 9. Multi-step PM2.5 forecasting for Jeddah based on VMD-BiGRU; (a) 1-day-ahead forecast, (b) 2-day-ahead forecast; (c) 3-day-ahead forecast; (d) 4-day-ahead forecast, (e) 5-day-ahead forecast; (f) 6-day-ahead forecast; (g) 7-day-ahead forecast.
Atmosphere 16 01324 g009
Figure 10. Performance comparison of VMD-BiGRU with other competitive models across forecast horizons; (ac) present RMSE results, (df) display MAE values, and (gi) show R2 metrics for Riyadh, Dammam, and Jeddah, respectively.
Atmosphere 16 01324 g010
Table 1. PM2.5 forecasting studies across different regions.
RegionModel TypeKey FindingsRef.
Xinyang City, ChinaHybrid WCEEMDAN–ILSTMThe model integrates WCEEMDAN for decomposing non-stationary and non-linear PM2.5 data and ILSTM optimized by AMPSO to improve the performance accuracy[15]
Hangzhou, Zhejiang Province, and Kunming, Yunnan Province.Hybrid CEEMDAN–LSTM–BP–ARIMAThe model applies CEEMDAN to decompose PM2.5 data into modal components and used LSTM, BP, ARIMA, and SVM, to predict PM2.5[16]
Beijing, ChinaHybrid CEEMDAN–
DeepTransformer
The model integrates CEEMDAN to decomposed PM2.5 data and then the DeepTransformer network with an improved embedding layer and non-autoregressive direct multi-step decoder resulted in higher long-term prediction accuracy[17]
Kaohsiung, TaiwanHybrid CEEMDAN–SVM–LSTMThe model integrates CEEMDAN for extracting IMFs and applies SVM and LSTM models with parameters optimized by the Naive Evolution algorithm to forecast PM2.5 for 1-, 3-, and 7-day horizons[18]
United StatesProphet Time-Series ModelThe study applies the Prophet model to nine years (2007–2015) of PM2.5 data from 220 stations. The data was decomposed into trend, seasonality, and holiday components to reveal consistent weekly and yearly PM2.5 patterns[19]
Delhi, IndiaLSTM, MLFFNN, SVM, RFThe study applies multiple ML and DL models using pollutant and meteorological variables, including aerodynamic roughness coefficient. Results revealed that LSTM achieves the best PM2.5 forecasting accuracy[20]
Patna, Gaya, and Muzaffarpur, IndiaStacked DL ensemble (LSTM, CNN, RNN, GRU, Bi-LSTM + XGBoost)The model employs five DL architectures as base predictors and integrates them through an XGBoost-based stacking ensemble to improved the PM2.5 forecasting accuracy[21]
Delhi, IndiaMulti-Model Framework (SARIMAX, RF, SVM, ANN, LSTM)The framework integrates statistical, ML, and DL models with station-specific hyperparameter tuning, exogenous variables, and Fourier-transformed features to capture seasonal PM2.5 variations[22]
United StatesRF and SVR (compared with LR, DT, GBR, ABR, XGB, KNN, LSTM, SVM)The study evaluates nine ML models using PM2.5 data (2017–2021) and finds RF and SVR as the most accurate predictors, showing better performance in the western U.S. due to regional data variability and finer model adaptability.[23]
Hong KongHybrid CNN–LSTM ModelThe study compares DL and statistical models (CNN, LSTM, ARIMA, MLE) for hourly PM2.5 forecasting and observed that the hybrid CNN–LSTM achieves the highest accuracy[24]
Lahore, PakistanSARIMA ModelThe study analyzes air quality and identified that PM2.5 and PM10 levels exceeding NEQS, with strong correlations to O3, NO, and SO2.[25]
Quito, EcuadorConvolutional-based Spatial Representation (CGM)The study applies a convolutional spatial regression model (CGM) and reports improved PM2.5 prediction accuracy compared to traditional machine learning models such as Neural Networks, Linear-SVM, and Boosted Trees[26]
NigeriaCatBoost (compared with SVR, ANN, KNN, DTR, LR)The study applies multiple ML models using open-source and satellite data with meteorological, demographic, and human activity factors to estimate PM2.5[27]
Abu Dhabi, UAESVR, CNN, and Facebook ProphetThe study compares ML and time series models including DT, RF, SVR, CNN, LSTM, Prophet for PM2.5 and PM10 forecasting using five years of data from six stations. It was observed that SVR and CNN best for short-term (1–2 h) and Prophet best for longer horizons (1 day–1 week)[28]
MalaysiaRF and SVRThe study estimates PM2.5 using satellite AOD, ground pollutants, and meteorological data (2018–2019) across 65 stations and developed seven seasonal and spatial models in which RF model achieved a higher accuracy[29]
Note: Weighted Complementary Ensemble Empirical Mode Decomposition with Adaptive Noise–Improved Long Short-Term Memory (WCEEMDAN–ILSTM), Complete Ensemble Empirical Mode Decomposition with Adaptive Noise–Long Short-Term Memory–Back Propagation–Autoregressive Integrated Moving Average (CEEMDAN–LSTM–BP–ARIMA); Long Short-Term Memory (LSTM), Convolutional Neural Network (CNN), Recurrent Neural Network (RNN), Gated Recurrent Unit (GRU), Bidirectional Long Short-Term Memory (BiLSTM), Extreme Gradient Boosting (XGBoost), Seasonal Autoregressive Integrated Moving Average with Exogenous Variables (SARIMAX), Random Forest (RF), Support Vector Machine (SVM), Artificial Neural Network (ANN).
Table 2. Performance metrics for the proposed VMD-BiGRU framework.
MetricDescriptionMathematical Expression
Mean Absolute Error (MAE)Represents the average magnitude of forecast errors without considering their direction. It expresses the mean absolute deviation between actual and predicted values. MAE = 1 n i = 1 n y i y ^ i
Mean Squared Error (MSE)It measures the mean of squared deviation between predicted and observed values and assigns greater weight to large errors. MSE = 1 n i = 1 n y i y ^ i 2
Root Mean Squared Error
(RMSE)
Represents the square root of the mean squared error, showing the standard deviation of prediction errors in the same unit as PM2.5 RMSE = 1 n i = 1 n y i y ^ i 2
Coefficient of Determination
(R2)
Indicates the proportion of variance in the observed data explained by the model. A higher R2 implies stronger predictive accuracy. R 2 = 1 i = 1 n y i y ^ i 2 i = 1 n y i y ¯ i 2
Table 3. Performance assessment via proposed VMD-BiGRU for Riyadh PM2.5 data.
Forecast Horizon
(Days)
RMSE
(µg/m3)
MAE
(µg/m3)
R2
t + 19.257.370.969
t + 212.2610.200.946
t + 316.0513.270.905
t + 417.6414.310.889
t + 524.1519.370.791
t + 629.0323.320.716
t + 732.0326.210.664
Table 4. Performance assessment via proposed VMD-BiGRU for Dammam PM2.5 data.
Forecast Horizon (Days)RMSE
(µg/m3)
MAE
(µg/m3)
R2
t + 14.463.600.989
t + 27.245.770.970
t + 311.349.240.929
t + 413.0610.490.906
t + 514.0811.280.891
t + 616.2313.110.855
t + 717.7514.230.826
Table 5. Performance assessment via proposed VMD-BiGRU for Jeddah PM2.5 data.
Forecast Horizon (Days)RMSE
(µg/m3)
MAE
(µg/m3)
R2
t + 13.973.100.991
t + 26.094.770.978
t + 39.367.440.948
t + 412.129.410.914
t + 513.2310.110.898
t + 614.3611.020.879
t + 715.8812.050.853
Disclaimer/Publisher’s Note: The statements, opinions and data contained in all publications are solely those of the individual author(s) and contributor(s) and not of MDPI and/or the editor(s). MDPI and/or the editor(s) disclaim responsibility for any injury to people or property resulting from any ideas, methods, instructions or products referred to in the content.