Article

Regional Characteristics of Geomagnetic Activity: Comparative Analysis of Local K and Global Kp Indices

by
Vitaliy Kapytin
1,*,
Alexey Andreyev
1,
Vyacheslav Somsikov
2,
Beibit Zhumabayev
1,
Saule Mukasheva
2,
Yekaterina Chsherbulova
1 and
Stanislav Utebayev
1
1
Ionosphere Institute, Almaty 050020, Kazakhstan
2
Faculty of Physics and Technology, Al-Farabi Kazakh National University, Almaty 050040, Kazakhstan
*
Author to whom correspondence should be addressed.
Atmosphere 2025, 16(12), 1319; https://doi.org/10.3390/atmos16121319 (registering DOI)
Submission received: 15 October 2025 / Revised: 13 November 2025 / Accepted: 14 November 2025 / Published: 22 November 2025
(This article belongs to the Section Upper Atmosphere)

Abstract

Geomagnetic activity reflects the complex coupling between the solar wind, magneto-sphere and ionosphere. While the global Kp index serves as a standard proxy for geo-magnetic disturbances, it obscures regional variations linked to local current systems and ionospheric conductivity. This study investigates regional features of geomagnetic activity using the local K index from the Almaty (AAA) observatory and compares its temporal dynamics with Kp for 2007–2025. A combination of statistical, spectral, wavelet, and nonlinear methods was applied, including power spectral density, continuous and cross-wavelet transforms, multifractal detrended fluctuation analysis, and permutation entropy. These approaches capture both linear and nonlinear features of variability and reveal scale-dependent structures in geomagnetic fluctuations. The results show a high correlation (r ≈ 0.84) between K (AAA) and Kp, but with a consistent positive offset of the local index, indicating sensitivity to regional ionospheric processes. Wavelet coherence highlights strong coupling in the 13–27-day band associated with solar rotation. Multifractal spectra reveal broader, more heterogeneous scaling in Kp and narrower, more intermittent dynamics in K during disturbed periods. Local indices, like K (AAA), thus provide essential insight into mid-latitude electrodynamics, complementing global measures in characterizing the nonlinear spatio-temporal complexity of geomagnetic activity.

1. Introduction

Geomagnetic activity reflects the redistribution of energy between the solar wind, Earth’s magnetosphere, and ionosphere, serving as a key indicator of space weather [1,2]. The K and Kp indices have traditionally been used to quantify the intensity of geomagnetic disturbances. While Kp provides an integrated global measure, local K indices derived from individual observatories reveal regional electrodynamic features. Since its introduction in 1932, Kp has become the primary global parameter characterizing planetary-scale magnetospheric activity. However, spatial inhomogeneities in Earth’s magnetic field and variations in the geoelectrical properties of the lithosphere lead to significant regional differences in geomagnetic manifestations. As emphasized by [3], local magnetic disturbances may diverge substantially from the global Kp-based metrics. A systematic comparison of local K indices with global data is therefore essential for accurate assessment and forecasting of space weather effects at the regional scale.
The Almaty geomagnetic observatory (code AAA), located in southeastern Kazakhstan, occupies a transition zone between middle and low latitudes, making it an important site for monitoring geomagnetic field variations. Its position in a region of complex magnetosphere–ionosphere coupling enhances its sensitivity to regional effects such as daytime variations linked to local conductivity, current system geometry, and substorm activity. Paper [4] demonstrated that AAA is particularly responsive to ULF magnetic wave variations during substorms, underscoring its diagnostic value for local magnetospheric dynamics. Previous comparative studies of local versus global geomagnetic indices have focused mainly on well-monitored regions such as Europe, North America, and Japan [5,6], while Central Asia remains underrepresented in global analyses. Consequently, data from observatories such as Almaty (AAA) offer an opportunity to fill this scientific gap and refine models of geomagnetic variability.
Despite the widespread use of Kp, the consistency between global and local indices remains uncertain, particularly in geophysically complex regions such as the Tian Shan. As noted by [5,7], global indices often obscure local features driven by Sq current system variations [8], ring current enhancement [9], or longitude-asymmetric substorms [10]. In this context, local indices like K (AAA) provide a unique means of detecting regional deviations, time shifts, and amplitude enhancements linked to ionospheric conductivity and the observatory’s location relative to the solar terminator [11].
This study compares long-term time series of the local K index from the Almaty observatory (2007–2025) with the global Kp index, using a multifaceted approach:
  • Statistical analysis: correlation and regression between local and global indices;
  • Temporal analysis: seasonal–diurnal structures and the Russell–McPherron effect;
  • Spectral and wavelet analysis: identification of periodicities and coherence;
  • Multifractal analysis: exploration of nonlinear scaling and dynamical complexity.
This integrated framework enables not only a quantitative assessment of local–global consistency but also the identification of physical mechanisms underlying regional geomagnetic variability.
The novelty of this work lies in the systematic investigation of Central Asian geomagnetic activity using nonlinear and multifractal techniques. Modern approaches—wavelet analysis, multifractal detrended fluctuation analysis, and entropy-based metrics—allow a deeper understanding of temporal scalability and stochastic structure beyond linear correlations. The presented methodology can be readily applied to other regional datasets and forms the basis for further development of regional space-weather forecasting systems.
The main objective is to identify regional features of geomagnetic activity from the K (AAA) index and compare them with Kp, under the hypothesis that the local index exhibits stronger intermittency and structural multifractality than the global one.

2. Materials and Methods

2.1. Data Sources and Temporal Synchronization

This study utilized long-term time series of the local geomagnetic activity index K, derived from observations at the Almaty Geomagnetic Observatory (code AAA, 43.25° N, 76.92° E), and the global Kp index, published by the GFZ Helmholtz Centre for Geosciences (GFZ Potsdam). Global Kp data were obtained from the official GFZ website (https://www.gfz-potsdam.de/en/kp-index (accessed on 17 September 2025)), while local K index values computed from the Almaty observatory data were retrieved from the geomagnetic observatory portal (https://ionos.kz/geomagnetic-observatory/ (accessed on 17 September 2025)). The local dataset covers the period 2007–2025 with a three-hour temporal resolution, corresponding to eight intervals per day (00–03, 03–06, …, 21–24 UTC). The K (AAA) index was calculated based on data from a vector magnetometer, followed by an assessment of amplitude deviations from the quiet baseline, according to the standard methodology described by [12]. Both time series were synchronized on a unified three-hour grid and normalized to ensure comparability. For the seasonal and diurnal analyses, the data were further parameterized using day-of-year and universal time (UTC hour) coordinates, allowing the investigation of temporal patterns across multiple scales.
To eliminate phase discrepancies between the local and global datasets, all three-hour values were aligned with the centers of their respective intervals (for example, the 00–03 UTC interval was assigned to 01:30 UTC). After temporal synchronization, anomalous outliers were filtered out, and isolated missing values were linearly interpolated, ensuring that both time series were comparable in length and sampling structure. The resulting datasets have identical temporal resolution and are expressed in standardized units (0–9 K-scale values), enabling direct statistical and spectral comparisons. The series were thoroughly cleaned of gaps, time-aligned, and subsequently used to evaluate correlation coefficients, regression slopes, and difference distributions between the local and global geomagnetic indices.

2.2. Statistical and Correlation Analysis

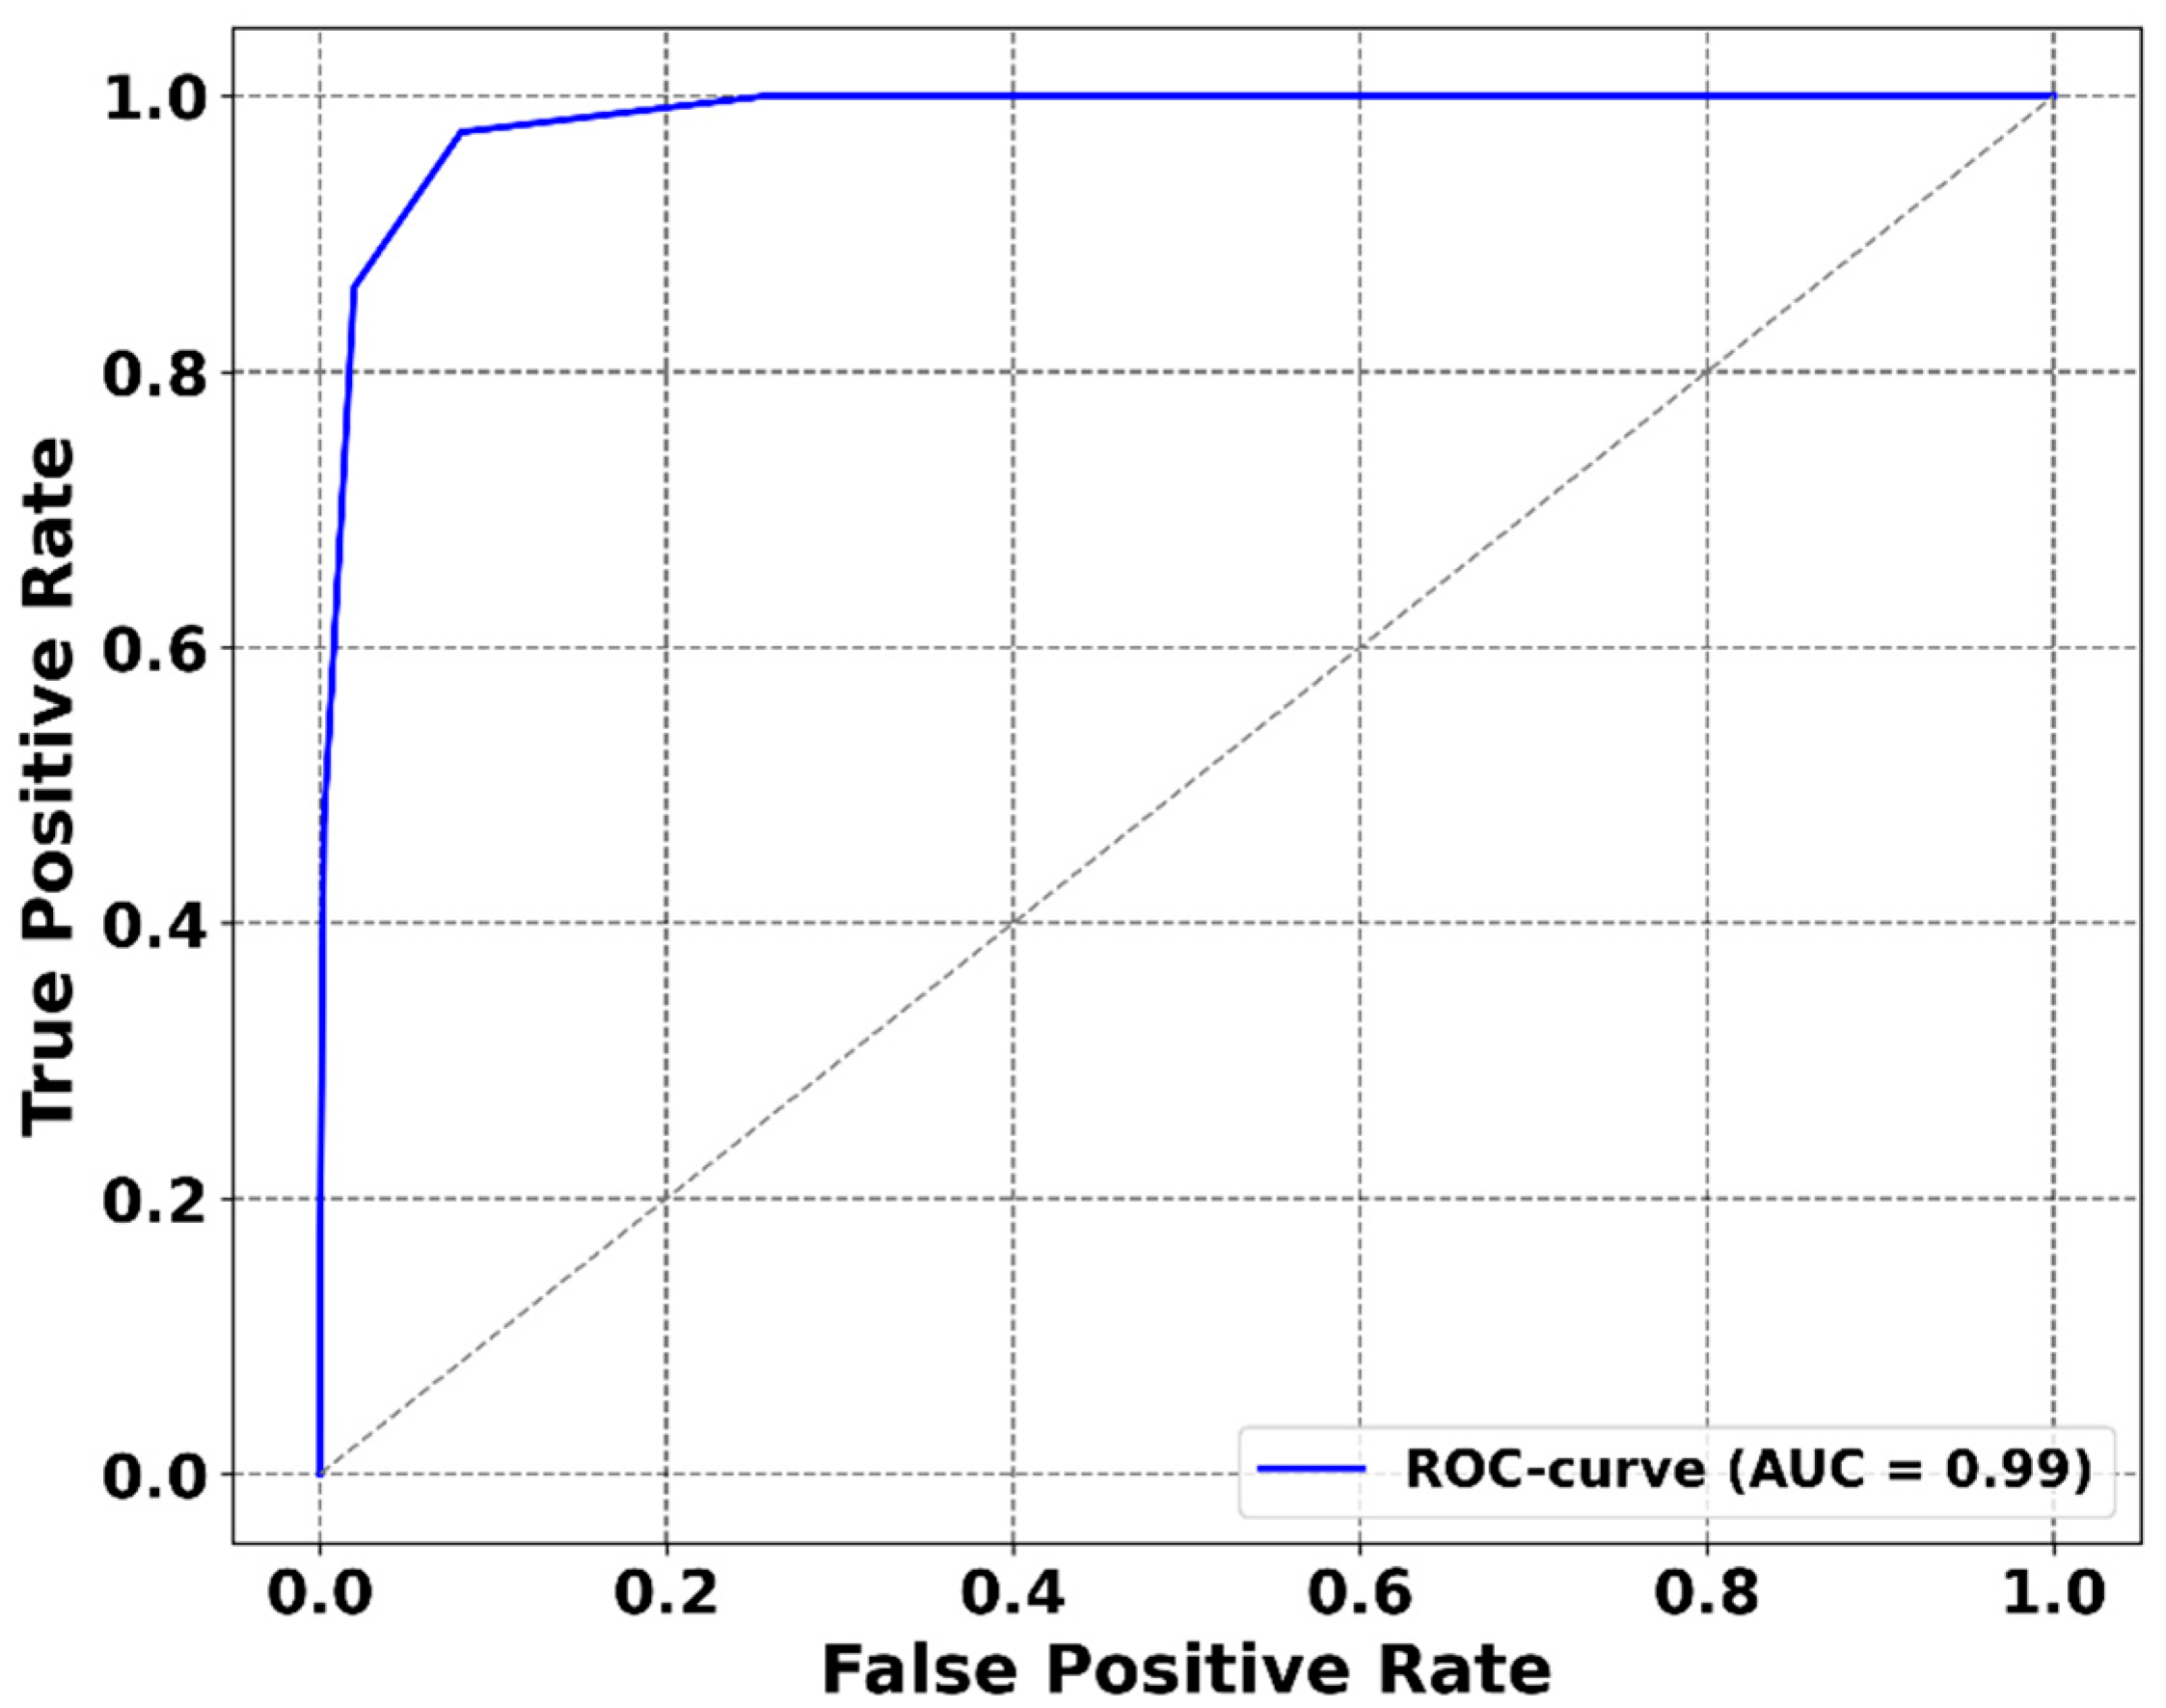
The first stage of the study involved a comparative assessment of the correspondence and deviation between the local K (AAA) index and the aggregated global Kp index. For this purpose, Pearson correlation coefficients, linear regression parameters, and the distribution of index differences, Δ K = K ( A A A ) K p , were calculated to quantify regional deviations of local geomagnetic activity from the global level. The seasonal-diurnal structure of both indices was analyzed using median values of K and Kp, as well as the frequency of threshold exceedances K (AAA) > Kp. To visualize temporal variations, two-dimensional heat maps were constructed in the coordinates “day of year × hour (UTC)”, highlighting characteristic zones of enhanced or reduced geomagnetic activity. The consistency of extreme events was evaluated using the criterion Kp ≥ 6, corresponding to moderate and intense magnetic storms. To quantitatively assess the predictive reliability and sensitivity of the local K (AAA) index relative to global disturbances, a Receiver Operating Characteristic (ROC) analysis and the corresponding Area Under the Curve (AUC) metric was performed. This approach follows methodologies similar to those described by [13,14], where the AUC serves as a quantitative measure of the index’s ability to discriminate geomagnetic disturbances of varying intensity.

2.3. Wavelet and Spectral Analysis Approach

The analysis of the frequency—time structure of geomagnetic activity was based on two complementary approaches—spectral decomposition and continuous wavelet transform (CWT)—which together enable the identification of both persistent cyclic components and their temporal evolution. The investigation aimed to detect dominant periodicities associated with solar-rotational and intra-seasonal variations, as well as to assess the coherence between fluctuations of the local K (AAA) and global Kp indices.
For an initial assessment of the frequency content and energy distribution of variations in K and Kp, a spectral analysis was performed using Welch’s method of power spectral density (PSD) estimation [15]. This technique reduces the variance of spectral power estimates compared with the classical periodogram approach by averaging spectra computed over overlapping subsegments of the time series. Such averaging ensures robustness to irregular bursts and nonstationary features, which are typical of geomagnetic data. The method has proven effective in analyzing geophysical time series with nonstationary structures, including geomagnetic index variations [16].
The original time series were normalized and apodized using a Hamming window, which minimized edge effects during the Fourier transform. The subwindow length was set to 256 samples (≈32 days) with 50% overlap between adjacent segments, providing sufficient frequency resolution to capture variations ranging from diurnal to multi-week timescales. The PSD values were normalized by the square of the signal’s standard deviation, allowing direct comparison of the spectral energy distributions of the local and global indices in relative energy units. All computations were performed using the discrete Fast Fourier Transform (FFT) implementation of the scipy.signal.welch function.
To investigate the temporal variability and scale-dependent organization of geomagnetic index fluctuations, a complex continuous wavelet transform (CWT) was applied using the Morlet mother wavelet with a dimensionless central frequency of ω0 = 6. This approach enables simultaneous localization of features in both time and frequency domains. The CWT method has been widely employed to identify solar-rotational and seasonal components in geomagnetic activity series [17,18], offering a robust framework for analyzing nonstationary and multiscale dynamics in geomagnetic data. This type of mother wavelet provides an optimal balance between time and frequency resolution, which is particularly important when analyzing quasi-periodic oscillations typical of magnetosphere–ionosphere system dynamics. The time step of the input data was 3 h (Δt = 3h), corresponding to the standard format of three-hour geomagnetic activity indices.
The range of analyzed scales was selected to encompass processes from diurnal to solar-rotational timescales. The minimum scale (Smin) corresponded to a period of approximately 18 h, while the maximum scale (Smax) extended to about 64 days. This configuration allowed the detection of oscillations with characteristic periods of 10–30 days, representing modulation of solar wind fluxes and reorganization of magnetospheric current systems. The scales were logarithmically spaced with a step of δj = 0.125, providing approximately eight levels of detail per octave. This ensured adequate coverage of both short-term fluctuations and longer periodic components, enabling a detailed examination of multi-scale variability in the K (AAA) and Kp index time series.
To examine the time-dependent correspondence between the local K (AAA) and the aggregated global Kp indices, cross-wavelet transform (XWT) and wavelet coherence (WTC) analyses were performed using the same Morlet mother wavelet. In both cases, Gaussian smoothing in time and scale domains (3 × 3 window) was employed to suppress noise and stabilize coherent structures. Statistical significance was assessed at the 95% confidence level relative to a red-noise background model using a χ 2 -test. Phase arrows plotted on the coherence diagrams were used to interpret temporal phase shifts between the two series: right-pointing arrows indicate in-phase correspondence, whereas left-pointing arrows represent anti-phase behavior, implying that variations in Kp precede those in K (AAA). These methods allow for the identification of intervals of stable, coherent behavior in the energy contributions of both indices and to quantify temporal offsets and scale-dependent phase shifts between the signals [19]. Such an approach provides a detailed view of the synchronization and temporal coupling between regional and global geomagnetic activity variations.
The combined application of spectral and wavelet methods made it possible not only to identify persistent solar-rotational rhythms (~27 days) but also to quantitatively characterize differences in the energy distribution between local and global geomagnetic indicators. These findings are consistent with the results reported by [4,20], confirming the presence of region-specific energy responses within the broader framework of solar-terrestrial coupling.

2.4. Multifractal and Nonlinear Analysis

To characterize the nonlinear structure of the geomagnetic index time series, the Multifractal Detrended Fluctuation Analysis (MFDFA) method was applied. The analysis was implemented in a custom Python 3.11.1 module with adaptive selection of scales and q-parameters, based on the open-source MFDFA package [21,22].
The MFDFA technique is grounded in evaluating the dependence of fluctuation functions on the window scale, allowing the detection of hidden scale hierarchies in the signal, manifested through the Hurst exponent h (q) variability. For each moment order q, a set of h (q) estimates was obtained, from which the singularity spectrum f (α) was derived, describing the distribution of local scaling exponents in the signal.
In this study, the range of moments was set to q ∈ [−5, +5] with 25 uniform steps, ensuring a balanced characterization of both strong (q > 0) and weak (q < 0) fluctuations. The segmentation scales s varied from 27 points up to N/4, where N is the total length of the series.
To analyze temporal variability in the multifractal properties, a sliding-window approach was applied with a window length of 365 days and a step of 14 days, enabling the tracking of temporal evolution in multifractal parameters and the identification of periods associated with enhanced dynamical complexity of geomagnetic activity.
Based on the h (q) dependencies, a spectrum of singularities f (α) was constructed, where α = h (q) + q and f (α) = q[α − h(q)] + 1. The main quantitative indicators were extracted from it: the width of the spectrum Δα = αmax − αmin, reflecting the degree of multifractality; asymmetry, characterizing the predominance of weak or strong fluctuations; the position of the maximum f (α) − α0, corresponding to the most probable local scaling exponent; and the entropy of the spectrum, which estimates the probability distribution over α. It is defined by the expression:
S f = i = 1 n P ( α i ) ln P ( α i ) ,   P ( α i ) = f ( α i ) j = 1 n f ( α j )
where P ( α i ) is the normalized distribution of the spectrum density.
The obtained characteristics were interpreted as quantitative markers of the structural complexity of geomagnetic variations. High values of spectrum width (Δα) and spectral entropy ( S f ) indicate the presence of multiple active scales and strong nonlinear correlations, whereas a narrow spectrum with low entropy corresponds to more homogeneous and stationary processes.
In addition, permutation entropy (PE) was calculated to quantify the degree of signal chaoticity at small scales. Permutation entropy, based on the ordinal pattern method proposed by [23] and further developed by [24], enables the detection of changes in the local structure of a time series without prior assumptions about its distribution. This metric serves as a sensitive indicator of transitions between ordered and chaotic regimes in the system’s dynamics. When combined with the multifractal approach, PE provides complementary information, enhancing the sensitivity of the analysis to stochastic components and short-term irregularities in geomagnetic activity.
The algorithm is based on comparing ordered subsets of length m (the embedding dimension) with a lag τ, extracted from a time series. For each subset, a permutation of the ranks of the elements is determined, after which the probability distribution of all x (t) possible m! permutations is calculated. The normalized Shannon entropy is:
H P E = 1 ln ( m ! ) i = 1 m ! p i ln ( p i ) ,
where p i is the probability of the i-th permutation, characterizes the relative level of chaos of the dynamics: H P E 1 corresponds to a completely stochastic process, H P E 0 —deterministic.
In this study, the parameters embedding dimension m = 5 and time delay τ = 1 were used, providing an optimal balance between sensitivity and statistical stability for time series of several thousand data points. Calculations were performed within a sliding window of 90 days with a 24 h step, allowing the tracking of the temporal evolution of local entropy and the identification of transition periods between regular and chaotic regimes. For comparison between local and global indices, time series of normalized permutation entropy—PE (K) and PE (Kp)—were constructed, together with scatter diagrams illustrating their overall correspondence. Elevated values of permutation entropy, when accompanied by a broad multifractal spectrum, were interpreted as indicators of the system’s transition to a state of enhanced turbulence and instability.
The combined application of MFDFA and entropy-based measures enabled a quantitative description of the nonlinear dynamics of geomagnetic processes and revealed clear distinctions between the local (K) and global (Kp) indices. It was found that the local index exhibits a more pronounced multifractal structure and higher entropy, reflecting the sensitivity of the AAA observatory to regional ionospheric current systems and other processes that are not fully represented in globally averaged indicators.

3. Results

3.1. Statistical Analysis

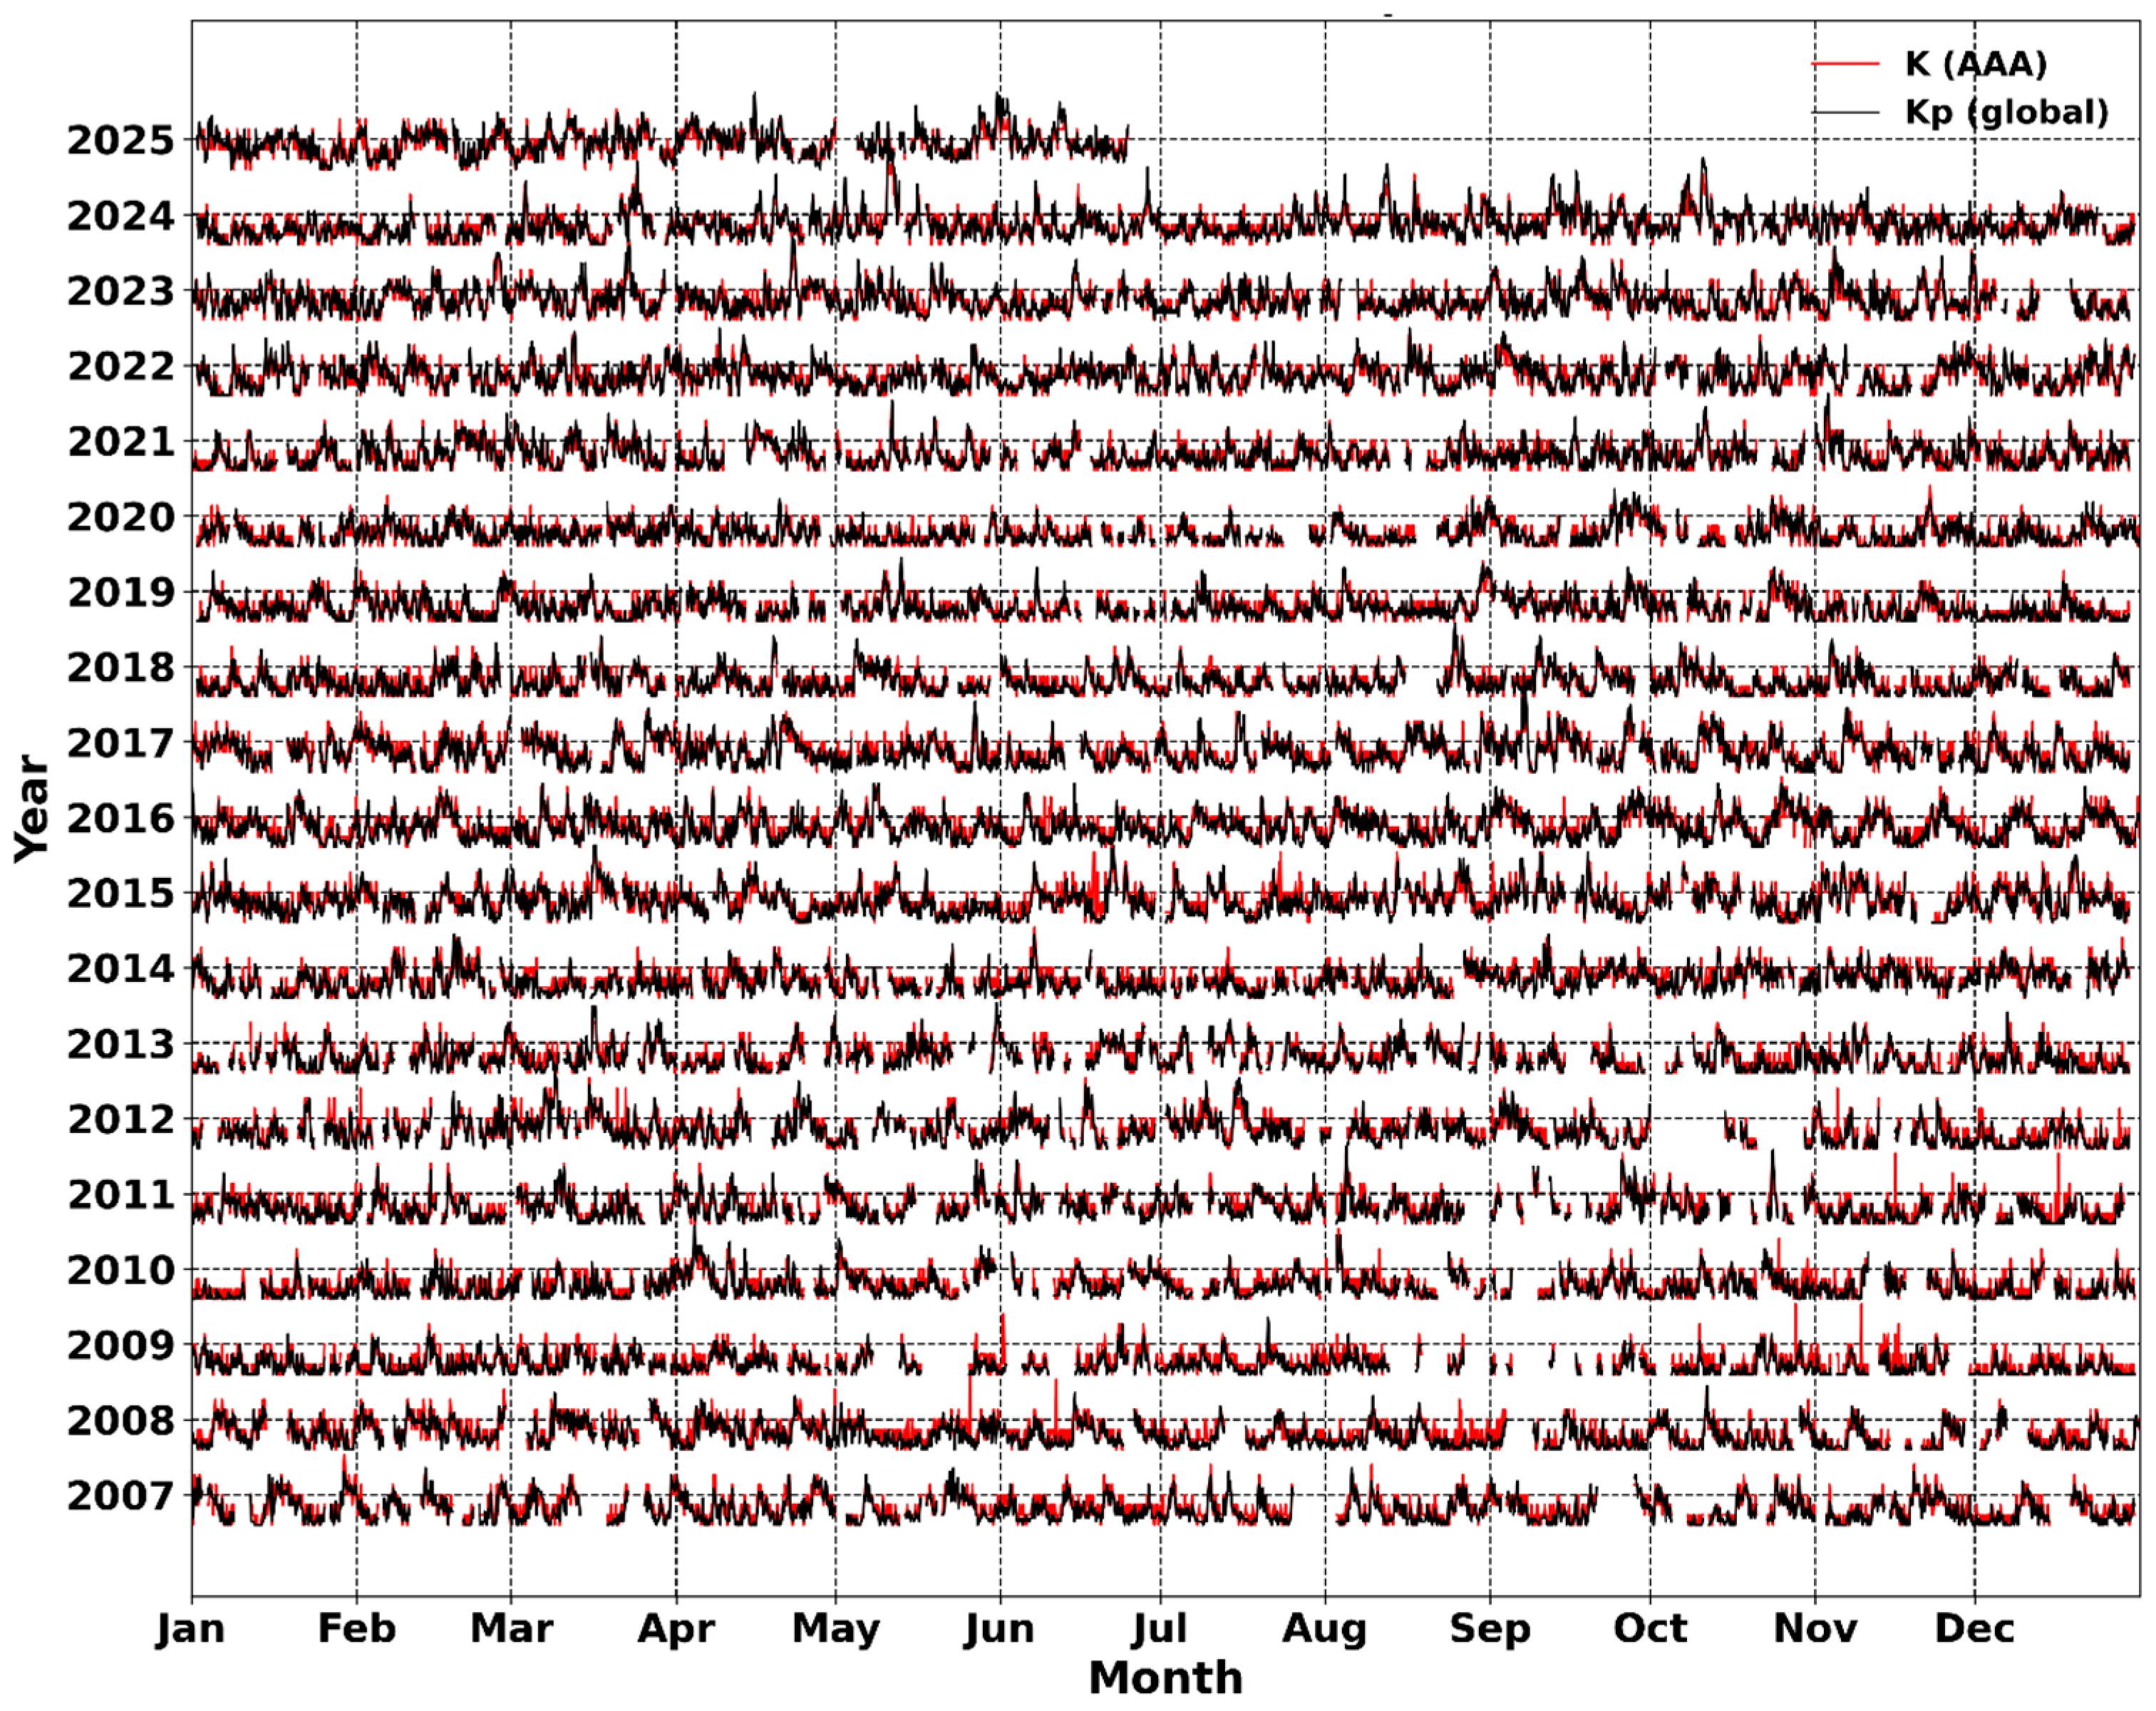
A comparison of the three-hour values of the local K (AAA) and global Kp indices revealed a high degree of coherence between the two time series. As shown in Figure 1, both indices exhibit clear synchronization during periods of enhanced geomagnetic activity; however, the local index displays larger amplitude fluctuations and pronounced diurnal variations. In contrast, the global Kp index demonstrates a smoother behavior, reflecting the averaging of data from a distributed network of magnetic observatories.
This discrepancy between K and Kp emphasizes that local measurements are more sensitive to small-scale processes and can capture disturbances not evident in global indices. The overall similarity in their dynamics during magnetic storms confirms that regional magnetospheric responses are in phase with global solar–terrestrial processes. Nevertheless, differences in the amplitude and structural patterns of variations indicate that the local K index serves as a complementary diagnostic parameter, providing valuable insight into the spatial inhomogeneity of the magnetospheric response.
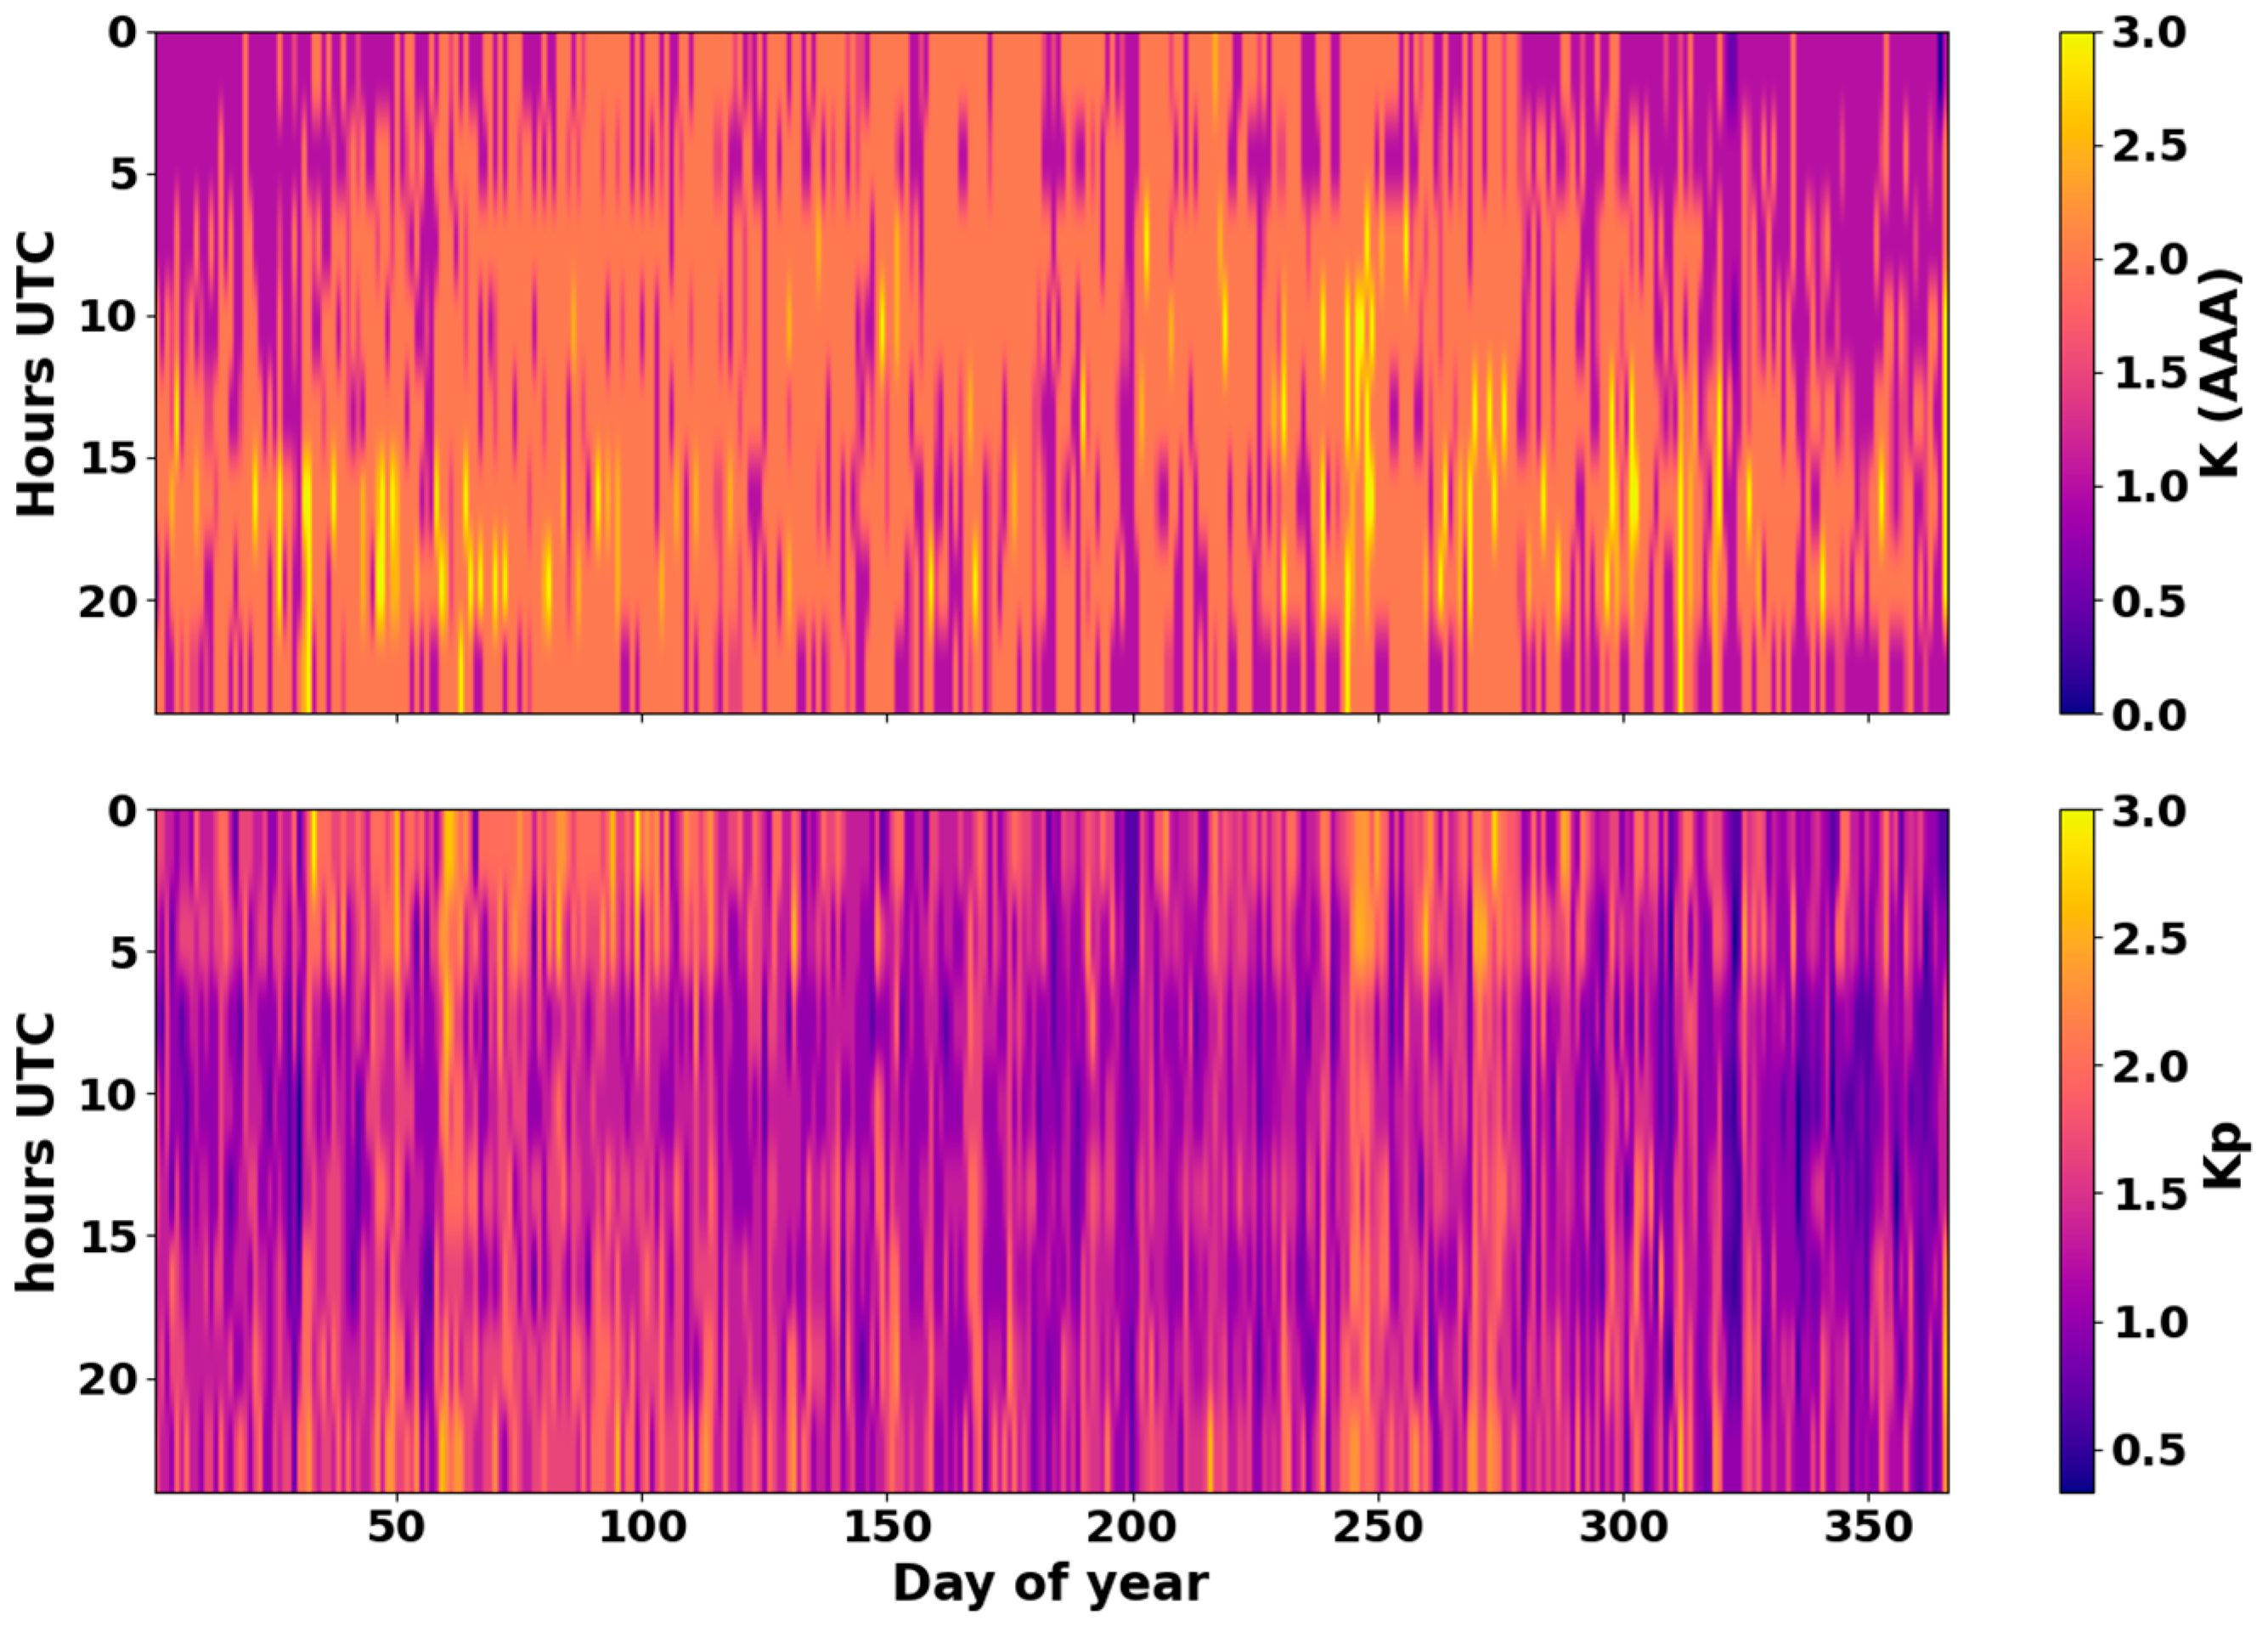
To identify diurnal and seasonal patterns in local and global manifestations of geomagnetic activity, heat maps of the median values of the K (Almaty Observatory, AAA) and Kp indices were constructed in the coordinates “day of year—hour (UTC)”. As shown in Figure 2, both indices exhibit pronounced spatial–temporal inhomogeneity, reflecting the combined influence of seasonal effects and diurnal variations in magnetospheric disturbances.
For the local K (AAA) index, a distinct dependence on local time is evident: maxima of median values occur in the 18–23 UTC interval, corresponding to evening and nighttime hours in Kazakhstan. This structure is consistent with the typical ionospheric dynamics, in which variations in conductivity and current systems are most intense in the evening magnetospheric sector. In contrast, the global Kp index exhibits a smoother and more uniform distribution, reflecting averaging across all latitude zones. Nonetheless, seasonal shifts in intensity are also visible, particularly near the equinoxes, confirming the presence of the Russell–McPherron effect [25,26], which enhances the coupling between the interplanetary magnetic field and the magnetosphere during these periods.
A comparison of the maps reveals that the local K (AAA) index demonstrates greater contrast and sensitivity to regional disturbance features, whereas the global Kp index is more inertial, representing the integrated global level of geomagnetic activity. Thus, local observations are capable of capturing small-scale processes and short-term variations that tend to be smoothed out in the formation of global indices.
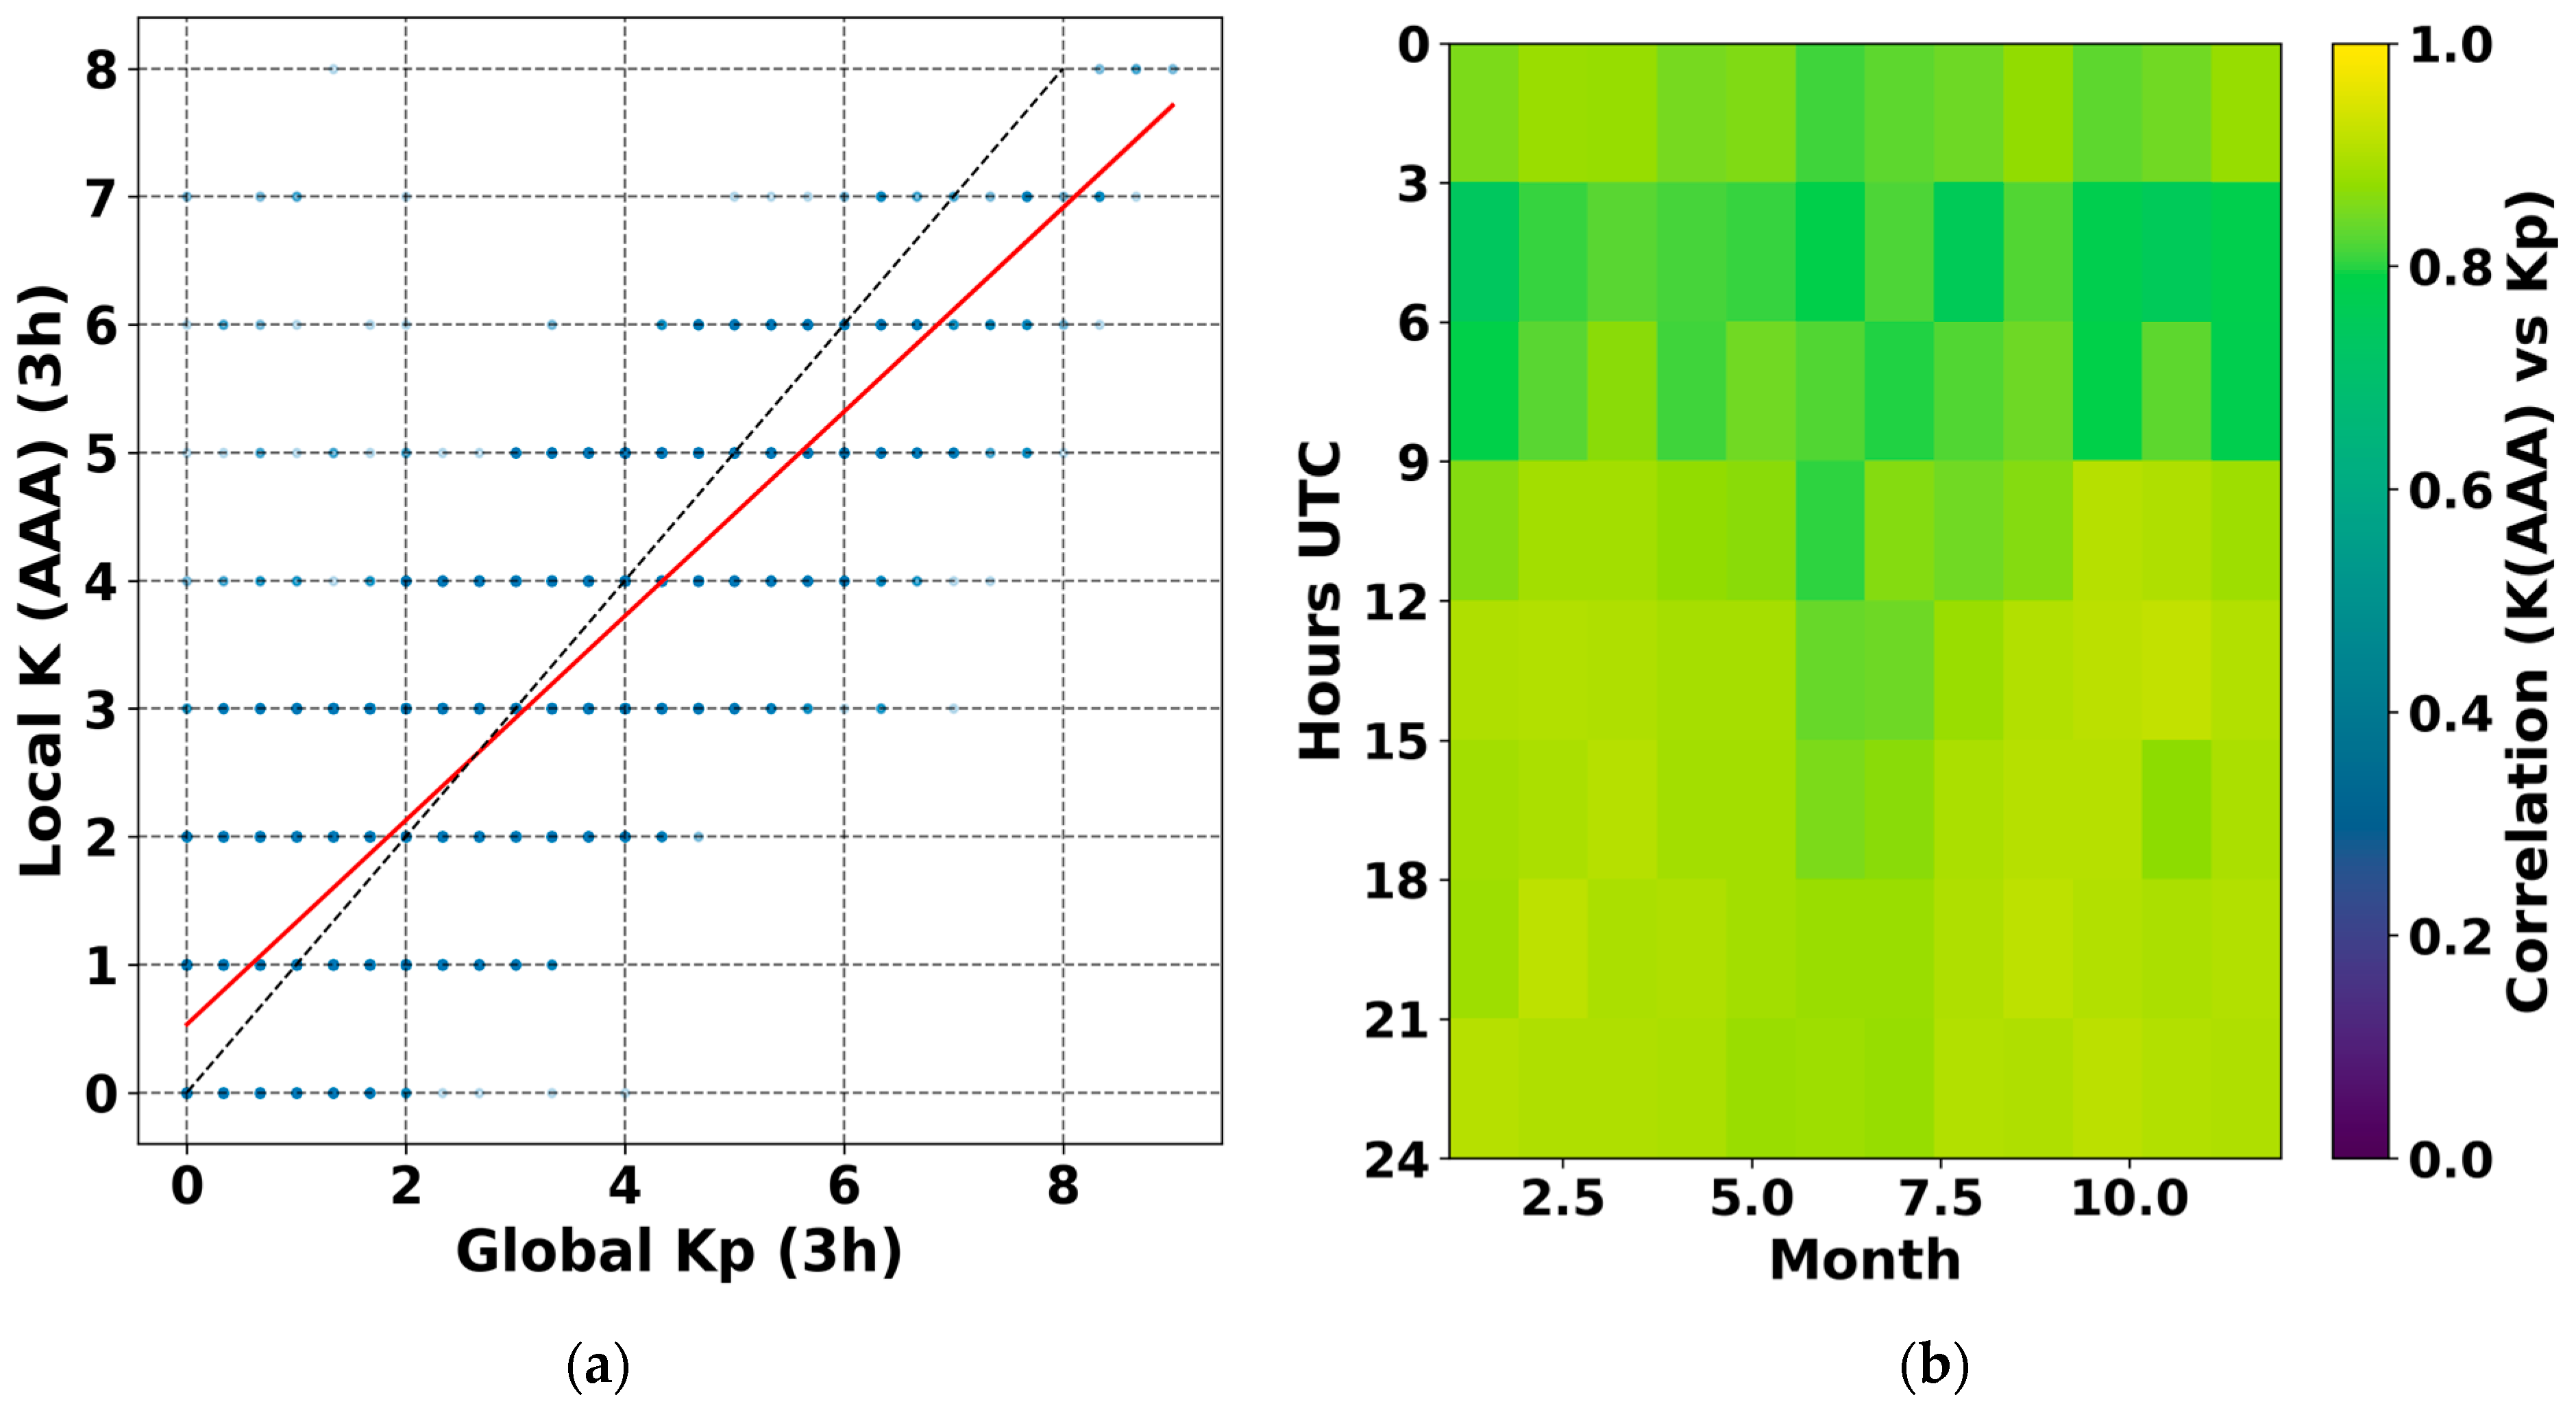
Figure 3a presents a scatter plot comparing the local geomagnetic activity index K (AAA) and the global Kp index, calculated for three-hour intervals over the entire observation period. Each point represents the correspondence between local and global levels of geomagnetic activity, while the red line indicates the linear regression fit. A clear positive correlation between K (AAA) and Kp (correlation coefficient r ≈ 0.84) is observed, indicating a strong overall consistency between regional and global magnetospheric processes.
At the same time, the local K (AAA) values show the closest correspondence to the global Kp index within the range of moderate disturbances (Kp ≈ 2–5), where the scatter around the regression line is minimal. Outside this range, the dispersion increases, reflecting the growing influence of local factors such as ionospheric current systems, the electrojet, and the geomagnetic latitude of the station, which modulate the amplitude of local magnetic field variations.
The high degree of correlation, coupled with persistent local deviations, confirms the complex, multiscale nature of magnetospheric processes, where global drivers interact with regional electrodynamic responses.
Figure 3b shows a two-dimensional correlation map between the local geomagnetic index K (AAA) and the global Kp index in the coordinates “month × hour (UTC)”. The color scale represents the Pearson correlation coefficient between the two indices, averaged over the entire observation period (2007–2025).
The highest correlation values (r ≈ 0.8–0.9) are observed during the evening and nighttime hours (18:00–03:00 UTC), when the geomagnetic field at the station is most sensitive to variations in magnetospheric current systems, particularly during substorm activity. In contrast, the correlation weakens slightly during daytime hours (06:00–12:00 UTC), reflecting the influence of local ionospheric currents driven by solar heating and conductivity variations. The local time at the Almaty (AAA) observatory corresponds to UTC + 6 h.
This diurnal modulation of correlation indicates the coexistence of global magnetospheric drivers and regional ionospheric responses, emphasizing the importance of local observations for resolving the temporal and spatial structure of geomagnetic activity.
The scatter plot illustrates a consistent correspondence between the magnitudes of the local K (AAA) and global Kp indices, while retaining a noticeable dispersion, particularly within the range of moderate geomagnetic activity. This indicates that global and local magnetic field variations are driven by the same disturbance sources, yet the amplitude of local fluctuations strongly depends on regional current systems and the geomagnetic latitude of the observatory.
The correlation map refines this pattern, revealing a systematic diurnal and seasonal modulation of coherence between the indices. The highest correlation values (r > 0.8) occur during the evening and nighttime hours (UTC), when local magnetic field variations are most in phase with global magnetospheric processes. During the daytime, the correlation weakens slightly due to the influence of ionospheric currents and solar heating-driven diurnal effects.
Seasonal variations are moderate but become more pronounced around the equinoxes, consistent with the Russell-McPherron effect, which enhances the coupling between the interplanetary magnetic field and the magnetosphere during these periods.
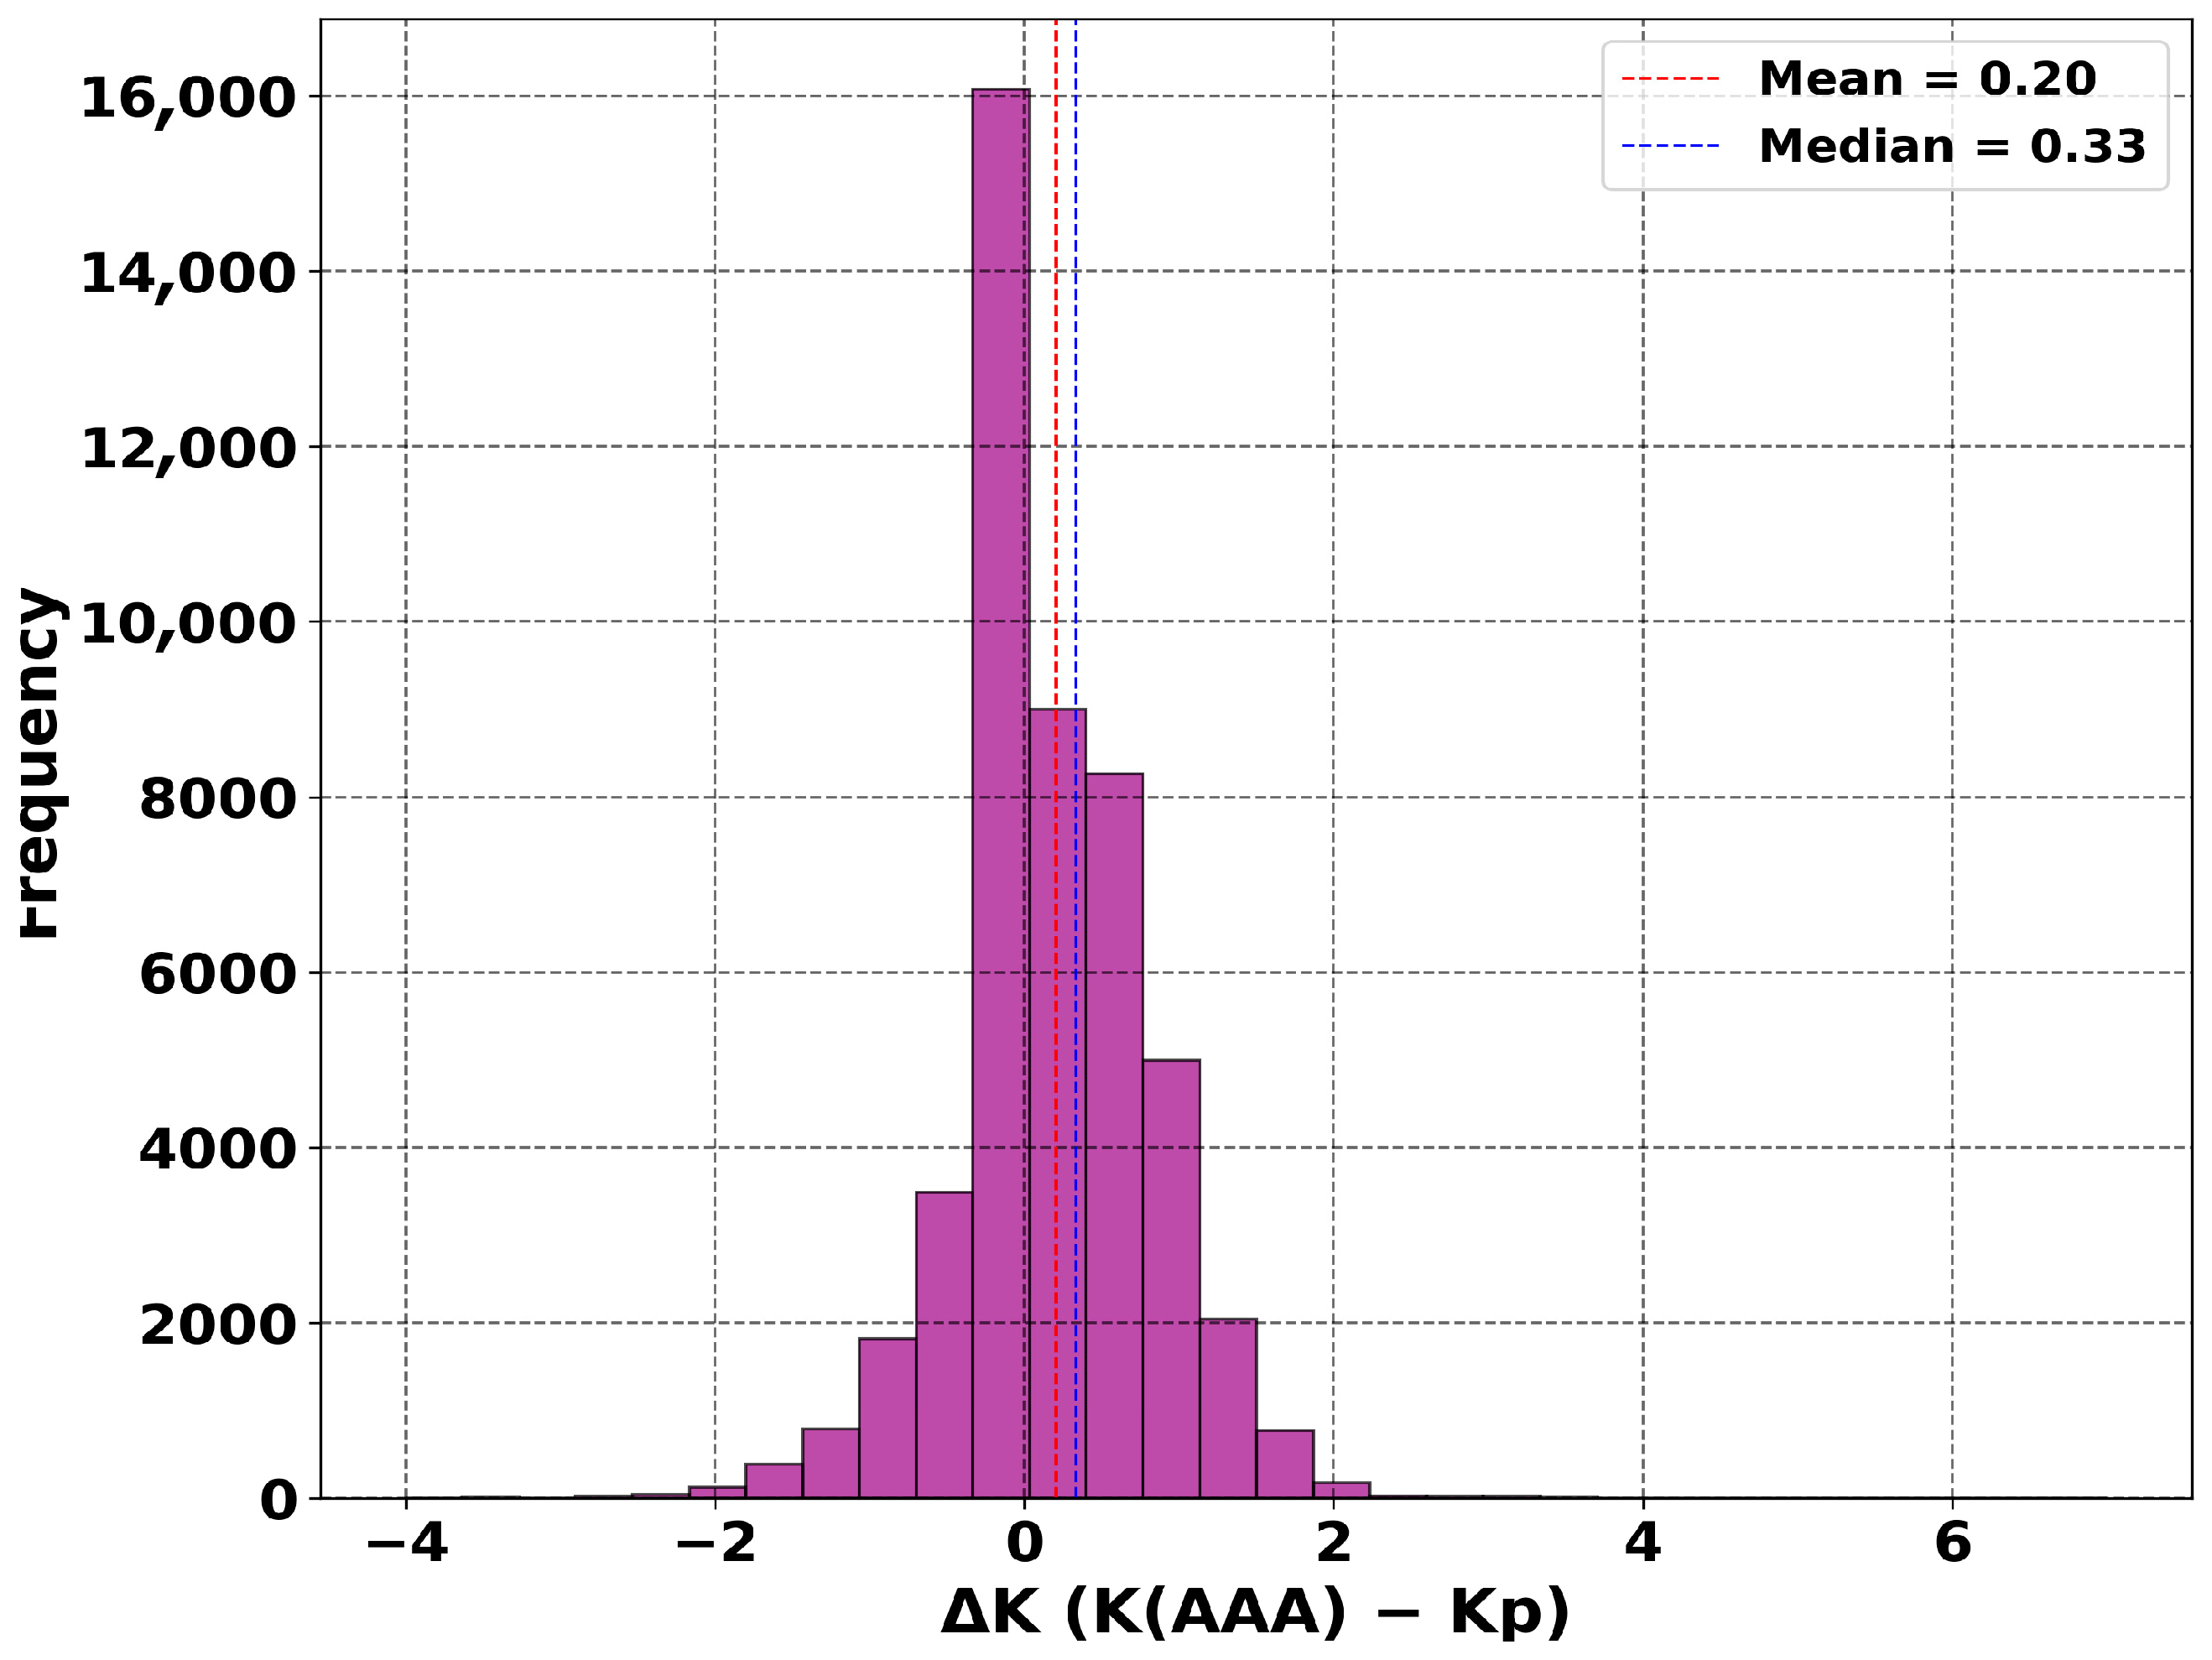
To quantitatively assess the discrepancies, the distribution of differences was calculated as ΔK = K (AAA) − Kp (Figure 4). The mean difference was +0.20, the median +0.33, and the standard deviation approximately 0.69. These results indicate that the local K index systematically exceeds the global Kp index, while the spread of values reflects the presence of additional regional variations.
Thus, there is a consistent positive bias of the local index relative to the global one, suggesting that the AAA observatory records geomagnetic disturbances that, on average, are stronger than those represented by the globally averaged Kp. This bias highlights the enhanced regional sensitivity of the Almaty station to local magnetospheric–ionospheric processes.
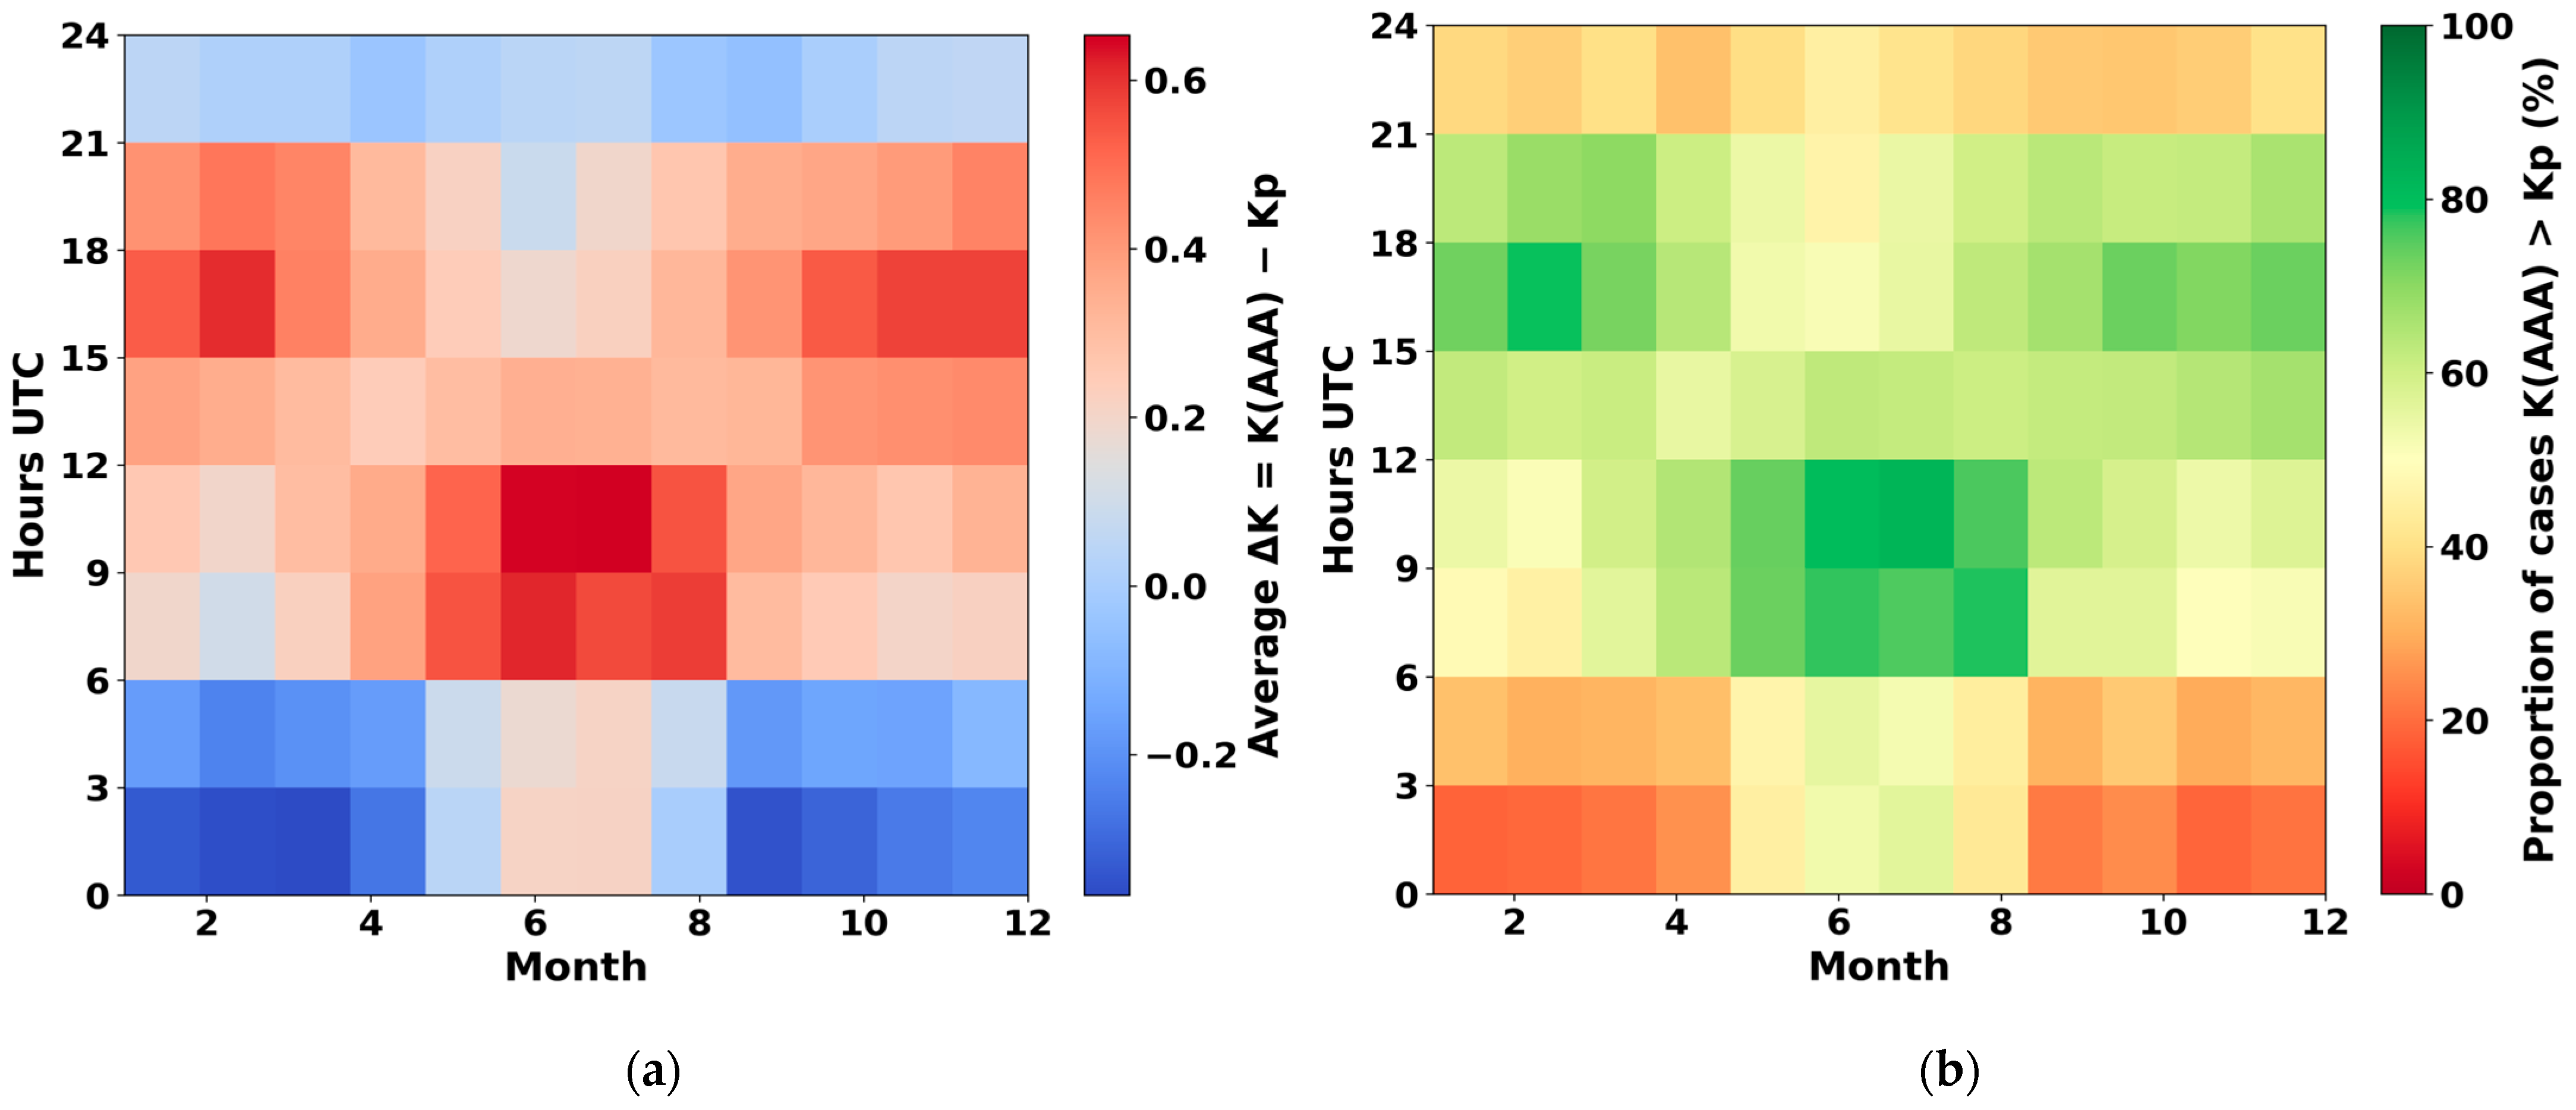
To examine the temporal structure of the discrepancies, the dependence of the offset ΔK = K (AAA) − Kp on month and time of day was analyzed (Figure 5a). It was found that during the nighttime hours (01:30–04:30 UTC), the local index tends to be lower than Kp, particularly in the winter season (ΔK ≈ −0.3 to −0.4). In contrast, during the daytime interval (07:30–16:30 UTC), a persistent positive anomaly is observed (ΔK up to +0.6 in summer), indicating an enhanced sensitivity of the Almaty observatory to disturbances in the dayside magnetospheric sector. The zone of elevated correlation (r ≈ 0.6–0.7) extends from 9 to about 12 UTC.
In the evening hours (around 19:30 UTC), the local index frequently exceeds the global value, while the differences tend to diminish toward midnight. This asymmetry corresponds to variations in ionospheric conductivity and daytime electrodynamic response, consistent with the Russell-McPherron effect, which governs the seasonal modulation of solar wind–magnetosphere coupling.
An additional analysis of the frequency of cases where the local index K (AAA) exceeds the global Kp (Figure 5b) confirmed the previously identified patterns. During daytime hours, the probability of K (AAA) > Kp reaches 60–80%, with a maximum in summer. At night, this probability decreases to 20–30%, while during the transitional seasons (spring and autumn), the contrast between day and night is particularly pronounced.
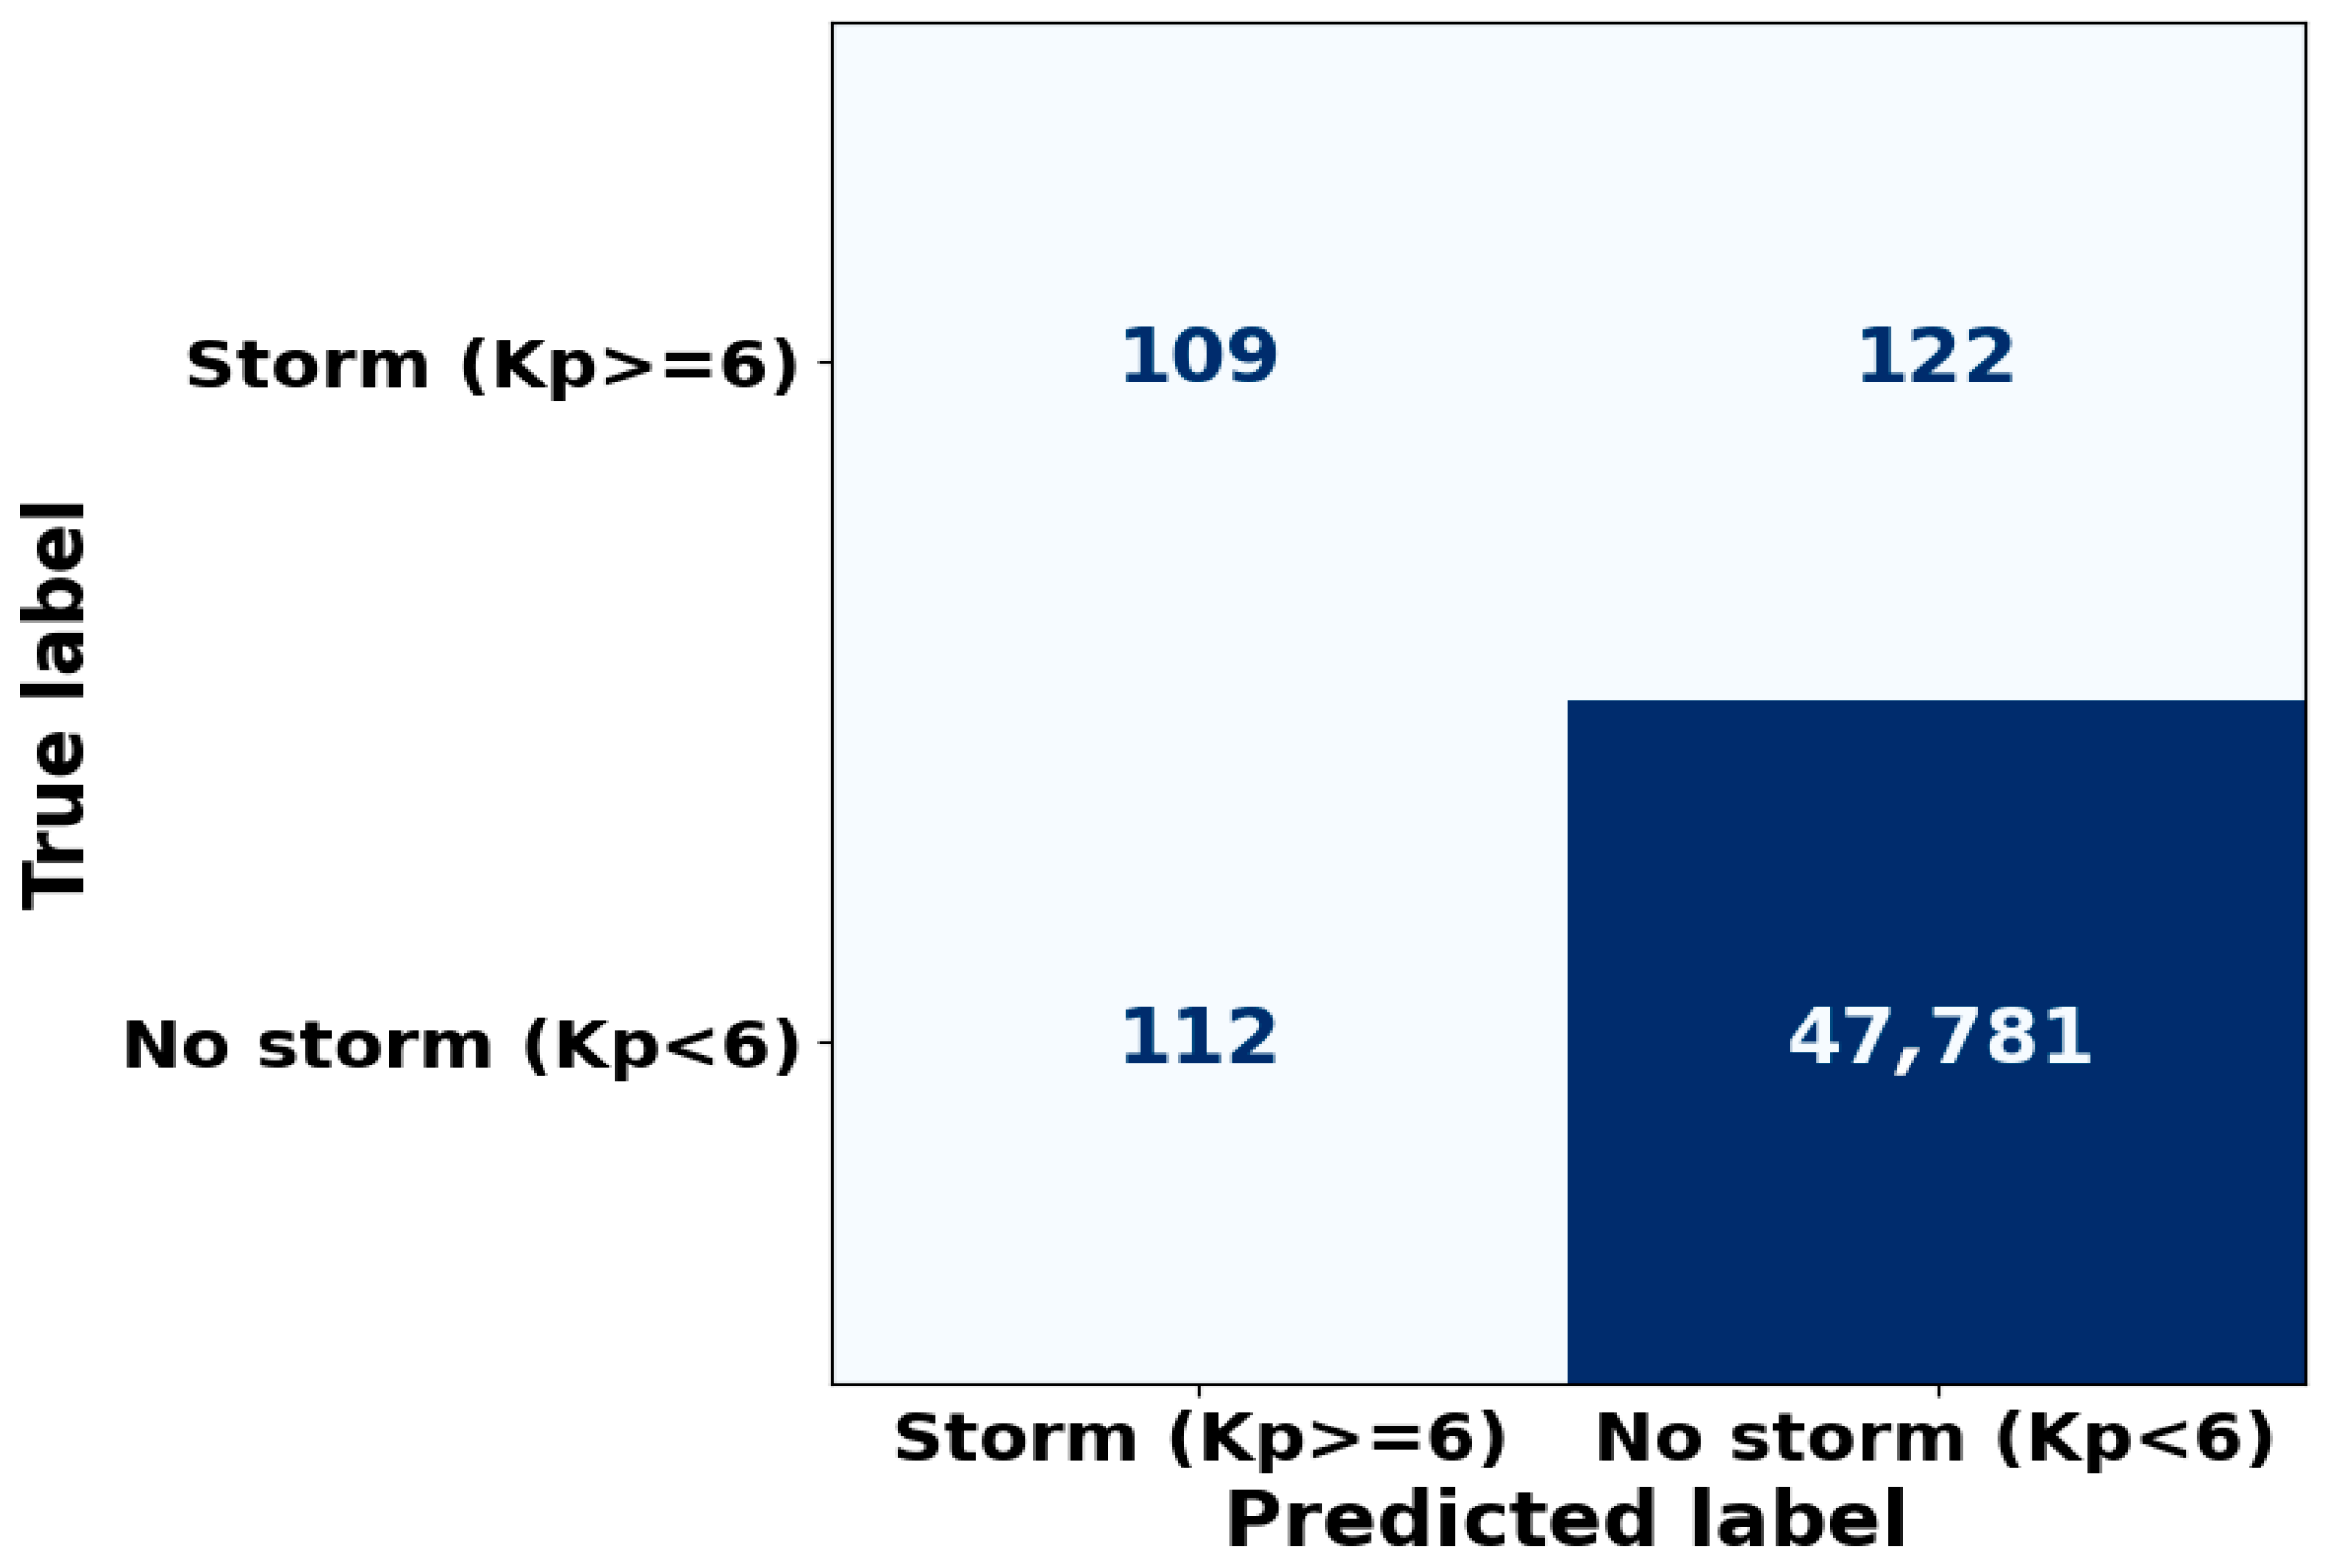
To evaluate the ability of the local K (AAA) index to reproduce global magnetic storms, defined by Kp ≥ 6, an event coincidence analysis was performed. In this case, an interval was classified as a “magnetic storm.” Based on the three-hour data, a confusion matrix was constructed to represent the matches and mismatches between the local and global indices (Figure 6):
  • True Positive (TP)—storms detected by both Kp and K(AAA): 109 cases;
  • False Negative (FN)—storms identified by Kp but not detected at K (AAA): 112 cases;
  • False Positive (FP)—local events with K (AAA) ≥ 6 while Kp remained below the threshold: 122 cases;
  • True Negative (TN)—absence of storms in both datasets: 47,781 cases.
Thus, in the vast majority of intervals, the indices show strong agreement, while individual discrepancies reflect the regional specificity of the geomagnetic field response.
For a more detailed assessment, a ROC curve was constructed using the local K (AAA) index as a classifier of geomagnetic storms relative to the global Kp index (Figure 7). The resulting AUC value of 0.99 indicates an almost perfect agreement between the two datasets.
The AAA observatory demonstrates a high reliability in detecting extreme geomagnetic disturbances. However, in some instances, it registers local enhancements that are not reflected in the global Kp index (false positives, FP), while in other cases it misses individual global storm events (false negatives, FN). These discrepancies are likely associated with regional characteristics of the geomagnetic response, influenced by the specific longitude and latitude of the observatory and the local configuration of ionospheric current systems.

3.2. Spectral and Wavelet Analysis

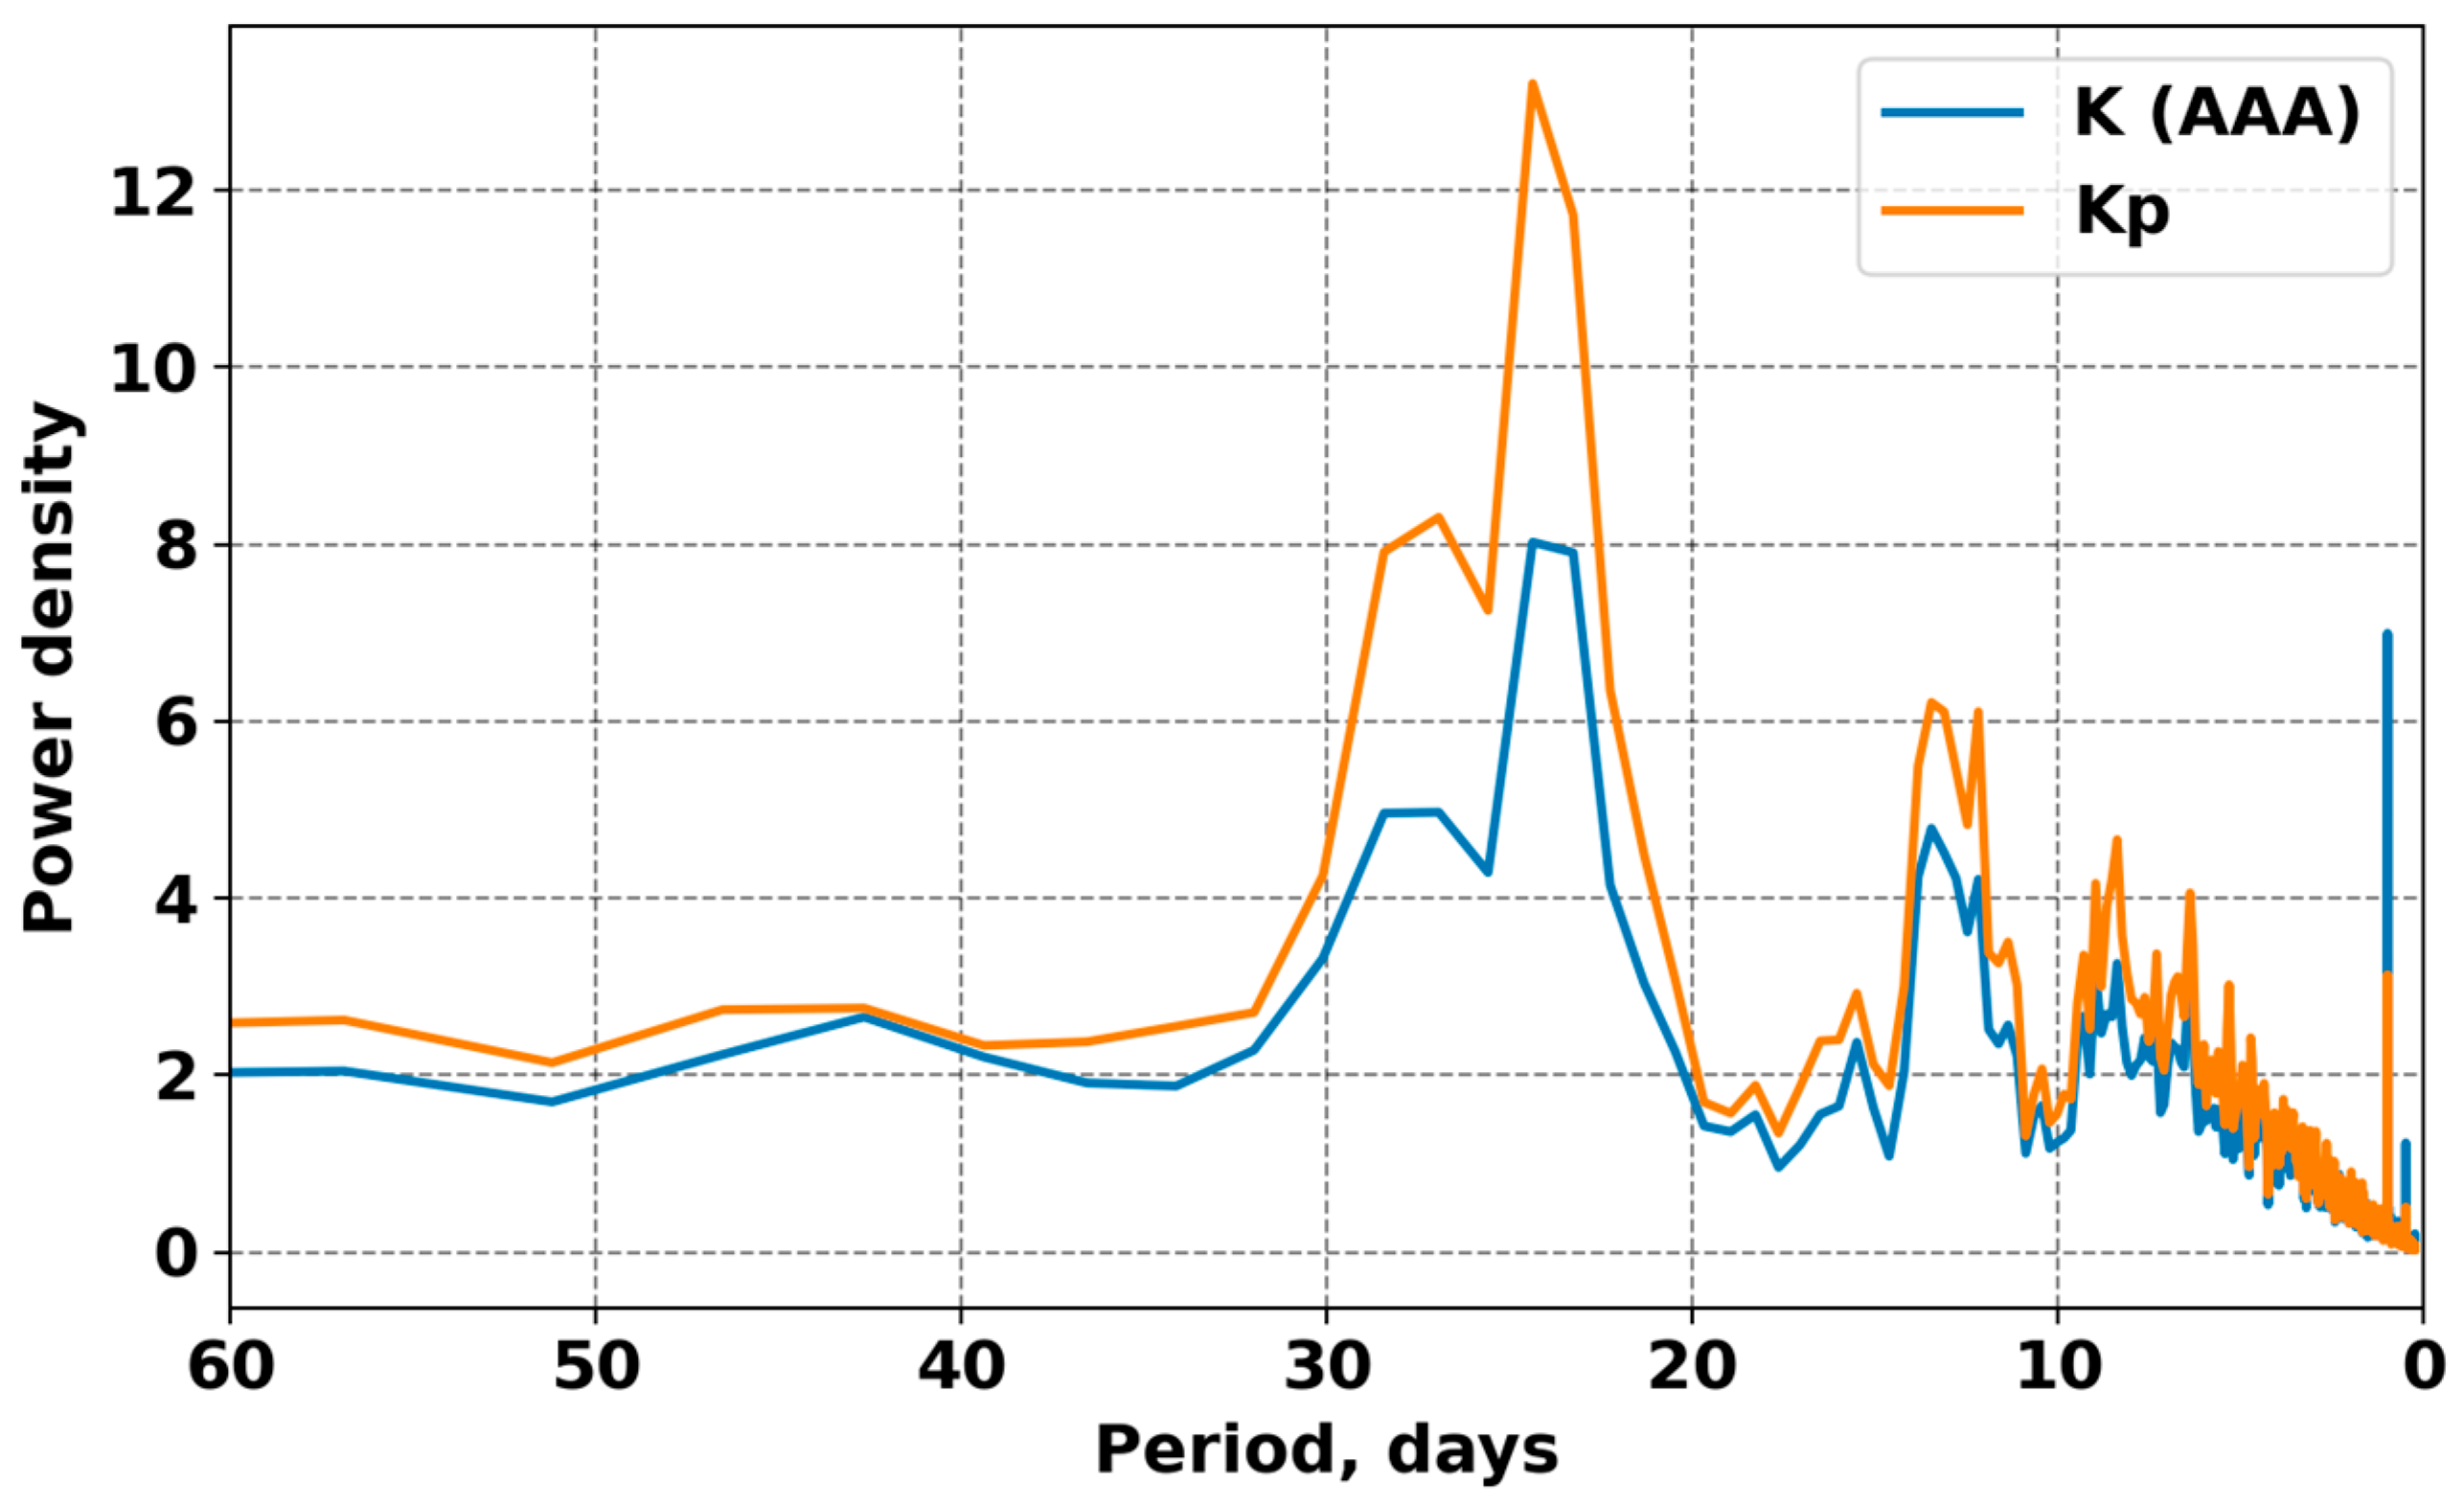
To identify the dominant periodicities in the dynamics of geomagnetic activity, a spectral analysis of the time series of the local K (AAA) index and the global Kp index was performed. Calculations were carried out using the Welch method with periodogram averaging, which reduced the variance of the PSD estimates.
A comparison of the spectra (Figure 8) showed that both indices exhibit similar spectral characteristics, reflecting the common physical origin of geomagnetic field disturbances. The most persistent spectral peaks correspond to the following periodicities [27]:
  • ~27 days—the solar rotation period, determining the recurrence of large-scale solar wind disturbances;
  • ~13–14 days—a subharmonic of solar rotation, associated with the asymmetry of solar wind streams within the heliospheric structure;
  • 7–9 days—oscillations reflecting the dynamics of recurrent interplanetary disturbances.
Both spectra exhibit a pronounced peak near a 24-day period, corresponding to a subharmonic of the solar rotation cycle. This component reflects recurrent magnetospheric disturbances driven by long-lived solar wind structures—such as coronal holes and co-rotating interaction regions—which modulate geomagnetic activity on quasi-periodic timescales [28].
At shorter periods (<10 days), the overall spectral power of K (AAA) is comparable to that of Kp; however, a slight enhancement is observed in the 1–3 day range, reflecting the sensitivity of the local index to short-lived regional geomagnetic disturbances and substorm activity but the average Kp partially smooths out these rapid changes.
The higher power density of the global Kp spectrum compared to the local K (AAA) spectrum indicates that large-scale, persistent geomagnetic variations contribute more strongly to the global index. This reflects the cumulative nature of Kp, which integrates magnetospheric responses across multiple longitudes, thereby amplifying stable periodic components such as solar-rotational and seasonal variations.
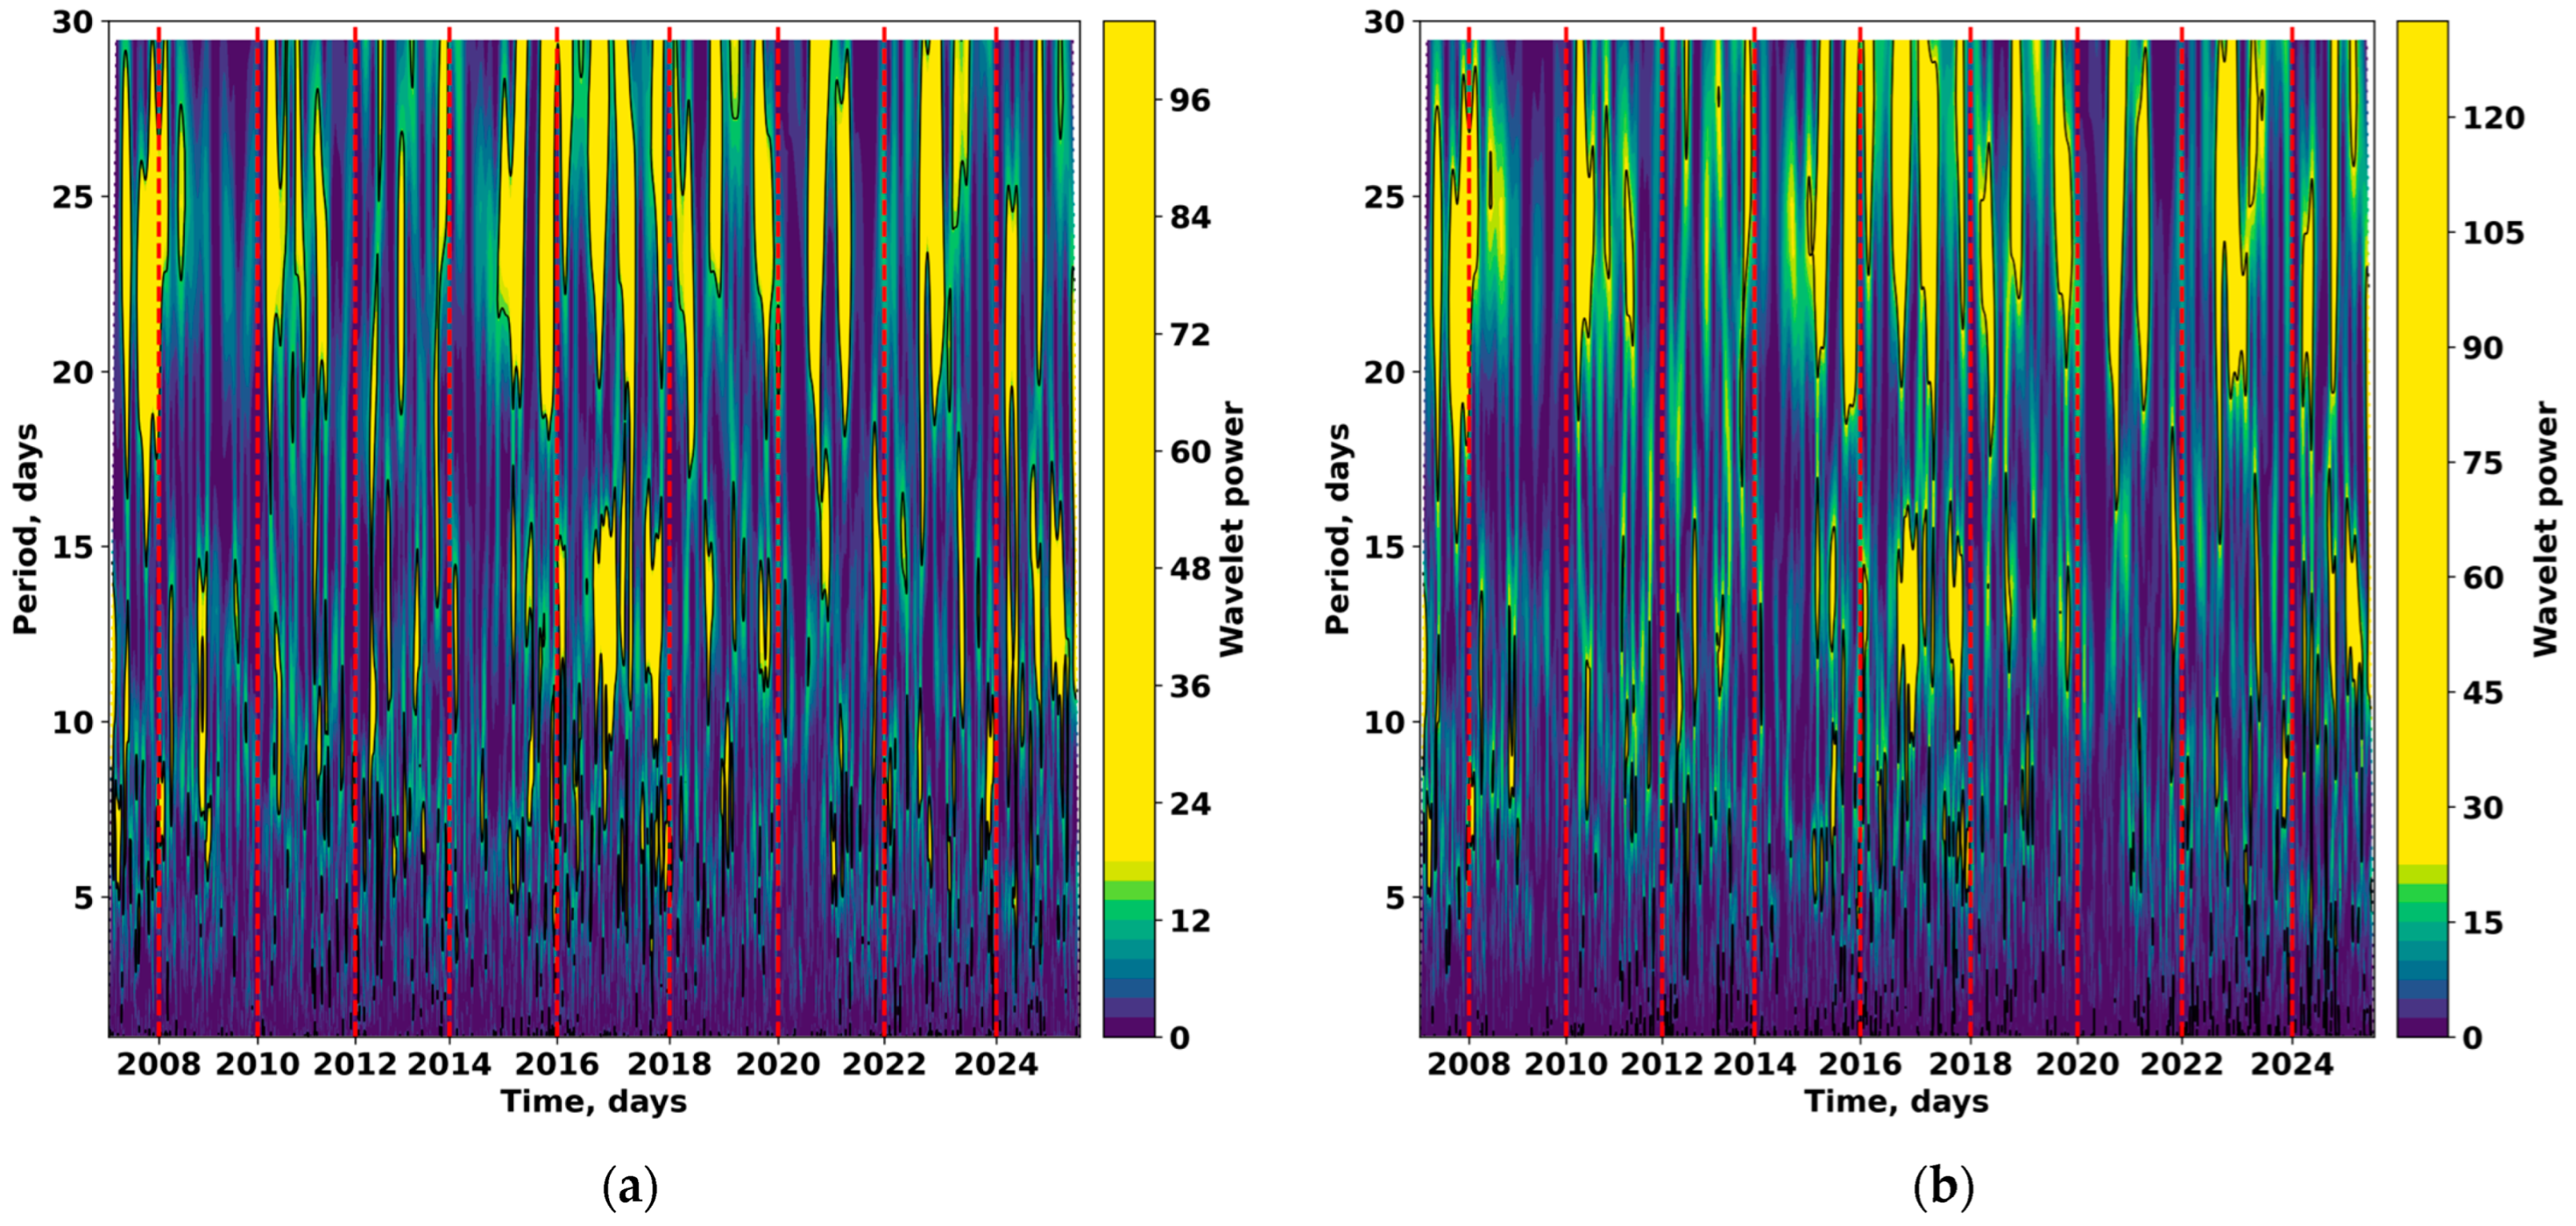
To analyze the temporal evolution of periodicities, a wavelet decomposition of the K (AAA) and Kp time series was performed using the complex Morlet wavelet. Figure 9a,b show the wavelet scalograms of the local geomagnetic index K (AAA) and the global Kp index, obtained via the continuous wavelet transform (CWT) with a Morlet basis. The color scale represents the normalized wavelet power, which characterizes the relative energy of oscillations as a function of period (vertical axis) and time (horizontal axis).
Both indices exhibit a clearly defined multiscale temporal structure. The power maxima occur at periods between 5 and 30 days, corresponding to the characteristic timescales of magnetospheric disturbances associated with the solar rotation period and recurrent solar wind streams. However, the amplitude of energy contributions and the temporal stability of these components differ significantly between the local and global indices, reflecting differences in their sensitivity to regional versus planetary-scale processes.
In the scalogram of the local K (AAA) index, short-period components dominate-ranging from 3 to 20 days—appearing as alternating bands of enhanced power. These variations reflect the influence of local current systems and Sq-type ionospheric currents, which form under the combined effects of diurnal and seasonal changes in atmospheric conductivity.
Frequent energy bursts with periods around 27 days correspond to solar rotation, reflecting the recurrence of Earth’s interaction with long-lived solar wind structures. The enhancement of power in the 15–30 day range is especially pronounced during solar maximum years (2013–2015 and 2023–2025), indicating an intensified impact of solar disturbances on local geomagnetic processes.
The scalogram of the Kp reveals similar dominant periodicities (10–30 days), but its energy distribution is smoother and extends over a broader range of scales. This reflects the contribution of longitudinally and latitudinally averaged magnetospheric processes. Broad zones of enhanced power are particularly evident during solar-maximum intervals and major geomagnetic storms, indicating the integrated global response of the magnetosphere to solar forcing.
Broader zones of power enhancement at scales of approximately 20–40 days may be associated with seasonal variations in the orientation of the geomagnetic field and the Earth’s axial tilt (the Russell–McPherron effect), as well as with the influence of persistent high-speed solar wind streams recurring with sub-rotational periodicities.
Local power peaks in the K (AAA) index often precede similar enhancements in Kp, suggesting that local processes may act as a leading phase in the development of global geomagnetic activity. This observation is consistent with the multifractal analysis results, which showed that local variations exhibit a higher degree of nonequilibrium and intermittency. Hence, local data reveal a more complex structure of high-frequency variability, whereas the global index predominantly reflects long-term and stable modulations.
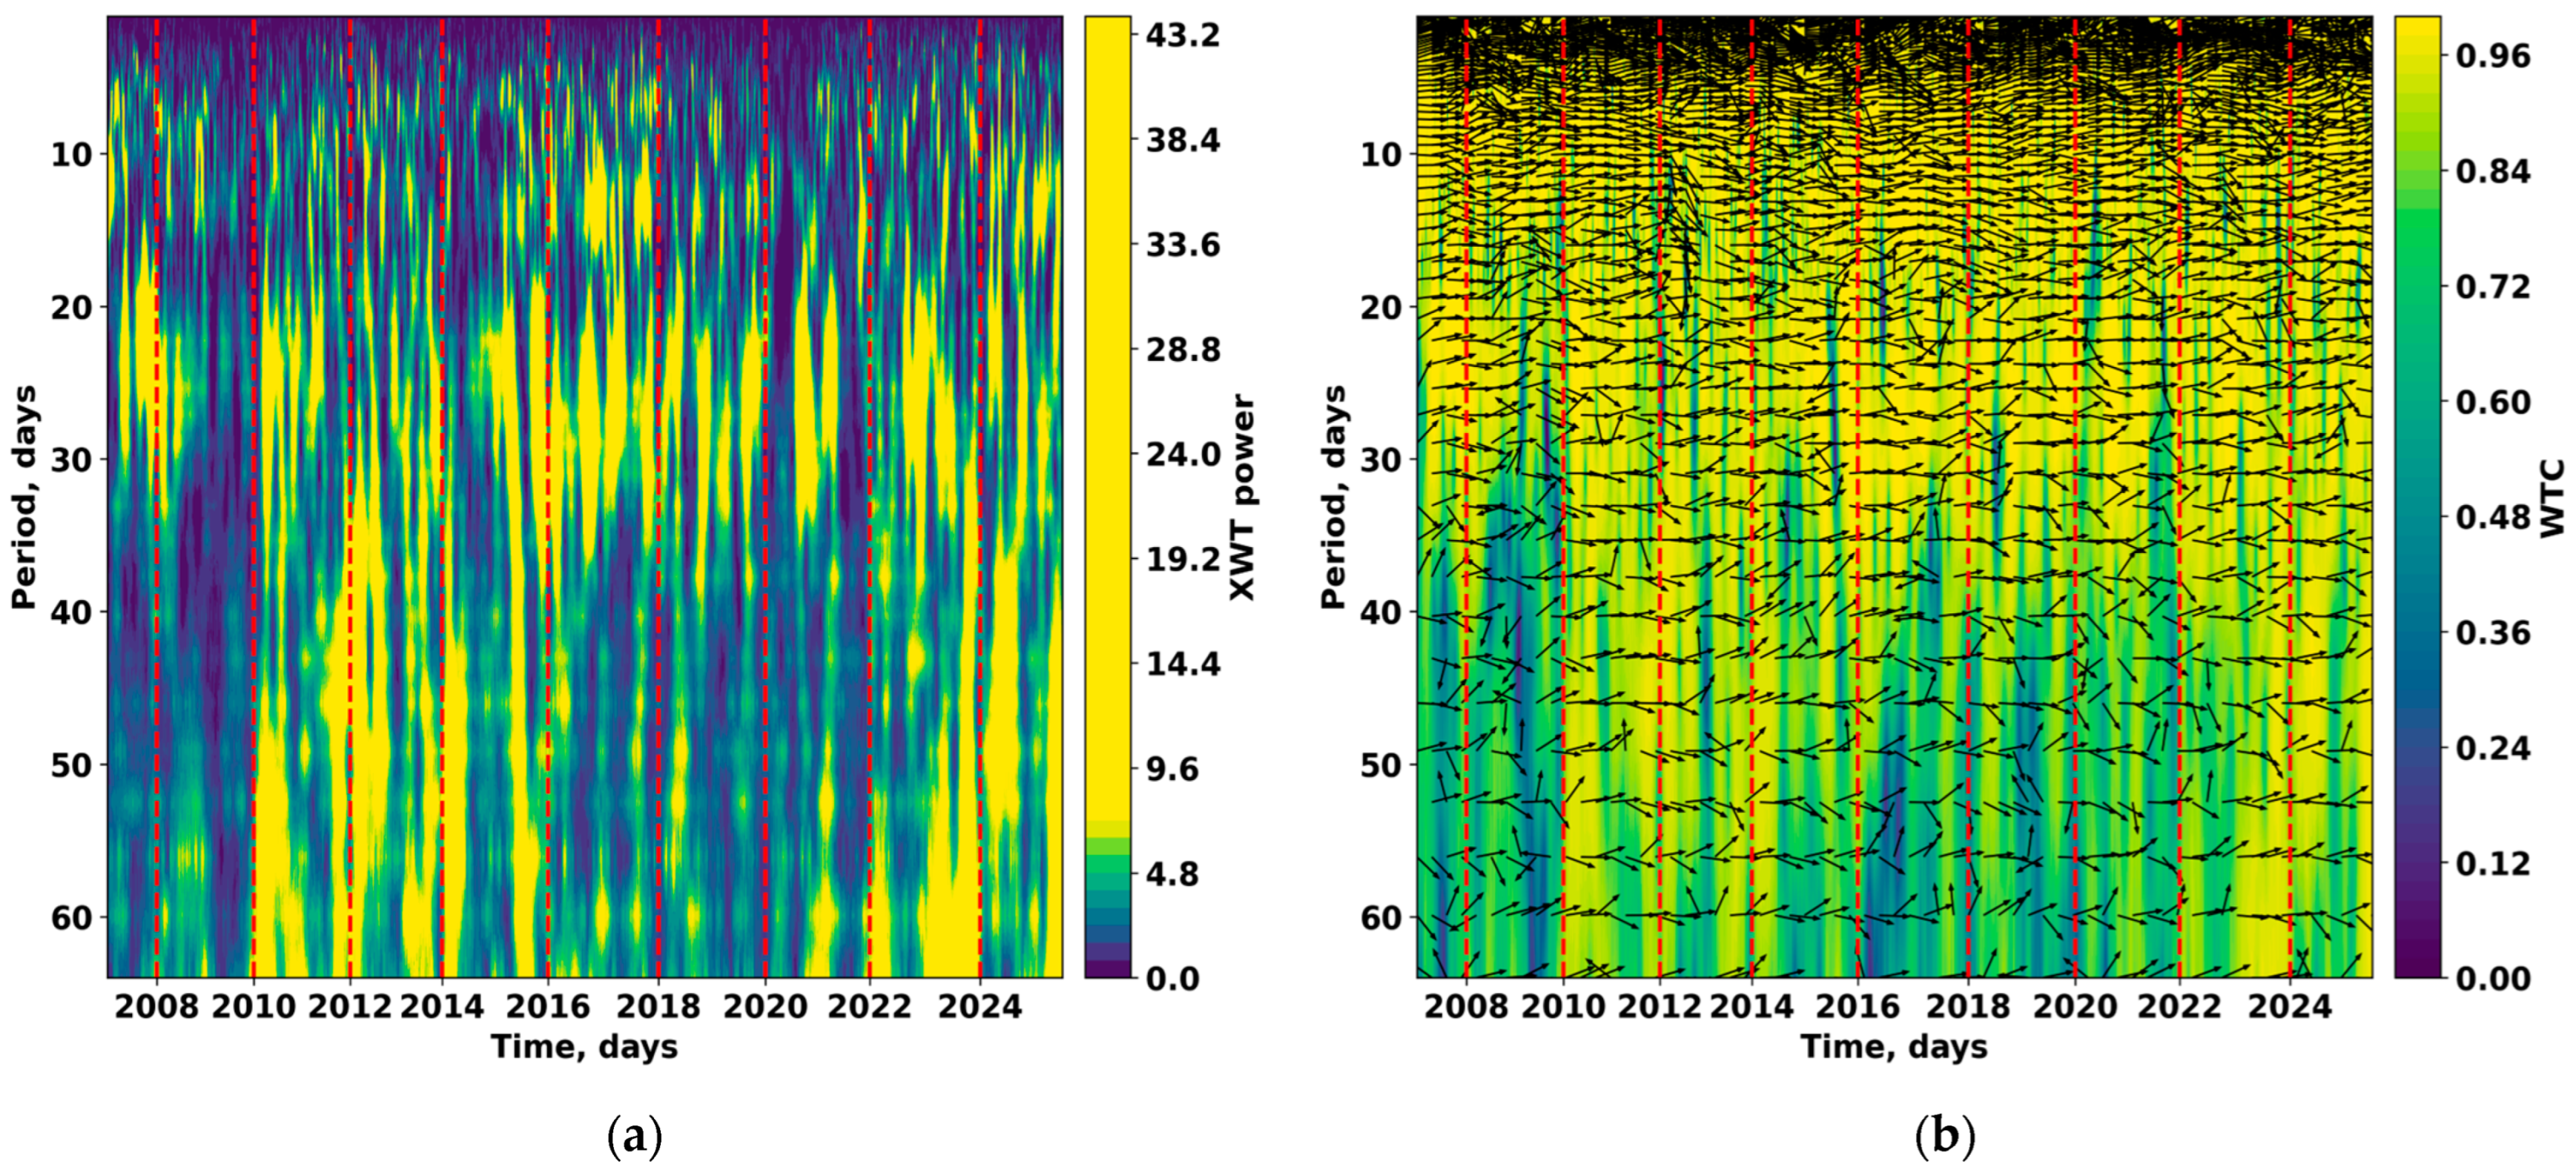
Figure 10a,b illustrate the time-dependent correspondence between the Almaty K (AAA) index and the aggregated global Kp index revealed through cross-wavelet and coherence analyses. The regions of enhanced power and coherence indicate stable in-phase dynamics within the 10–30 day period range, confirming a common solar modulation of both local and global magnetospheric processes.
The wavelet diagrams reveal that the correspondence between local and global magnetic field variations is distinctly multilevel and nonstationary. The most prominent zones of high cross-wavelet power are observed within the 10–30 day period range, corresponding to the characteristic timescales of solar-rotational disturbances. These regions indicate persistent simultaneous amplification of oscillations in both indices, driven by the influence of long-lived high-speed solar wind streams originating from coronal holes, which periodically interact with Earth’s magnetosphere as the Sun rotates.
During periods of enhanced solar activity (2013–2015 and 2023–2025), an increase in cross-wavelet power amplitude is evident, reflecting the globalized response of the magnetosphere, in which local and planetary-scale processes become phase-synchronized and mutually reinforced.
The combined results of the cross-wavelet (XWT) and wavelet coherence (WTC) analyses confirm the presence of a stable, scale-dependent comparison of local K (AAA) and aggregated global Kp geomagnetic activity indices. At the same time, a pronounced asymmetry across temporal scales is observed, reflecting the hierarchical organization of coupled processes within the Sun–magnetosphere–ionosphere system.
However, even under conditions of high coherence, certain intervals persist in which local variations exhibit autonomous behavior and temporal inhomogeneity of energy distribution. To achieve a deeper understanding of these discrepancies and to quantitatively assess the degree of nonequilibrium in the signals, it is necessary to analyze their internal structure using methods of nonlinear dynamics.

3.3. Multifractal and Entropy-Based Analysis

The following subsection presents the results of a multifractal analysis of the K (AAA) and Kp indices, which provides insights into the complexity of their time series and reveals differences in their scaling behavior and entropy-based characteristics.
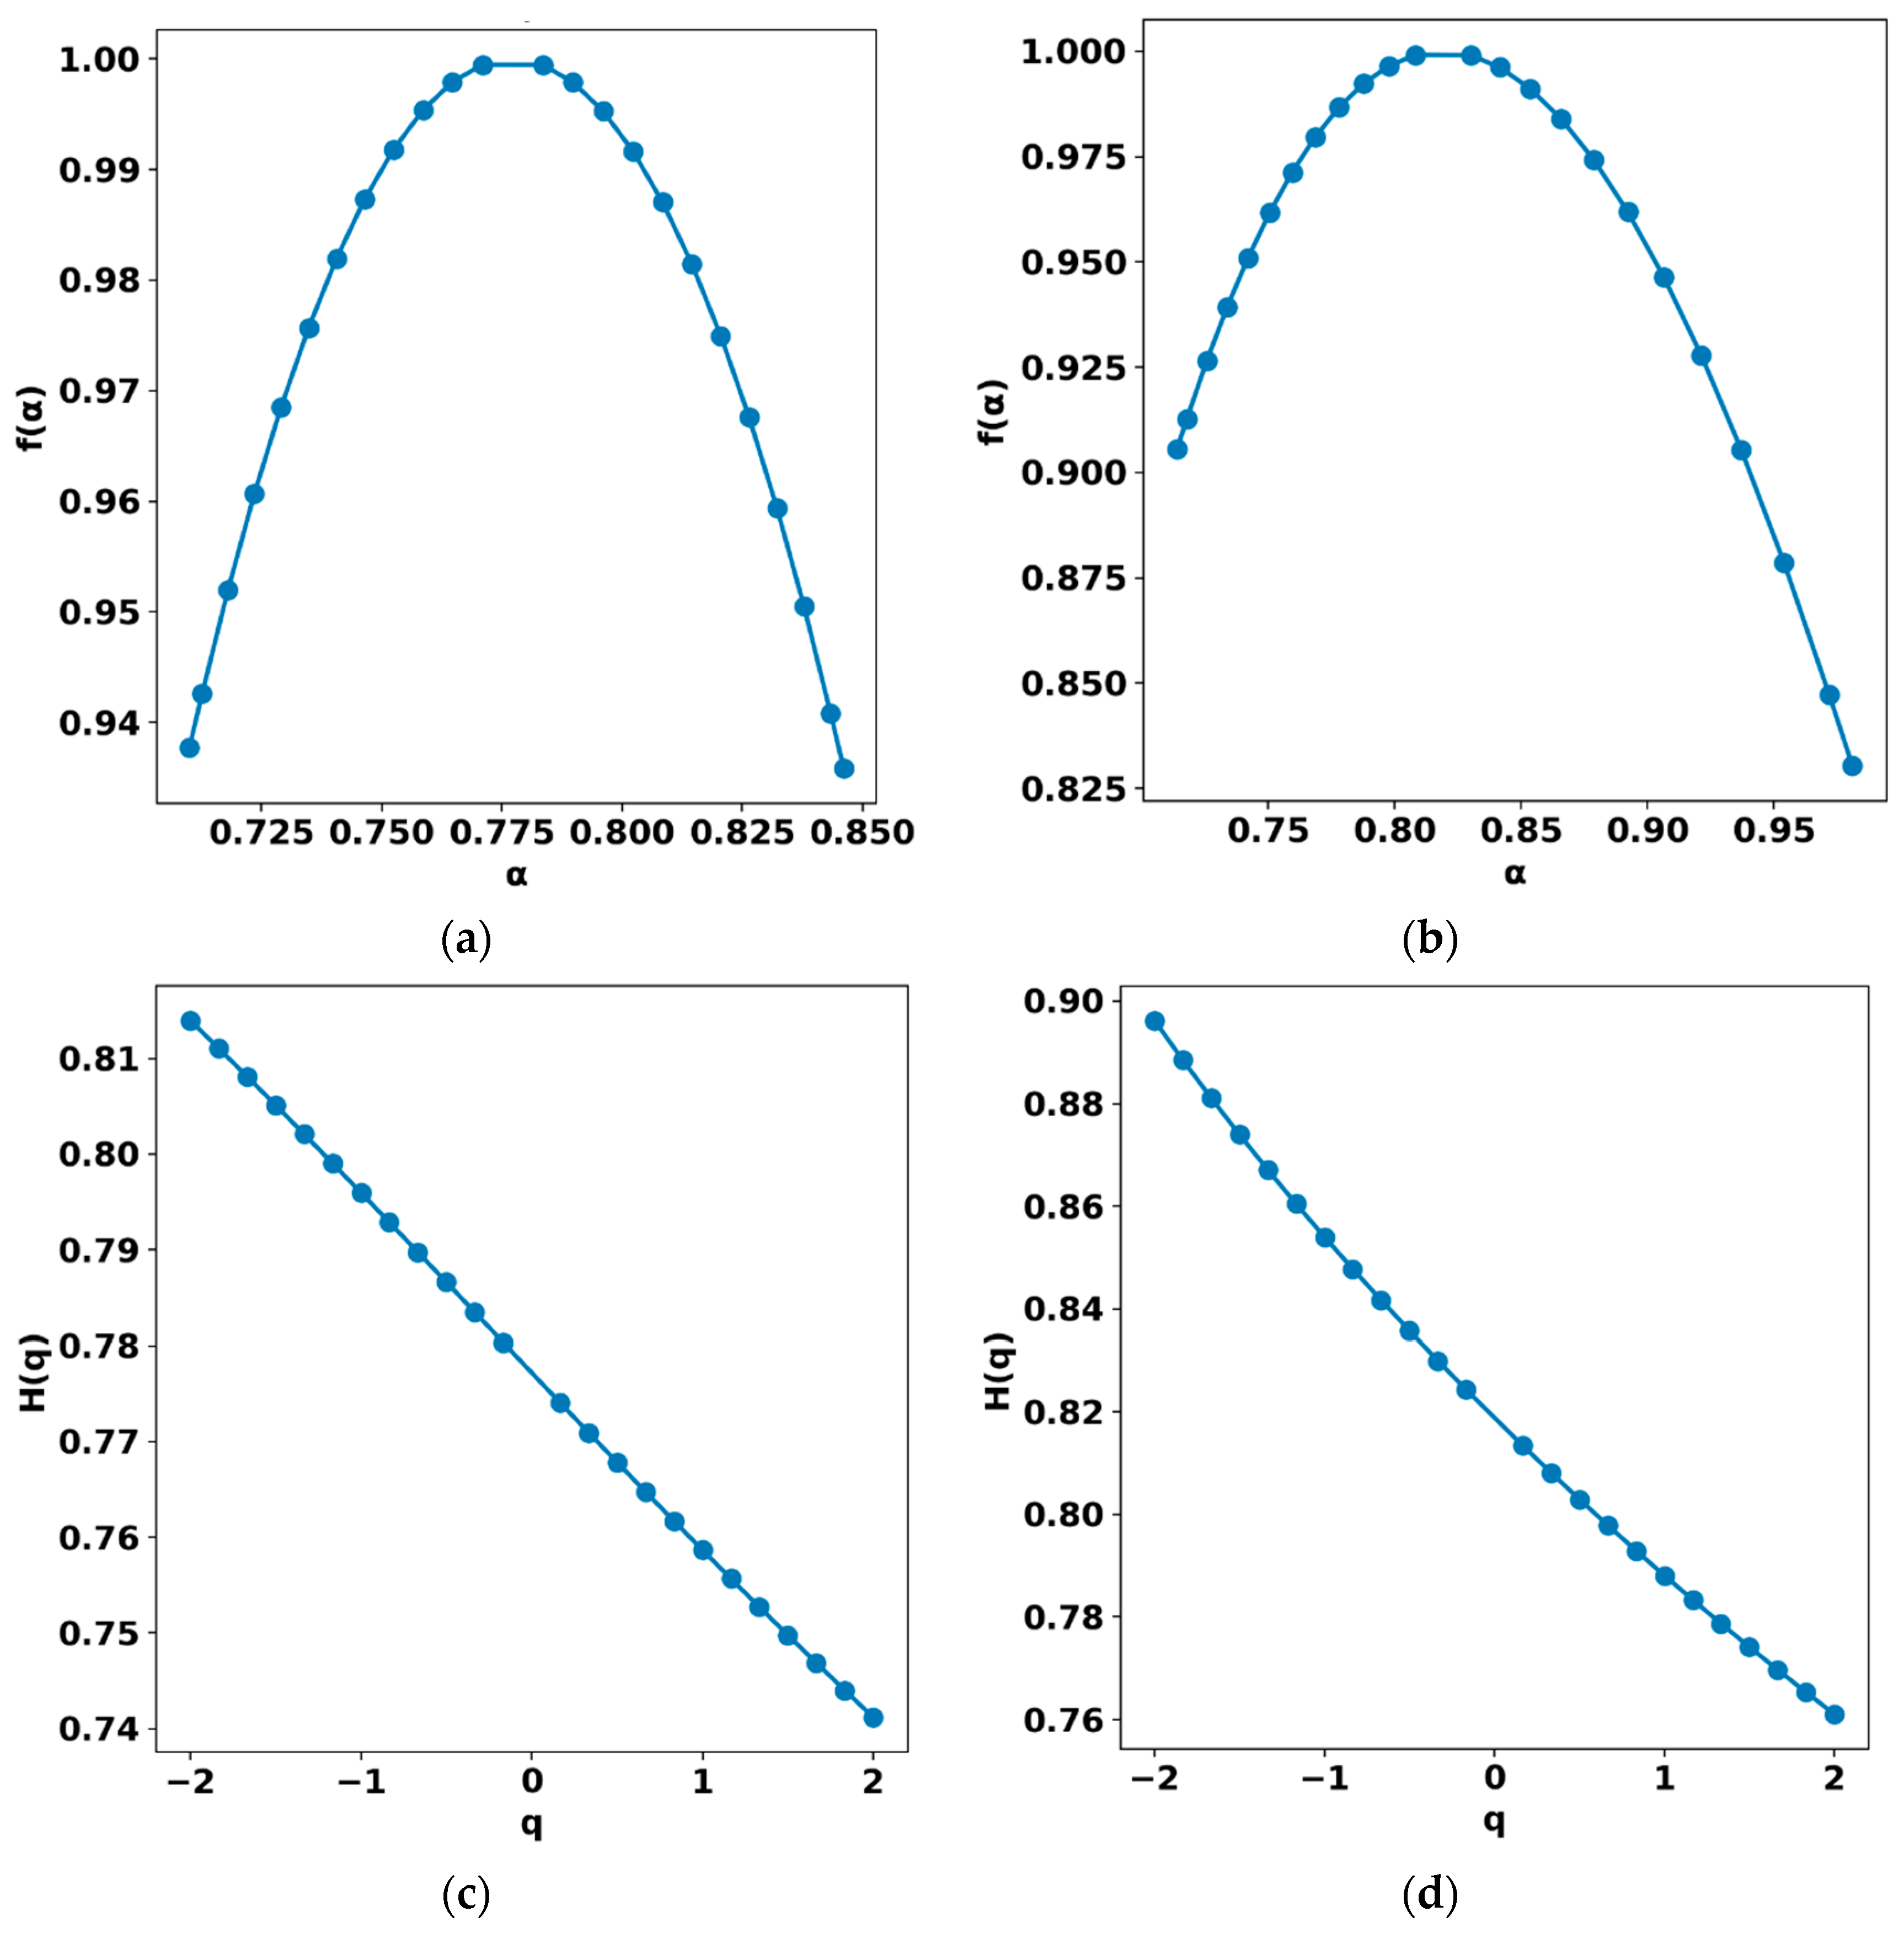
The multifractal analysis of the local geomagnetic activity index K (AAA) and the global index Kp revealed a complex structure of scale variability inherent to geomagnetic processes. The dependences h (q) for both series show a distinct decrease with increasing moment order q, confirming the presence of multifractality and the differences in temporal correlations between weak and strong fluctuations.
For the local K (AAA) index, the Hurst exponent range h (q) is approximately 0.74–0.81, whereas for Kp it spans 0.76–0.90, indicating a broader and more stable scale hierarchy in the global index, which reflects the integrated dynamics of magnetospheric processes.
Table 1 presents a summary of the estimated multifractal spectrum parameters, providing a comparative overview of the scaling characteristics and complexity measures for both indices.
Figure 11 presents the results of the multifractal analysis of the local geomagnetic index K (AAA) and the global Kp index, performed using the MFDFA method. The plots of the Hurst function h (q) (panels c, d) and the multifractal spectra f (α) (panels a, b) provide a quantitative description of the scale inhomogeneity of fluctuations and highlight the differences in the variability structure of local and global processes.
The h (q) functions for both indices show a clear dependence on the moment order q, confirming the presence of multifractality and the nonuniform distribution of fluctuation intensities. However, the slope of the h (q) dependence for the local K (AAA) index is steeper and more linear compared with that of Kp, indicating a narrower range of scaling exponents and thus a lower degree of variability in magnetic-field perturbation amplitudes. In contrast, the h (q) curve for Kp exhibits a concave shape, characteristic of enhanced nonlinearity and greater sensitivity to extreme disturbances, which are averaged out when forming the global index.
The corresponding f (α) spectra support these findings. For the local K (AAA) index, the spectrum peaks near α0≈ 1.0 and is nearly symmetric, typical of quasi-stationary processes with moderate intermittency. The Kp spectrum, however, is broader (Δα ≈ 0.20–0.25) and asymmetric toward larger α, indicating the presence of processes with stronger variability and a higher degree of nonequilibrium. This behavior is physically consistent with the nature of the Kp index, which aggregates contributions from observatories located across different latitudinal zones, each influenced by distinct magnetospheric and ionospheric current systems.
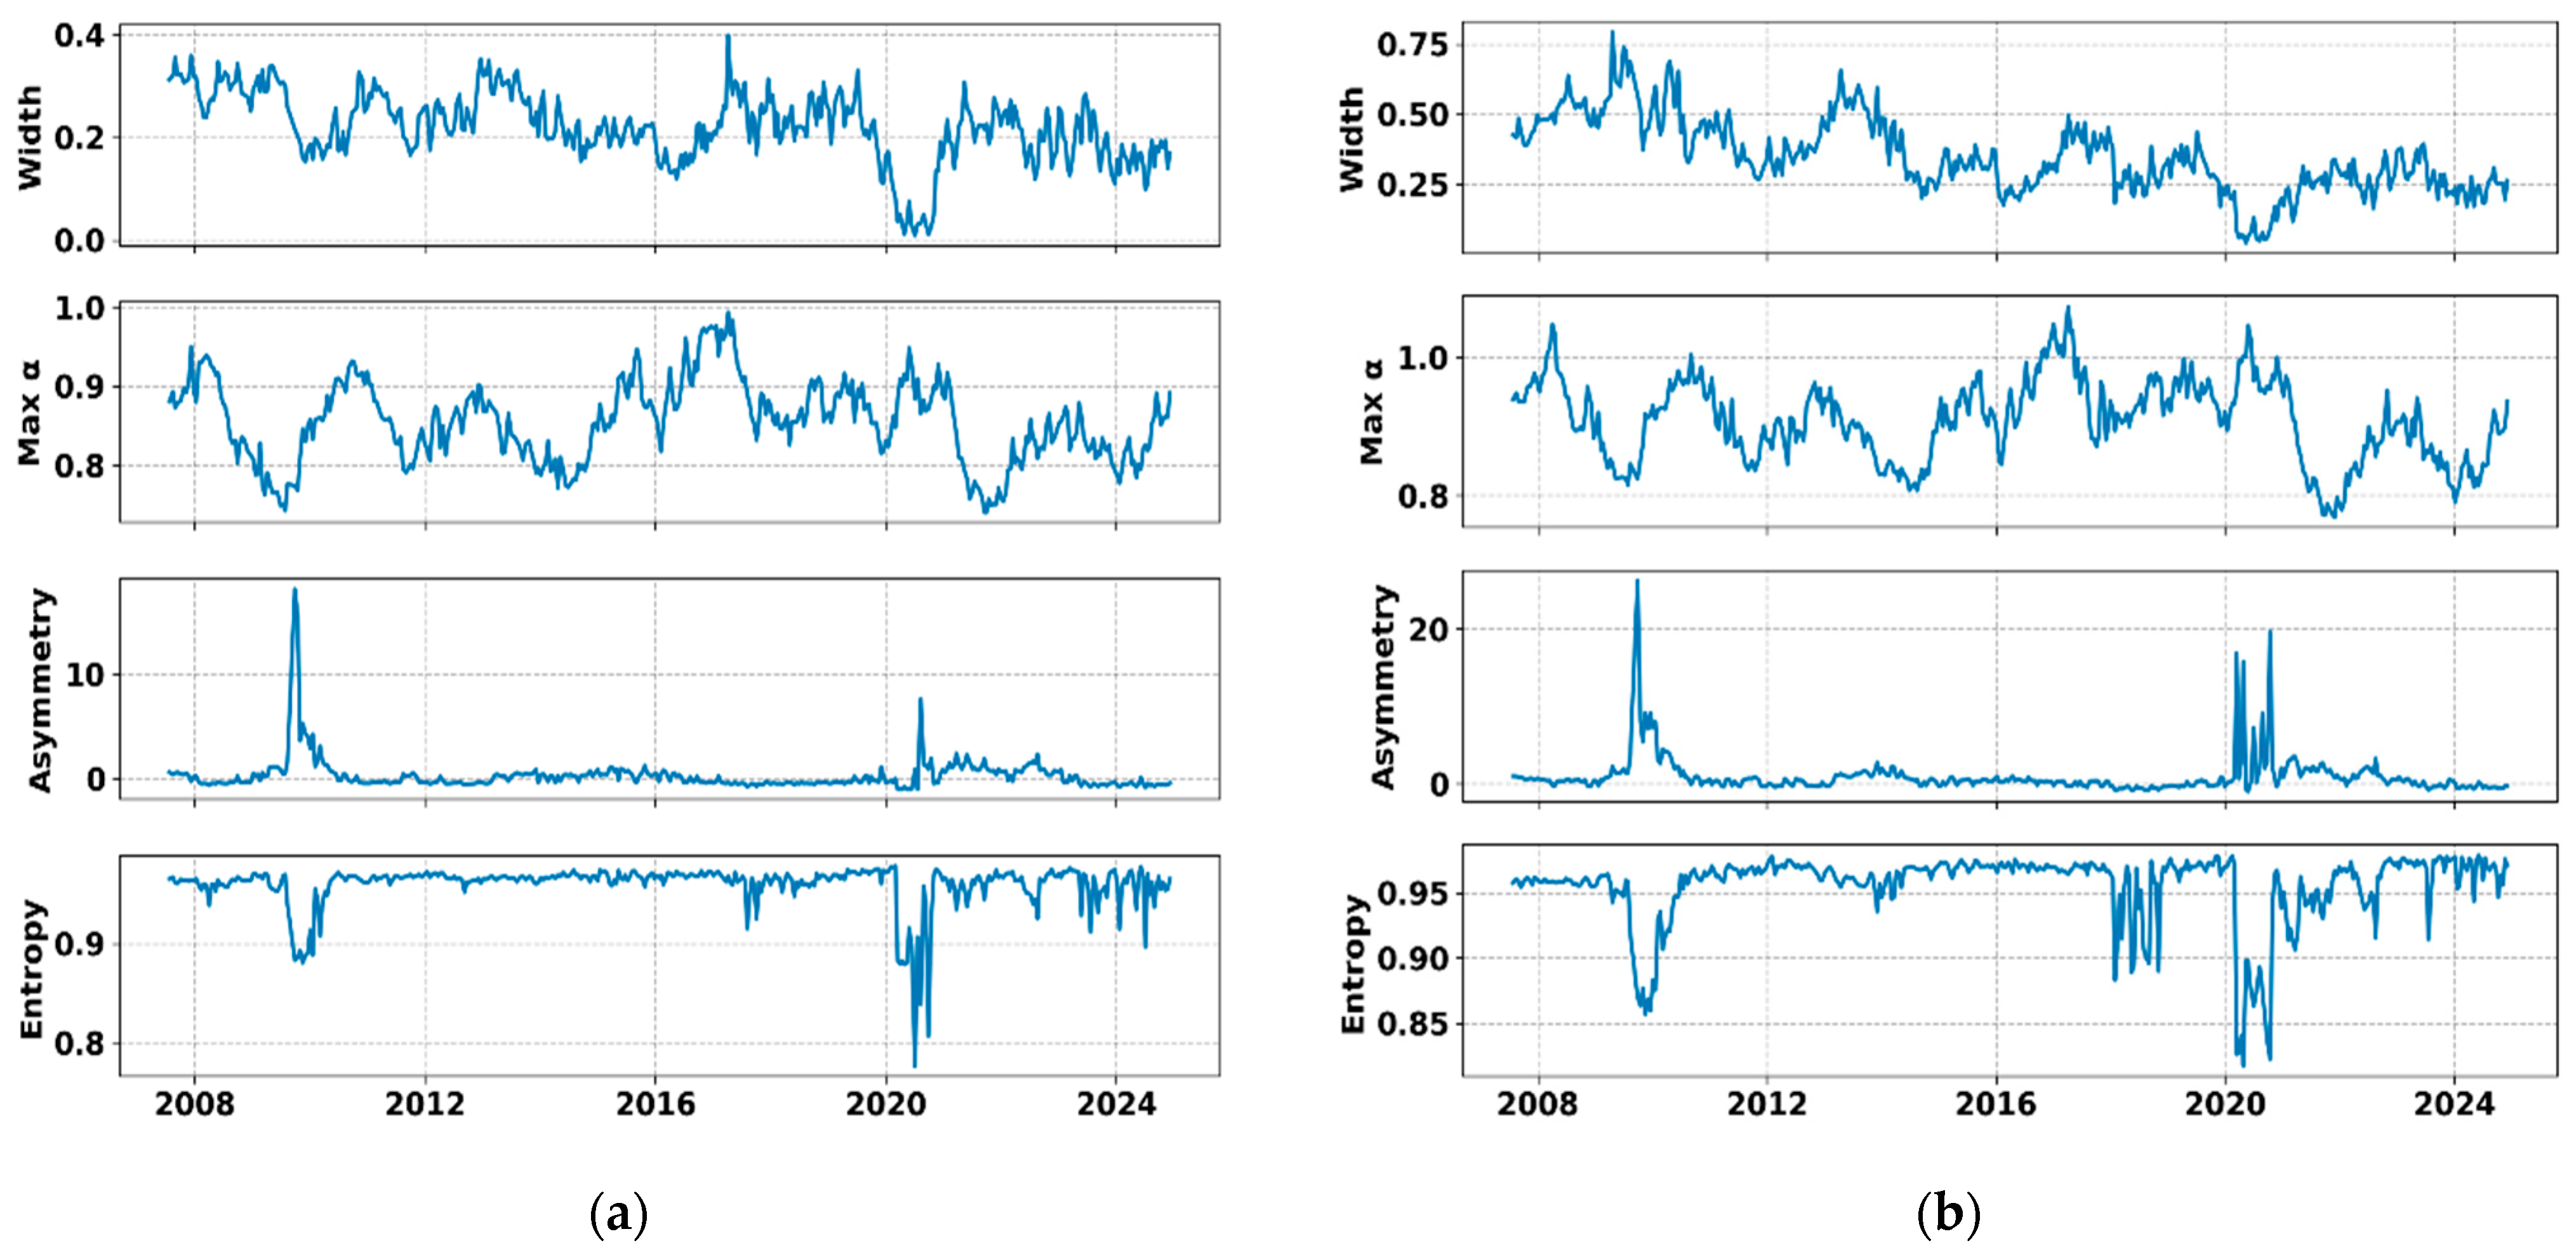
The analysis of the temporal evolution of multifractal characteristics made it possible to trace their dynamics over the 2007–2025 period. Figure 12 shows the time variations in the main parameters of the multifractal spectrum—including its width (Δα), peak position (α0), asymmetry, and entropy—calculated within a sliding window for both the local K (AAA) and global Kp indices. These parameters provide insight into the evolution of complexity and scale heterogeneity of geomagnetic activity over the past two solar cycles.
The time series analysis reveals that the spectrum width (Δα) exhibits quasi-periodic oscillations that correlate well with the phases of solar activity. For the local K (AAA) index, the range of Δα values does not exceed 0.4, indicating a relatively stable multifractal structure and a moderate degree of intermittency. In contrast, the global Kp index shows a broader spectrum width, reaching 0.7, which reflects a more pronounced multifractality associated with the integration of disturbances originating from different geomagnetic latitudes and current systems.
The parameter α0, which characterizes the dominant type of fluctuations, varies in phase with the solar cycle, decreasing during solar maxima (2013–2015 and 2023–2025). This behavior indicates that during solar-maximum years the time series become rougher, corresponding to intensified coupling between the solar wind and the magnetosphere [29]. The time series of the α0 parameter demonstrates a pronounced minimum around 2010, which coincides with the deep solar minimum between Solar Cycles 23 and 24. During this period, the geomagnetic field exhibited reduced variability and lower intermittency, leading to a narrower multifractal spectrum and a smaller α0 value. In contrast, toward the end of the analyzed interval (2024–2025), α0 increases, reflecting the rise in Solar Cycle 25 and the associated intensification of geomagnetic fluctuations and solar-wind coupling. This evolution indicates that the temporal dynamics of α0 are closely modulated by the solar activity cycle.
The asymmetry of the spectrum tends to increase during geomagnetically quiet periods (e.g., around 2009, 2020), when small-scale fluctuations dominate and the system exhibits a right-skewed multifractal structure. During strong geomagnetic activity (2015 and 2024), the spectrum becomes more symmetric, as both large- and small-scale components intensify simultaneously, reflecting a more balanced but highly dynamic nonequilibrium state. This behavior indicates that, when the system is weakly driven by external forcing (e.g., during solar minima), the multifractal spectrum becomes more right-skewed due to the dominance of small-scale, low-intensity fluctuations. In contrast, during periods of strong geomagnetic activity, large- and small-scale components intensify simultaneously, producing a more symmetric spectrum. Thus, asymmetry appears to be inversely related to the overall level of geomagnetic disturbance and reflects the redistribution of energy between scales.
The spectral entropy (Sf), which characterizes the degree of statistical organization within the multifractal structure, decreases during solar and geomagnetic minima (e.g., 2009, around 2018–2020), reflecting a more ordered and stationary magnetospheric state. From 2020 to 2024, Sf gradually increases in parallel with the rise in Solar Cycle 25, indicating enhanced multiscale interaction and growing dynamical complexity. This trend suggests that Sf primarily traces the long-term restructuring of magnetospheric dynamics modulated by solar activity, rather than individual storm events. The local index K (AAA) demonstrates stronger short-term fluctuations in Sf, reflecting regional ionospheric processes, while the global Kp index shows a smoother, cycle-dependent evolution consistent with large-scale magnetospheric coupling
A comparison of the two indices reveals that the local K (AAA) index primarily responds to regional fluctuations of ionospheric current systems, whereas the global Kp index captures system-wide magnetospheric reorganizations characterized by a stronger scale hierarchy. Nevertheless, the high correlation between the temporal evolution of α0 and entropy in both indices indicates a common physical origin of the processes governing the fractal structure of geomagnetic activity.
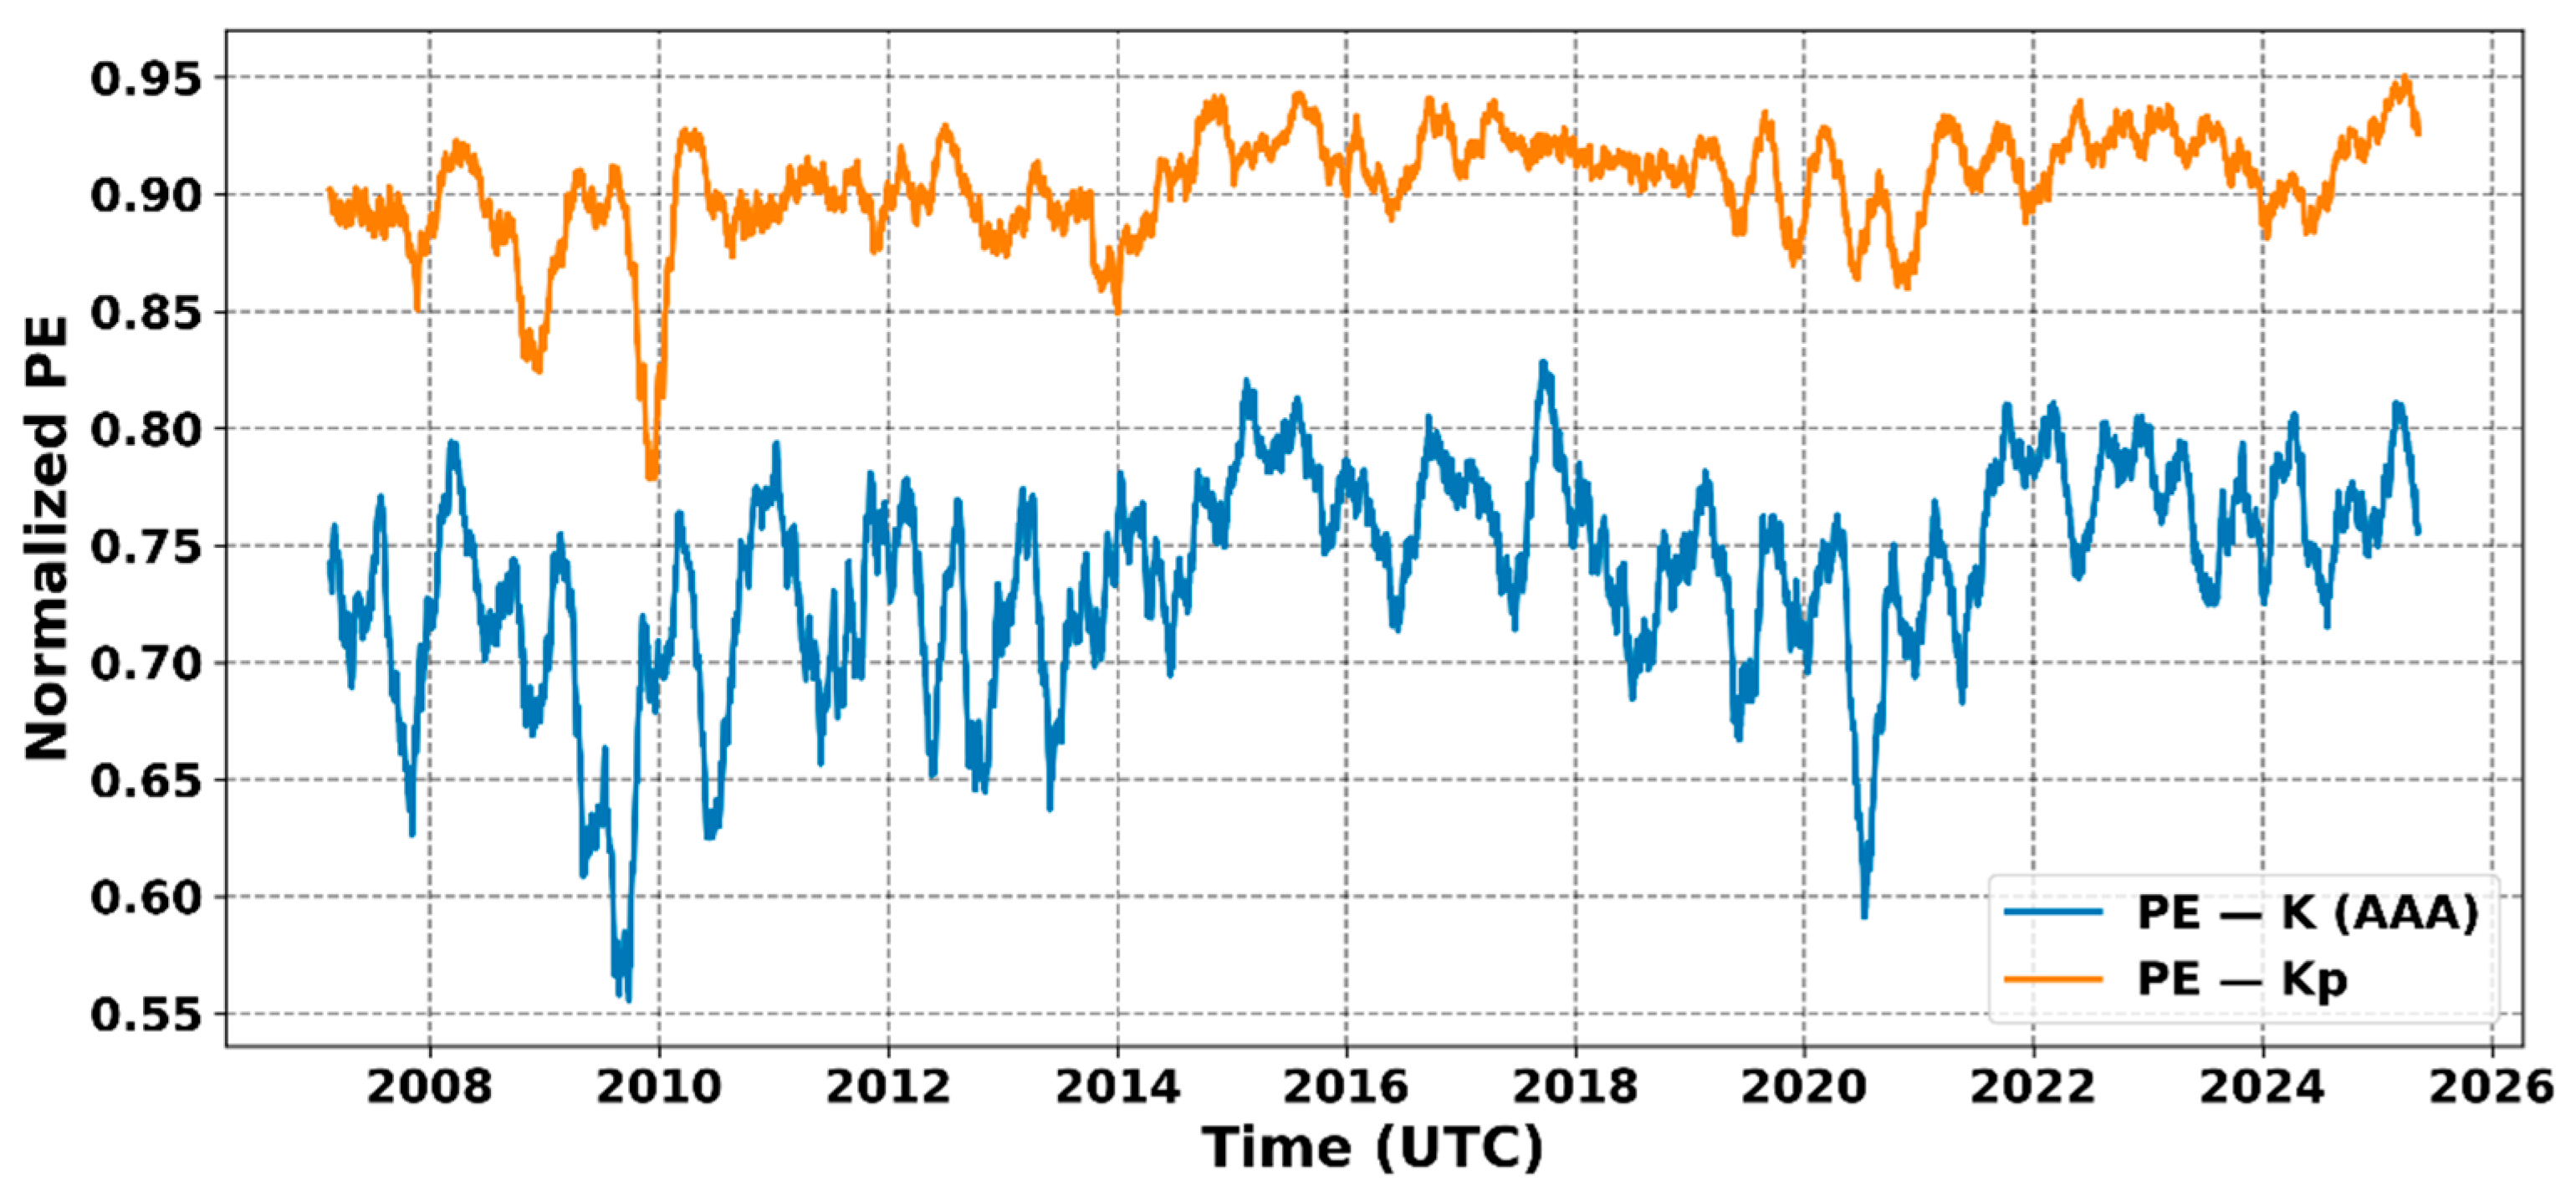
To assess the degree of chaoticity and stochasticity of geomagnetic variations, a permutation entropy (PE) analysis was performed for the local K (AAA) and global Kp indices using a sliding window of 90 days (Figure 13). The results reveal a distinct cyclic pattern of PE variations that correlates with the 11-year solar cycle: during periods of low solar activity, entropy values are lower, indicating greater regularity and predictability of geomagnetic fluctuations. In contrast, during solar maxima (2013–2015, and 2023–2025), entropy increases, reflecting the enhanced chaotic behavior of the magnetospheric response [30].
Throughout the entire observation period, the global Kp index exhibits systematically higher PE values, which points to its greater statistical heterogeneity and the spatially integrated nature of global magnetospheric dynamics. The local K (AAA) index, on the other hand, shows more pronounced PE oscillations, indicating the high sensitivity of the single observatory to local geomagnetic effects—including ionospheric currents, conductivity variations, and regional electrojet dynamics.
Notably, sharp decreases in PE (K) occur during geomagnetically quiet periods such as 2009 and 2020, corresponding to the minima between Solar Cycles 23–24 and 24–25. These declines indicate a transition of the system into a more ordered and quasi-deterministic state, where reduced solar forcing leads to lower variability and stronger internal coherence of the geomagnetic field.
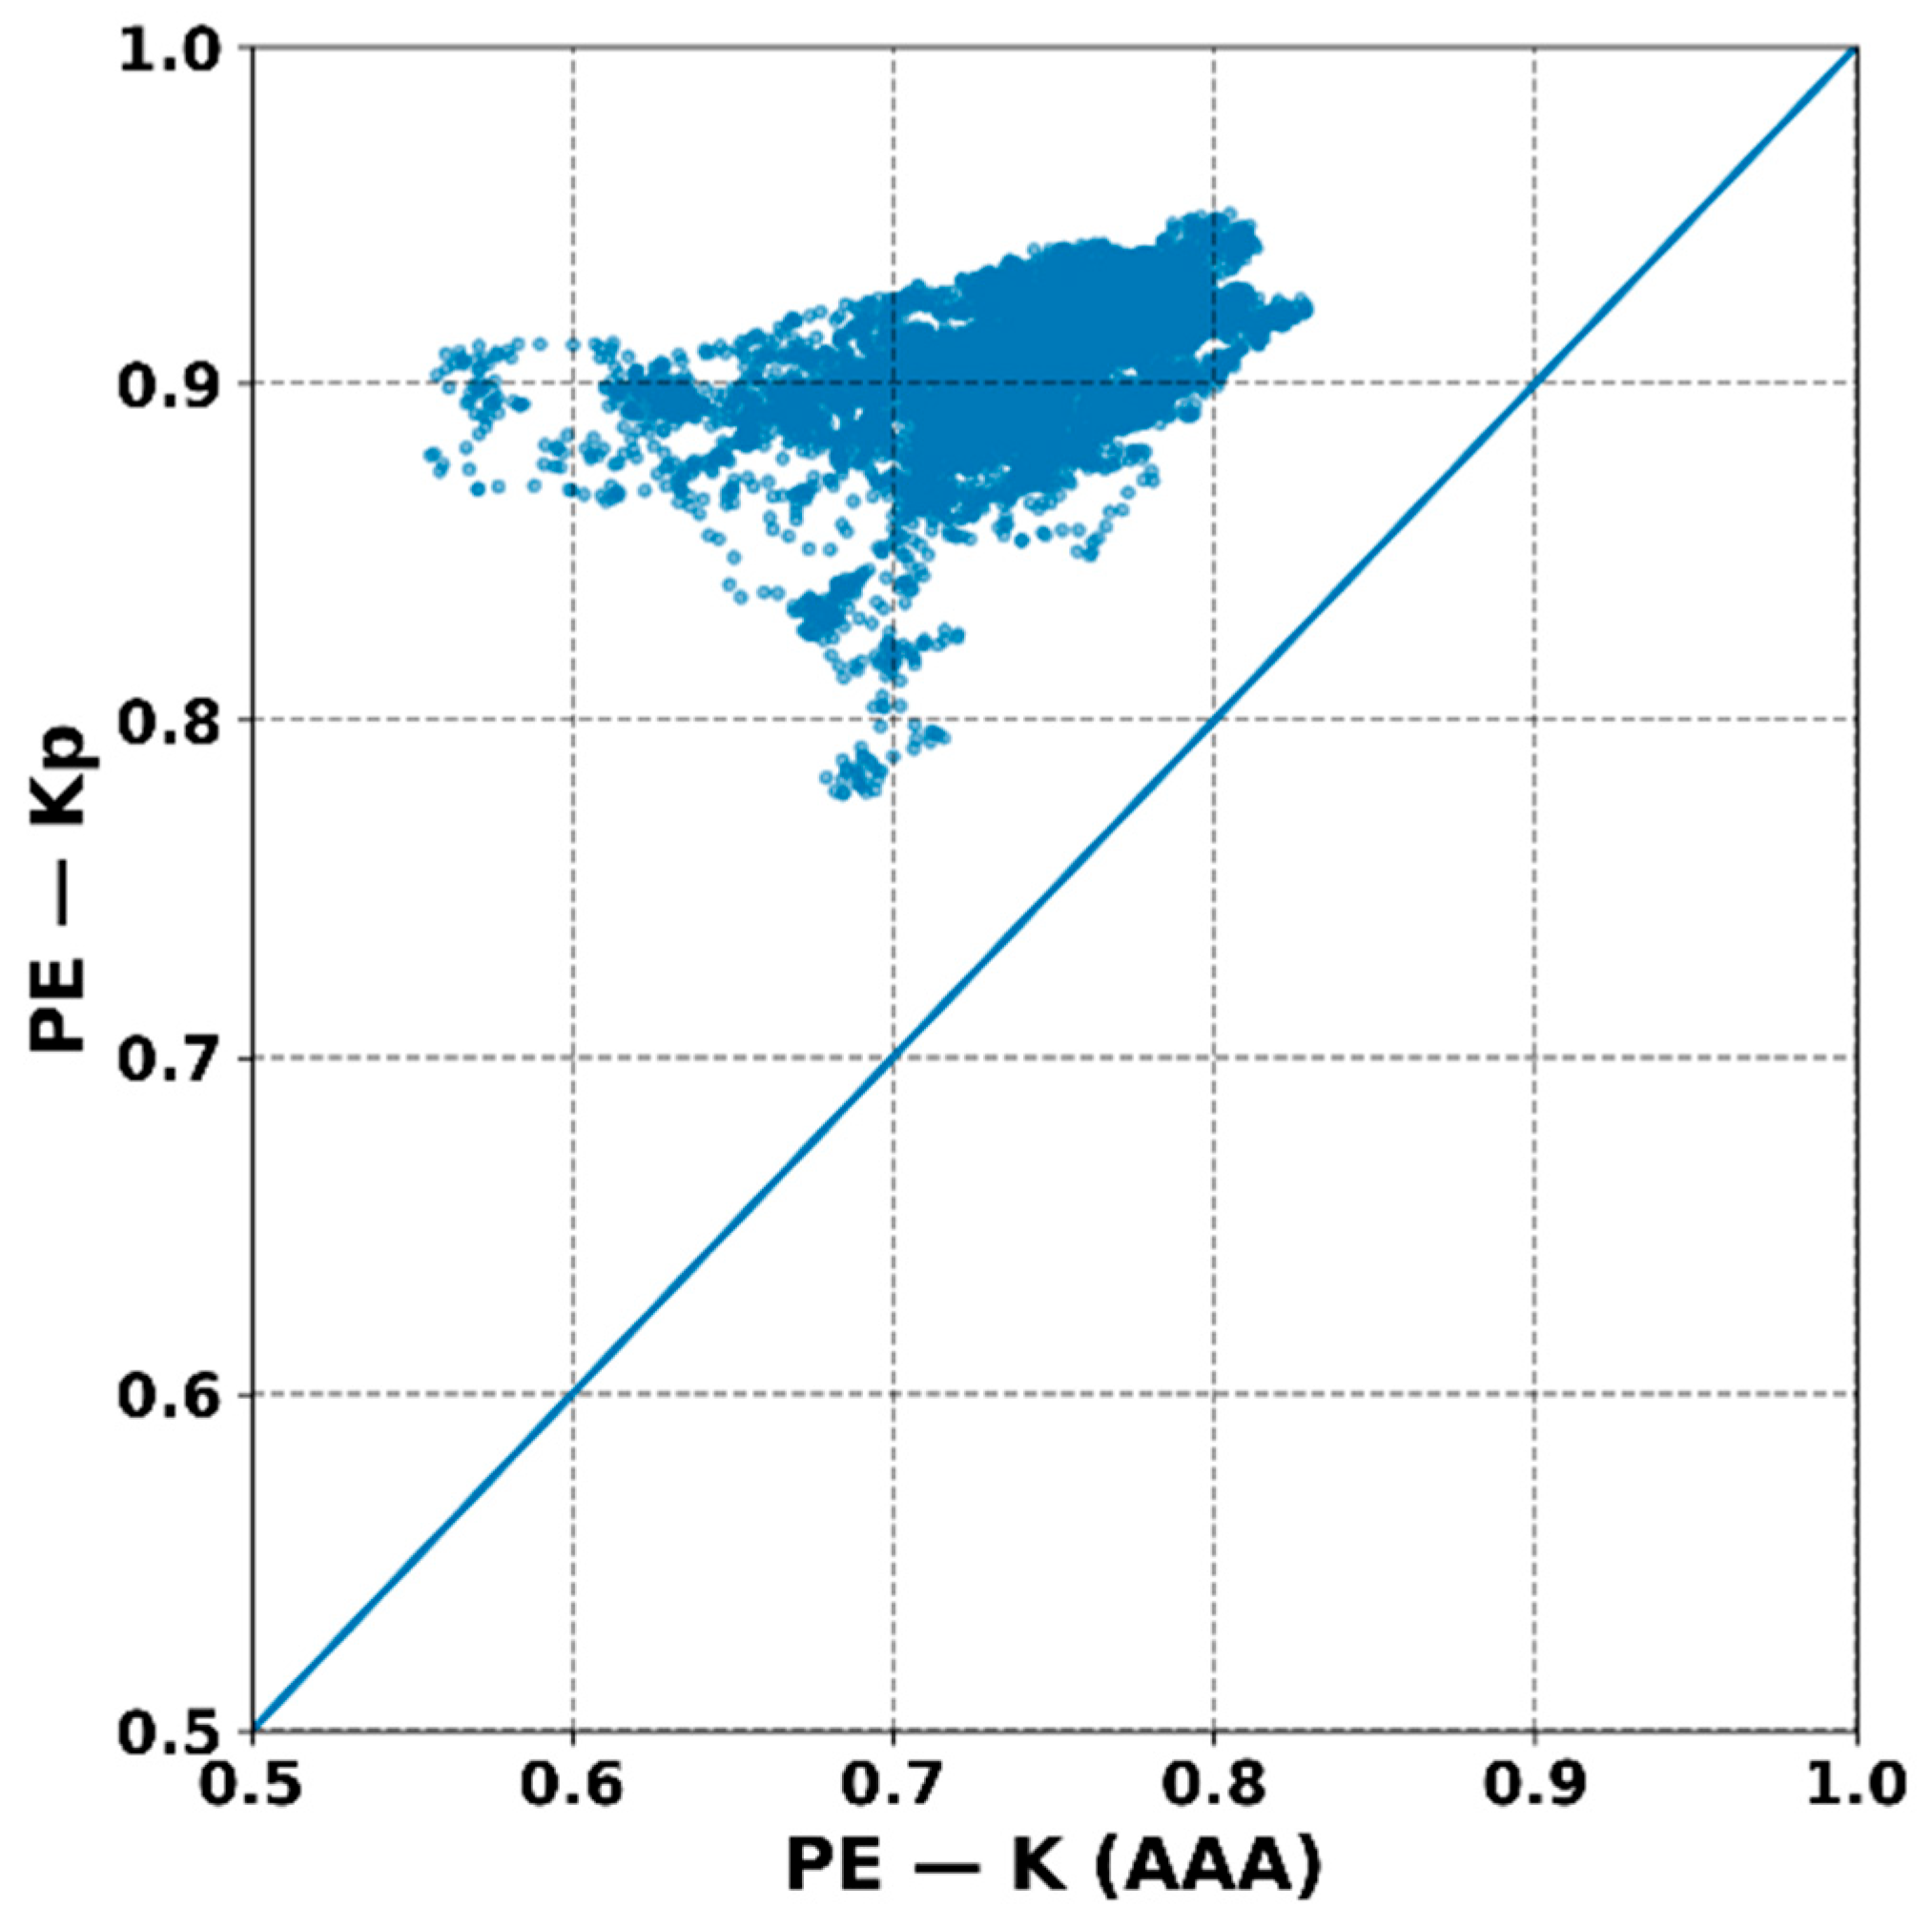
The scatter plot of PE (K) versus PE (Kp) (Figure 14) demonstrates a generally consistent correspondence between the local and global entropy values; however, the data points are distributed asymmetrically relative to the 1:1 line, clustering predominantly above it. This indicates that the global index generally exhibits a higher degree of chaoticity compared with the local one. Such behavior aligns with the understanding that the integrated Kp indicator averages over numerous regional processes, including out-of-phase responses from different geomagnetic latitudes.
The obtained results complement the findings of the multifractal analysis, confirming that geomagnetic activity possesses pronounced structural variability, evident both in its temporal organization and in the stochastic properties of the signals.
A comparative analysis shows that both the local and global indices contain a common set of fundamental periodicities associated with solar-rotational modulations. At the same time, the local K (AAA) index demonstrates greater sensitivity to high-frequency and regional processes, whereas the Kp index represents an averaged global picture of geomagnetic activity, integrating the combined response of multiple magnetospheric regions.
Thus, the combined use of both indices makes it possible not only to identify the global patterns of magnetospheric dynamics, but also to trace the regional features that may play an important role in the study of ionospheric disturbances and their impact on technological systems.
4. Discussion

The results of this study demonstrate that geomagnetic activity observed in the Almaty region represents a complex superposition of global and local processes interacting across a wide range of temporal and spatial scales. The findings confirm the hierarchical structure of geomagnetic and ionospheric dynamics, reflecting interactions within multiple layers of the Sun-Earth system—from disturbances in the IMF to responses in the lower atmosphere. The nonlinear effects identified in both the local and global indices point to the existence of inter-sphere coupling mechanisms between the magnetosphere, ionosphere, and lower atmosphere, through which electromagnetic and plasma perturbations can influence atmospheric-electric and tropospheric processes.
In this context, the study by [31] is particularly illustrative. Based on observations in the Northern Tien Shan, the authors demonstrated the influence of various geophysical disturbance sources on the atmospheric electric field and thunderstorm activity. They showed that the enhancement of the atmospheric electric field and the increase in thunderstorm frequency correlate with magnetospheric–ionospheric variations, indicating vertical energy and charge transfer between atmospheric layers. These results expand the understanding that geomagnetic and ionospheric variations, as reflected in ground-based indices, can serve as indicators not only of space weather conditions but also of meteorological processes shaped by its influence.
The strong linear correlation between K (AAA) and Kp confirms that the main dynamics of the geomagnetic field at midlatitudes are governed by global disturbances associated with the solar wind and IMF. However, the persistent positive bias of the local index relative to Kp, along with the observed diurnal and seasonal asymmetry, highlights the role of regional factors that modulate the magnetospheric and ionospheric response depending on local geophysical conditions.
The most pronounced differences between the local geomagnetic index K (AAA) and the global index Kp are observed in the dayside sector, where the enhancement of Sq current systems and the increase in ionospheric conductivity occur under the influence of solar radiation. This effect is well documented in midlatitude observatory data and described by [8,32], who demonstrated that daytime variations in conductivity and Sq currents depend strongly on solar illumination, local time, and geomagnetic latitude.
The daytime maximum of K (AAA) reflects not only the impact of global current systems, but also the contribution of local electrojets that are distributed unevenly in longitude and latitude [33]. These regional current structures can enhance magnetic field perturbations near the observatory, leading to a systematic excess of local index values over the global ones. This effect highlights the higher sensitivity of local indices to the fine structure of ionospheric current systems and the geo-electrical characteristics of the region.
The seasonal modulation of K (AAA) is in phase with the well-known Russell-McPherron effect, which arises from the geometric dependence of magnetic reconnection efficiency at the magnetopause on the orientation of the interplanetary magnetic field (IMF) [25,34]. The enhancement of geomagnetic activity near the equinoxes reflects an increased energy transfer into the magnetosphere under favorable IMF orientation, a feature evident in both global and regional indices [35]. However, for the local K (AAA) index, this effect is amplified by regional variations in ionospheric conductivity, resulting in more pronounced diurnal and seasonal changes in the amplitude of geomagnetic activity.
Spectral analysis revealed that the structure of K (AAA) and Kp variations is governed by several dominant scales: the 27-day cycle associated with solar-rotational modulation, and the 3–9-day range, related to processes within the magnetosphere and ionosphere. The more pronounced short-period oscillations in the local index arise from its sensitivity to substorm activity and localized disturbances in ring and polar current systems. These findings indicate that the spatial averaging inherent to the computation of Kp suppresses many regional variations, whereas the local index captures them in full detail.
Wavelet analysis methods revealed a complex, hierarchically organized temporal-scale structure of geomagnetic activity. Unlike classical correlation analysis, the wavelet approach allows the exploration of scale-dependent synchronization between signals and identifies the time intervals and periods where local disturbances are most coherent with global magnetospheric dynamics. This provides a means to trace the evolution of their time-dependent coherence, distinguishing intervals dominated by solar-induced periodicities (e.g., rotational cycles) from those where local processes display more autonomous behavior.
The local K (AAA) index is dominated by short-period and subrotational components, while the global Kp index exhibits stronger seasonal and cyclic oscillations. The combined analysis reveals a correlated yet nonuniform correspondence between local and global geomagnetic variations, reflecting the multifractal organization of the Earth’s magnetic field dynamics.
The wavelet coherence (WTC) analysis further supports these conclusions: coherence values exceed 0.8 in the 10–30 day range, and the interaction phase is predominantly in-phase, indicating synchronous behavior of both components. The regions of high mutual coherence within the solar-rotational period range (~27 days) confirm that both indices are controlled by common solar-geophysical sources, primarily high-speed solar wind streams (HSS) and the interaction between the solar magnetic field and Earth’s magnetosphere [36,37].
At shorter timescales (<10 days), the wavelet coherence between the local K (AAA) and global Kp indices decreases noticeably, and their oscillations exhibit increasing phase divergence, indicating reduced synchronization of short-term geomagnetic fluctuations. This effect is interpreted as a manifestation of local ionospheric processes, including electrojet activity, conductivity variations, and the spatially heterogeneous development of current systems in longitude and latitude [31]. Such regional effects can modulate the amplitude and phase of geomagnetic variations, introducing additional nonlinearities into local indices. The observed phase shift of the local K (AAA) index relative to the global Kp by 3–6 h in the dayside sector reflect the temporal instability of the magnetosphere–ionosphere response. Similar phase shifts were previously observed in comparisons between the AE, Dst, and Kp indices and interpreted as differences in the energy transfer delay between regional and global systems [38]. This confirms that local ionospheric processes respond more rapidly to solar wind disturbances than do globally integrated measures.
The ROC analysis provided a quantitative evaluation of the diagnostic capability of the local K (AAA) index relative to the global Kp in detecting extreme geomagnetic events. A storm threshold of Kp ≥ 6 was adopted, following the international geomagnetic storm classification [13]. For the local index, the true positive rate (TPR) and false positive rate (FPR) were computed to construct the ROC curve and determine the area under the curve (AUC). The resulting AUC ≈ 0.92 indicates high sensitivity and specificity, demonstrating that K (AAA) reliably detects global disturbances captured by Kp while also identifying local events not fully represented in global indices. Similar conclusions were reached by [14], where ROC analysis was applied to assess the performance of K-index forecasting models.
Notably, during the main phase of geomagnetic storms, the local index K (AAA) exhibits a shift of several hours relative to Kp. This conclusion is drawn from the cross-wavelet phase arrows in Figure 10b, which show right-tilted vectors indicating a 3–6 h phase shift of K (AAA) relative to Kp during the main phase of several storms. This finding is consistent with [39,40], who reported that regional ionospheric responses occur earlier due to differences in local conductivity and current system configuration. Such behavior underscores the importance of K (AAA) for real-time (nowcasting) and regional space weather diagnostics, particularly in regions with pronounced ionospheric effects.
The multifractal analysis further confirmed that geomagnetic activity possesses a strongly nonlinear, multiscale structure that cannot be reduced to simple linear correlations or stationary processes. The broad singularity spectra f (α) and elevated entropy values indicate the intermittent nature of geomagnetic variability, arising from the alternation of quiet and disturbed magnetospheric states [41,42].
For the local K (AAA) index, the multifractal spectra f (α) are broader and more asymmetric compared to those of the global Kp index, indicating its higher sensitivity to short-lived but intense events that enhance the multifractal properties of the time series. A similar pattern has been observed for the AE and SYM-H indices during geomagnetic storms, when the cascade of energy exchange between different temporal and spatial scales becomes more pronounced [43].
An increase in the spectrum width f (α) and entropy during storm periods is consistent with the concept of multi-level energy coupling between macroscopic solar-wind flows and small-scale ionospheric current structures [44]. This behavior indicates that the intensification of geomagnetic activity is accompanied by a rise in multifractality, signaling the system’s approach to a critical state. The comparison of local and global indices also shows that multifractal properties persist across spatial scales, reflecting the universal hierarchical organization of geomagnetic processes. However, differences in spectrum width and shape emphasize the importance of regional factors, such as ionospheric conductivity, station location, and local current systems, which must be considered when developing spatio-temporal magnetospheric models and nonlinear geomagnetic disturbance indicators.
A comparison between the diurnal and seasonal variations shown in Figure 2 and the results of multifractal analysis reveals that periods of enhanced regional activity (evening hours and equinox seasons) correlate with broader f (α) spectra and increased asymmetry, indicating a strengthening of nonlinear processes and a higher contribution of rare, extreme fluctuations to the overall magnetospheric dynamics. The evening maxima of K (AAA) correspond to periods of enhanced ionospheric currents and strong magnetosphere–ionosphere coupling, during which multifractal metrics record a rise in scale variability—a signature of transition to a more turbulent regime. Thus, the spatio-temporal patterns detected on heat maps are directly reflected in changes in multifractal characteristics, confirming the tight link between the temporal structure and scale organization of geomagnetic activity. This is consistent with the concept of the self-organized nature of magnetospheric processes, where local variations collectively shape the global energy-exchange dynamics between the Sun, magnetosphere, and ionosphere.
The PE analysis demonstrated that global variations exhibit greater stochasticity and lower regularity than local ones, while local indices show entropy reduction during storms, reflecting more deterministic behavior of the system. The long-term evolution of PE follows the solar activity cycle, confirming the presence of nonlinear transitions between distinct magnetospheric states.
Of particular interest is the potential of multifractal characteristics as diagnostic and forecasting parameters of geomagnetic activity. As storm conditions approach, the statistical shape of f (α) systematically changes-its broadening, peak shift, and asymmetry increase, reflecting a transition from quasi-stationary to nonlinear, energetically unstable regimes. To quantify their predictive capability, binary classification methods, such as ROC analysis, can be applied to evaluate the sensitivity and specificity of multifractal indicators relative to storm thresholds (Kp ≥ 6). Preliminary results show that integral metrics—the spectrum width (Δα) and entropy (Sf)-achieve AUC values above 0.8, indicating a high discriminative power between quiet and disturbed magnetospheric states.
Thus, the multifractal characteristics of K (AAA) and Kp indices can serve not only as descriptors of nonlinear geomagnetic variability, but also as physically grounded precursors of geomagnetic storms. Their integration into ensemble forecasting models, together with solar-wind and IMF parameters, may significantly enhance the efficiency of early-warning systems for space-weather disturbances.
The demonstrated differences between the local K (AAA) and global Kp indices highlight the importance of regional monitoring for accurate nowcasting and short-term forecasting of geomagnetic disturbances.
The high correlation (r ≈ 0.84) and systematic positive bias of K (AAA) indicate that local measurements can serve as an early indicator of magnetospheric perturbations, particularly during the main phase of storms.

5. Conclusions

The conducted study demonstrated that regional geomagnetic activity, recorded at the Almaty Geomagnetic Observatory (AAA), possesses a distinct structural and dynamic specificity that cannot be reduced to the averaged global characteristics represented by the Kp index. Despite a strong overall correlation between the two series, the local K (AAA) index exhibits a systematic positive bias and more pronounced diurnal and equinoctial variations, associated with enhanced Sq currents and increased ionospheric conductivity. These features reflect the contribution of regional electrodynamic mechanisms that influence both the amplitude and phase of magnetic disturbances.
A comprehensive combination of spectral, wavelet, multifractal, and entropy-based techniques provided a multi-level analytical framework encompassing both the time–frequency and structural-stochastic organization of geomagnetic variability. The Welch spectral analysis identified dominant periods associated with solar-rotational and diurnal cycles. The CWT and its cross variants (XWT and WTC) revealed the temporal evolution of these processes, delineated zones of coherence between the local and global indices, and identified phase shifts indicative of temporal offsets of ionospheric responses relative to global magnetospheric perturbations.
The MFDFA quantified scale-dependent complexity and intermittency, reflecting transitions between quasi-stationary and turbulent magnetospheric-ionospheric regimes, while the PE provided a localized measure of chaoticity sensitive to short-term changes in signal determinism. Together, these approaches enabled a quantitative characterization of the temporal, spectral, and nonlinear structure of geomagnetic activity, revealing correlations between its stochastic, fractal, and coherent components.
The combined results demonstrate that the local index captures not only global disturbances but also regional processes arising from current redistribution in the magnetosphere and ionosphere. Spectrally, K (AAA) exhibits enhanced components in the 3–9 day range, indicating sensitivity to substorm dynamics, while wavelet analysis shows that Kp represents a smoother, global solar-rotational modulation, and K (AAA) responds to short-duration enhancements of geomagnetic activity associated with localized substorm intensifications. The high wavelet coherence (25–30 days) and phase discrepancies at shorter scales confirm the coexistence of global and regional drivers, highlighting the value of K (AAA) for resolving spatial structure and refining magnetospheric models.
ROC analysis revealed a high predictive capability (AUC ≈ 0.92) of the local index in storm detection, underscoring its potential for real-time monitoring and early warning systems. During periods of enhanced solar activity, K (AAA) exhibited a leading response relative to Kp, reinforcing its utility for nowcasting applications.
In summary, the local K (AAA) index complements rather than duplicates the global Kp index, providing higher spatial resolution and revealing regional variations within the generally coherent global dynamics (r ≈ 0.84). Its integration into international monitoring networks could improve the spatial resolution of space weather models and deepen understanding of energy transfer mechanisms between the solar wind, magnetosphere, and ionosphere. Integrating such local indices into regional forecasting systems could improve the spatial resolution of ionospheric models and enable better prediction of geomagnetically induced currents (GICs), satellite communication disruptions, and GNSS performance degradation across Central Asia.
This approach complements global indices by providing real-time sensitivity to regional electrodynamic processes. The findings emphasize the necessity of regional observations in constructing global indices and point toward hybrid frameworks that combine linear and nonlinear diagnostics for a comprehensive analysis of geomagnetic variability.

Author Contributions

Conceptualization, V.K., A.A. and V.S.; methodology, V.K. and A.A.; software, V.K., A.A. and Y.C.; validation, A.A., V.K. and B.Z.; formal analysis, V.S., B.Z. and S.M.; investigation, Y.C. and S.U.; resources, V.K. and A.A.; data curation, V.K., Y.C. and S.U.; writing—original draft preparation, V.K.; writing—review and editing, V.S. and S.M.; visualization, V.K. and A.A.; supervision, V.S.; project administration, V.S.; funding acquisition, V.K. All authors have read and agreed to the published version of the manuscript.

Funding

This research was funded by the Science Committee of the Ministry of Science and Higher Education of the Republic of Kazakhstan, grant project AP19174928 “Study of ionospheric inhomogeneities by methods of nonlinear analysis”.

Institutional Review Board Statement

Not applicable.

Informed Consent Statement

Not applicable.

Data Availability Statement

The datasets used in this study are derived from public domain resources. Local geomagnetic K-index data from the Almaty (AAA) observatory were obtained from the Institute of Ionosphere, Almaty, Kazakhstan, and can be provided from the geomagnetic observatory portal https://ionos.kz/geomagnetic-observatory/ (accessed on 17 September 2025). Global Kp index data were retrieved from the GFZ German Research Centre for Geosciences (Potsdam, Germany) through the open database https://www.gfz-potsdam.de/en/kp-index/ (accessed on 17 September 2025). All analysis scripts, including the custom Python modules for MFDFA and permutation entropy, are available from the authors upon request for academic use.

Conflicts of Interest

The authors declare no conflicts of interest.

Abbreviations

The following abbreviations are used in this manuscript:
AAAAlmaty Geomagnetic Observatory (Almaty, Kazakhstan)
CWTContinuous Wavelet Transform
WTCWavelet Transform Coherence
XWTCross Wavelet Transform
IMFInterplanetary Magnetic Field
MFDFAMultifractal Detrended Fluctuation Analysis
PEPermutation Entropy
PSDPower Spectral Density
SqSolar Quiet Current System
ROCReceiver Operating Characteristic (Curve)
AUCArea Under the ROC Curve
UTCCoordinated Universal Time
AEAuroral Electrojet Index

References

  1. Borovsky, J.E.; Denton, M.H. Differences between CME-Driven Storms and CIR-Driven Storms. J. Geophys. Res. 2006, 111, A07S08. [Google Scholar] [CrossRef]
  2. Kamide, Y.; Chian, A. (Eds.) Handbook of the Solar-Terrestrial Environment; Springer: Berlin/Heidelberg, Germany, 2007. [Google Scholar] [CrossRef]
  3. Soloviev, A.A. Some Challenges of Geomagnetism Addressed with the Use of Ground and Satellite Observations. Russ. Geol. Geophys. 2023, 64, 1108–1131. [Google Scholar] [CrossRef]
  4. Alimaganbetov, M. Ultra-Low Frequency Waves at Middle Latitudes During Substorms: Observations and Modeling. Ph.D. Thesis, Embry-Riddle Aeronautical University, Daytona Beach, FL, USA, 2021. Available online: https://commons.erau.edu/edt/642 (accessed on 26 September 2025).
  5. Menvielle, M.; Berthelier, A. The K-Derived Planetary Indices: Description and Availability. Rev. Geophysics 1991, 30, 91. [Google Scholar] [CrossRef]
  6. Trichtchenko, L.; Boteler, D.H. Modeling GIC Using Geomagnetic Indices and Data. IEEE Trans. Plasma Sci. 2004, 32, 1459–1467. [Google Scholar] [CrossRef]
  7. Pulkkinen, T. Space Weather: Terrestrial Perspective. Living Rev. Sol. Phys. 2007, 4, 1. [Google Scholar] [CrossRef]
  8. Cnossen, I.; Richmond, A.D. Changes in the Earth’s Magnetic Field over the Past Century: Effects on the Ionosphere-Thermosphere System and Solar Quiet (Sq) Magnetic Variation. J. Geophys. Res. 2013, 118, 849–858. [Google Scholar] [CrossRef]
  9. Jordanova, V.K.; Zaharia, S.; Welling, D.T. Comparative Study of Ring Current Development Using Empirical, Dipolar, and Self-Consistent Magnetic Field Simulations. J. Geophys. Res. 2010, 115, A00J11. [Google Scholar] [CrossRef]
  10. Kamide, Y.; Kusano, K. No Major Solar Flares but the Largest Geomagnetic Storm in the Present Solar Cycle. Space Weather 2015, 13, 365–367. [Google Scholar] [CrossRef]
  11. Andreyev, A.; Somsikov, V.; Kapytin, V.; Chsherbulova, Y. Solar Terminator Related Variations in Geomagnetic Field. J. Atmos. Sol.-Terr. Phys. 2025, 271, 106517. [Google Scholar] [CrossRef]
  12. Stankov, S.; Stegen, K.; Warnant, R. Local Operational Geomagnetic Index K Calculation (K-LOGIC) From Digital Ground-Based Magnetic Measurements; Technical Report No. RMI-STR-2010-01, Version 1.1; Solar-Terrestrial Centre of Excellence, Royal Meteorological Institute: Brussels, Belgium, 2010; p. 32. [Google Scholar]
  13. Liemohn, M.W.; McCollough, J.P.; Jordanova, V.K.; Ngwira, C.M.; Morley, S.K.; Cid, C.; Tobiska, W.K.; Wintoft, P.; Ganushkina, N.Y.; Welling, D.T.; et al. Model Evaluation Guidelines for Geomagnetic Index Predictions. Space Weather 2018, 16, 2079–2102. [Google Scholar] [CrossRef]
  14. Glocer, A.; Rastätter, L.; Kuznetsova, M.; Pulkkinen, A.; Singer, H.J.; Balch, C.; Weimer, D.; Welling, D.; Wiltberger, M.; Raeder, J.; et al. Community-Wide Validation of Geospace Model Local K-Index Predictions to Support Model Transition to Operations. Space Weather 2016, 14, 469–480. [Google Scholar] [CrossRef]
  15. Welch, P.D. The Use of Fast Fourier Transform for the Estimation of Power Spectra: A Method Based on Time Averaging over Short, Modified Periodograms. IEEE Trans. Audio Electroacoust. 1967, 15, 70–73. [Google Scholar] [CrossRef]
  16. Heybatli, I.; Arikan, O.; Arikan, F. Spectral Analysis of Interplanetary and Geomagnetic Indices Using Fourier Transform for High Solar Activity Years. Signal Image Video Process. 2025, 19, 128. [Google Scholar] [CrossRef]
  17. Torrence, C.; Compo, G.P. A Practical Guide to Wavelet Analysis. Bull. Am. Meteorol. Soc. 1998, 79, 61–78. [Google Scholar] [CrossRef]
  18. Issac, M.; Renuka, G.; Venugopal, C. Wavelet Analysis of Long Period Oscillations in Geomagnetic Field over the Magnetic Equator. J. Atmos. Sol. Terr. Phys. 2004, 66, 919–925. [Google Scholar] [CrossRef]
  19. Grinsted, A.; Moore, J.C.; Jevrejeva, S. Application of the Cross Wavelet Transform and Wavelet Coherence to Geophysical Time Series. Nonlinear Process. Geophys. 2004, 11, 561–566. [Google Scholar] [CrossRef]
  20. Mursula, K.; Zieger, B.; Vilppola, J.H. Mid-Term Quasi-Periodicities in Geomagnetic Activity during the Last 15 Solar Cycles: Connection to Solar Dynamo Strength. Sol. Phys. 2003, 212, 201–207. [Google Scholar] [CrossRef]
  21. Kantelhardt, J.W.; Zschiegner, S.A.; Koscielny-Bunde, E.; Havlin, S.; Bunde, A.; Stanley, H.E. Multifractal Detrended Fluctuation Analysis of Nonstationary Time Series. Phys. A Stat. Mech. Appl. 2002, 316, 87–114. [Google Scholar] [CrossRef]
  22. Ihlen, E.A. Introduction to Multifractal Detrended Fluctuation Analysis in Matlab. Front. Physiology 2012, 3, 141. [Google Scholar] [CrossRef] [PubMed]
  23. Bandt, C.; Pompe, B. Permutation Entropy: A Natural Complexity Measure for Time Series. Phys. Rev. Lett. 2002, 88, 174102. [Google Scholar] [CrossRef]
  24. Riedl, M.; Müller, A.; Wessel, N. Practical Considerations of Permutation Entropy: A Tutorial Review. Eur. Phys. J. Spec. Top. 2013, 222, 249–262. [Google Scholar] [CrossRef]
  25. McPherron, R.L.; Russell, C.T.; Aubry, M.P. Satellite Studies of Magnetospheric Substorms on August 15, 1968: 9. Phenomenological Model for Substorms. J. Geophys. Res. 1973, 78, 3131–3149. [Google Scholar] [CrossRef]
  26. Zhu, S.; Luan, X.; Lei, J. Seasonal and Interhemispheric Variations of the Afternoon Auroral Responses to the Interplanetary Magnetic Field by Polarity. J. Geophys. Res. Space Phys. 2024, 129, e2024JA032417. [Google Scholar] [CrossRef]
  27. Gil, A.; Modzelewska, R.; Wawrzaszek, A.; Piekart, B.; Milosz, T. Solar Rotation Multiples in Space-Weather Effects. Sol. Phys. 2021, 296, 128. [Google Scholar] [CrossRef]
  28. Mukhtarov, P.; Andonov, B.; Borries, C.; Pancheva, D.; Jakowski, N. Forcing of the ionosphere from above and below during the Arctic winter of 2005/2006. J. Atmos. Sol. Terr. Phys. 2010, 72, 193–205. [Google Scholar] [CrossRef]
  29. Yu, Z.-G.; Anh, V.; Eastes, R. Multifractal analysis of geomagnetic storm and solar flare indices and their class dependence. J. Geophys. Res. Space Phys. 2009, 114, A05214. [Google Scholar] [CrossRef]
  30. De Michelis, P.; Consolini, G.; Tozzi, R. On the multi-scale nature of large geomagnetic storms: An empirical mode decomposition analysis. Nonlinear Process. Geophys. 2012, 19, 667–673. [Google Scholar] [CrossRef]
  31. Antonova, V.; Lutsenko, V.; Gordiyenko, G.; Kryukov, S. Impact of Various Disturbance Sources on the Atmospheric Electric Field and Thunderstorm Activity of the Northern Tien-Shan. Atmosphere 2023, 14, 164. [Google Scholar] [CrossRef]
  32. Yamazaki, Y.; Maute, A. Sq and EEJ—A Review on the Daily Variation of the Geomagnetic Field Caused by Ionospheric Dynamo Currents. Space Sci. Rev. 2017, 206, 299–405. [Google Scholar] [CrossRef]
  33. Richmond, A.D. Ionospheric Electrodynamics Using Magnetic Apex Coordinates. J. Geomagn. Geoelectr. 1995, 47, 191–212. [Google Scholar] [CrossRef]
  34. Lockwood, M.; Owens, M.J.; Barnard, L.A.; Watt, C.E.; Scott, C.J.; Coxon, J.C.; McWilliams, K.A. Semi-Annual, Annual and Universal Time Variations in the Magnetosphere and in Geomagnetic Activity: 3. Modelling. J. Space Weather. Space Clim. 2020, 10, 61. [Google Scholar] [CrossRef]
  35. Cliver, E.W.; Kamide, Y.; Ling, A.G. Mountains versus Valleys: Semiannual Variation of Geomagnetic Activity. J. Geophys. Res. Space Phys. 2000, 105, 2413–2424. [Google Scholar] [CrossRef]
  36. Temmer, M.; Vršnak, B.; Veronig, A.M. Periodic Appearance of Coronal Holes and the Related Variation of Solar Wind Parameters. Sol. Phys. 2007, 241, 371–383. [Google Scholar] [CrossRef]
  37. Mursula, K.; Zieger, B. The 13.5-Day Periodicity in the Sun, Solar Wind, and Geomagnetic Activity: The Last Three Solar Cycles. J. Geophys. Res. Space Phys. 1996, 101, 27077–27090. [Google Scholar] [CrossRef]
  38. Vassiliadis, D.V.; Sharma, A.S.; Eastman, T.E.; Papadopoulos, K. Low-Dimensional Chaos in Magnetospheric Activity from AE Time Series. Geophys. Res. Lett. 1990, 17, 1841–1844. [Google Scholar] [CrossRef]
  39. Katus, R.M.; Liemohn, M.W. Similarities and Differences in Low-to-Middle-Latitude Geomagnetic Indices. J. Geophys. Res. Space Phys. 2013, 118, 5149–5156. [Google Scholar] [CrossRef]
  40. Paouris, E.; Abunina, M.; Belov, A.; Mavromichalaki, H. Statistical Analysis on the Current Capability to Predict the Ap Geomagnetic Index. New Astron. 2021, 86, 101570. [Google Scholar] [CrossRef]
  41. Consolini, G.; De Michelis, P. Rank Ordering Multifractal Analysis of the Auroral Electrojet Index. Nonlinear Process. Geophys. 2011, 18, 277–285. [Google Scholar] [CrossRef]
  42. Wanliss, J. Fractal Properties of SYM-H during Quiet and Active Times. J. Geophys. Res. Space Phys. 2005, 110, A03202. [Google Scholar] [CrossRef]
  43. Balasis, G.; Daglis, I.A.; Kapiris, P.; Mandea, M.; Vassiliadis, D.; Eftaxias, K. From Pre-Storm Activity to Magnetic Storms: A Transition Described in Terms of Fractal Dynamics. Ann. Geophys. 2006, 24, 3557–3567. [Google Scholar] [CrossRef]
  44. Chang, T. Self-Organized Criticality, Multi-Fractal Spectra, and Intermittent Merging of Coherent Structures in the Magnetotail. In Plasma Astrophysics and Space Physics; Büchner, J., Axford, I., Marsch, E., Vasyliūnas, V., Eds.; Springer: Dordrecht, The Netherlands, 1999; pp. 515–531. [Google Scholar] [CrossRef]
Figure 1. Comparison of time series of the local geomagnetic activity index—K (AAA), (red line) and the global Kp index (black line) for the period 2007–2025. The values are shown at three-hour resolution across all months of the year (X-axis) and years of observation (Y-axis, UTC format).
Atmosphere 16 01319 g001
Figure 2. Comparison of heat maps of the median values of the local geomagnetic activity index K (AAA) and the global Kp index in the coordinates “day of year—hour (UTC)”. The upper panel illustrates regional diurnal variations in geomagnetic activity, while the lower panel shows global patterns averaged over latitude and longitude.
Atmosphere 16 01319 g002
Figure 3. Linear dependence of the local and global geomagnetic indices, and correlation structure: (a) scatter plot of the local K (AAA) index and the global Kp index for three-hour intervals with a linear regression line (red line), the black dashed line reflects the linear regression line with a correlation coefficient of 1; (b) two-dimensional map of the correlation coefficient between K (AAA) and Kp in the coordinates “month × hour UTC”. The X-axis represents month-of-year as a continuous variable (1–12 + fraction) used for smoothing. Local time at the Almaty (AAA) station corresponds to UTC + 6 h.
Atmosphere 16 01319 g003
Figure 4. Distribution of differences ΔK = K (AAA) − Kp for 3 h values (at interval centers). The red dotted line corresponds to the mean value of ΔK (+0.20), the blue dotted line to the median (+0.33).
Atmosphere 16 01319 g004
Figure 5. Comparative analysis of the differences between the local K (AAA) index and the global Kp: (a) Heat map of the mean bias ΔK = K (AAA) − Kp in month × hour UTC coordinates; (b) Frequency of cases where the local K (AAA) index exceeds the global Kp in month × hour UTC coordinates.
Atmosphere 16 01319 g005
Figure 6. Error matrix for comparing extreme events by the local K (AAA) index and the global Kp index at a threshold value of Kp ≥ 6.
Atmosphere 16 01319 g006
Figure 7. ROC curve for the local K (AAA) index as a magnetic storm classifier (reference: Kp ≥ 6). The area under the curve (AUC = 0.99) indicates a near-perfect match between local and global data. The dashed diagonal line corresponds to random classification.
Atmosphere 16 01319 g007
Figure 8. Comparison of the power spectra of the K (AAA) and Kp indices calculated by the Welch method.
Atmosphere 16 01319 g008
Figure 9. Wavelet scalograms: (a) local index K (AAA) and (b) global index Kp.
Atmosphere 16 01319 g009
Figure 10. Results of cross- wavelet analysis: (a) cross- wavelet power (XWT); (b) wavelet coherence (WTC) between the local geomagnetic activity index K (AAA) and the global Kp index for the period 2007–2025. The color scale shows the relative power (XWT) and the degree of coherence (WTC), and the arrows indicate the phase correspondence between the signals: to the right–in-phase behavior, to the left–antiphase, upward or downward slope–advance or lag of one of the components.
Atmosphere 16 01319 g010
Figure 11. Multifractal characteristics of local K (AAA) and global Kp indices of geomagnetic activity: (a) Multifractal spectrum f (α) for the local index K; (b) Multifractal spectrum f (α) for the global index Kp; (c) Dependence of the Hurst function h (q) for the local index K (AAA); (d) Dependence of the Hurst function h(q) for the global index Kp.
Atmosphere 16 01319 g011
Figure 12. Evolution of multifractal characteristics of geomagnetic activity indices in a moving window (MFDFA): (a) local K (AAA,) and (b) global Kp. The time changes in the main parameters of the multifractal spectrum are shown: width Δα; position of the spectrum maximum αmax; spectrum asymmetry, spectrum entropy Sf.
Atmosphere 16 01319 g012
Figure 13. Temporal changes in the normalized permutation entropy (PE) in a sliding window for local (K (AAA)) and global (Kp) geomagnetic activity indices.
Atmosphere 16 01319 g013
Figure 14. Scatter plot PE (K)-PE (Kp), characterizing the consistency of local and global dynamics.
Atmosphere 16 01319 g014
Table 1. Summary table of evaluation of parameters of multifractal spectra.
IndexSpectral WidthαmaxSpectrum AsymmetrySf
K0.1410.7700.3600.973
Kp0.2820.8080.9840.967
Disclaimer/Publisher’s Note: The statements, opinions and data contained in all publications are solely those of the individual author(s) and contributor(s) and not of MDPI and/or the editor(s). MDPI and/or the editor(s) disclaim responsibility for any injury to people or property resulting from any ideas, methods, instructions or products referred to in the content.