3.1. Statistical Analysis
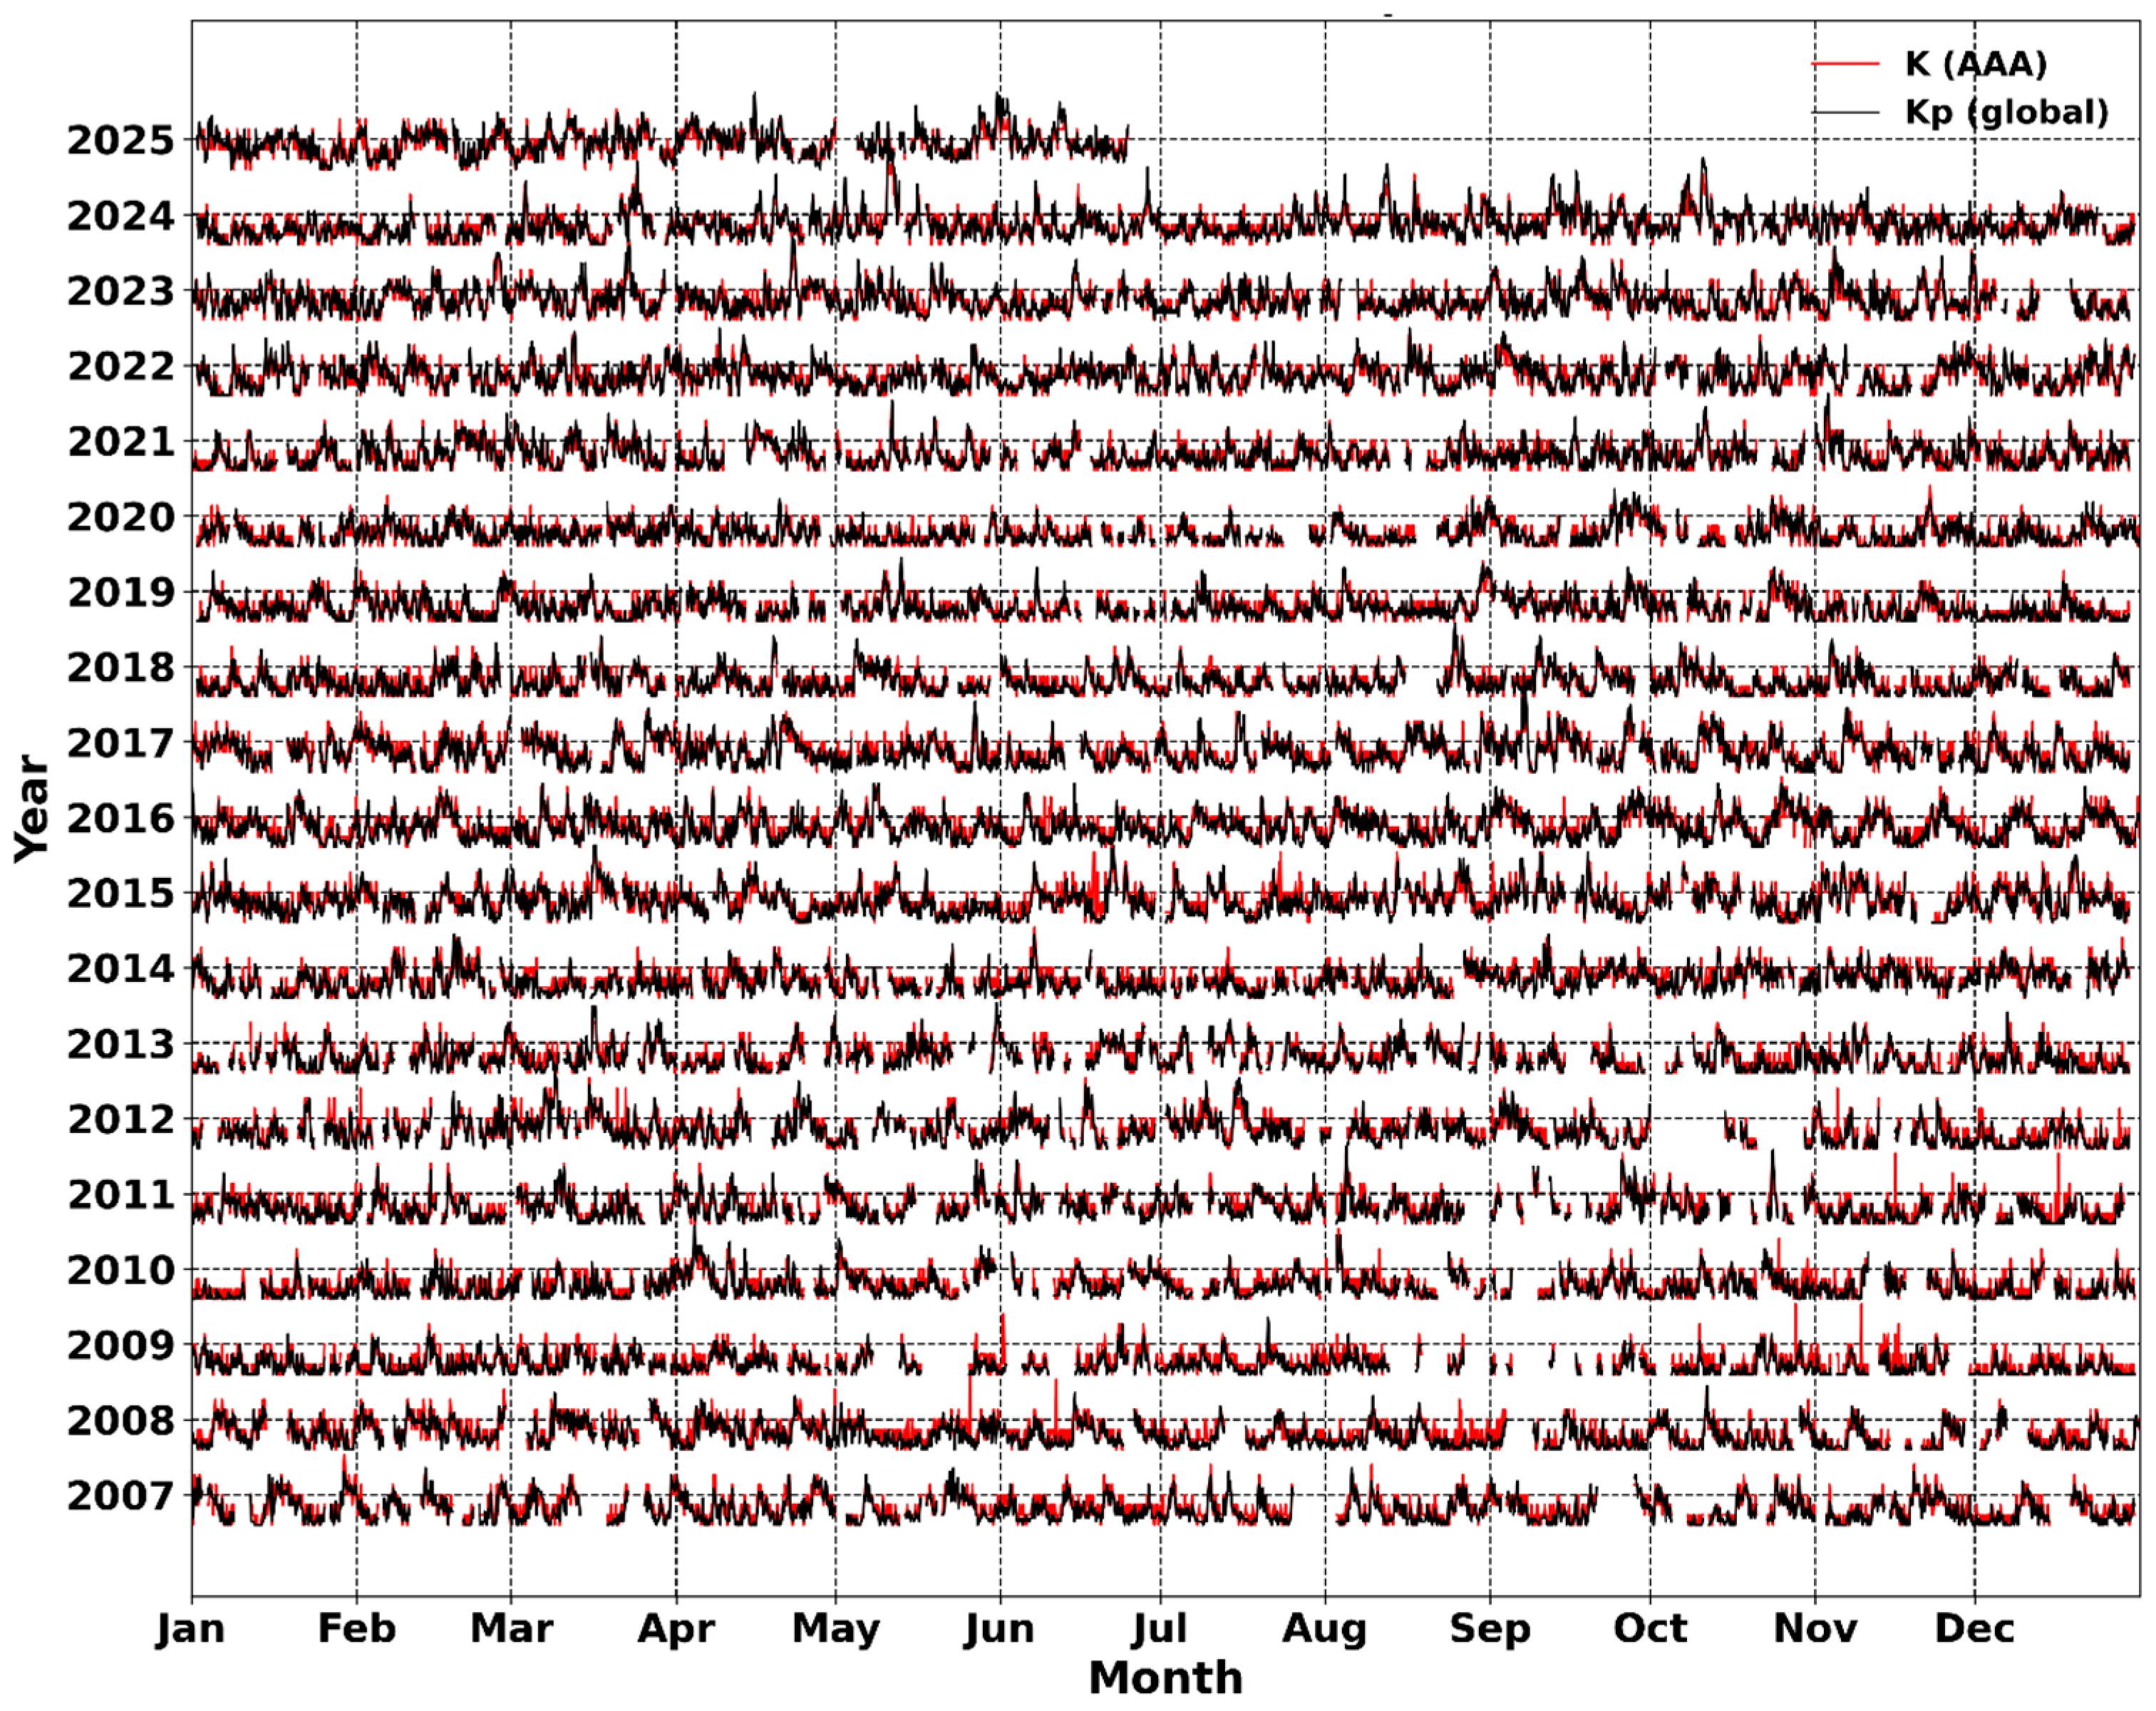
A comparison of the three-hour values of the local K (AAA) and global Kp indices revealed a high degree of coherence between the two time series. As shown in
Figure 1, both indices exhibit clear synchronization during periods of enhanced geomagnetic activity; however, the local index displays larger amplitude fluctuations and pronounced diurnal variations. In contrast, the global Kp index demonstrates a smoother behavior, reflecting the averaging of data from a distributed network of magnetic observatories.
This discrepancy between K and Kp emphasizes that local measurements are more sensitive to small-scale processes and can capture disturbances not evident in global indices. The overall similarity in their dynamics during magnetic storms confirms that regional magnetospheric responses are in phase with global solar–terrestrial processes. Nevertheless, differences in the amplitude and structural patterns of variations indicate that the local K index serves as a complementary diagnostic parameter, providing valuable insight into the spatial inhomogeneity of the magnetospheric response.
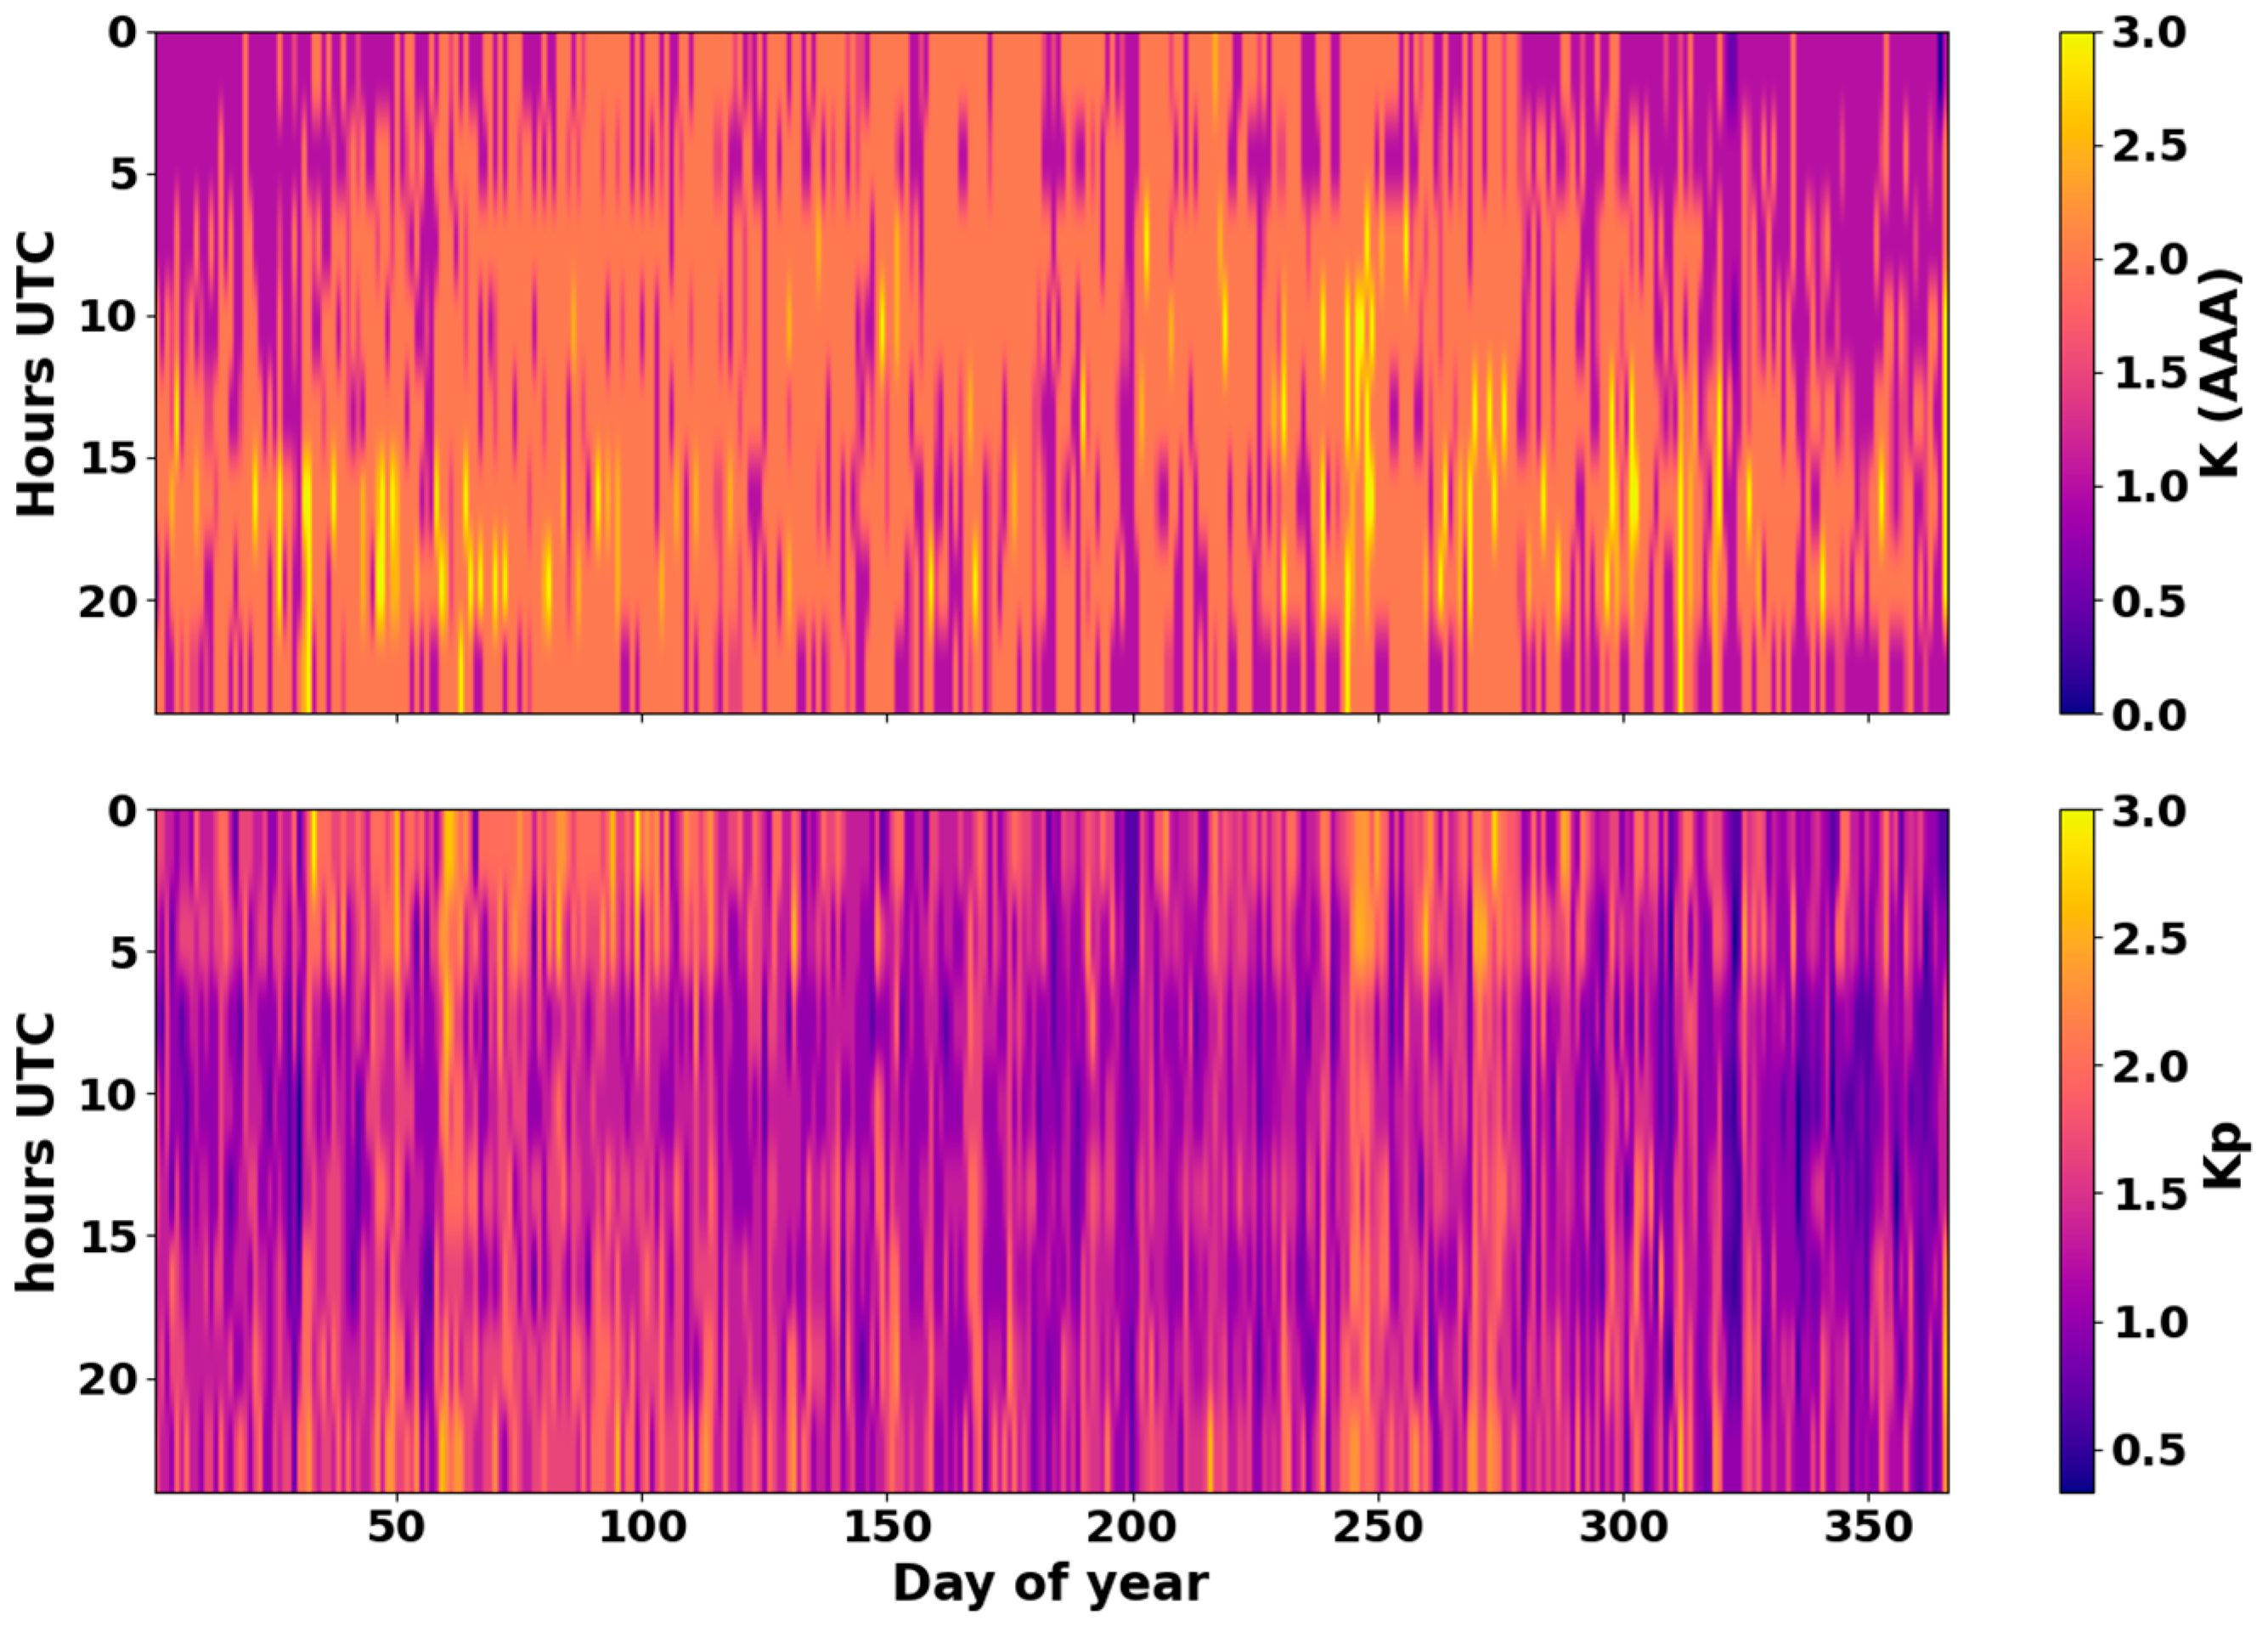
To identify diurnal and seasonal patterns in local and global manifestations of geomagnetic activity, heat maps of the median values of the K (Almaty Observatory, AAA) and Kp indices were constructed in the coordinates “day of year—hour (UTC)”. As shown in
Figure 2, both indices exhibit pronounced spatial–temporal inhomogeneity, reflecting the combined influence of seasonal effects and diurnal variations in magnetospheric disturbances.
For the local K (AAA) index, a distinct dependence on local time is evident: maxima of median values occur in the 18–23 UTC interval, corresponding to evening and nighttime hours in Kazakhstan. This structure is consistent with the typical ionospheric dynamics, in which variations in conductivity and current systems are most intense in the evening magnetospheric sector. In contrast, the global Kp index exhibits a smoother and more uniform distribution, reflecting averaging across all latitude zones. Nonetheless, seasonal shifts in intensity are also visible, particularly near the equinoxes, confirming the presence of the Russell–McPherron effect [
25,
26], which enhances the coupling between the interplanetary magnetic field and the magnetosphere during these periods.
A comparison of the maps reveals that the local K (AAA) index demonstrates greater contrast and sensitivity to regional disturbance features, whereas the global Kp index is more inertial, representing the integrated global level of geomagnetic activity. Thus, local observations are capable of capturing small-scale processes and short-term variations that tend to be smoothed out in the formation of global indices.
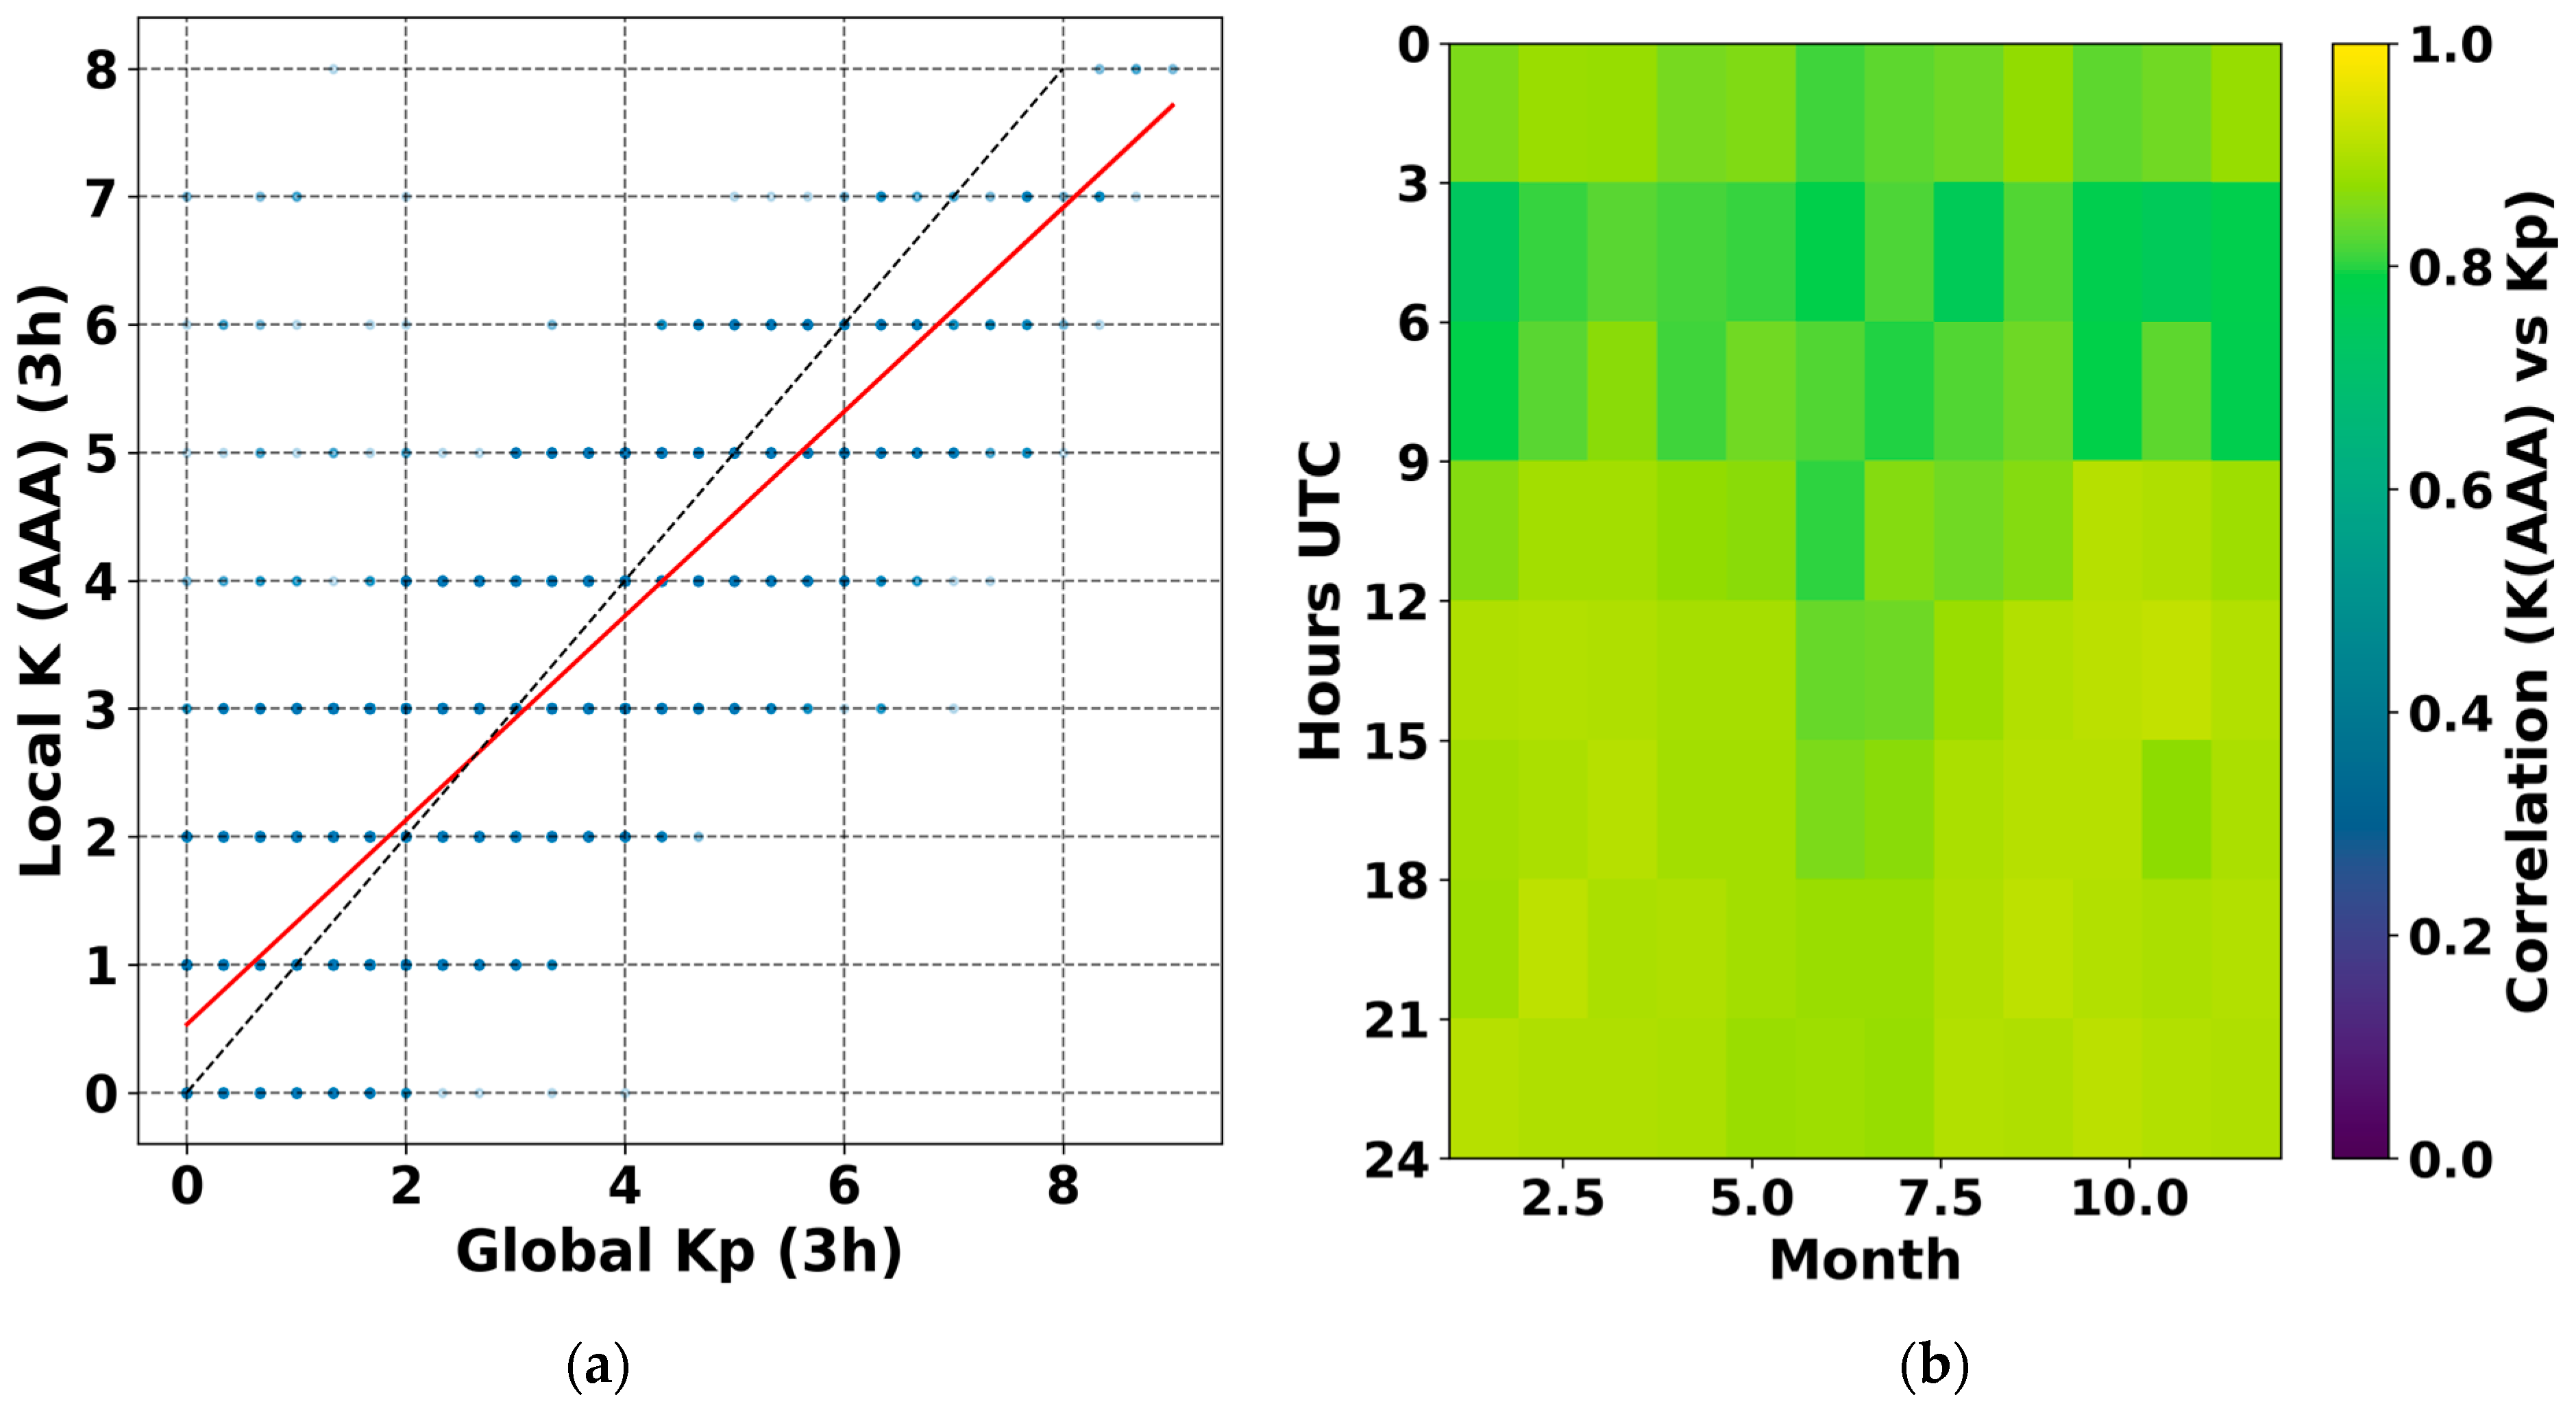
Figure 3a presents a scatter plot comparing the local geomagnetic activity index K (AAA) and the global Kp index, calculated for three-hour intervals over the entire observation period. Each point represents the correspondence between local and global levels of geomagnetic activity, while the red line indicates the linear regression fit. A clear positive correlation between K (AAA) and Kp (correlation coefficient r ≈ 0.84) is observed, indicating a strong overall consistency between regional and global magnetospheric processes.
At the same time, the local K (AAA) values show the closest correspondence to the global Kp index within the range of moderate disturbances (Kp ≈ 2–5), where the scatter around the regression line is minimal. Outside this range, the dispersion increases, reflecting the growing influence of local factors such as ionospheric current systems, the electrojet, and the geomagnetic latitude of the station, which modulate the amplitude of local magnetic field variations.
The high degree of correlation, coupled with persistent local deviations, confirms the complex, multiscale nature of magnetospheric processes, where global drivers interact with regional electrodynamic responses.
Figure 3b shows a two-dimensional correlation map between the local geomagnetic index K (AAA) and the global Kp index in the coordinates “month × hour (UTC)”. The color scale represents the Pearson correlation coefficient between the two indices, averaged over the entire observation period (2007–2025).
The highest correlation values (r ≈ 0.8–0.9) are observed during the evening and nighttime hours (18:00–03:00 UTC), when the geomagnetic field at the station is most sensitive to variations in magnetospheric current systems, particularly during substorm activity. In contrast, the correlation weakens slightly during daytime hours (06:00–12:00 UTC), reflecting the influence of local ionospheric currents driven by solar heating and conductivity variations. The local time at the Almaty (AAA) observatory corresponds to UTC + 6 h.
This diurnal modulation of correlation indicates the coexistence of global magnetospheric drivers and regional ionospheric responses, emphasizing the importance of local observations for resolving the temporal and spatial structure of geomagnetic activity.
The scatter plot illustrates a consistent correspondence between the magnitudes of the local K (AAA) and global Kp indices, while retaining a noticeable dispersion, particularly within the range of moderate geomagnetic activity. This indicates that global and local magnetic field variations are driven by the same disturbance sources, yet the amplitude of local fluctuations strongly depends on regional current systems and the geomagnetic latitude of the observatory.
The correlation map refines this pattern, revealing a systematic diurnal and seasonal modulation of coherence between the indices. The highest correlation values (r > 0.8) occur during the evening and nighttime hours (UTC), when local magnetic field variations are most in phase with global magnetospheric processes. During the daytime, the correlation weakens slightly due to the influence of ionospheric currents and solar heating-driven diurnal effects.
Seasonal variations are moderate but become more pronounced around the equinoxes, consistent with the Russell-McPherron effect, which enhances the coupling between the interplanetary magnetic field and the magnetosphere during these periods.
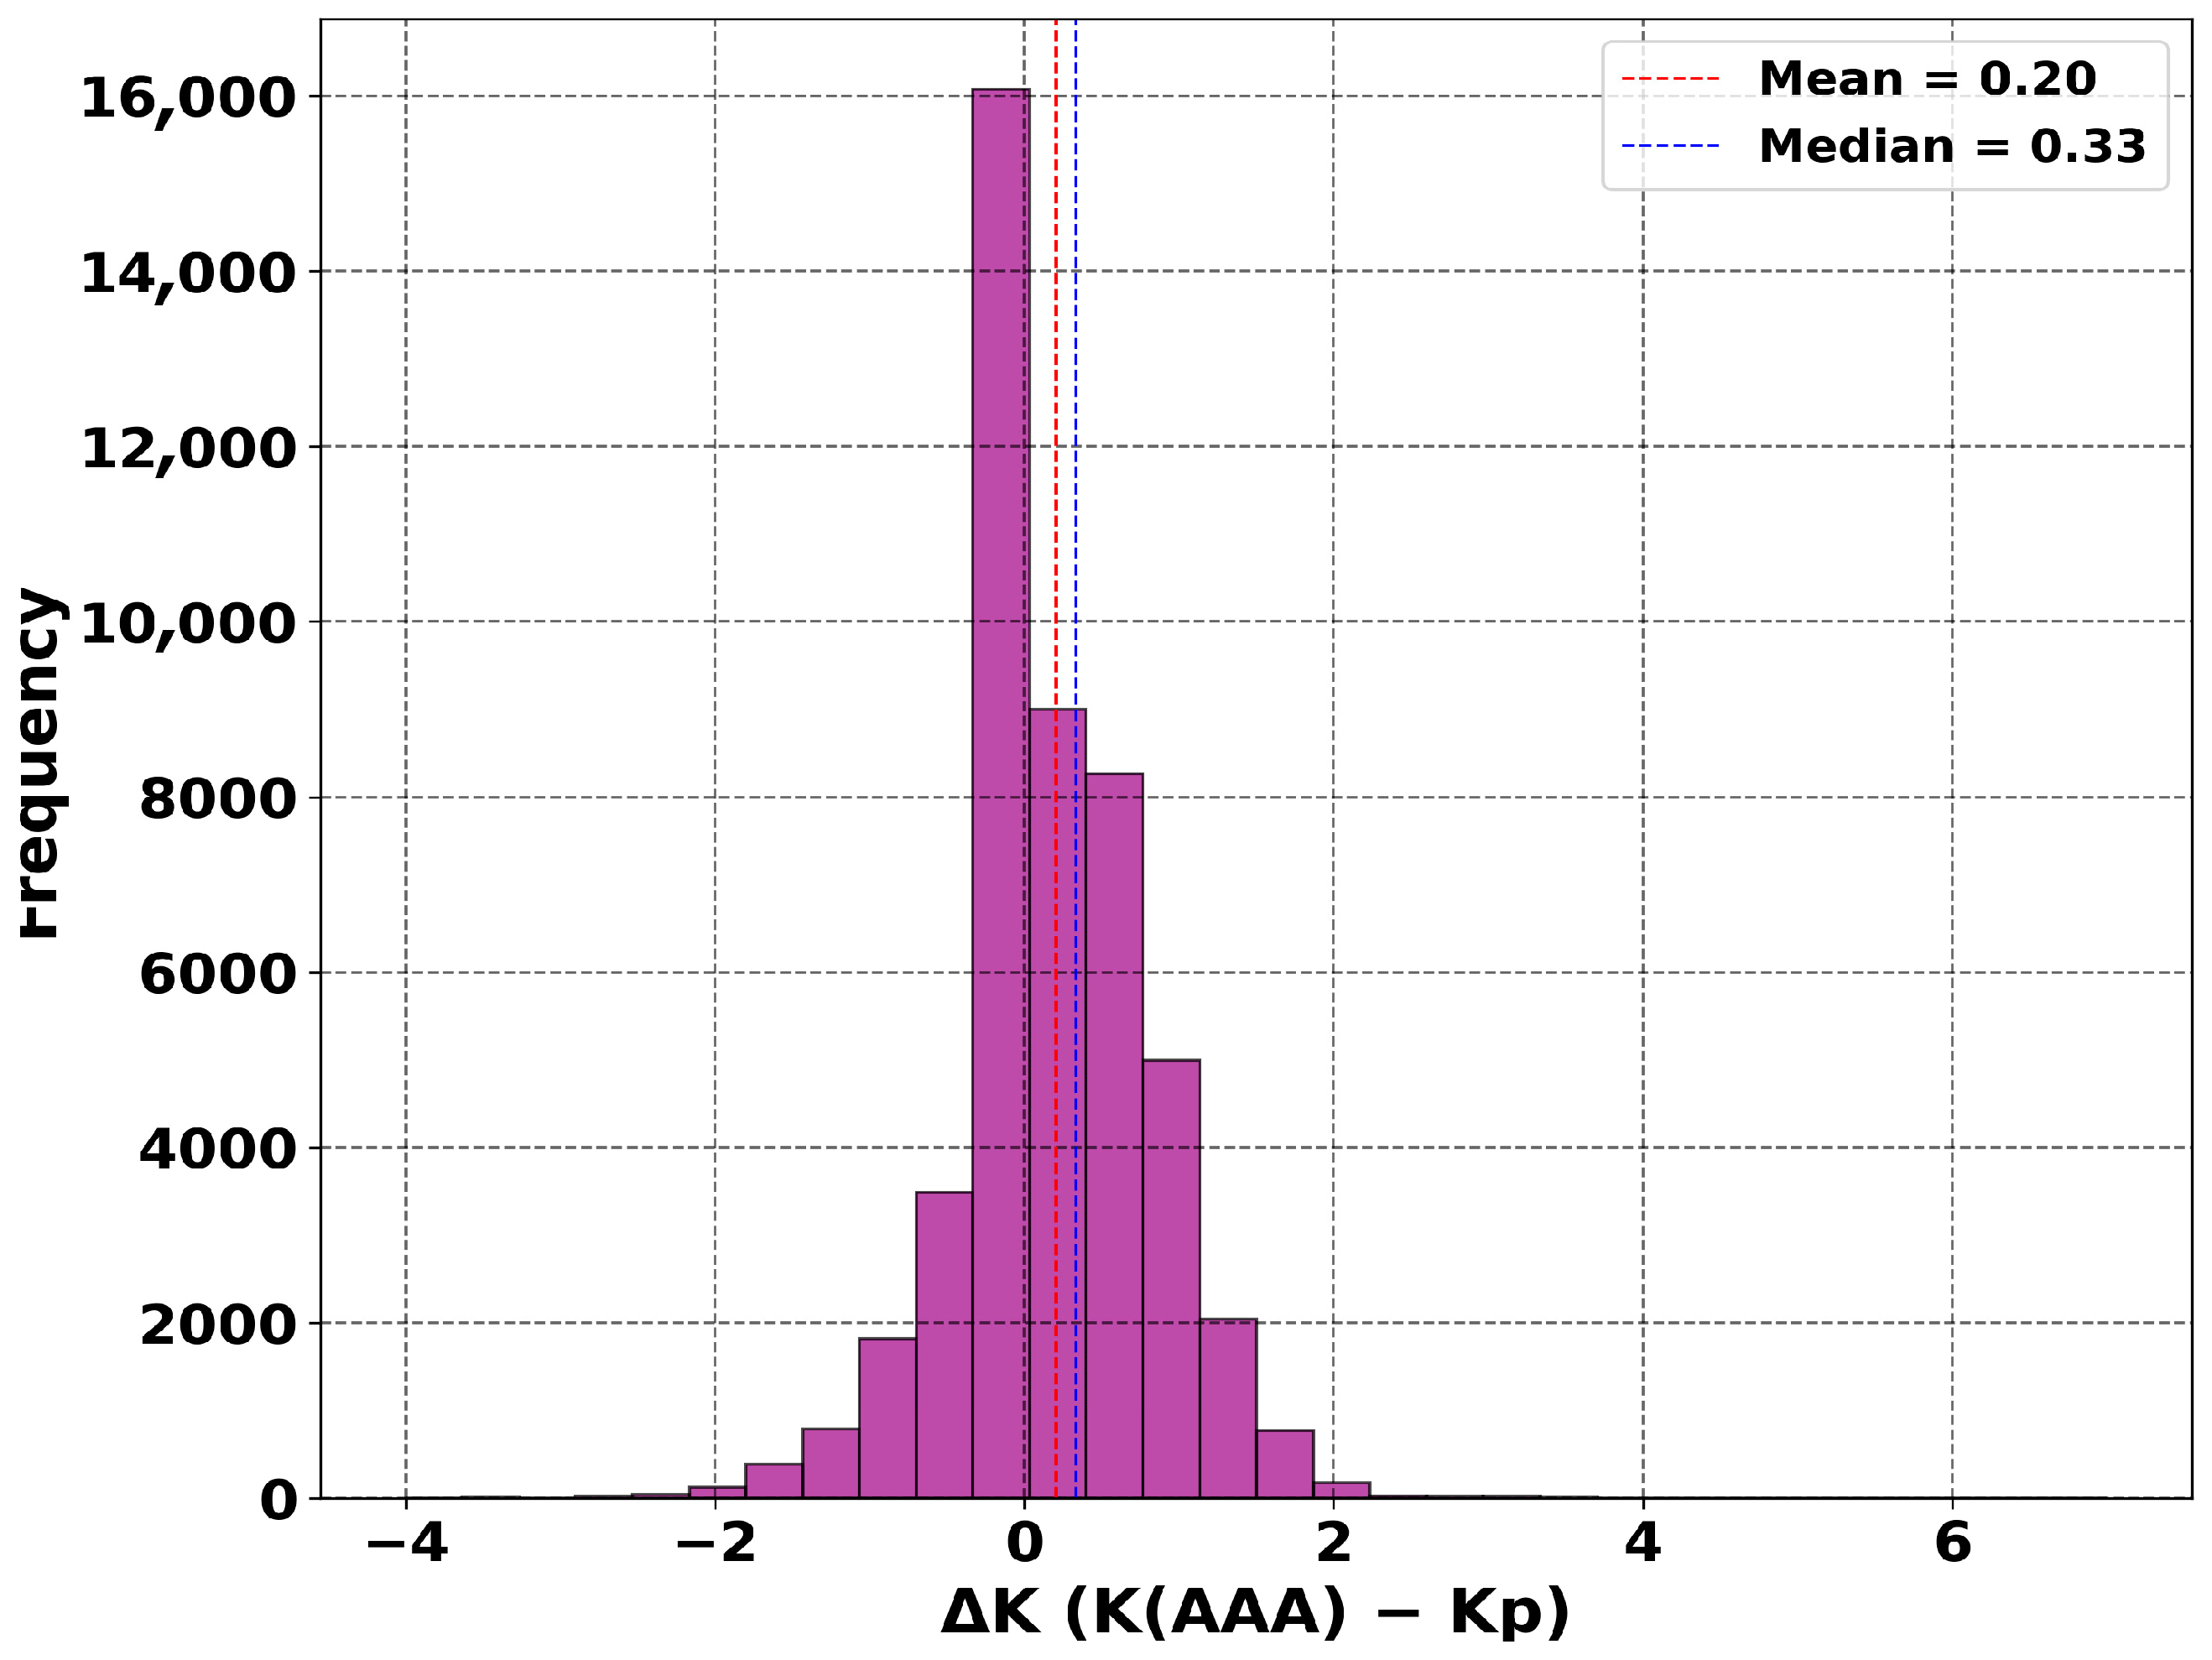
To quantitatively assess the discrepancies, the distribution of differences was calculated as ΔK = K (AAA) − Kp (
Figure 4). The mean difference was +0.20, the median +0.33, and the standard deviation approximately 0.69. These results indicate that the local K index systematically exceeds the global Kp index, while the spread of values reflects the presence of additional regional variations.
Thus, there is a consistent positive bias of the local index relative to the global one, suggesting that the AAA observatory records geomagnetic disturbances that, on average, are stronger than those represented by the globally averaged Kp. This bias highlights the enhanced regional sensitivity of the Almaty station to local magnetospheric–ionospheric processes.
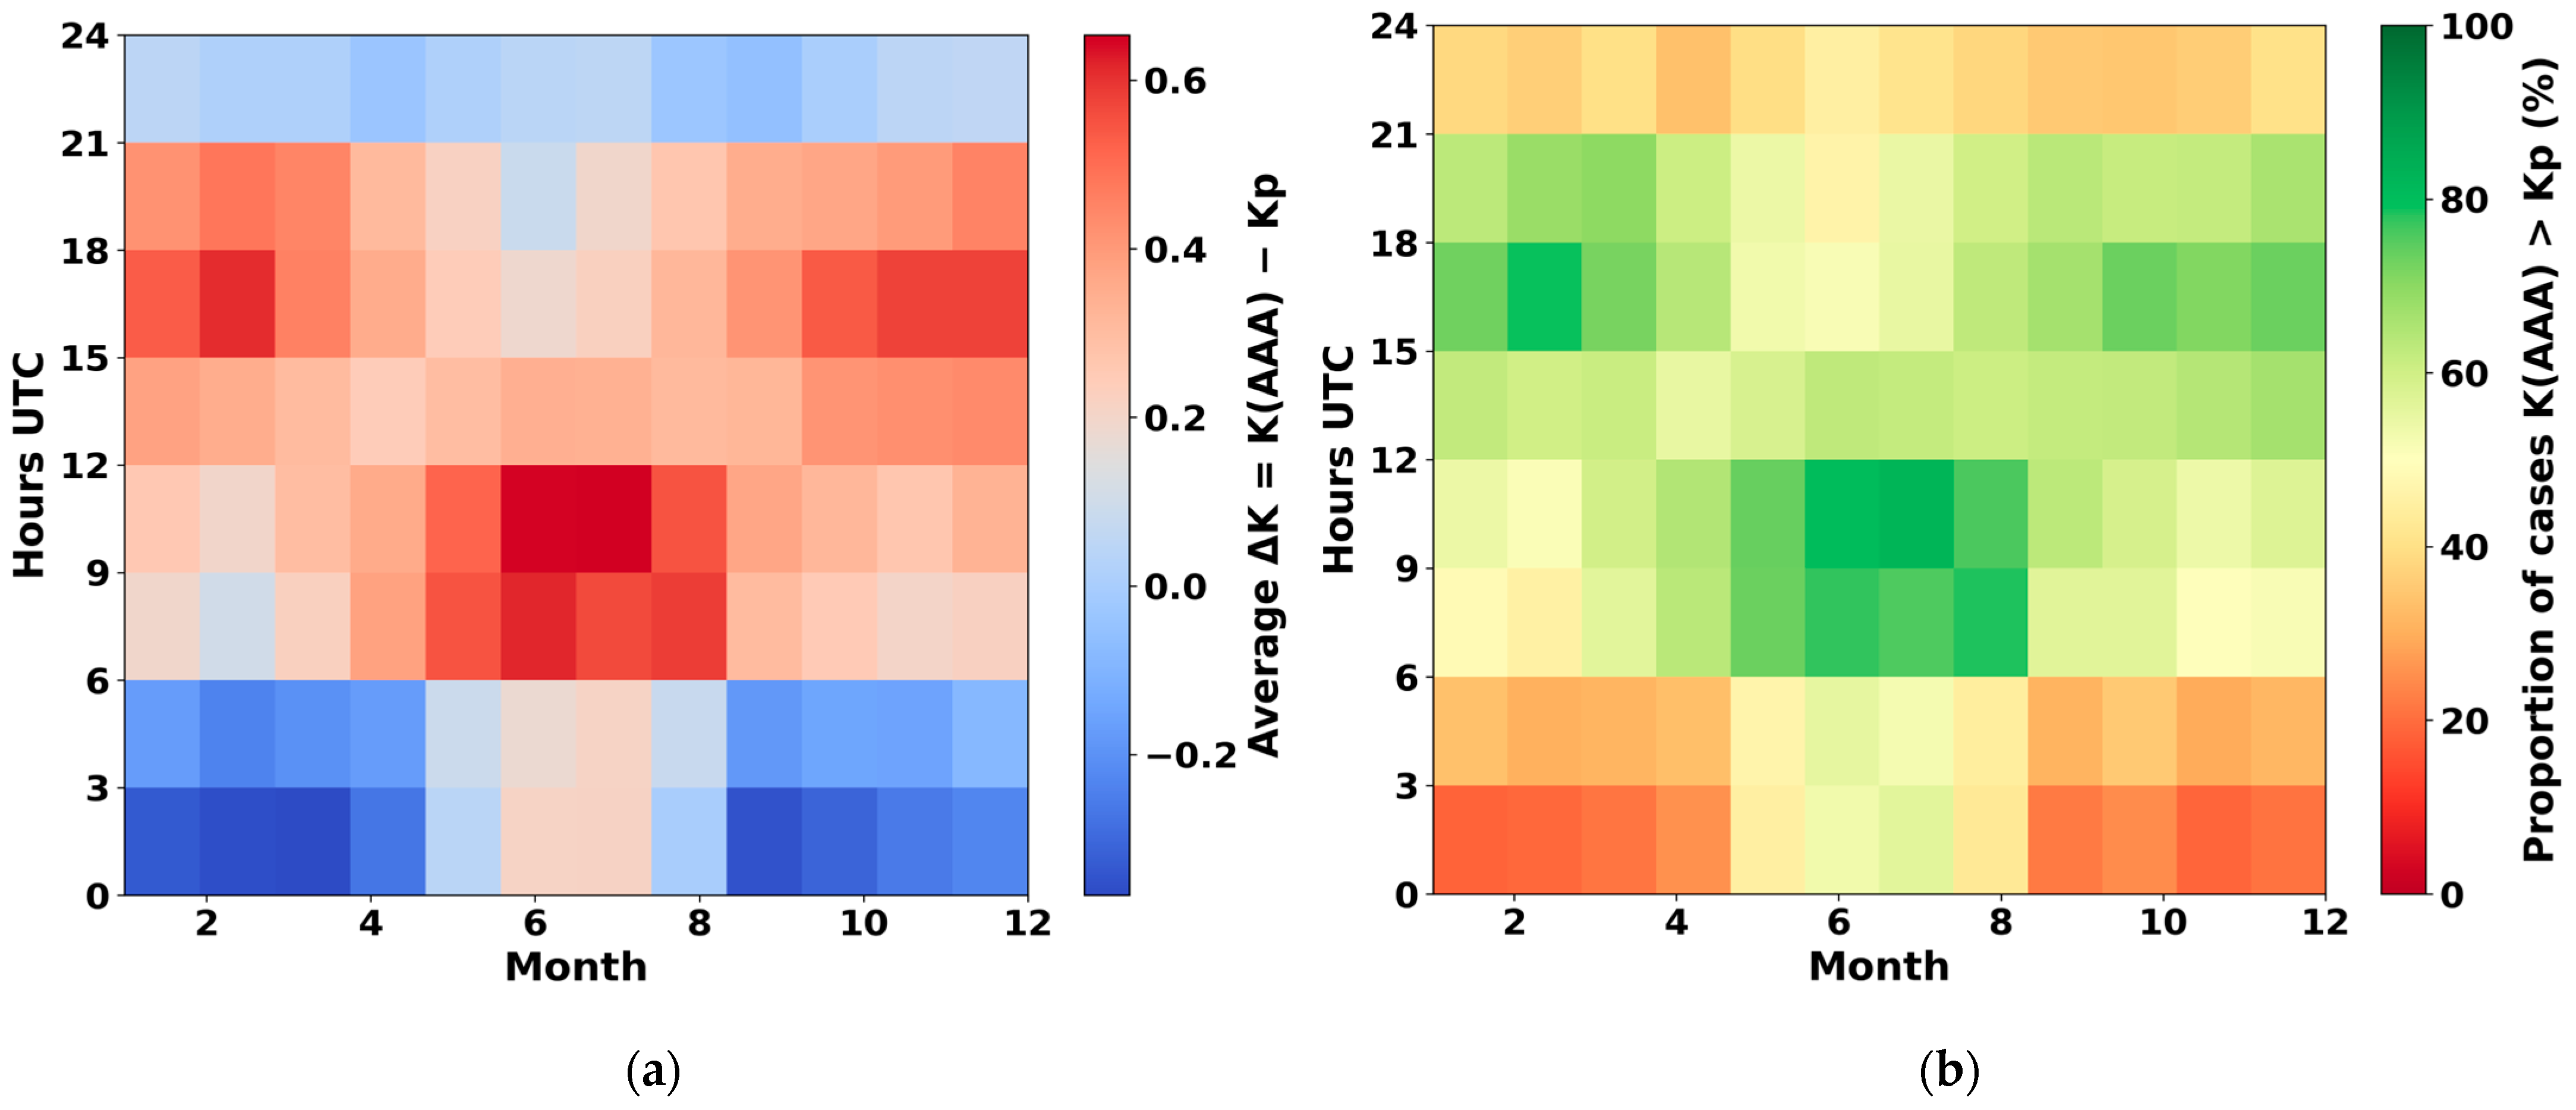
To examine the temporal structure of the discrepancies, the dependence of the offset ΔK = K (AAA) − Kp on month and time of day was analyzed (
Figure 5a). It was found that during the nighttime hours (01:30–04:30 UTC), the local index tends to be lower than Kp, particularly in the winter season (ΔK ≈ −0.3 to −0.4). In contrast, during the daytime interval (07:30–16:30 UTC), a persistent positive anomaly is observed (ΔK up to +0.6 in summer), indicating an enhanced sensitivity of the Almaty observatory to disturbances in the dayside magnetospheric sector. The zone of elevated correlation (r ≈ 0.6–0.7) extends from 9 to about 12 UTC.
In the evening hours (around 19:30 UTC), the local index frequently exceeds the global value, while the differences tend to diminish toward midnight. This asymmetry corresponds to variations in ionospheric conductivity and daytime electrodynamic response, consistent with the Russell-McPherron effect, which governs the seasonal modulation of solar wind–magnetosphere coupling.
An additional analysis of the frequency of cases where the local index K (AAA) exceeds the global Kp (
Figure 5b) confirmed the previously identified patterns. During daytime hours, the probability of K (AAA) > Kp reaches 60–80%, with a maximum in summer. At night, this probability decreases to 20–30%, while during the transitional seasons (spring and autumn), the contrast between day and night is particularly pronounced.
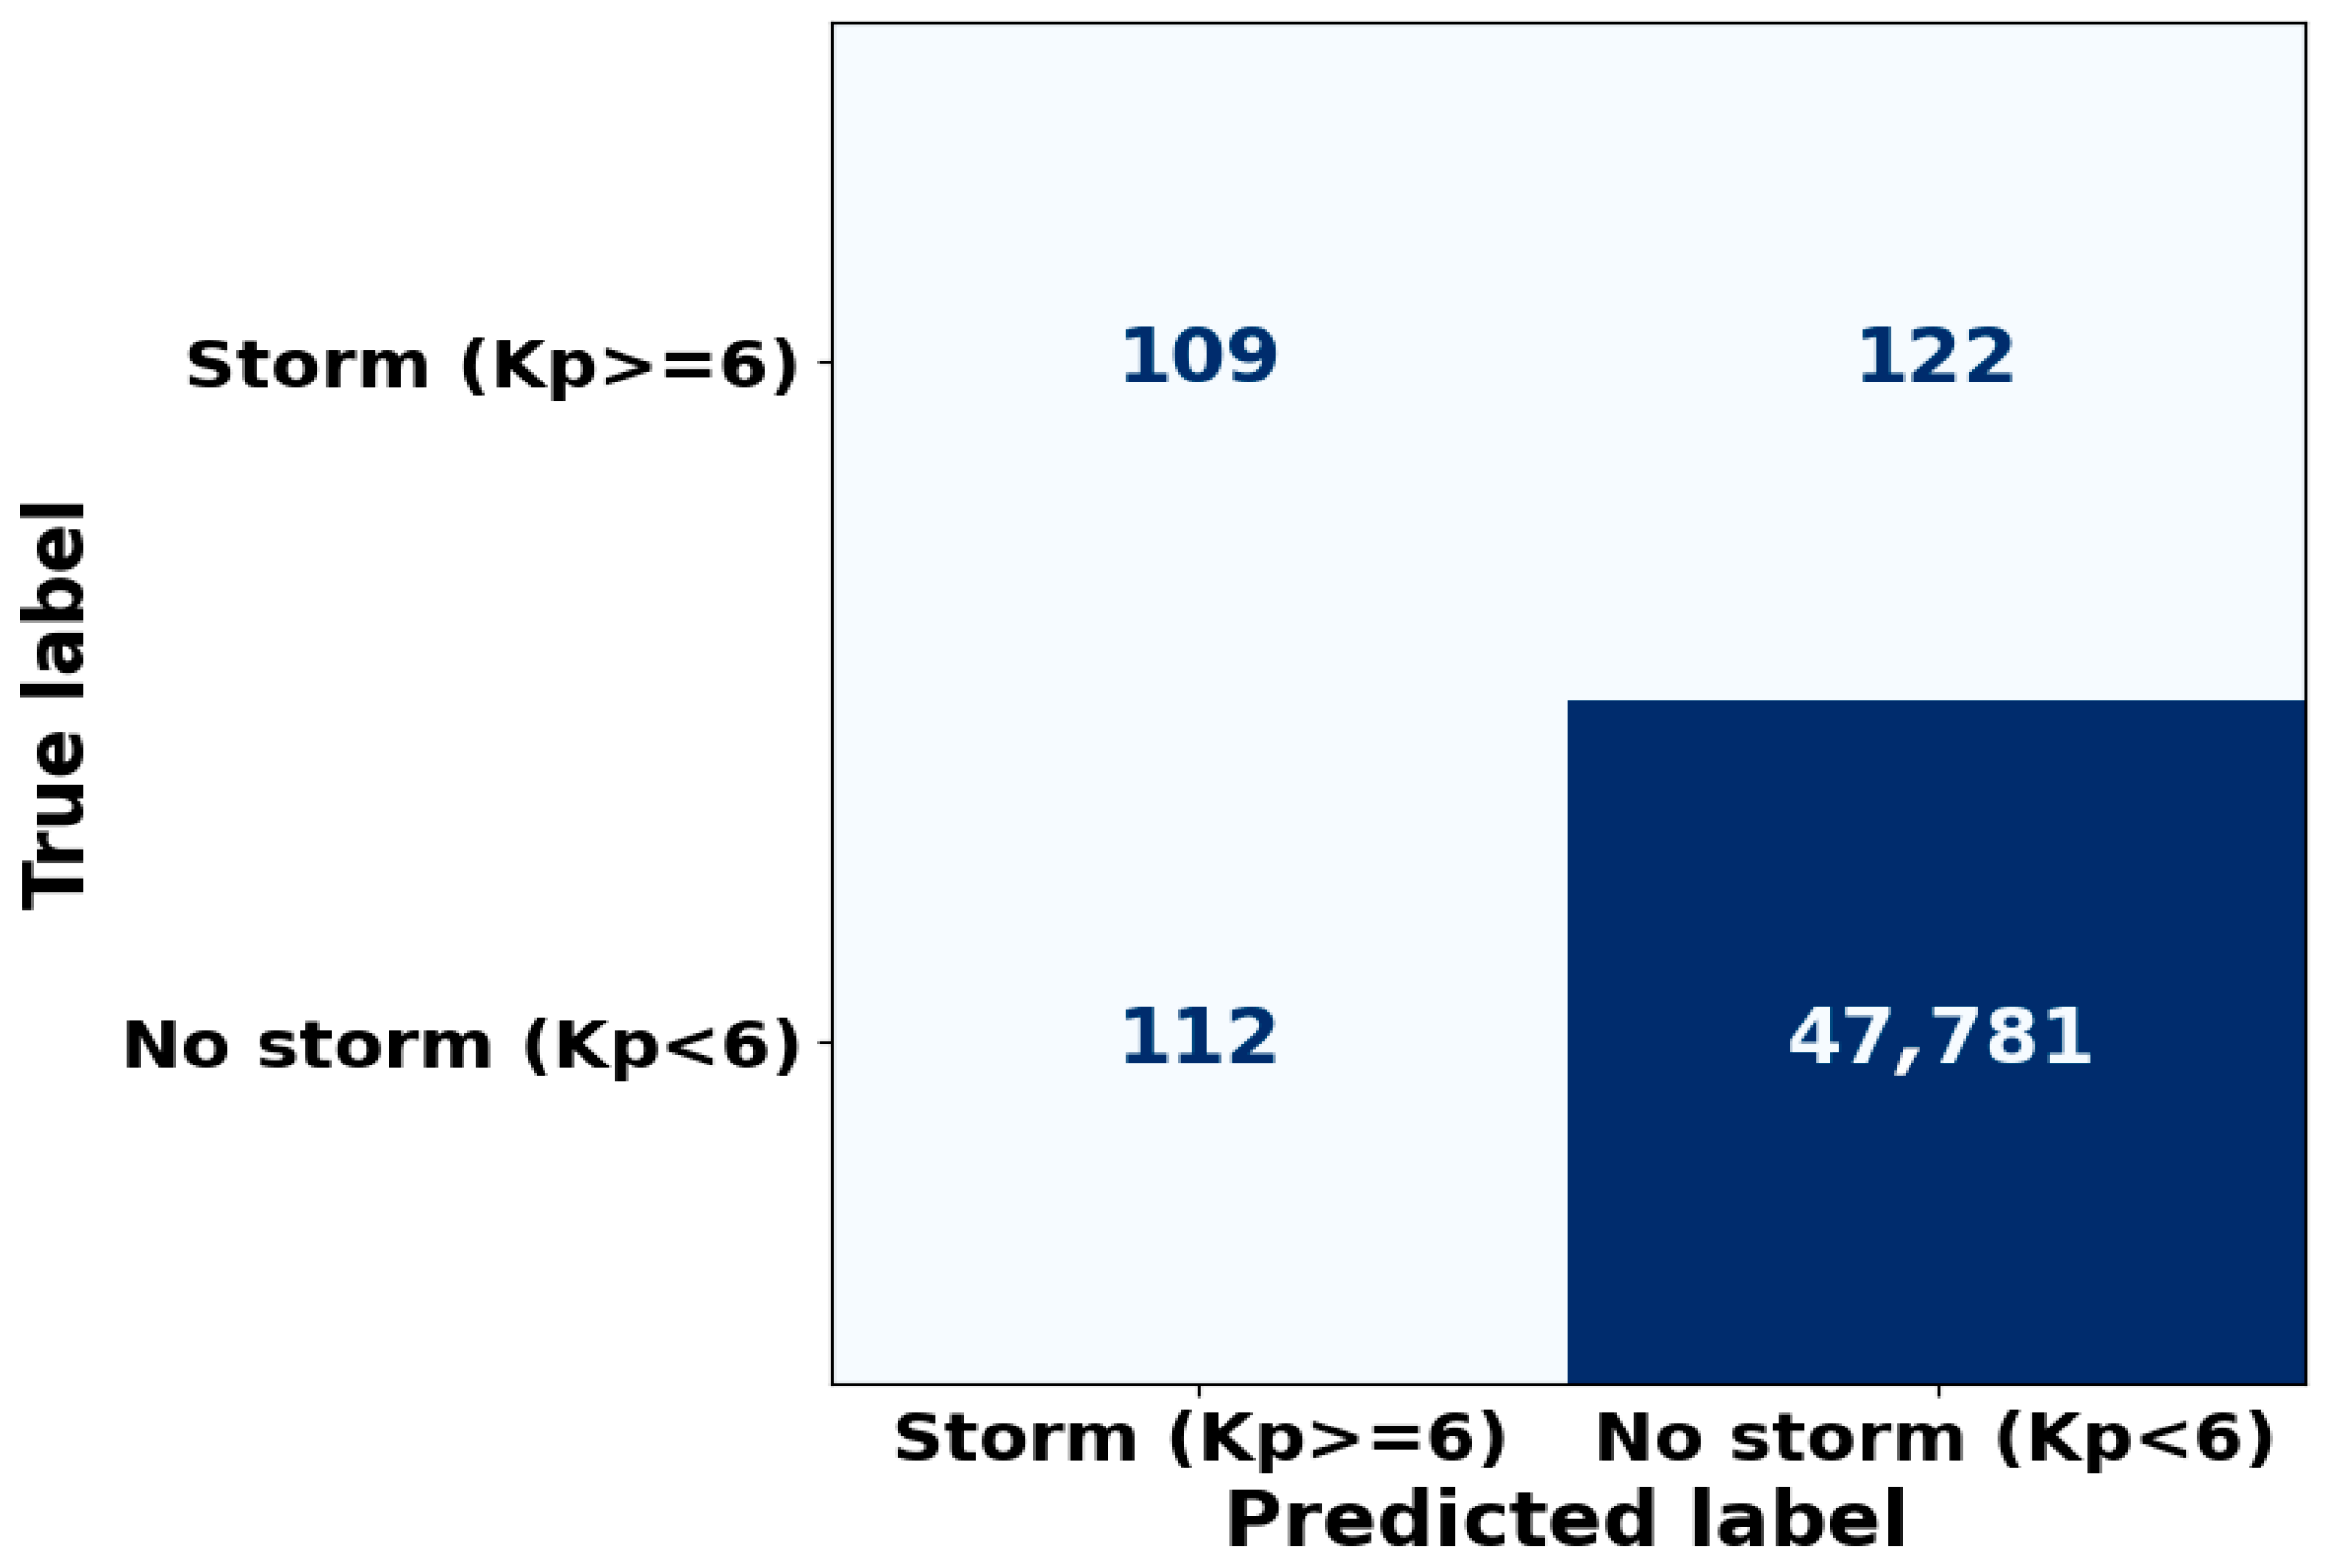
To evaluate the ability of the local K (AAA) index to reproduce global magnetic storms, defined by Kp ≥ 6, an event coincidence analysis was performed. In this case, an interval was classified as a “magnetic storm.” Based on the three-hour data, a confusion matrix was constructed to represent the matches and mismatches between the local and global indices (
Figure 6):
True Positive (TP)—storms detected by both Kp and K(AAA): 109 cases;
False Negative (FN)—storms identified by Kp but not detected at K (AAA): 112 cases;
False Positive (FP)—local events with K (AAA) ≥ 6 while Kp remained below the threshold: 122 cases;
True Negative (TN)—absence of storms in both datasets: 47,781 cases.
Thus, in the vast majority of intervals, the indices show strong agreement, while individual discrepancies reflect the regional specificity of the geomagnetic field response.
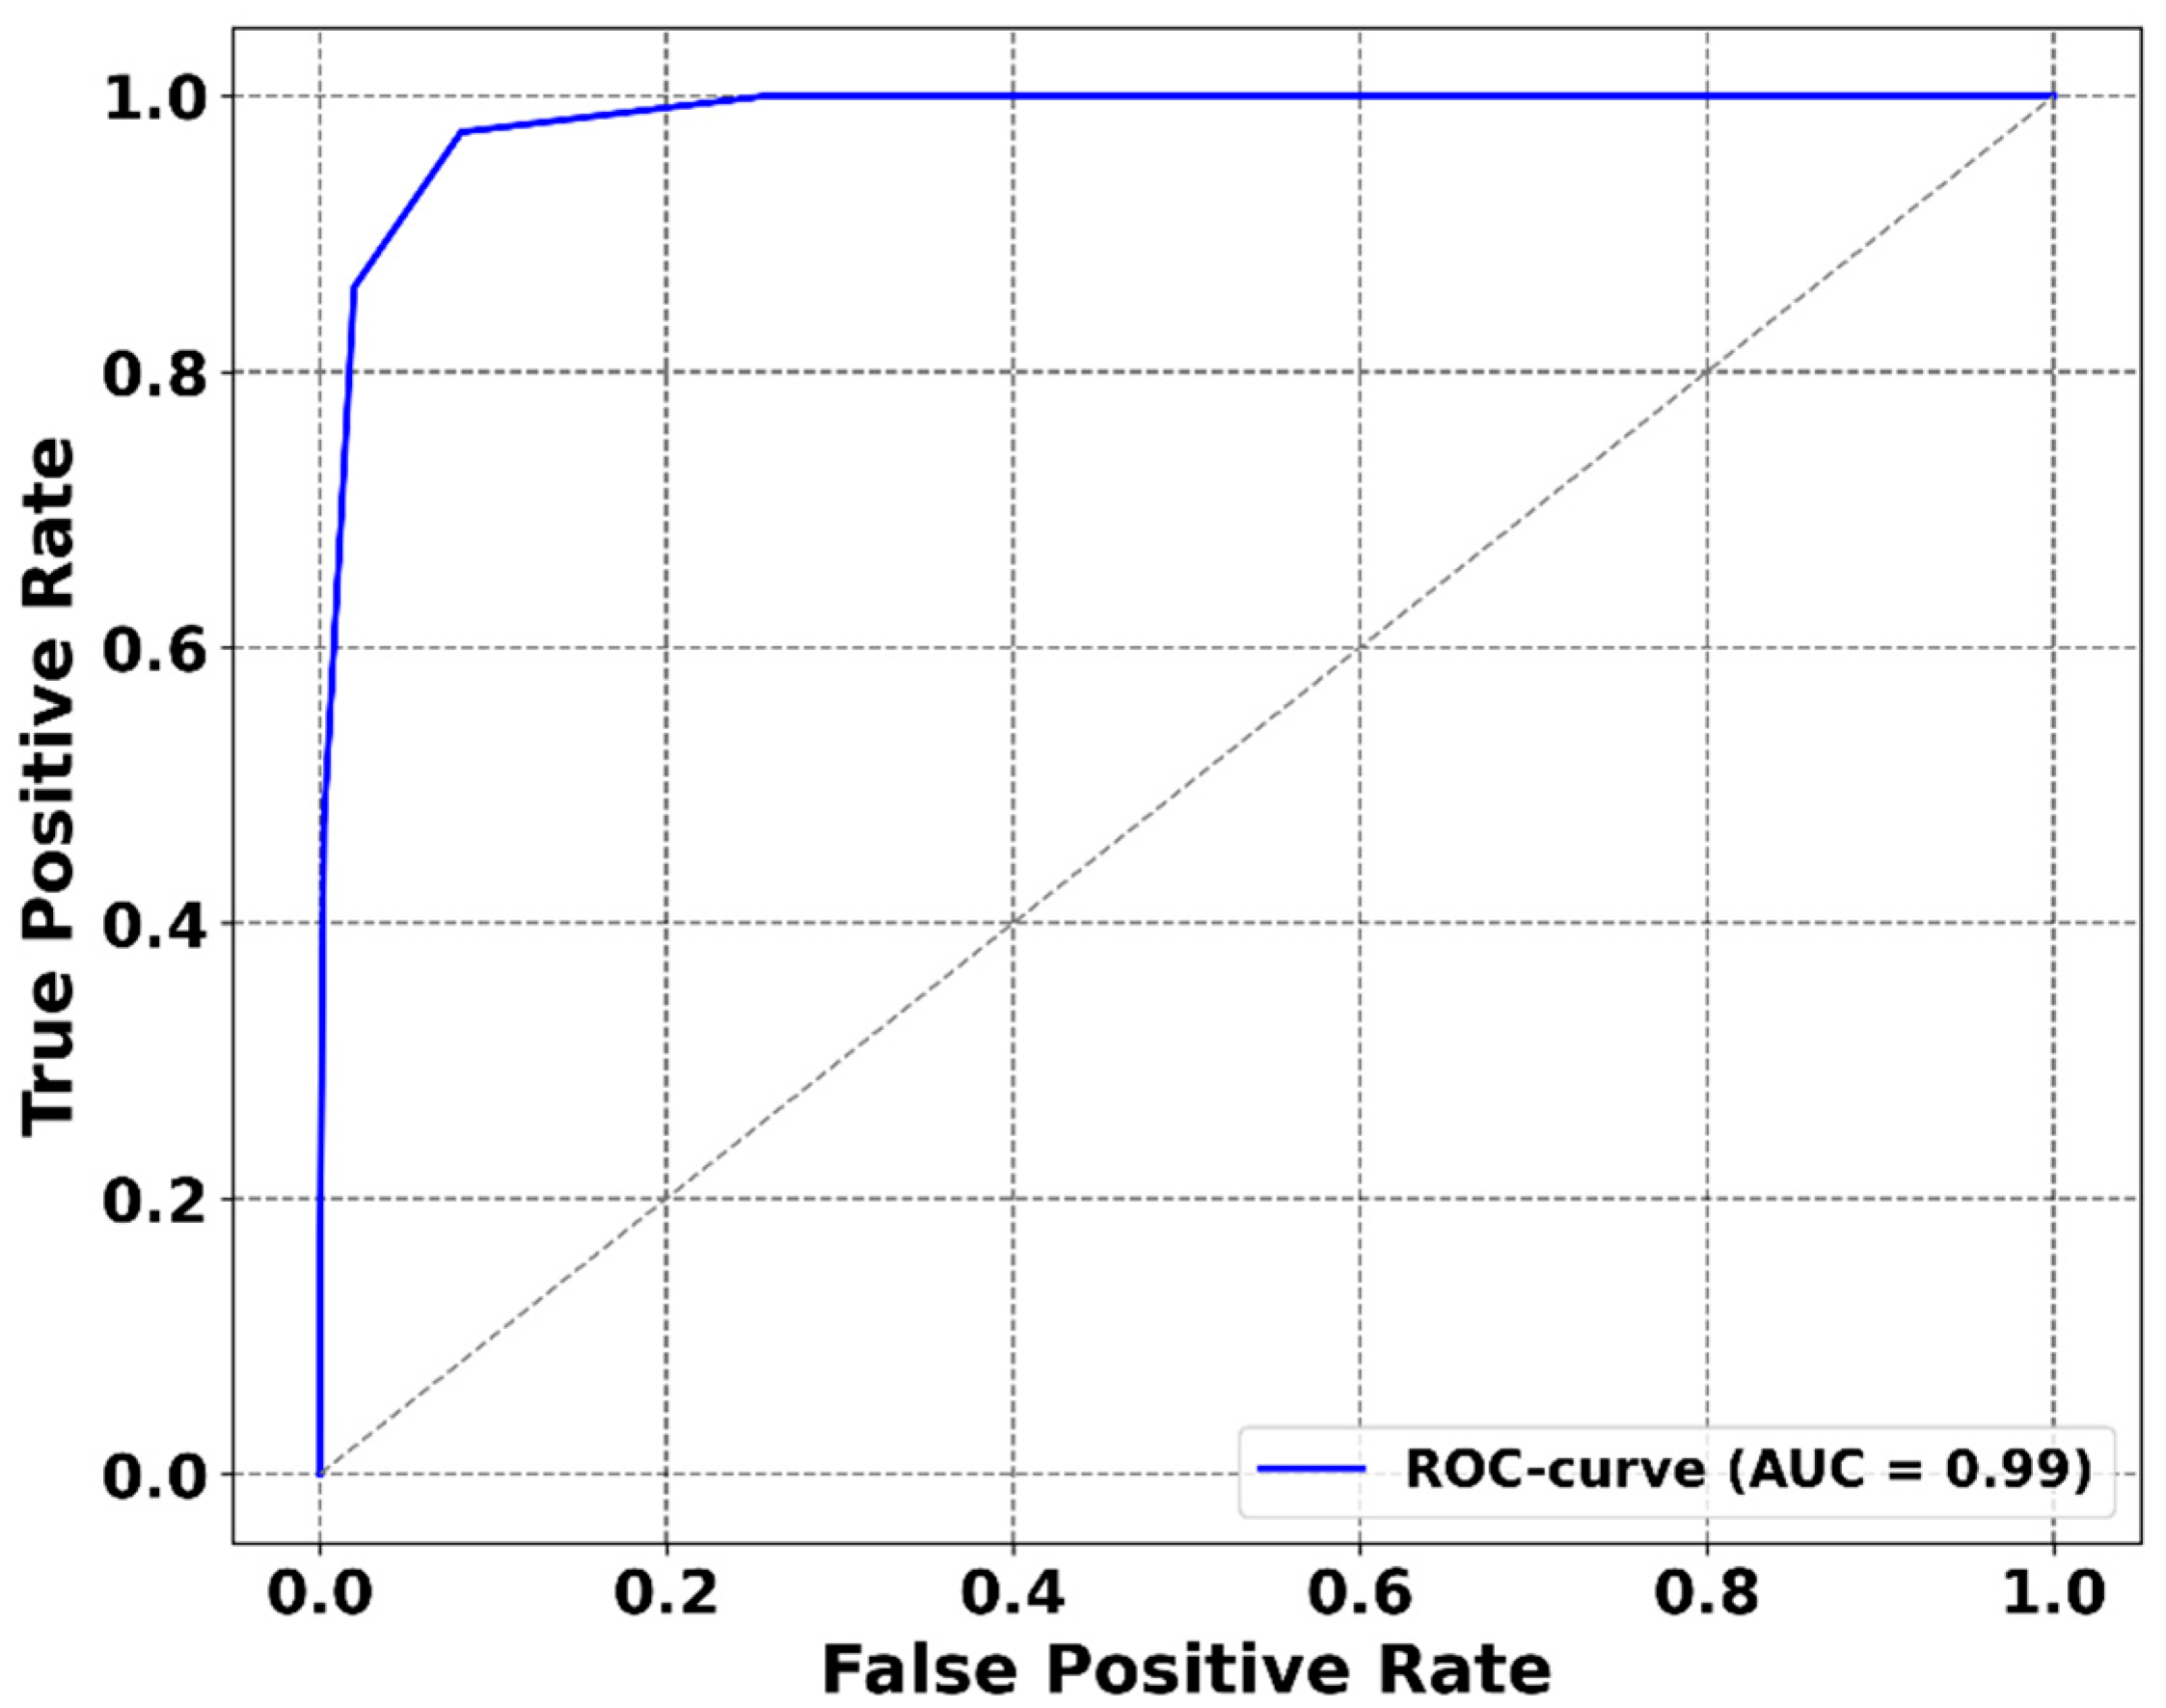
For a more detailed assessment, a ROC curve was constructed using the local K (AAA) index as a classifier of geomagnetic storms relative to the global Kp index (
Figure 7). The resulting AUC value of 0.99 indicates an almost perfect agreement between the two datasets.
The AAA observatory demonstrates a high reliability in detecting extreme geomagnetic disturbances. However, in some instances, it registers local enhancements that are not reflected in the global Kp index (false positives, FP), while in other cases it misses individual global storm events (false negatives, FN). These discrepancies are likely associated with regional characteristics of the geomagnetic response, influenced by the specific longitude and latitude of the observatory and the local configuration of ionospheric current systems.
3.2. Spectral and Wavelet Analysis
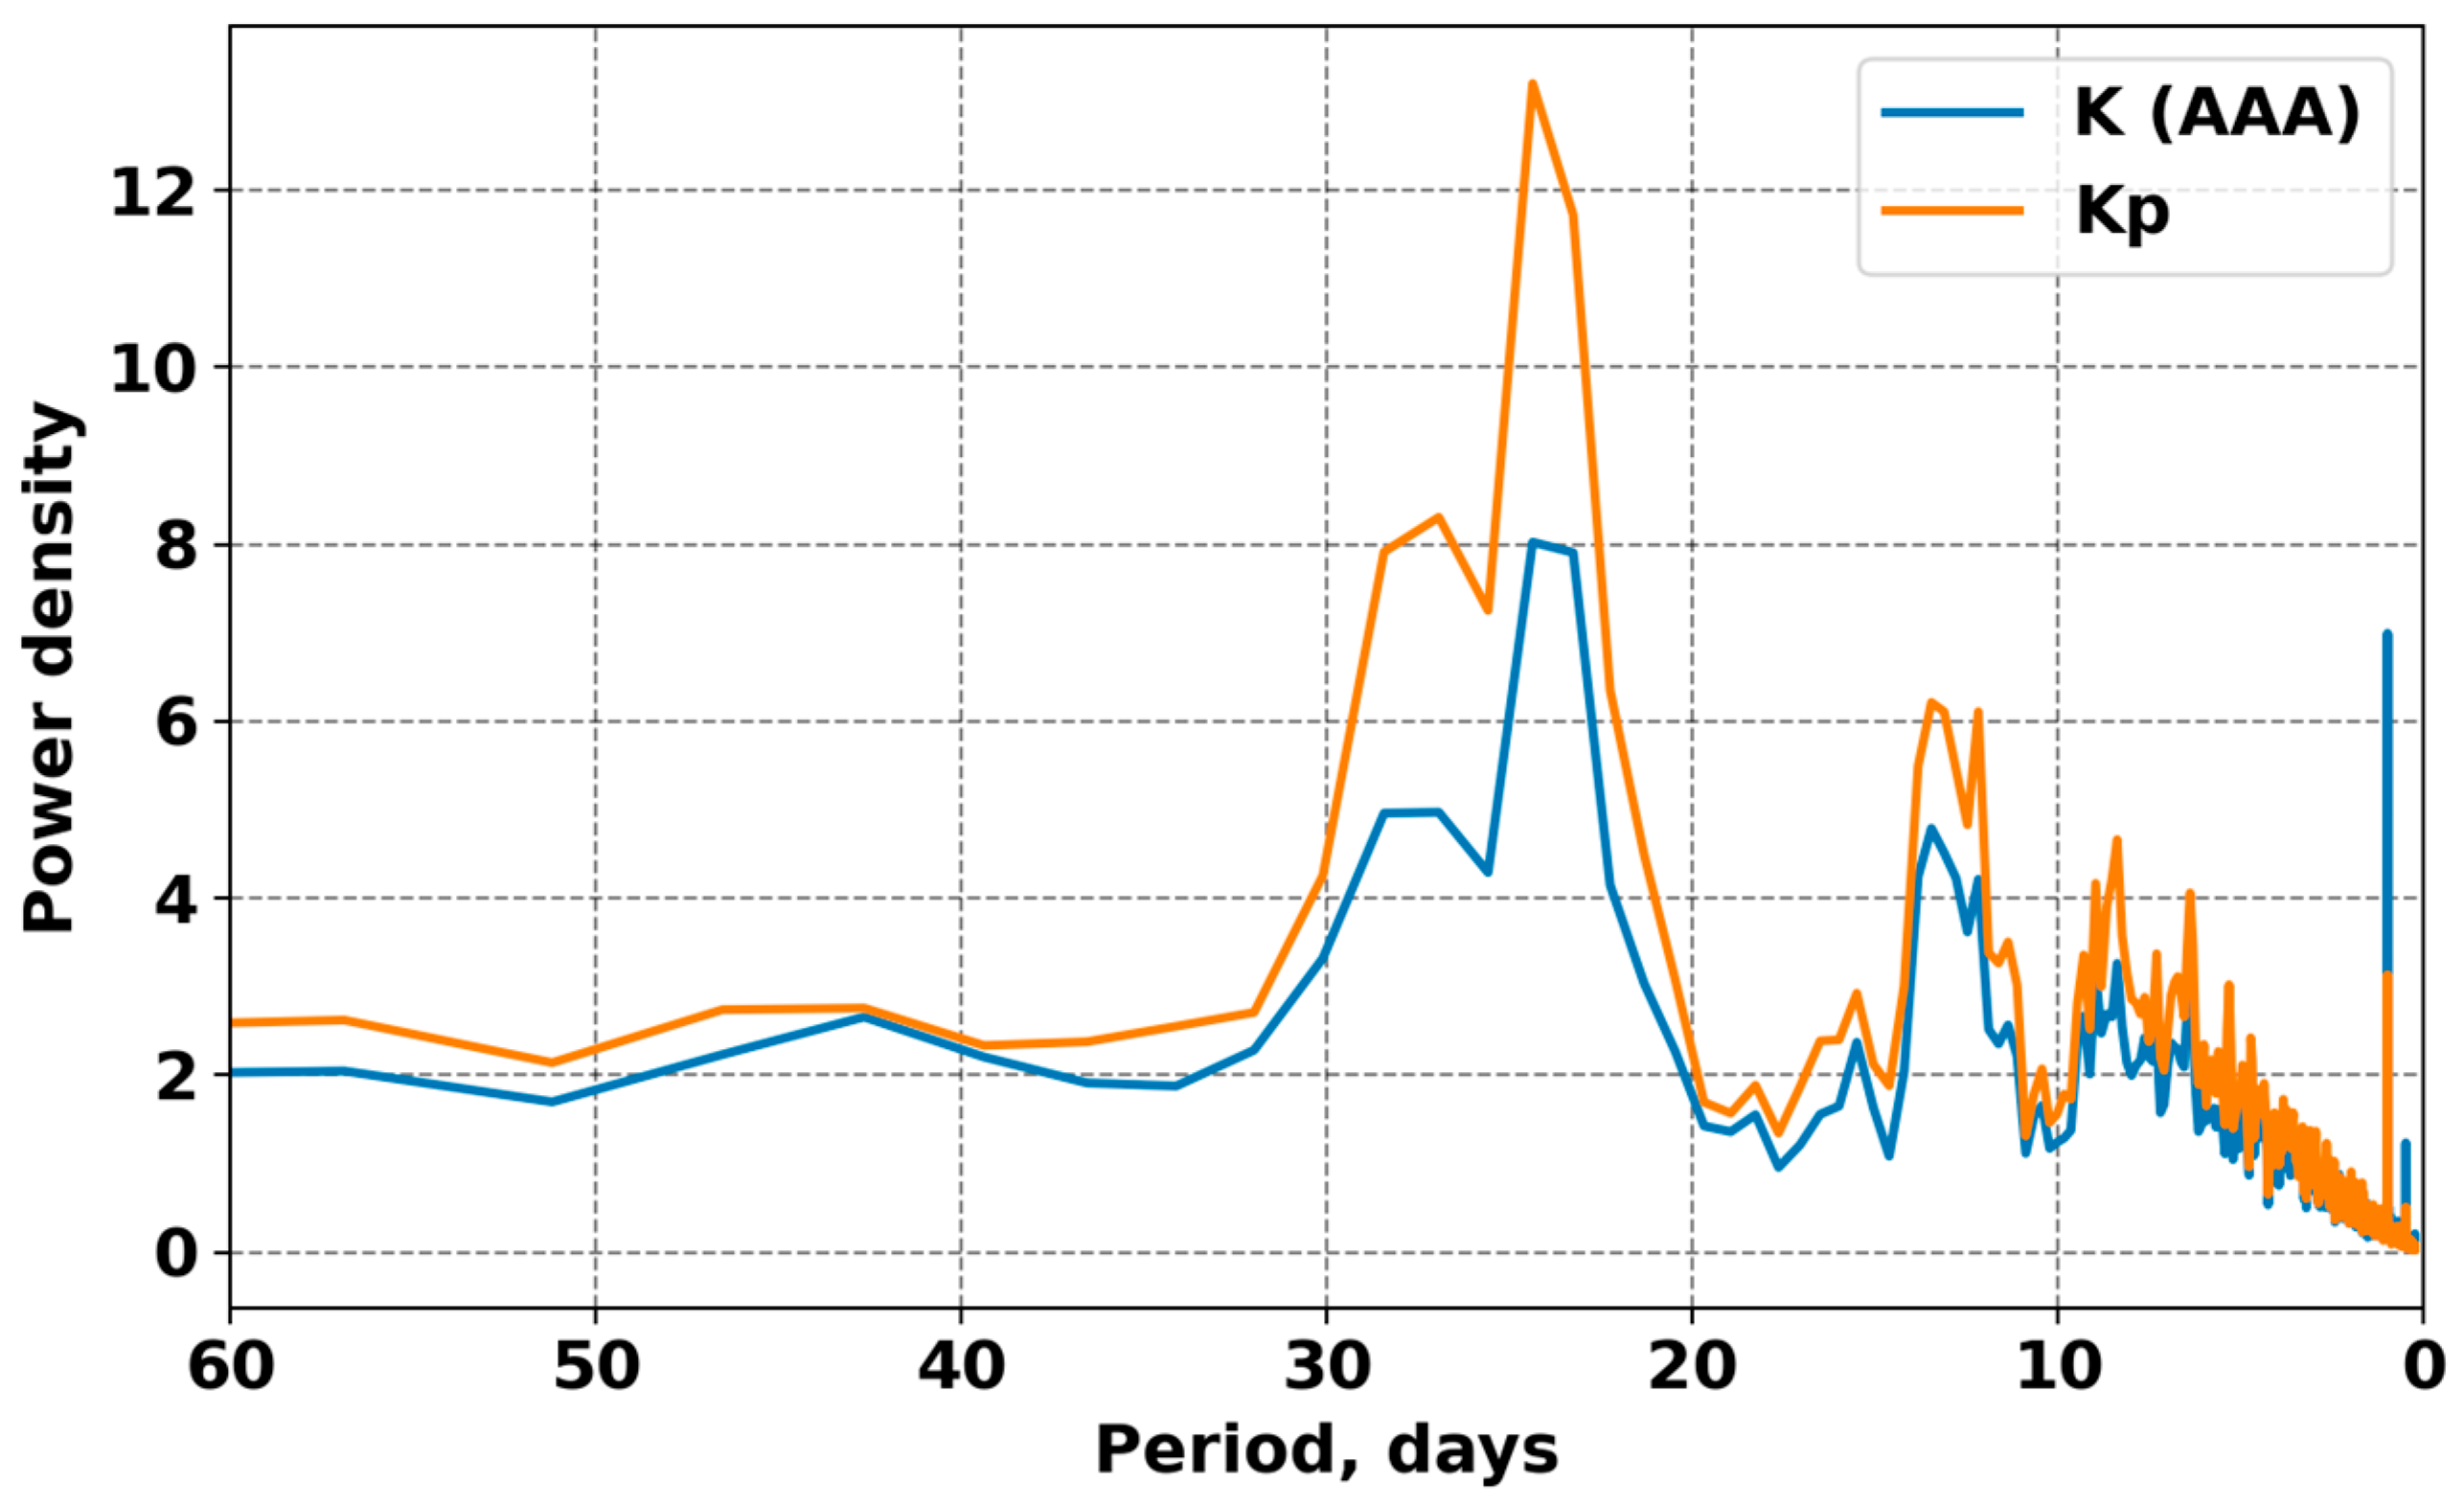
To identify the dominant periodicities in the dynamics of geomagnetic activity, a spectral analysis of the time series of the local K (AAA) index and the global Kp index was performed. Calculations were carried out using the Welch method with periodogram averaging, which reduced the variance of the PSD estimates.
A comparison of the spectra (
Figure 8) showed that both indices exhibit similar spectral characteristics, reflecting the common physical origin of geomagnetic field disturbances. The most persistent spectral peaks correspond to the following periodicities [
27]:
~27 days—the solar rotation period, determining the recurrence of large-scale solar wind disturbances;
~13–14 days—a subharmonic of solar rotation, associated with the asymmetry of solar wind streams within the heliospheric structure;
7–9 days—oscillations reflecting the dynamics of recurrent interplanetary disturbances.
Both spectra exhibit a pronounced peak near a 24-day period, corresponding to a subharmonic of the solar rotation cycle. This component reflects recurrent magnetospheric disturbances driven by long-lived solar wind structures—such as coronal holes and co-rotating interaction regions—which modulate geomagnetic activity on quasi-periodic timescales [
28].
At shorter periods (<10 days), the overall spectral power of K (AAA) is comparable to that of Kp; however, a slight enhancement is observed in the 1–3 day range, reflecting the sensitivity of the local index to short-lived regional geomagnetic disturbances and substorm activity but the average Kp partially smooths out these rapid changes.
The higher power density of the global Kp spectrum compared to the local K (AAA) spectrum indicates that large-scale, persistent geomagnetic variations contribute more strongly to the global index. This reflects the cumulative nature of Kp, which integrates magnetospheric responses across multiple longitudes, thereby amplifying stable periodic components such as solar-rotational and seasonal variations.
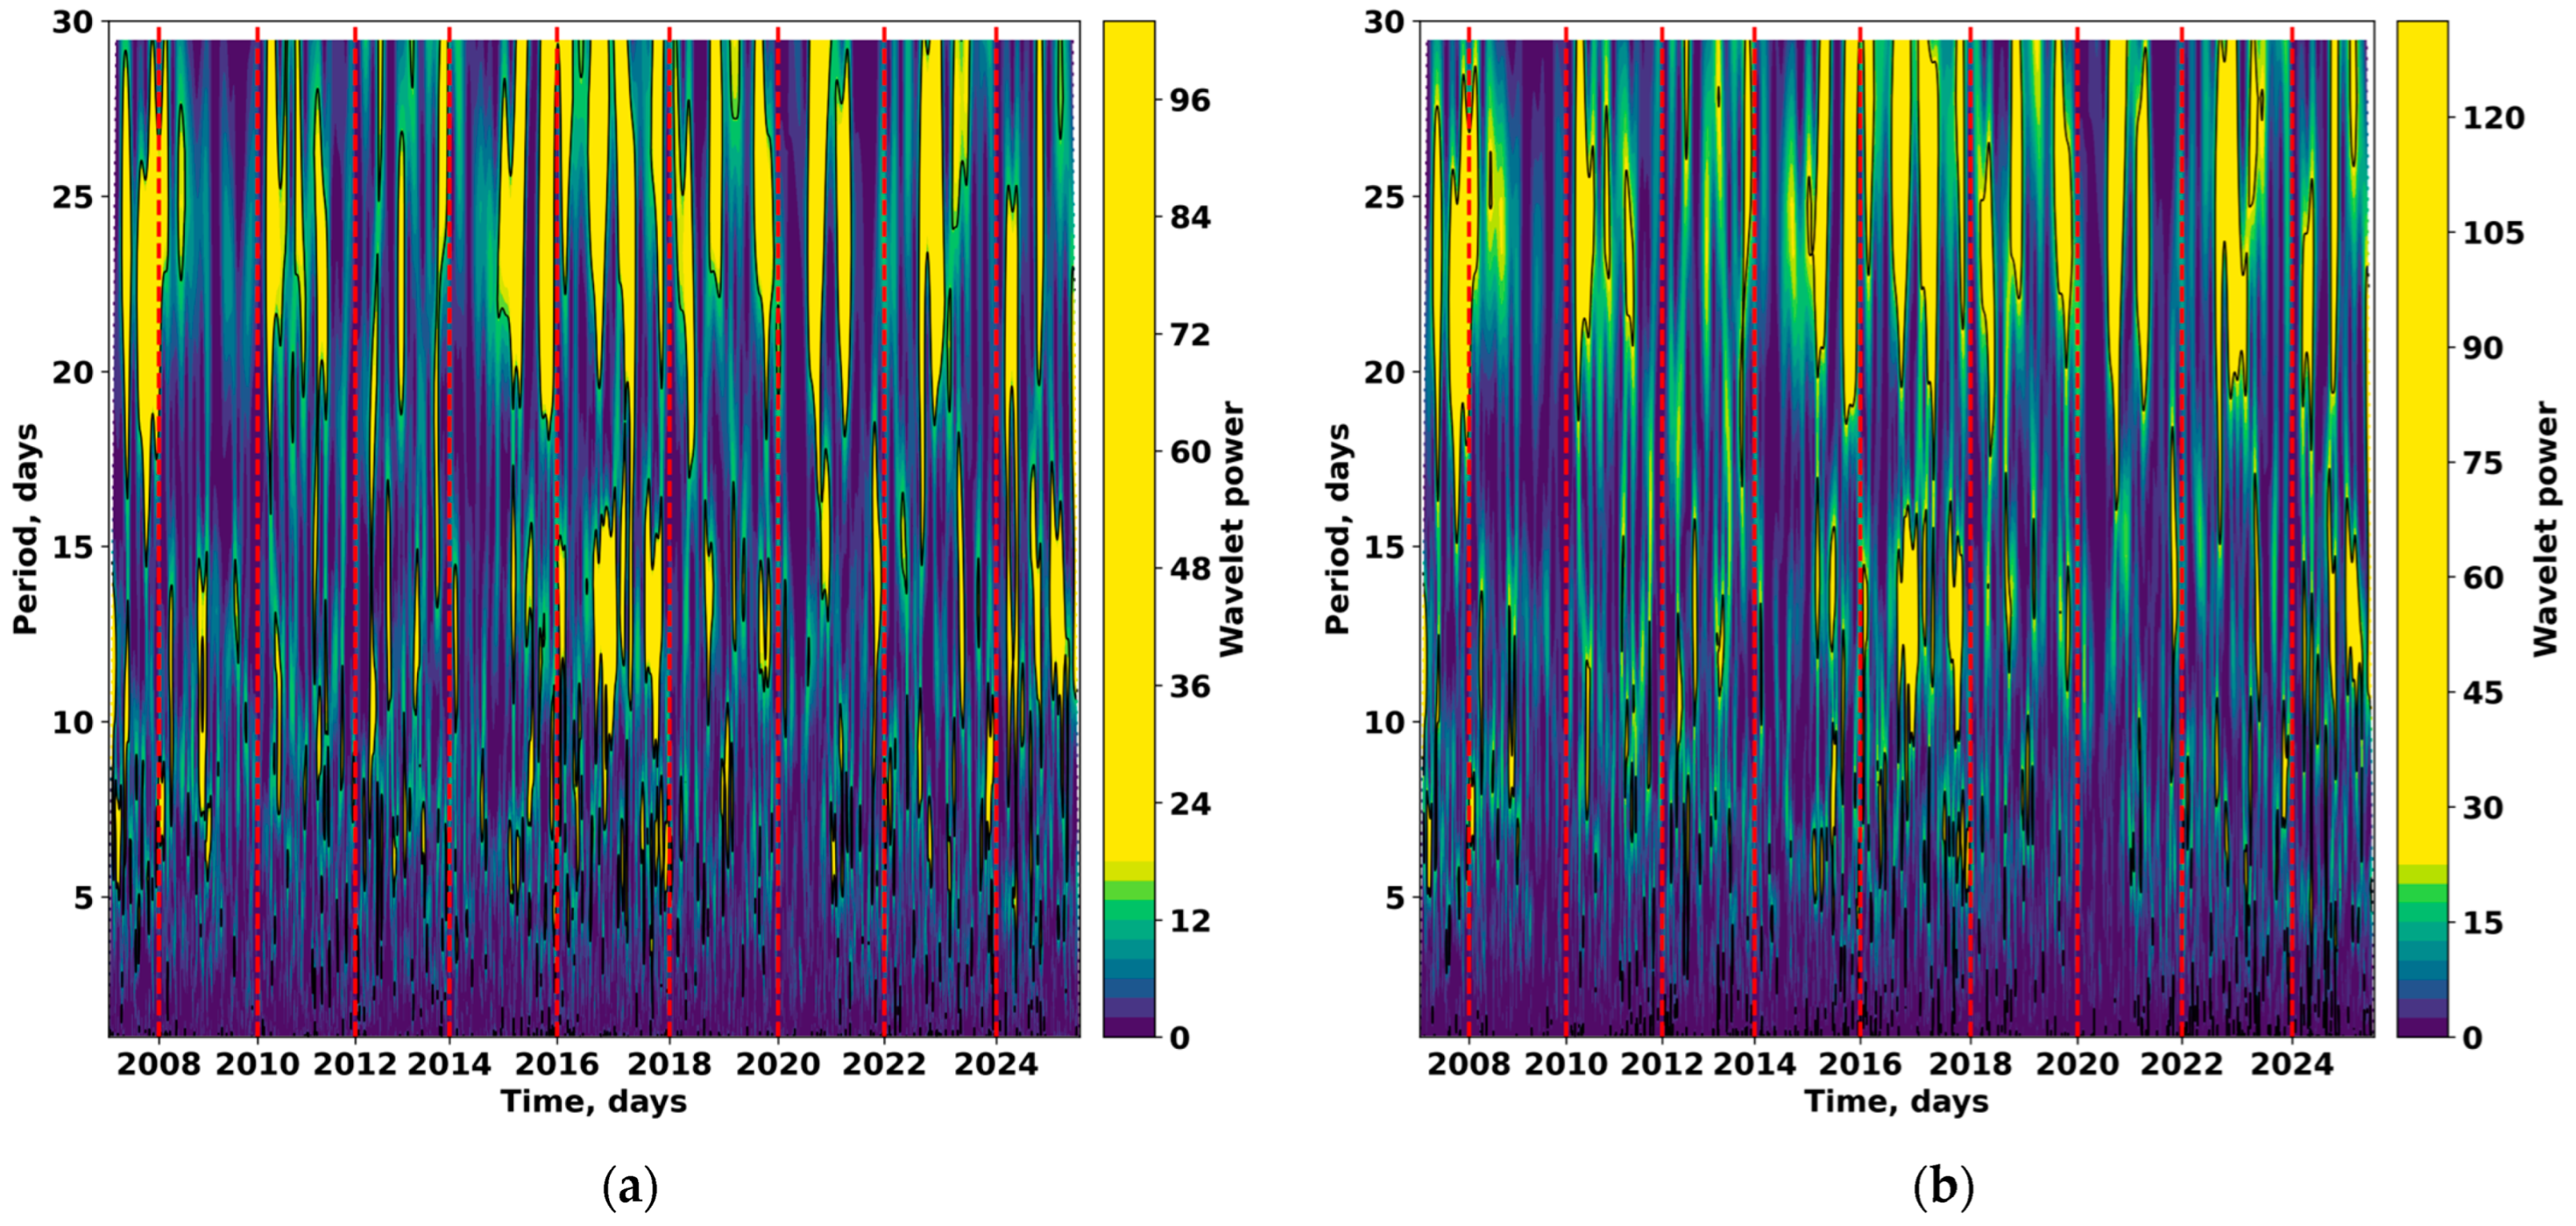
To analyze the temporal evolution of periodicities, a wavelet decomposition of the K (AAA) and Kp time series was performed using the complex Morlet wavelet.
Figure 9a,b show the wavelet scalograms of the local geomagnetic index K (AAA) and the global Kp index, obtained via the continuous wavelet transform (CWT) with a Morlet basis. The color scale represents the normalized wavelet power, which characterizes the relative energy of oscillations as a function of period (vertical axis) and time (horizontal axis).
Both indices exhibit a clearly defined multiscale temporal structure. The power maxima occur at periods between 5 and 30 days, corresponding to the characteristic timescales of magnetospheric disturbances associated with the solar rotation period and recurrent solar wind streams. However, the amplitude of energy contributions and the temporal stability of these components differ significantly between the local and global indices, reflecting differences in their sensitivity to regional versus planetary-scale processes.
In the scalogram of the local K (AAA) index, short-period components dominate-ranging from 3 to 20 days—appearing as alternating bands of enhanced power. These variations reflect the influence of local current systems and Sq-type ionospheric currents, which form under the combined effects of diurnal and seasonal changes in atmospheric conductivity.
Frequent energy bursts with periods around 27 days correspond to solar rotation, reflecting the recurrence of Earth’s interaction with long-lived solar wind structures. The enhancement of power in the 15–30 day range is especially pronounced during solar maximum years (2013–2015 and 2023–2025), indicating an intensified impact of solar disturbances on local geomagnetic processes.
The scalogram of the Kp reveals similar dominant periodicities (10–30 days), but its energy distribution is smoother and extends over a broader range of scales. This reflects the contribution of longitudinally and latitudinally averaged magnetospheric processes. Broad zones of enhanced power are particularly evident during solar-maximum intervals and major geomagnetic storms, indicating the integrated global response of the magnetosphere to solar forcing.
Broader zones of power enhancement at scales of approximately 20–40 days may be associated with seasonal variations in the orientation of the geomagnetic field and the Earth’s axial tilt (the Russell–McPherron effect), as well as with the influence of persistent high-speed solar wind streams recurring with sub-rotational periodicities.
Local power peaks in the K (AAA) index often precede similar enhancements in Kp, suggesting that local processes may act as a leading phase in the development of global geomagnetic activity. This observation is consistent with the multifractal analysis results, which showed that local variations exhibit a higher degree of nonequilibrium and intermittency. Hence, local data reveal a more complex structure of high-frequency variability, whereas the global index predominantly reflects long-term and stable modulations.
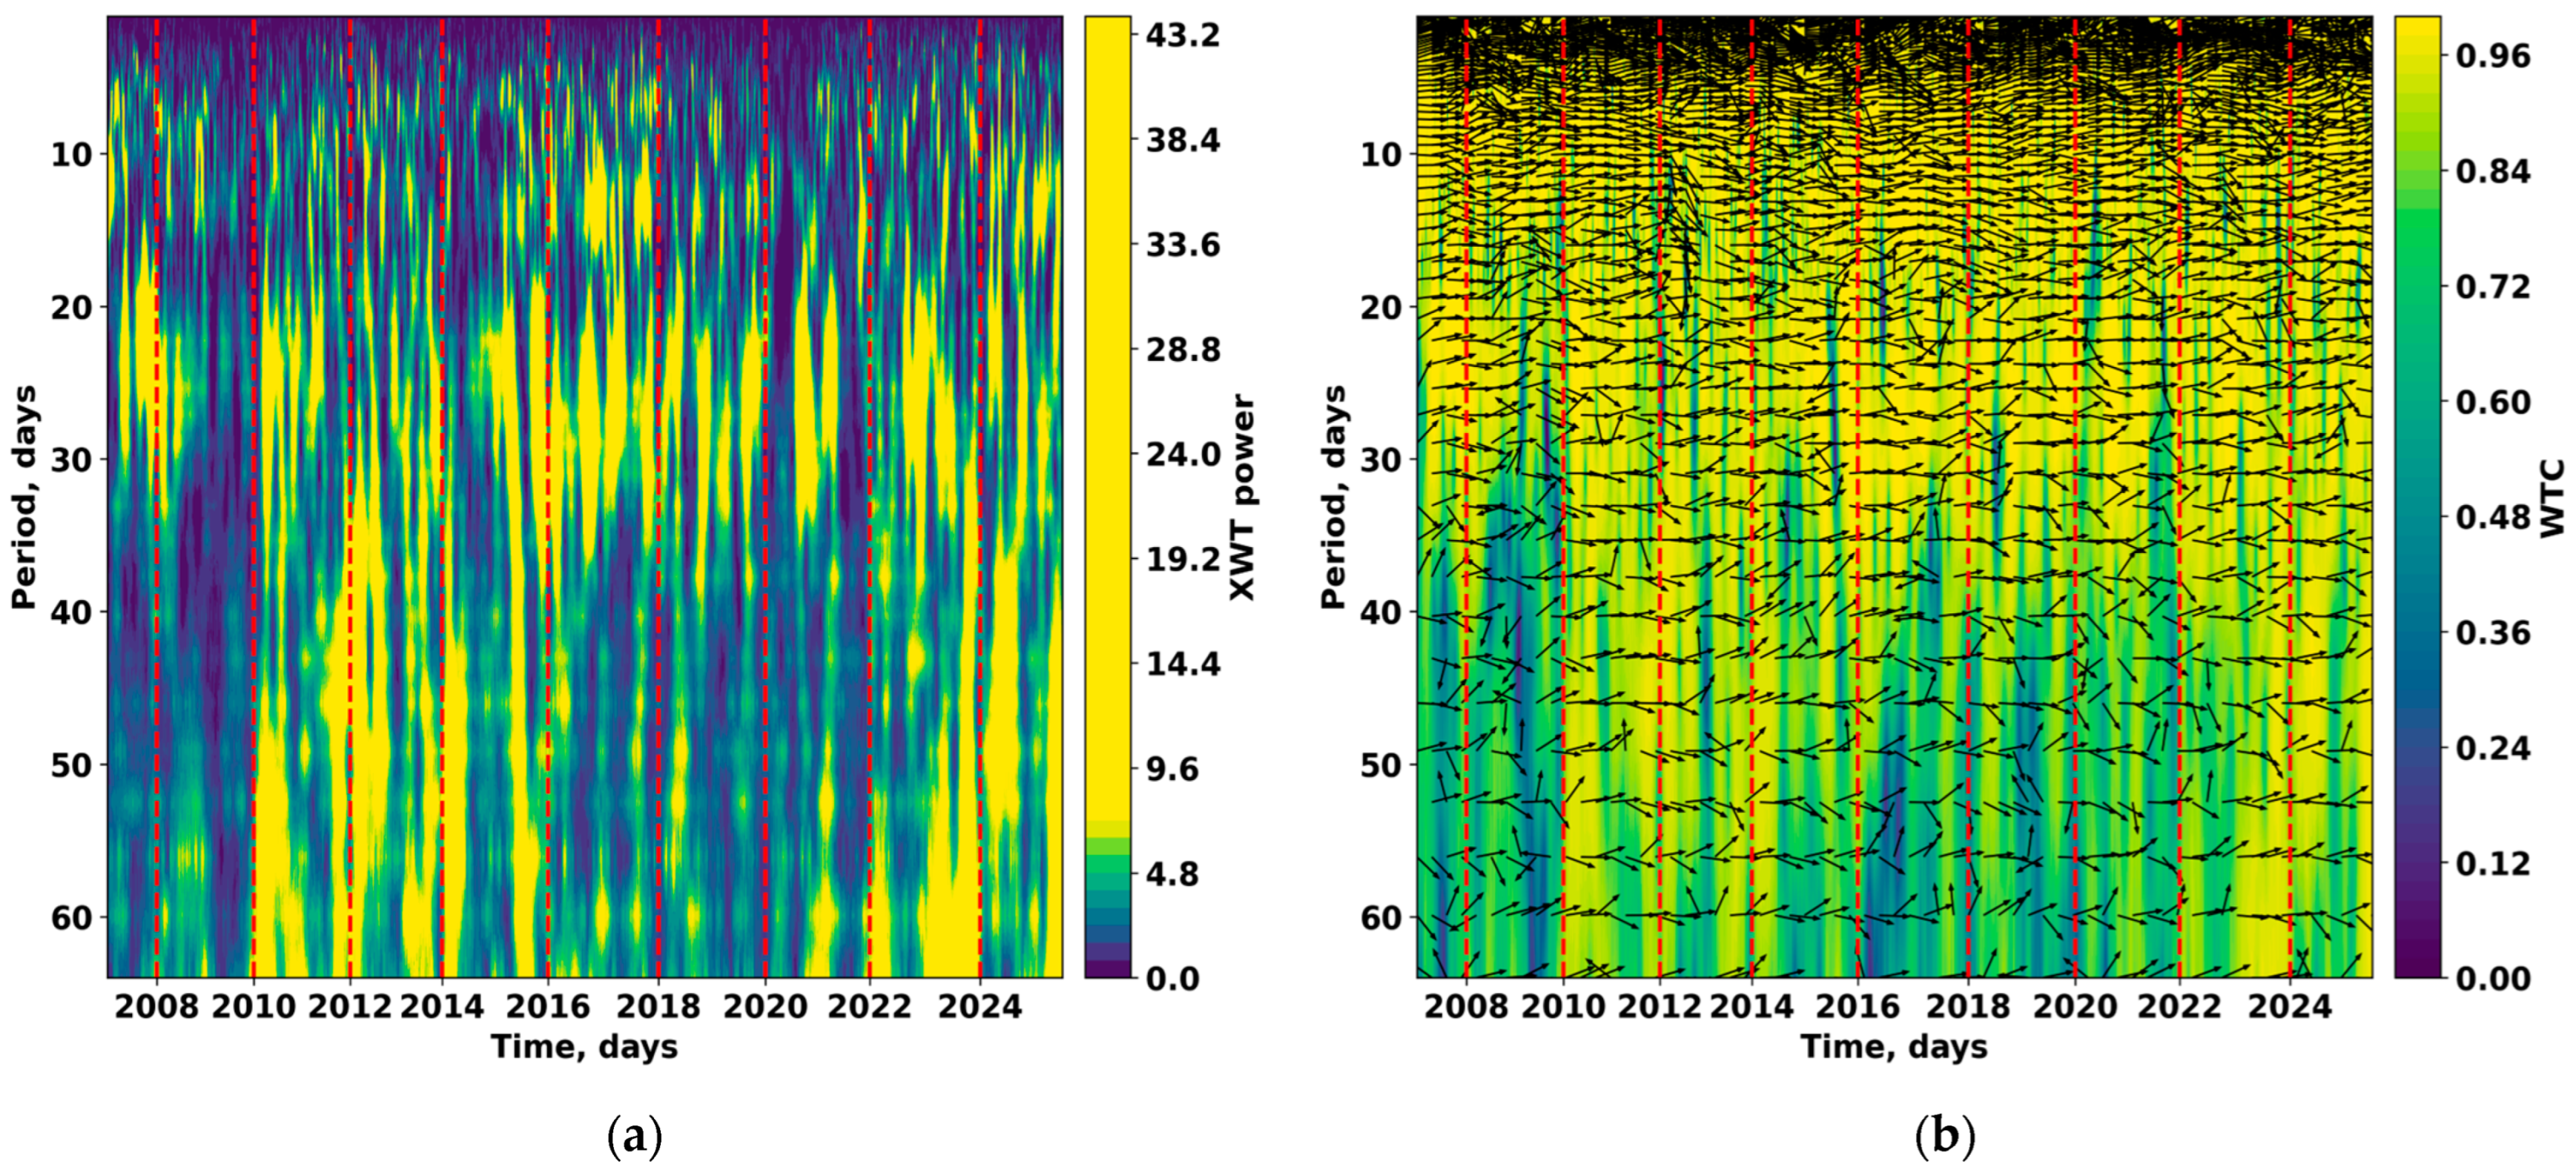
Figure 10a,b illustrate the time-dependent correspondence between the Almaty K (AAA) index and the aggregated global Kp index revealed through cross-wavelet and coherence analyses. The regions of enhanced power and coherence indicate stable in-phase dynamics within the 10–30 day period range, confirming a common solar modulation of both local and global magnetospheric processes.
The wavelet diagrams reveal that the correspondence between local and global magnetic field variations is distinctly multilevel and nonstationary. The most prominent zones of high cross-wavelet power are observed within the 10–30 day period range, corresponding to the characteristic timescales of solar-rotational disturbances. These regions indicate persistent simultaneous amplification of oscillations in both indices, driven by the influence of long-lived high-speed solar wind streams originating from coronal holes, which periodically interact with Earth’s magnetosphere as the Sun rotates.
During periods of enhanced solar activity (2013–2015 and 2023–2025), an increase in cross-wavelet power amplitude is evident, reflecting the globalized response of the magnetosphere, in which local and planetary-scale processes become phase-synchronized and mutually reinforced.
The combined results of the cross-wavelet (XWT) and wavelet coherence (WTC) analyses confirm the presence of a stable, scale-dependent comparison of local K (AAA) and aggregated global Kp geomagnetic activity indices. At the same time, a pronounced asymmetry across temporal scales is observed, reflecting the hierarchical organization of coupled processes within the Sun–magnetosphere–ionosphere system.
However, even under conditions of high coherence, certain intervals persist in which local variations exhibit autonomous behavior and temporal inhomogeneity of energy distribution. To achieve a deeper understanding of these discrepancies and to quantitatively assess the degree of nonequilibrium in the signals, it is necessary to analyze their internal structure using methods of nonlinear dynamics.
3.3. Multifractal and Entropy-Based Analysis
The following subsection presents the results of a multifractal analysis of the K (AAA) and Kp indices, which provides insights into the complexity of their time series and reveals differences in their scaling behavior and entropy-based characteristics.
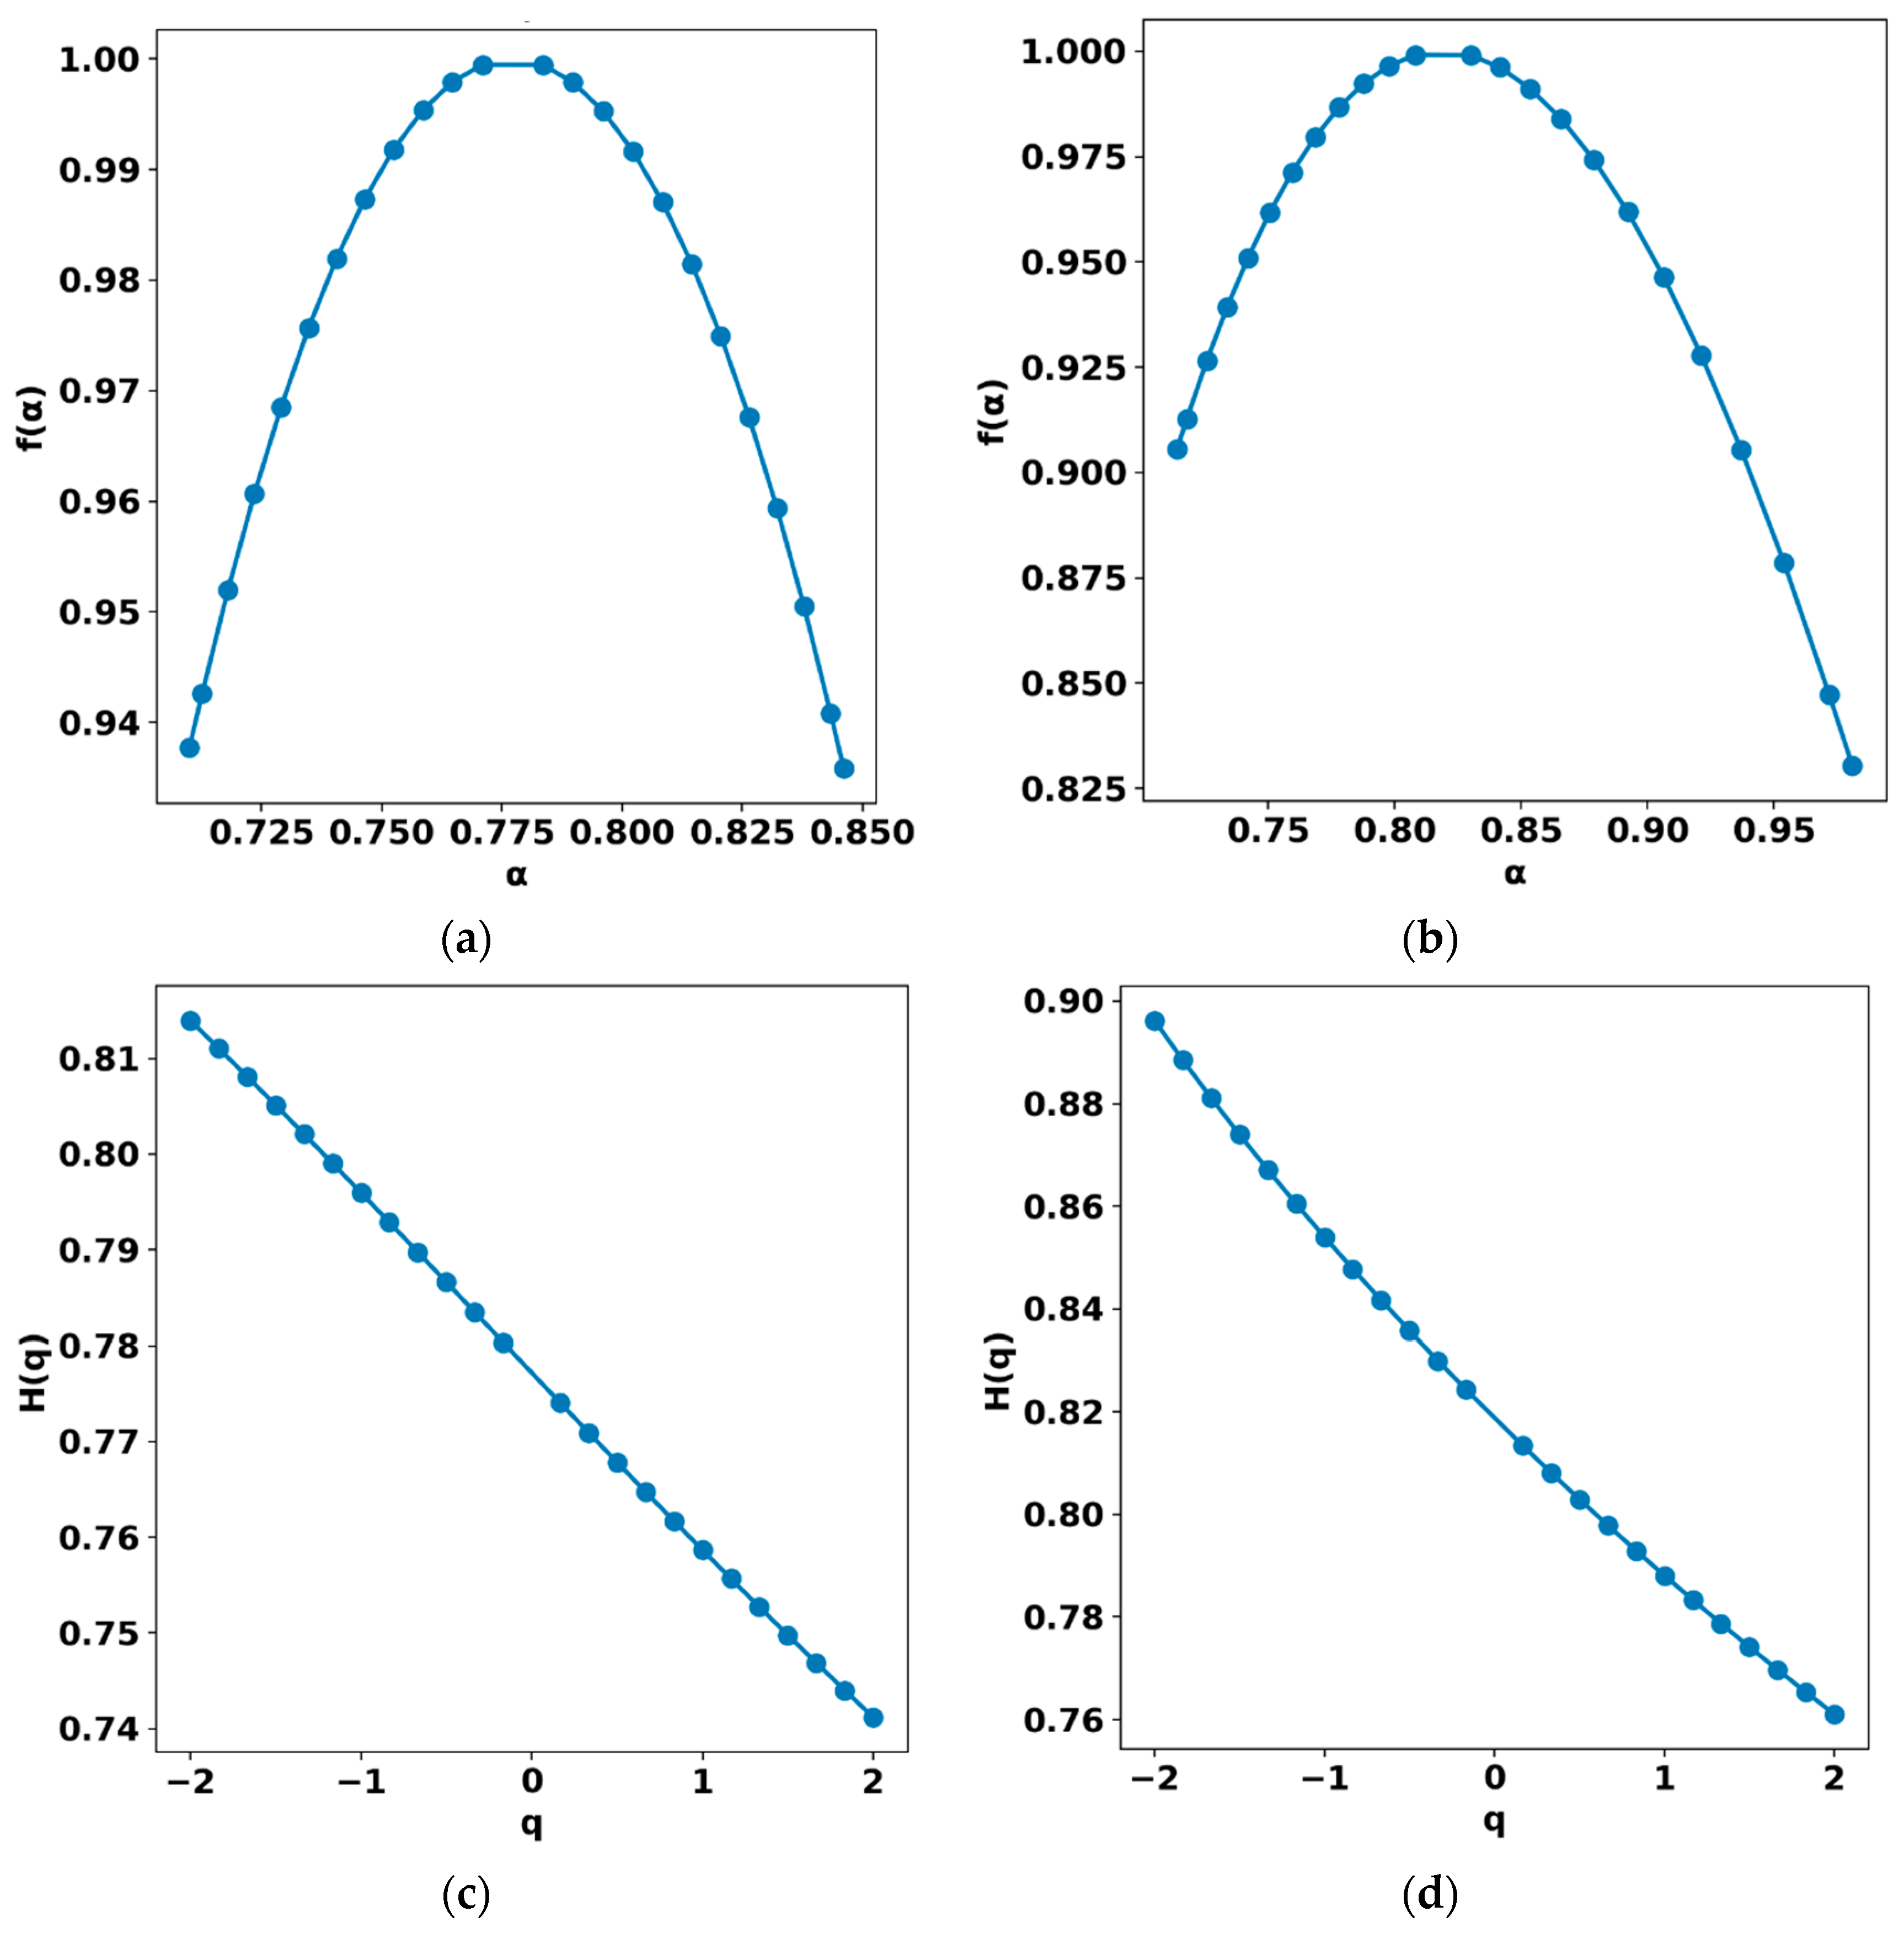
The multifractal analysis of the local geomagnetic activity index K (AAA) and the global index Kp revealed a complex structure of scale variability inherent to geomagnetic processes. The dependences h (q) for both series show a distinct decrease with increasing moment order q, confirming the presence of multifractality and the differences in temporal correlations between weak and strong fluctuations.
For the local K (AAA) index, the Hurst exponent range h (q) is approximately 0.74–0.81, whereas for Kp it spans 0.76–0.90, indicating a broader and more stable scale hierarchy in the global index, which reflects the integrated dynamics of magnetospheric processes.
Table 1 presents a summary of the estimated multifractal spectrum parameters, providing a comparative overview of the scaling characteristics and complexity measures for both indices.
Figure 11 presents the results of the multifractal analysis of the local geomagnetic index K (AAA) and the global Kp index, performed using the MFDFA method. The plots of the Hurst function h (q) (panels c, d) and the multifractal spectra f (α) (panels a, b) provide a quantitative description of the scale inhomogeneity of fluctuations and highlight the differences in the variability structure of local and global processes.
The h (q) functions for both indices show a clear dependence on the moment order q, confirming the presence of multifractality and the nonuniform distribution of fluctuation intensities. However, the slope of the h (q) dependence for the local K (AAA) index is steeper and more linear compared with that of Kp, indicating a narrower range of scaling exponents and thus a lower degree of variability in magnetic-field perturbation amplitudes. In contrast, the h (q) curve for Kp exhibits a concave shape, characteristic of enhanced nonlinearity and greater sensitivity to extreme disturbances, which are averaged out when forming the global index.
The corresponding f (α) spectra support these findings. For the local K (AAA) index, the spectrum peaks near α0≈ 1.0 and is nearly symmetric, typical of quasi-stationary processes with moderate intermittency. The Kp spectrum, however, is broader (Δα ≈ 0.20–0.25) and asymmetric toward larger α, indicating the presence of processes with stronger variability and a higher degree of nonequilibrium. This behavior is physically consistent with the nature of the Kp index, which aggregates contributions from observatories located across different latitudinal zones, each influenced by distinct magnetospheric and ionospheric current systems.
The analysis of the temporal evolution of multifractal characteristics made it possible to trace their dynamics over the 2007–2025 period.
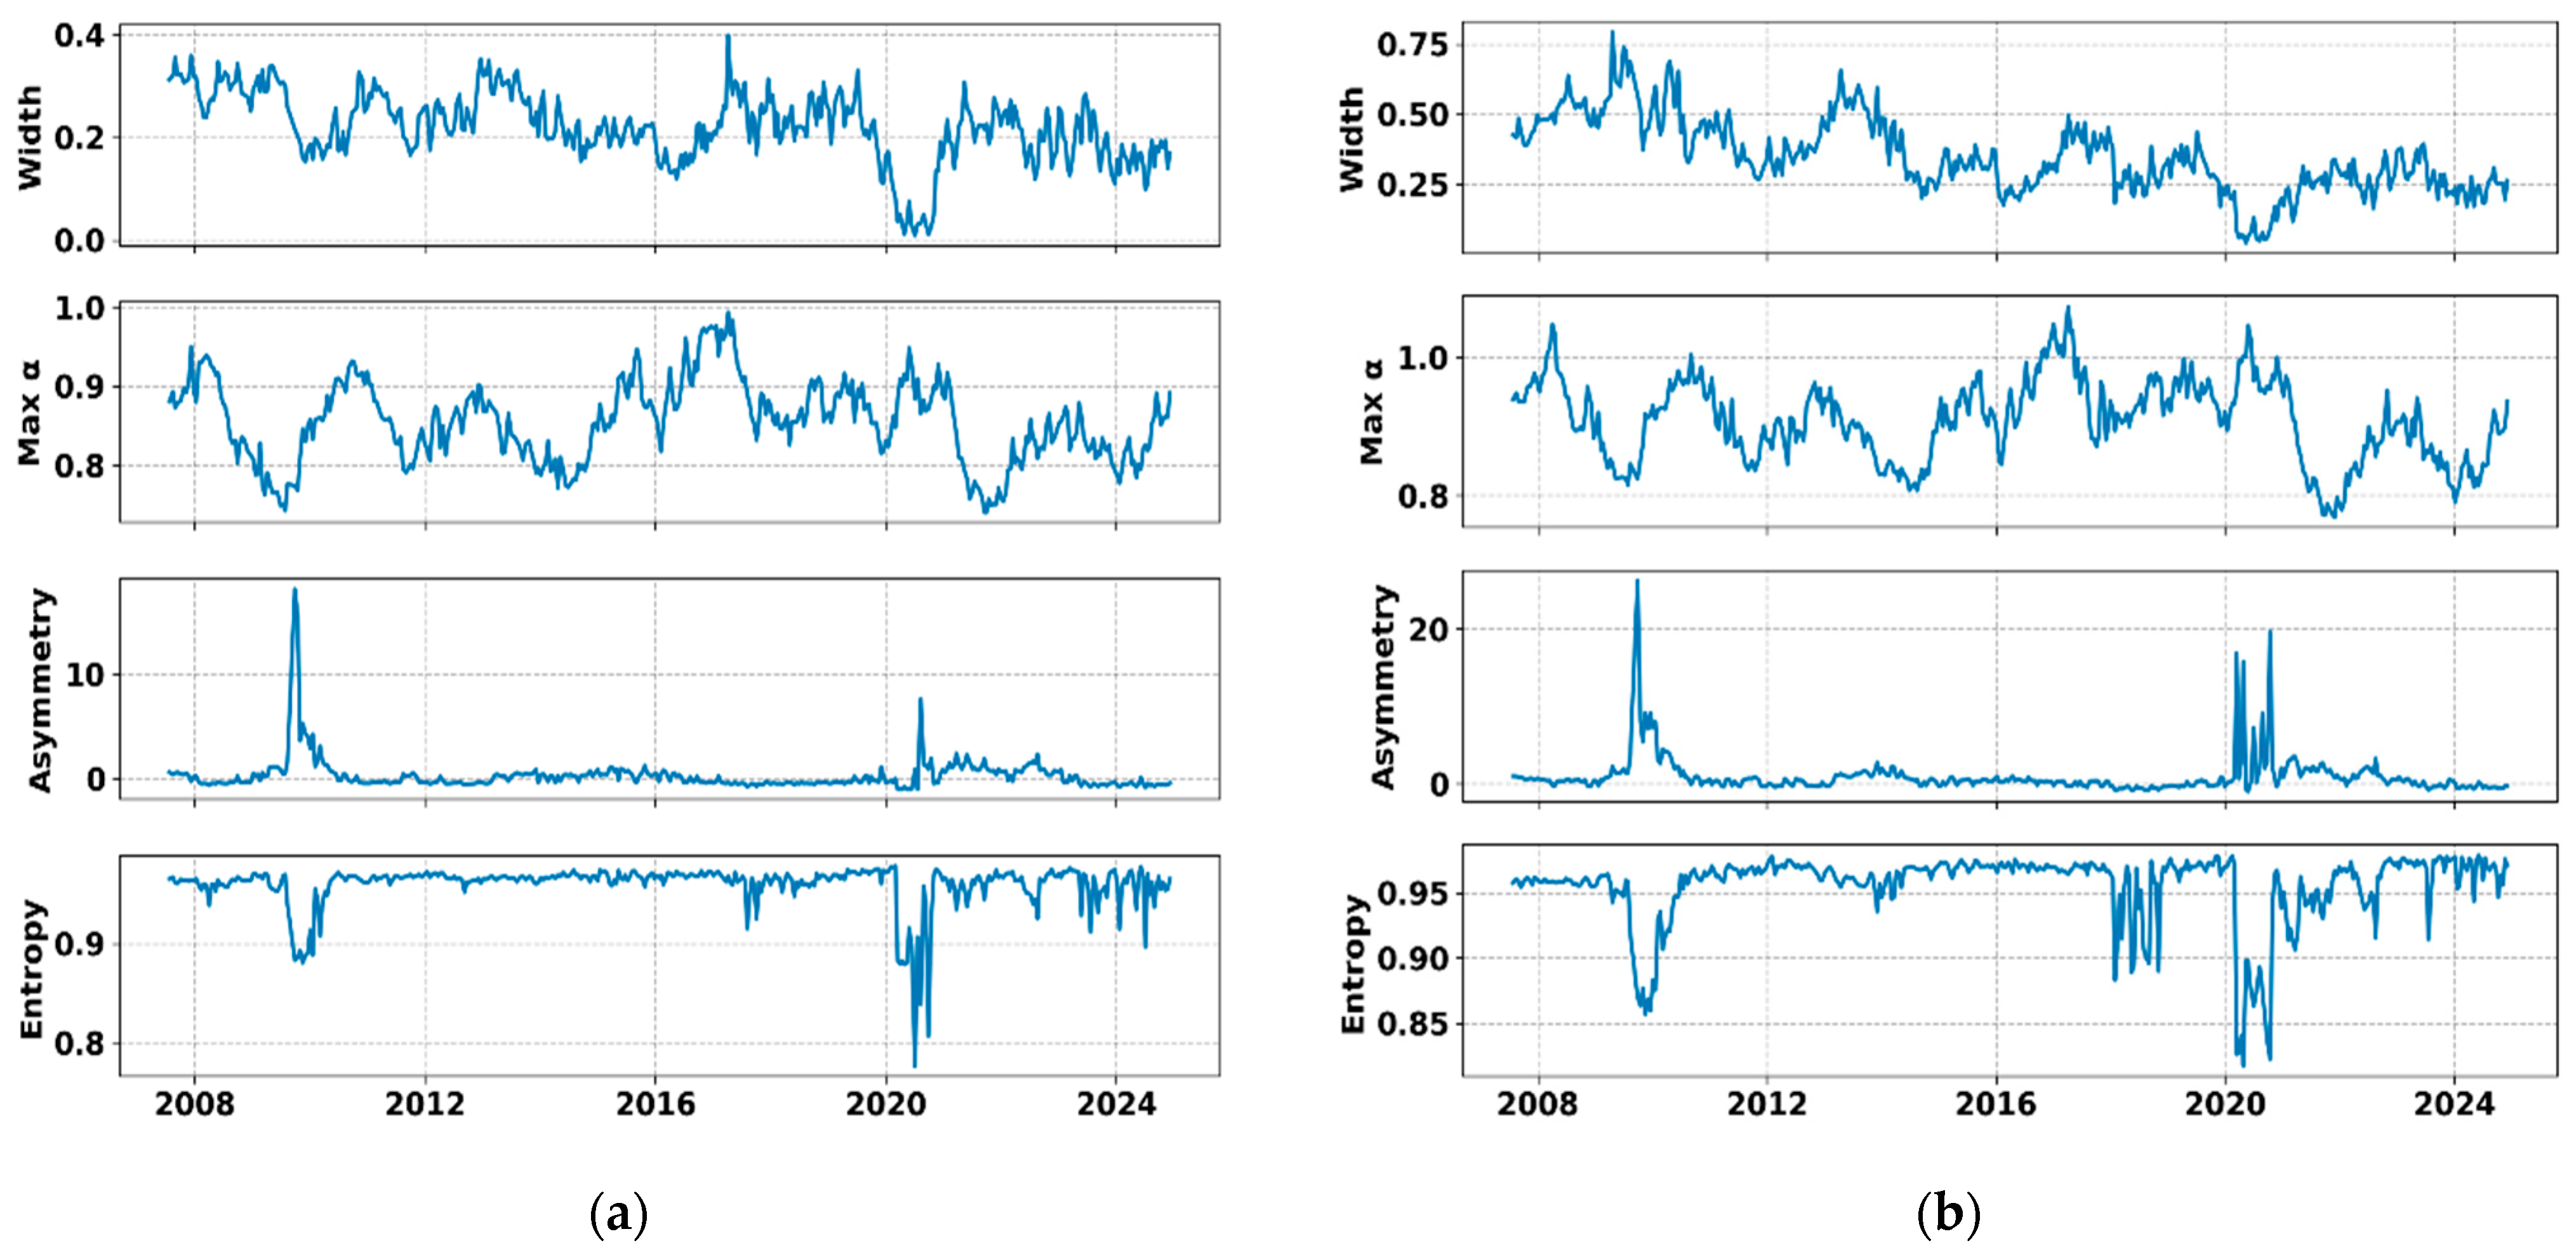
Figure 12 shows the time variations in the main parameters of the multifractal spectrum—including its width (Δα), peak position (α
0), asymmetry, and entropy—calculated within a sliding window for both the local K (AAA) and global Kp indices. These parameters provide insight into the evolution of complexity and scale heterogeneity of geomagnetic activity over the past two solar cycles.
The time series analysis reveals that the spectrum width (Δα) exhibits quasi-periodic oscillations that correlate well with the phases of solar activity. For the local K (AAA) index, the range of Δα values does not exceed 0.4, indicating a relatively stable multifractal structure and a moderate degree of intermittency. In contrast, the global Kp index shows a broader spectrum width, reaching 0.7, which reflects a more pronounced multifractality associated with the integration of disturbances originating from different geomagnetic latitudes and current systems.
The parameter α
0, which characterizes the dominant type of fluctuations, varies in phase with the solar cycle, decreasing during solar maxima (2013–2015 and 2023–2025). This behavior indicates that during solar-maximum years the time series become rougher, corresponding to intensified coupling between the solar wind and the magnetosphere [
29]. The time series of the α
0 parameter demonstrates a pronounced minimum around 2010, which coincides with the deep solar minimum between Solar Cycles 23 and 24. During this period, the geomagnetic field exhibited reduced variability and lower intermittency, leading to a narrower multifractal spectrum and a smaller α
0 value. In contrast, toward the end of the analyzed interval (2024–2025), α
0 increases, reflecting the rise in Solar Cycle 25 and the associated intensification of geomagnetic fluctuations and solar-wind coupling. This evolution indicates that the temporal dynamics of α
0 are closely modulated by the solar activity cycle.
The asymmetry of the spectrum tends to increase during geomagnetically quiet periods (e.g., around 2009, 2020), when small-scale fluctuations dominate and the system exhibits a right-skewed multifractal structure. During strong geomagnetic activity (2015 and 2024), the spectrum becomes more symmetric, as both large- and small-scale components intensify simultaneously, reflecting a more balanced but highly dynamic nonequilibrium state. This behavior indicates that, when the system is weakly driven by external forcing (e.g., during solar minima), the multifractal spectrum becomes more right-skewed due to the dominance of small-scale, low-intensity fluctuations. In contrast, during periods of strong geomagnetic activity, large- and small-scale components intensify simultaneously, producing a more symmetric spectrum. Thus, asymmetry appears to be inversely related to the overall level of geomagnetic disturbance and reflects the redistribution of energy between scales.
The spectral entropy (Sf), which characterizes the degree of statistical organization within the multifractal structure, decreases during solar and geomagnetic minima (e.g., 2009, around 2018–2020), reflecting a more ordered and stationary magnetospheric state. From 2020 to 2024, Sf gradually increases in parallel with the rise in Solar Cycle 25, indicating enhanced multiscale interaction and growing dynamical complexity. This trend suggests that Sf primarily traces the long-term restructuring of magnetospheric dynamics modulated by solar activity, rather than individual storm events. The local index K (AAA) demonstrates stronger short-term fluctuations in Sf, reflecting regional ionospheric processes, while the global Kp index shows a smoother, cycle-dependent evolution consistent with large-scale magnetospheric coupling
A comparison of the two indices reveals that the local K (AAA) index primarily responds to regional fluctuations of ionospheric current systems, whereas the global Kp index captures system-wide magnetospheric reorganizations characterized by a stronger scale hierarchy. Nevertheless, the high correlation between the temporal evolution of α0 and entropy in both indices indicates a common physical origin of the processes governing the fractal structure of geomagnetic activity.
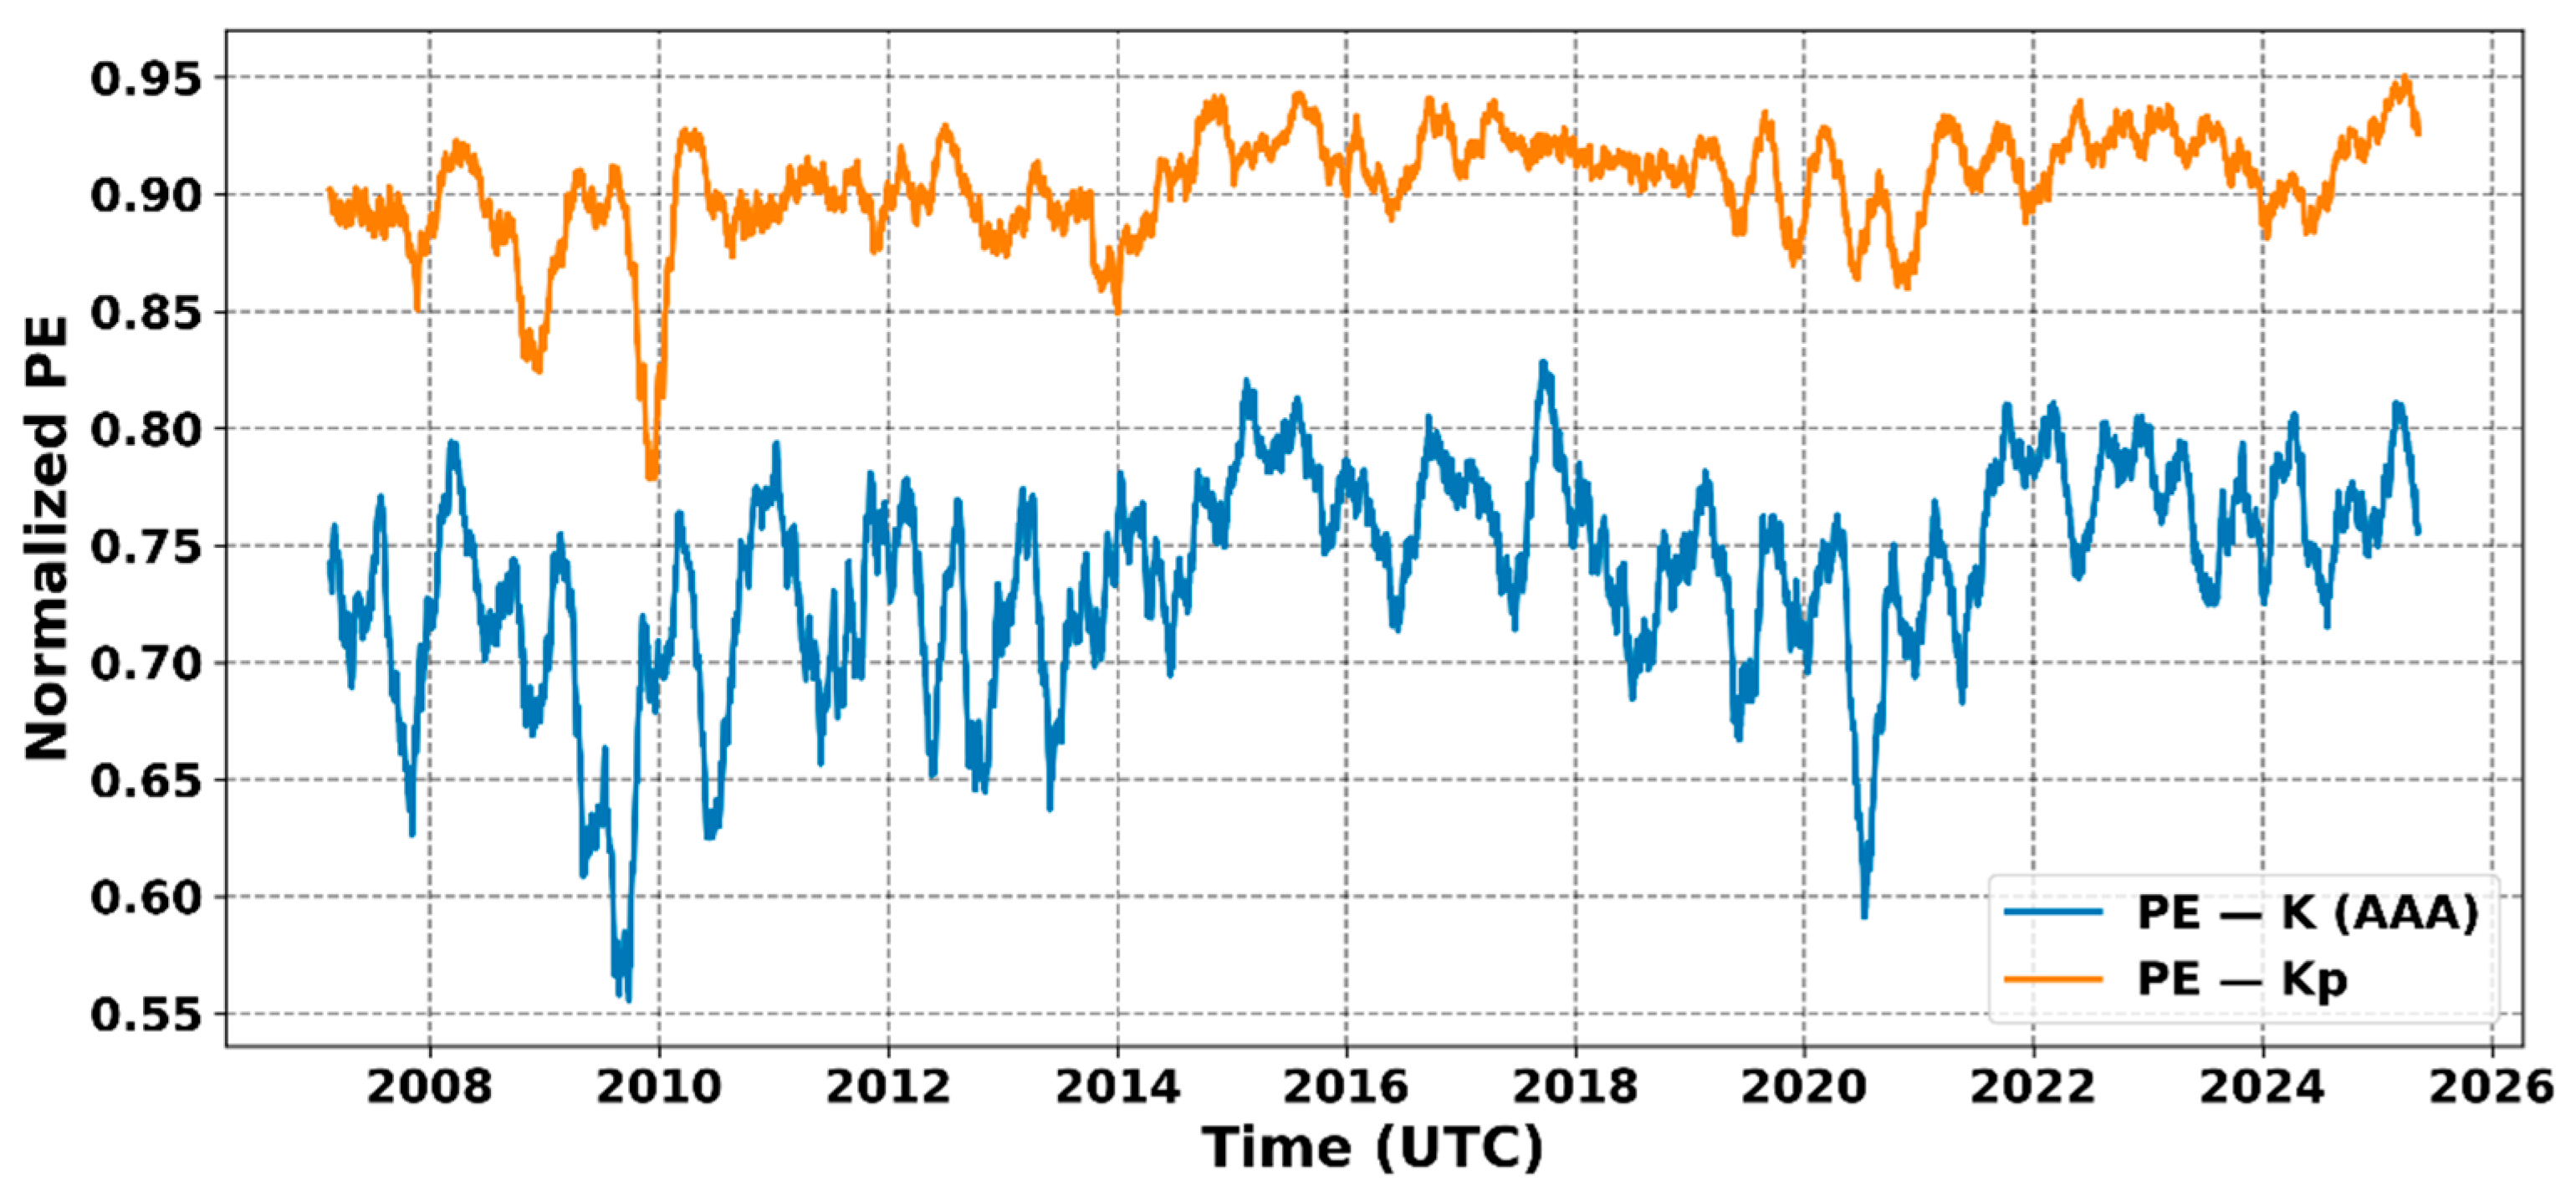
To assess the degree of chaoticity and stochasticity of geomagnetic variations, a permutation entropy (PE) analysis was performed for the local K (AAA) and global Kp indices using a sliding window of 90 days (
Figure 13). The results reveal a distinct cyclic pattern of PE variations that correlates with the 11-year solar cycle: during periods of low solar activity, entropy values are lower, indicating greater regularity and predictability of geomagnetic fluctuations. In contrast, during solar maxima (2013–2015, and 2023–2025), entropy increases, reflecting the enhanced chaotic behavior of the magnetospheric response [
30].
Throughout the entire observation period, the global Kp index exhibits systematically higher PE values, which points to its greater statistical heterogeneity and the spatially integrated nature of global magnetospheric dynamics. The local K (AAA) index, on the other hand, shows more pronounced PE oscillations, indicating the high sensitivity of the single observatory to local geomagnetic effects—including ionospheric currents, conductivity variations, and regional electrojet dynamics.
Notably, sharp decreases in PE (K) occur during geomagnetically quiet periods such as 2009 and 2020, corresponding to the minima between Solar Cycles 23–24 and 24–25. These declines indicate a transition of the system into a more ordered and quasi-deterministic state, where reduced solar forcing leads to lower variability and stronger internal coherence of the geomagnetic field.
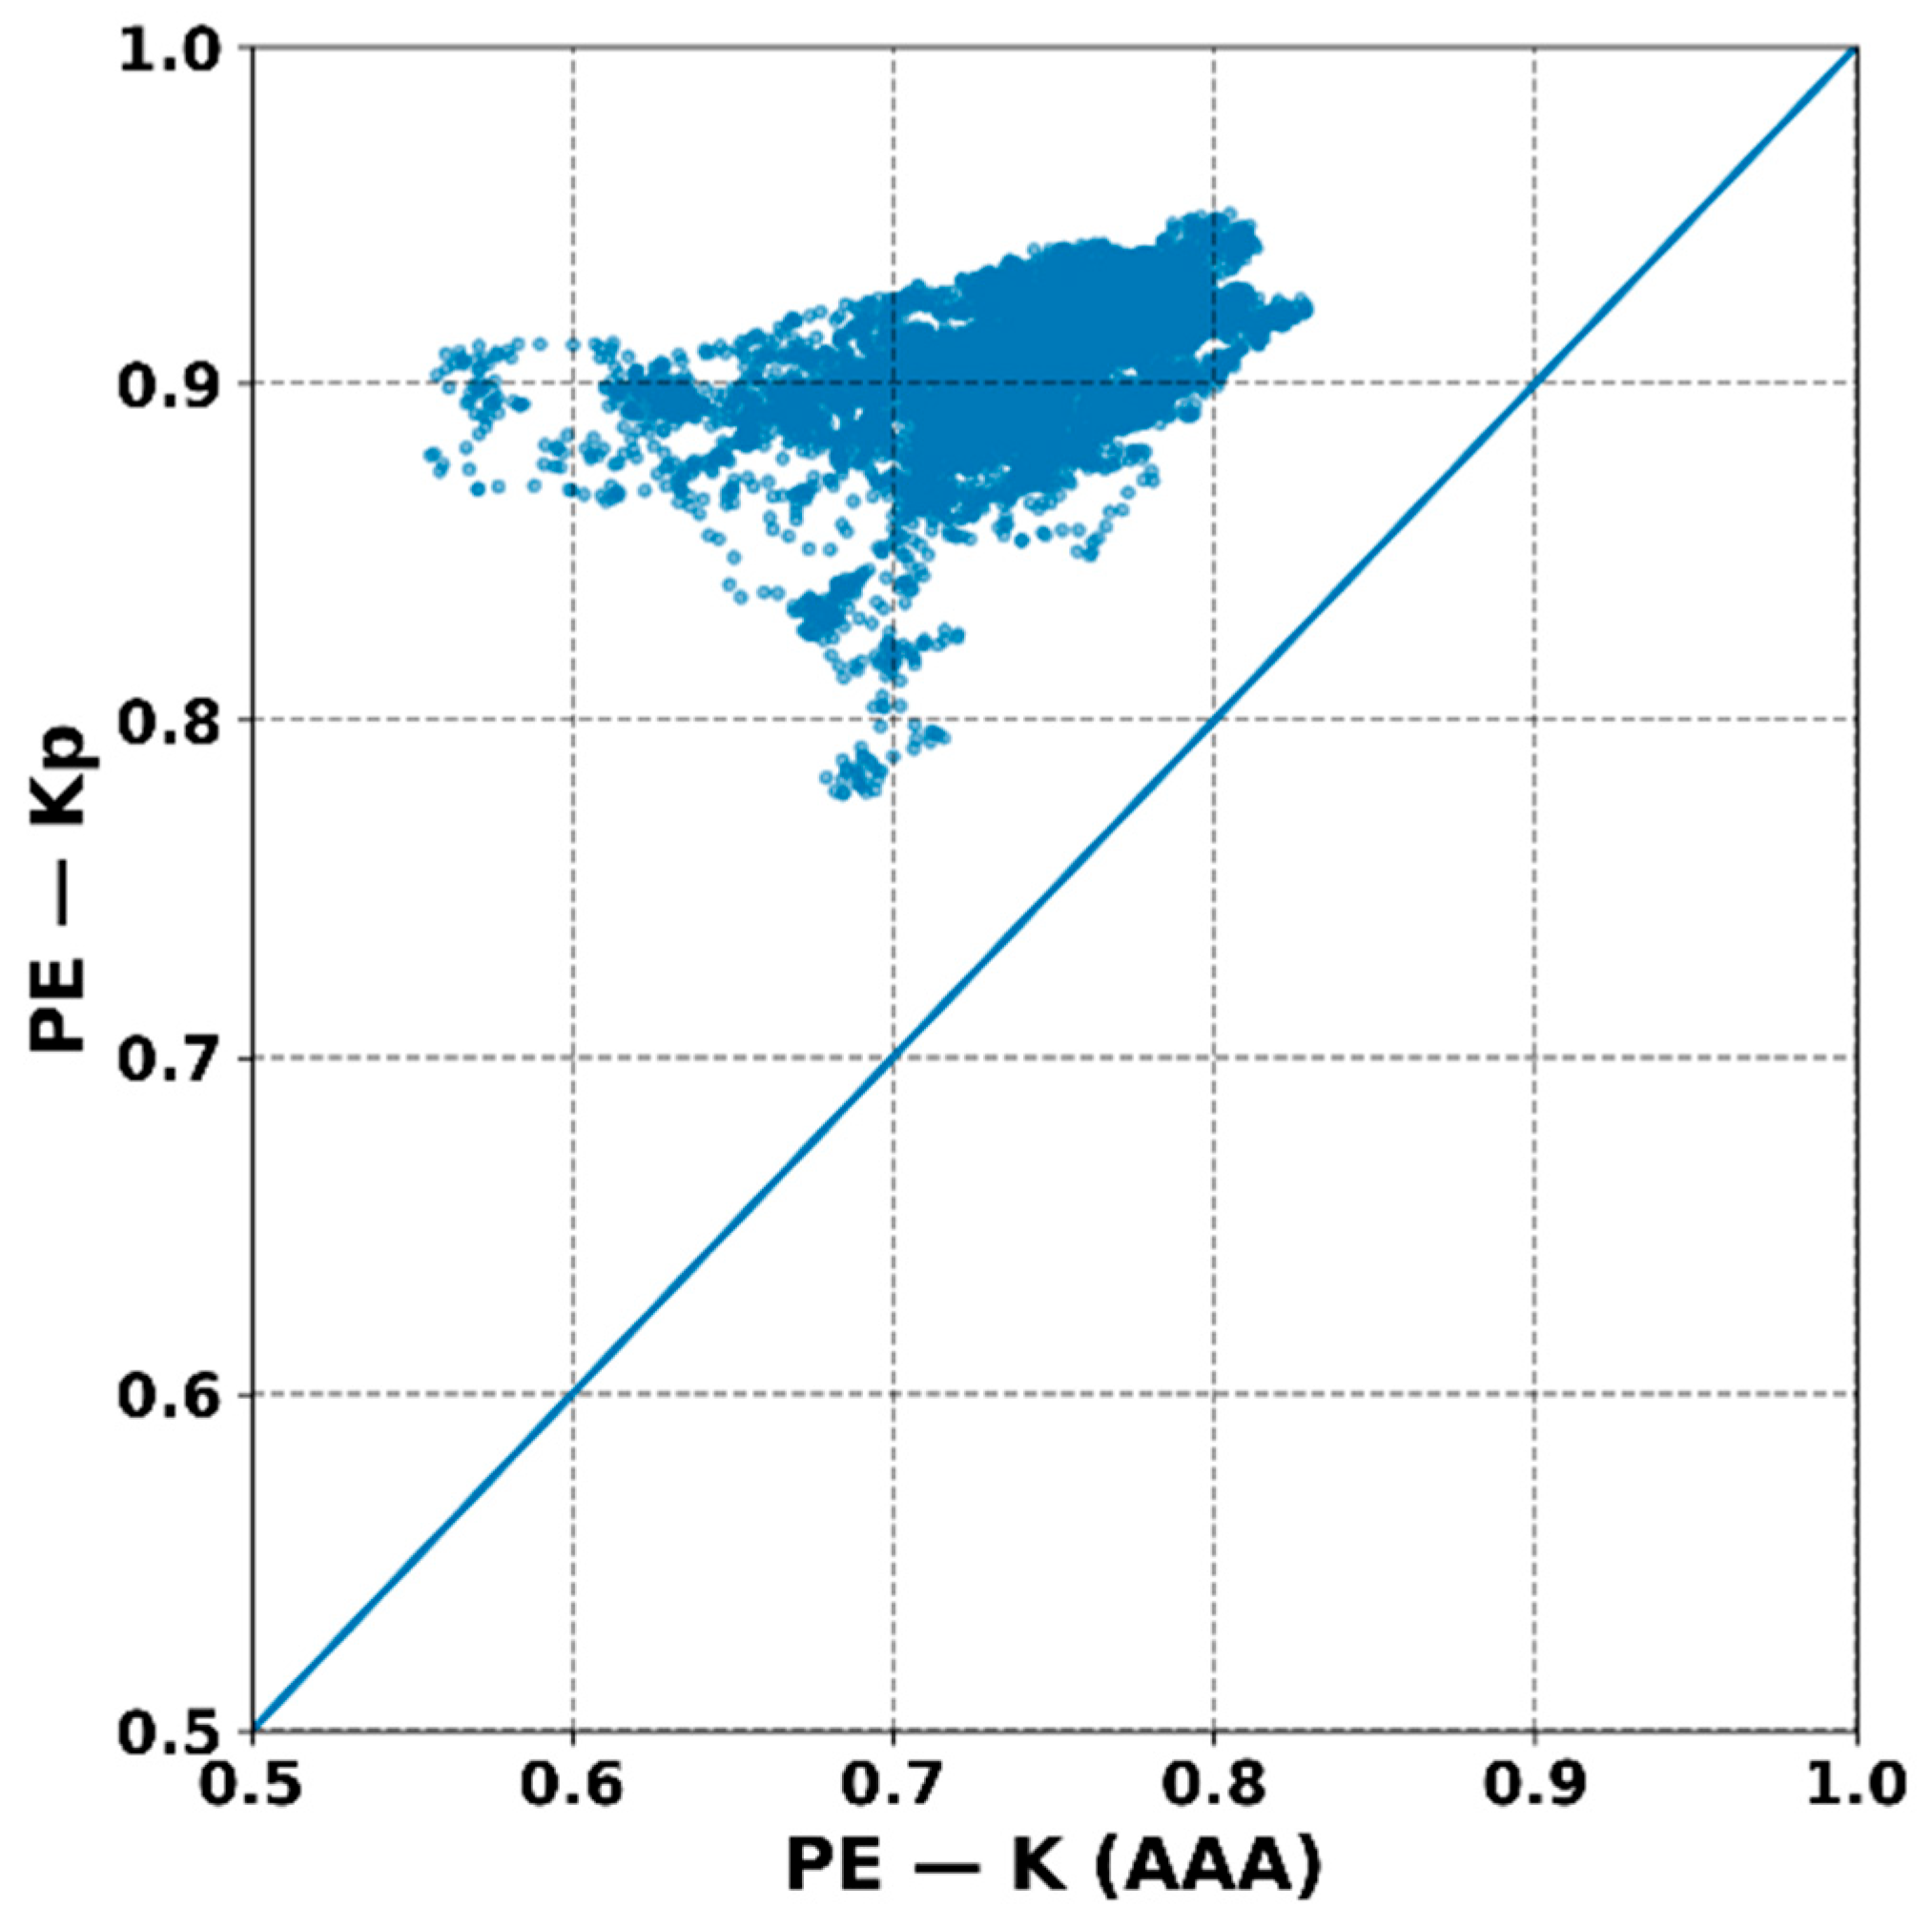
The scatter plot of PE (K) versus PE (Kp) (
Figure 14) demonstrates a generally consistent correspondence between the local and global entropy values; however, the data points are distributed asymmetrically relative to the 1:1 line, clustering predominantly above it. This indicates that the global index generally exhibits a higher degree of chaoticity compared with the local one. Such behavior aligns with the understanding that the integrated Kp indicator averages over numerous regional processes, including out-of-phase responses from different geomagnetic latitudes.
The obtained results complement the findings of the multifractal analysis, confirming that geomagnetic activity possesses pronounced structural variability, evident both in its temporal organization and in the stochastic properties of the signals.
A comparative analysis shows that both the local and global indices contain a common set of fundamental periodicities associated with solar-rotational modulations. At the same time, the local K (AAA) index demonstrates greater sensitivity to high-frequency and regional processes, whereas the Kp index represents an averaged global picture of geomagnetic activity, integrating the combined response of multiple magnetospheric regions.
Thus, the combined use of both indices makes it possible not only to identify the global patterns of magnetospheric dynamics, but also to trace the regional features that may play an important role in the study of ionospheric disturbances and their impact on technological systems.
