1. Introduction
Clouds are a crucial component of the Earth’s radiation budget, covering over 60% of the globe and exerting a significant influence on climate change [
1]. Macro- and microphysical cloud parameters are key to modeling changes in Earth’s radiative energy. The Intergovernmental Panel on Climate Change (IPCC) has highlighted that the radiative effects of clouds and aerosols remain the largest source of uncertainty in climate change research [
2]. Accurate cloud parameters are essential for the analysis and early warning of extreme weather events such as typhoons and thunderstorms [
3]. CTH, as a key parameter characterizing cloud physical properties, directly impacts fields such as climate modeling, weather forecasting, and aviation safety. In recent years, with the rapid advancement of geostationary meteorological satellite technology, CTH retrieval methods have gradually shifted from reliance on single sensors towards multi-source data synergy and intelligent analysis. However, technical bottlenecks persist in complex cloud scenarios. China’s new-generation Fengyun-4A (FY-4A) satellite, with its high-frequency observations (every 15 min) and multi-spectral detection capabilities (visible, infrared, and lightning imaging), provides a unique data foundation for high-precision CTH retrieval.
Traditional CTH retrieval primarily relies on infrared radiative transfer models, estimating height by matching CTT with atmospheric temperature profiles. These methods perform well in single-layer cumulus scenarios, with errors typically controlled within 1 km [
4,
5]. However, they exhibit insufficient sensitivity to thin cirrus clouds (optical thickness < 1), resulting in errors exceeding 2 km [
6,
7]. To enhance spatial resolution, stereo imaging techniques improve accuracy through parallax calculations from multiple satellites. Huang et al. [
8] achieved cross-longitude stereoscopic observation using FY-4A and FY-4B visible bands (0.65 μm), yielding a retrieval accuracy of 0.20–0.88 km and a correlation coefficient of 0.80 with CALIPSO data. Fernández-Morán et al. [
9] optimized multi-layer cloud detection using stereo matching from the Sentinel-3 OLCI/SLSTR dual sensors instruments (European Space Agency, ESA, Europe, Paris, France), although this approach requires precise cloud motion correction and geometric registration [
10].
Active remote sensing technologies (e.g., lidar and cloud radar) provide high-precision validation benchmarks for CTH retrieval through vertical profile detection. Li et al. [
11] combined FY-4A spectral data with ground-based millimeter-wave cloud radar, proposing a ResGA-Net model integrating residual networks and genetic algorithms, reducing RMSE by 37.89%. Cheng et al. [
12] constructed a neural network model based on CALIOP data combined with MODIS multi-channel inputs, achieving a 27.3% error reduction compared to MODIS CTH products. However, active sensors are limited by spatial-temporal coverage and precipitation attenuation, making it difficult to meet operational demands [
13,
14]. Consequently, multi-source data fusion has become a recent research focus. For instance, Dong et al. [
15] combined Himawari-8 near-infrared data with geospatial parameters to build an XGBoost model, systematically correcting systematic biases in the Japan Meteorological Agency (JMA) products for multi-layer ice cloud scenarios. Naud et al. [
16] discovered systematic biases in CTH retrievals from MODIS and SEVIRI passive sensors by fusing MODIS, MISR, and CloudSat data: low clouds were overestimated by approximately 300–400 m, while high thin clouds were underestimated, with the underestimation increasing significantly as optical thickness decreased (especially for thin clouds or scenes with underlying low clouds).
Over the past decade, machine learning methods have emerged as novel techniques applicable to CTH retrieval. Loyola utilized neural networks to retrieve CTH and cloud top albedo [
17]. Given the higher uncertainty of passive cloud parameters, active remote sensing data are often used as training reference truth for neural network models to correct passive cloud parameters or establish new retrieval models. Kox et al. developed an Artificial Neural Network (ANN) algorithm using SEVIRI observation data and CALIOP products to retrieve cirrus CTH and cloud optical thickness [
18]. Håkansson et al. [
19] used a Backpropagation (BP) neural network to retrieve CTH and CTP, comparing results with MODIS products. Meng Heng et al. [
20] employed BP, CNN, and RNN methods to estimate cloud height from Himawari-8 data, finding that the BP neural network yielded superior results to CNN and RNN. Rysman et al. [
21] employed a machine learning approach combining neural networks and gradient boosting, using cloud radar observations as input and CTH as output, achieving promising results. Yu et al. [
22] investigated whether building separate models for different cloud types outperformed a single model without classification for CTH retrieval, utilizing two ensemble learning models. Wang et al. [
23] applied a random forest model using infrared and spatiotemporal parameters to retrieve CTH of tropical deep convective clouds, significantly improving retrieval accuracy.
Despite these advances, large discrepancies remain among satellite-derived CTH products. Zhang et al. [
24] reported RMSE ranges for FY-4A CTH compared to MODIS and Himawari-8 of 1.53–4.58 km and 1.30–3.16 km, respectively. Yang et al. [
25] found that MODIS CTH was generally lower than CALIOP observations for cirrus over the Beijing–Tianjin–Hebei region, with biases ranging from −3 to 2 km before correction.
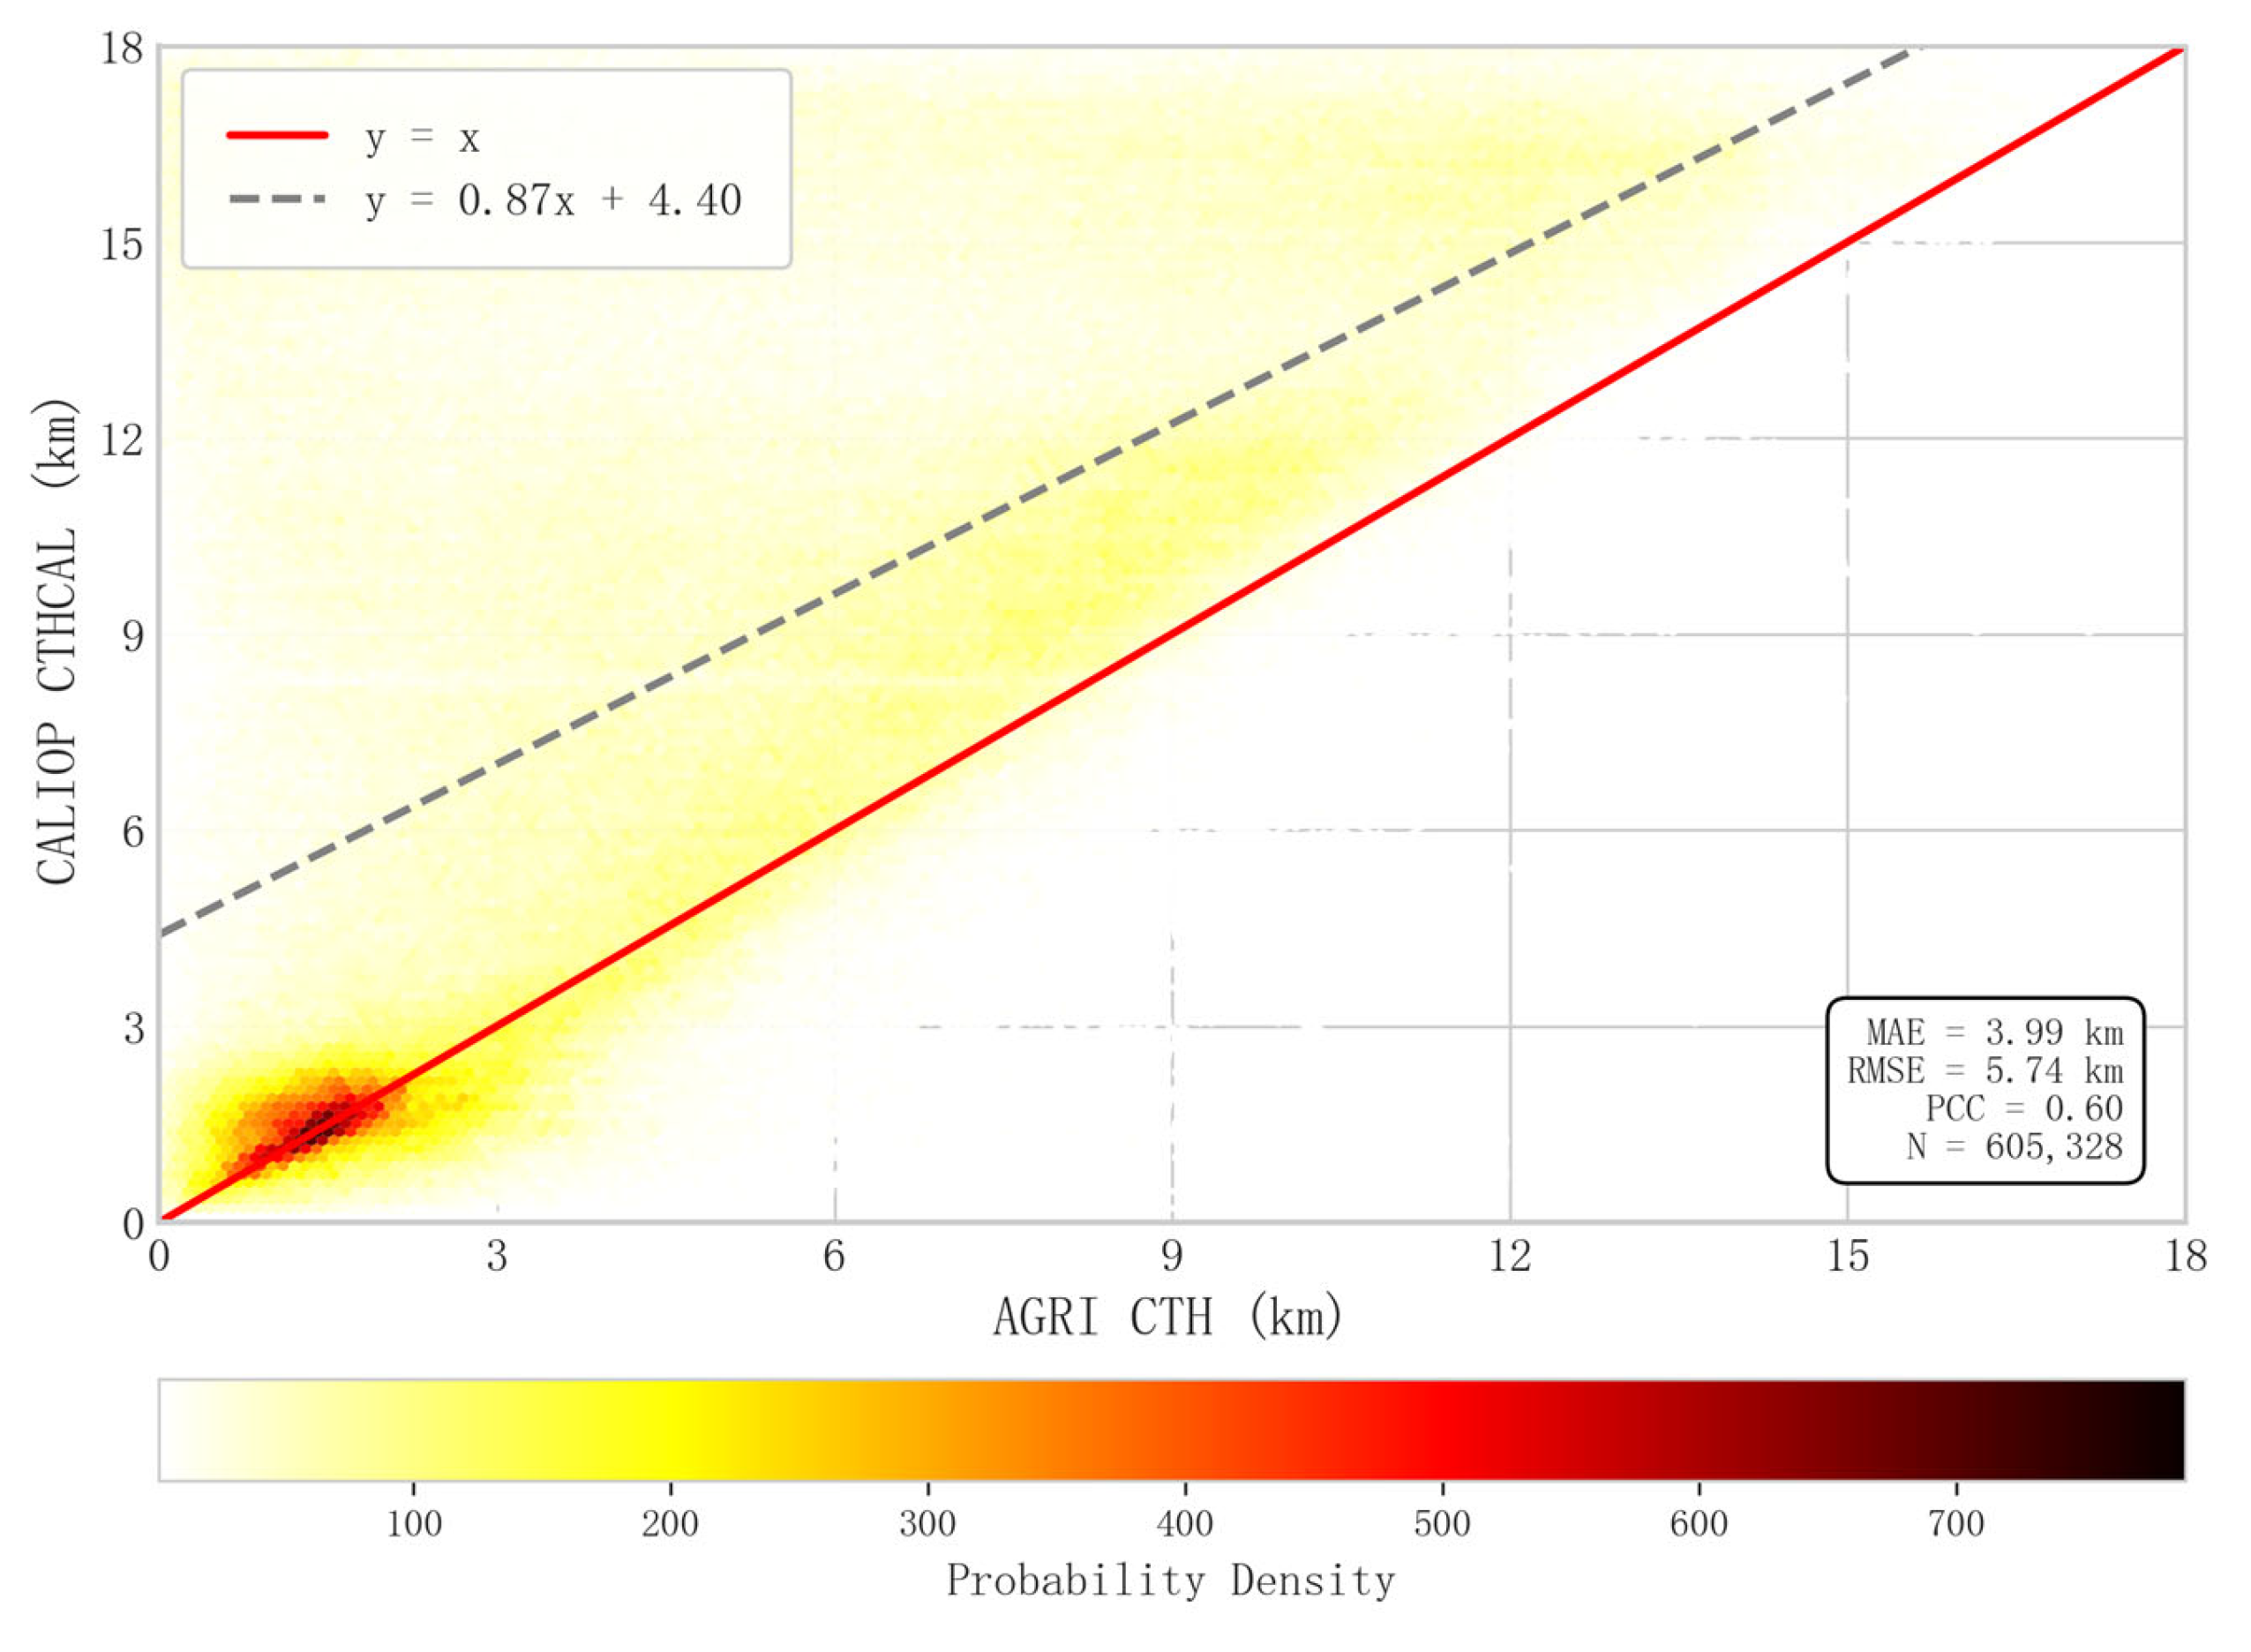
Figure 1 further illustrates that FY-4A CTH shows an MAE of 3.99 km and an RMSE of 5.74 km when compared with CALIOP data, indicating significant retrieval uncertainties. These discrepancies highlight the limitations of current passive satellite products in accurately representing cloud top height, particularly for multi-layer or semi-transparent clouds, and emphasize the need for more robust retrieval approaches.
To address these issues, we propose a multi-stage deep learning framework that integrates multi-source satellite observations to enhance the retrieval of CTH from FY-4A/AGRI data. The framework combines radiance-based cloud parameters from FY-4A with CALIPSO/CALIOP reference data to leverage the complementary advantages of active and passive sensors, thereby improving spatial consistency and temporal continuity. The Deep Neural Network (DNN) architecture is designed to learn complex nonlinear relationships between radiance and cloud physical parameters through multiple progressive learning stages, potentially improving retrieval accuracy and computational efficiency.
Nevertheless, the superiority of deep architectures over other machine learning methods in CTH retrieval has not yet been fully demonstrated within this study. Previous investigations have shown that relatively shallow neural networks, such as Multi-Layer Perceptrons (MLPs), can already achieve excellent performance when neighboring pixel information is incorporated, as evidenced by the CLARA-A3.5 and CLAAS-3 climate datasets [
26]. The primary aim of the present work is therefore to explore the feasibility and potential of a Multi-Stage DNN framework using FY-4A/AGRI and CALIOP data, rather than to claim universal superiority over existing algorithms.
Future developments will focus on comparative analyses between the proposed DNN, conventional MLP-based algorithms, and emerging Quantile Regression Neural Networks (QRNNs), which have recently shown strong performance in cloud top pressure and height retrieval tasks [
27]. In addition, incorporating spatial contextual features from neighboring pixels is expected to further enhance the retrieval accuracy and robustness of the proposed framework.
3. Cloud Top Height Retrieval Model
3.1. Model Evaluation Metrics
The models were trained using the training and test sets, and their performance was evaluated using the validation set. Four primary metrics were employed: Mean Absolute Error (MAE), Mean Squared Error (MSE), Root Mean Squared Error (RMSE), and the Coefficient of Determination (R
2).
MAE measures the average absolute difference between predicted and true values, calculated as:
where
represents the model-predicted CTHs,
is the observed value from Calipso, and m denotes the number of samples and
i denotes the
ith sample.
MSE reflects the expected value of the squared difference between predicted and true values, effectively measuring the average error magnitude and the degree of data variation. A lower
MSE indicates higher prediction accuracy and better model generalization.
RMSE is the square root of
MSE, calculated as:
R2 represents the proportion of variance in the dependent variable explained by the model, indicating the goodness of fit between predicted and true values. A higher
R2 indicates a better fit, calculated as:
For classification problems, the evaluation metrics differ from those used in regression tasks. Commonly used metrics include Accuracy, Precision, Recall, and F1 Score. Among them,
Accuracy is the most intuitive performance indicator, representing the proportion of correctly predicted samples to the total number of samples. The calculation formula is:
In the formula,
TP denotes the number of positive samples correctly identified,
TN represents the number of negative samples correctly identified,
FP indicates the number of negative samples incorrectly predicted as positive, and
FN refers to the number of positive samples incorrectly predicted as negative (the same definitions apply hereinafter).
Precision measures the proportion of correctly predicted positive samples among all samples predicted as positive, and its calculation formula is:
Recall measures the proportion of actual positive samples that are correctly identified as positive by the model. It reflects the model’s ability to capture or cover all positive samples. The calculation formula is:
Precision and
Recall are a pair of trade-off metrics, and the
F1 Score is used to provide a comprehensive evaluation. It is the harmonic mean of
Precision and
Recall, aiming to achieve a balance between the two. When both
Precision and
Recall are high, the
F1 Score will also be high. The calculation formula is:
3.2. Retrieval Parameter Selection
Radiance brightness temperature data from the FY-4A satellite can be effectively used for CTH retrieval [
11]. Studies indicate that differential and ratio processing of channels related to cloud top properties can facilitate better CTH retrieval [
19], such as the 11 μm and 12 μm channels (channels 12 and 13 on FY-4A). The physical basis lies in the difference in water vapor absorption between these channels: the 12 μm channel exhibits significantly stronger water vapor absorption than the 11 μm channel. As CTH increases,
The total water vapor path length through the atmosphere increases, causing the brightness temperature of Band 13 (BT
12) to decrease more significantly than that of Band 12 (BT
11). The brightness temperature difference (BTD
12–13 = BT
11 − BT
12) thus serves as an effective radiance measure of the atmospheric water vapor path, which is positively correlated with CTH [
31,
33]. Ratio combinations serve as auxiliary features, enhancing model robustness by amplifying spectral responses [
18]. Infrared radiation emitted from the cloud top can be received by satellite sensors and used to estimate CTT. Since atmospheric temperature generally decreases with height, lower CTT typically corresponds to higher cloud layers [
34]. Atmospheric pressure decreases with increasing altitude; therefore, measuring the pressure at the cloud top allows direct inference of its height. Many satellite remote sensing algorithms utilize this principle to estimate CTH by measuring CTP [
35]. Consequently, incorporating CTT/CTP as intermediate variables in the multi-stage model essentially decomposes CTH retrieval into the physical process chain “Radiance → Cloud Parameters → Height”. Conducting correlation analysis on various cloud parameters using both AGRI and CALIOP data, Pearson correlation coefficients (PCCs) between various cloud parameters and cloud heights were calculated.
Figure 2 illustrates statistically significant Pearson correlation coefficients (PCCs) (|r| > 0.5) between cloud parameters and CALIPSO-derived CTH. Results indicate that using differential and ratio combinations of these channels (Band12/13, Band12-13, Band13/12) helps improve the accuracy and stability of CTH retrieval using CALIOP data. The PCCs between CTH and co-located cloud physical parameters (from the same sensor) exceeded 0.85. Among non-co-located parameters, AGRI CTH showed significant negative correlations with CALIOP CTP and CTT, with PCCs of −0.59 and −0.57, respectively. This underscores the critical importance of cloud physical parameters for constructing CTH retrieval models. In this study, only single-pixel radiance and brightness temperature features from FY-4A/AGRI were used as model inputs. This approach was adopted to specifically evaluate the model’s capability to retrieve cloud parameters based solely on the radiative characteristics of individual pixels. Although previous work has shown that variables derived from neighboring pixels can substantially improve cloud-top retrievals, we deliberately limited the present study to single-pixel radiance and brightness temperature features. In particular, Håkansson et al. [
19] demonstrated that inclusion of neighboring-pixel variables accounted for about 40% of the MAE improvement in their MODIS NN approach.
However, there are important operational and physical differences between that study and the present work. Håkansson et al. used MODIS (a polar-orbiting imager) with near-nadir co-location to CALIOP and explicit NWP inputs, whereas FY-4A/AGRI is a geostationary scanning instrument with larger variation in viewing geometry, denser sampling in time and different noise/scan artifacts. These differences make naive neighboring-pixel aggregation potentially harmful in some situations (for example along cloud edges, in scenes with rapidly changing cloud fields, or for multi-layer scenes where neighboring pixels sample different vertical structures). For these reasons we first evaluated the retrieval capability using only single-pixel features to isolate the information content of FY-4A radiances. Future work will focus on integrating spatial contextual information through convolutional or hybrid models to further enhance retrieval stability and accuracy.
Table 2 lists the main variables used for training the neural networks in this study.
Based on the correlation between CTH and cloud parameters, this study constructed a retrieval model incorporating calibrated radiance data and cloud physical parameters (CTT, CTP). This model provides the foundation for subsequent CTH retrieval.
3.3. Model Development
The current FY-4A CTH product calculation primarily utilizes AGRI’s 10.7 μm, 12 μm, and 13.5 μm channels combined with numerical weather prediction data, generated through complex, optimal estimation-based iterative retrievals [
36]. We propose an integrated multi-source satellite data approach to build a machine learning model that directly retrieves CTH from FY-4A L1 radiance. This approach eliminates the dependence on pre-generated numerical forecast data during CTH product generation, streamlining the production process while simultaneously improving product accuracy. However, relying solely on calibrated radiance data from the L1 passive detector proved insufficient to capture the nonlinear relationship between passive L1 radiances and active-sensor CTH measurements. Therefore, we propose a multi-stage deep learning framework for CTH retrieval. Cascading is an efficient machine learning training strategy suitable for tasks requiring complex decisions and feature fusion. This strategy builds a chain of models sequentially, where the output of each cascade serves as input to the next, progressively refining and enhancing information to achieve the final learning objective.
The development of the multi-stage CTH model consists of two main steps. First, several nonlinear relationship models are constructed, linking the calibrated radiance data from the FY-4A satellite with Level 2 (L2) cloud parameters from multi-source satellites. Second, the retrieval results from these models, along with the calibrated radiance data, are fed into a new network model. Through feedback training, effective cascading between the cloud parameter models and the radiance data is achieved. Once the integrated model is complete, only the calibrated radiance data from the FY-4A satellite is required as input to rapidly obtain relatively accurate CTH parameters in limited steps.
FY-4A provides the CLM (Cloud Mask) product, classifying all pixels into four categories: clear, probably clear, cloudy, and probably cloudy. This study considers both ‘cloudy’ and ‘probably cloudy’ as cloud pixels (assigned value 1), and ‘clear’ and ‘probably clear’ as non-cloud pixels (assigned value 0). Channels 9–14, along with the difference (Band12-13) and ratios (Band12/13, Band13/12) of channels 12 and 13, were used as inputs to the neural network. Cloud detection is a binary classification problem. For classification, different evaluation metrics are employed, commonly including Accuracy, Precision, Recall, and the F1 Score.
Both FY-4A and CALIPSO provide pressure and temperature parameters. To effectively retrieve these parameters, models were trained using CALIPSO temperature and pressure parameters as reference truth. Two models were established, as shown in
Table 3. The variables marked with * are all results obtained through various model calculations.
In the pressure model, pressure units in both AGRI and CALIPSO data are hectopascals (hPa). For temperature data, CALIOP’s temperature data are degrees Celsius (°C), while AGRI uses Kelvin (K). Therefore, CALIOP temperature data were first converted to Kelvin (K). All models used AGRI L1 radiance from channels 9–14, along with the difference (Band12-13) and ratios (Band12/13, Band13/12) of channels 12 and 13 as input variables. Deep Neural Networks (DNNs) were employed to enhance the capability to identify nonlinear relationships. Each DNN model had 8 hidden layers. The Rectified Linear Unit (ReLU) activation function was used in each layer to improve nonlinear expression capability, accelerate learning, prevent gradient vanishing, and enhance learning of data complexity. Furthermore, to mitigate potential overfitting caused by the deep DNN architecture, we applied a 20% dropout during training to prevent overfitting and improve generalization.
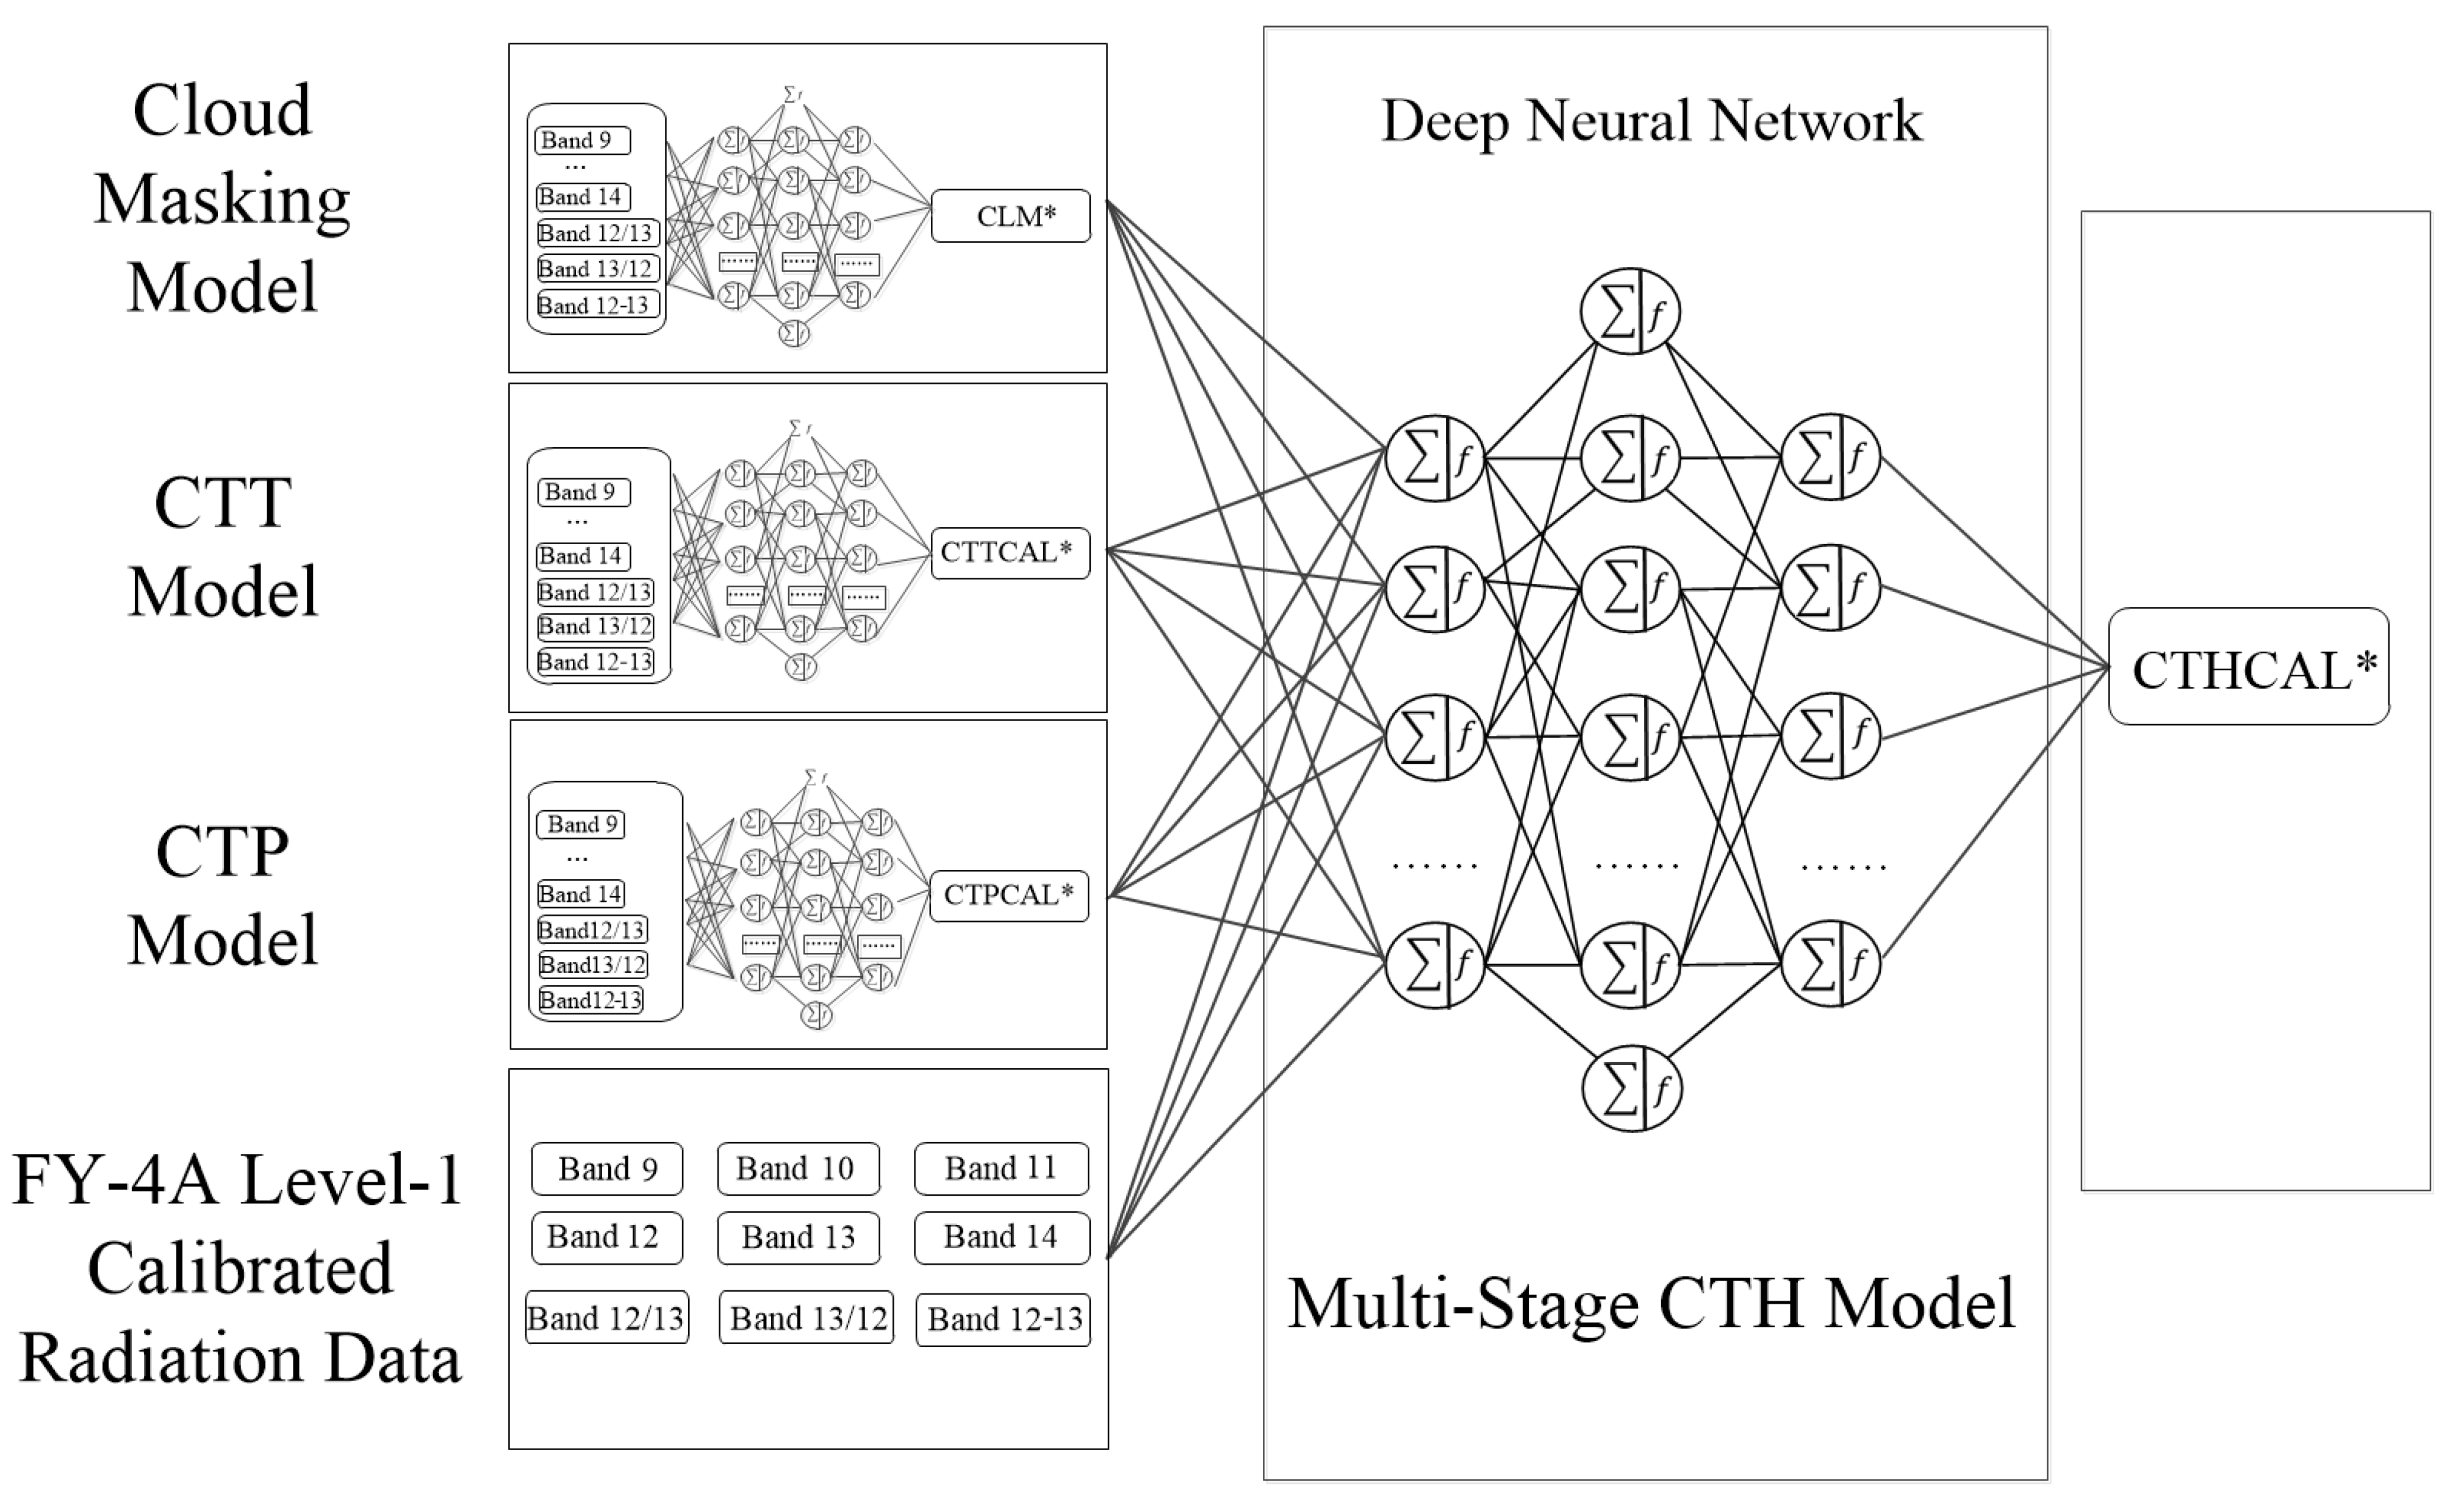
We train the multi-parameter, multi-stage CTH retrieval model using the outputs from the previous models together with FY-4A Level 1 radiance data. To establish an accurate CTH retrieval model from the various AGRI channel data, a DNN-like neural network structure was adopted. We first build cloud parameter retrieval models to extract cloud information from AGRI radiances. To assess their contribution to CTH retrieval, we construct comparison models (
Table 4). Model 1 and Model 2 directly input channel variables as feature parameters into the model, trained using the same network structure. Model 2 additionally included the difference and ratio combinations of channels 11 μm and 12 μm (FY-4A channels 12 and 13). Models 3-5 sequentially added the CTT model output, the CTP model output, and the combined output of both CTT and CTP. Model 6 represents the multi-stage model that integrates multiple cloud parameters, with input feature parameters including L1 calibrated radiance data, CTT/CTP parameters, and cloud mask information. All six models output CALIPSO CTH (CTHCAL *). Since CALIOP is an active sensor with very accurate CTH measurements [
25], we use CALIOP data as the validation benchmark. The model network structure is depicted in
Figure 3.
4. Model Analysis and Application
4.1. Cloud Mask Model Analysis
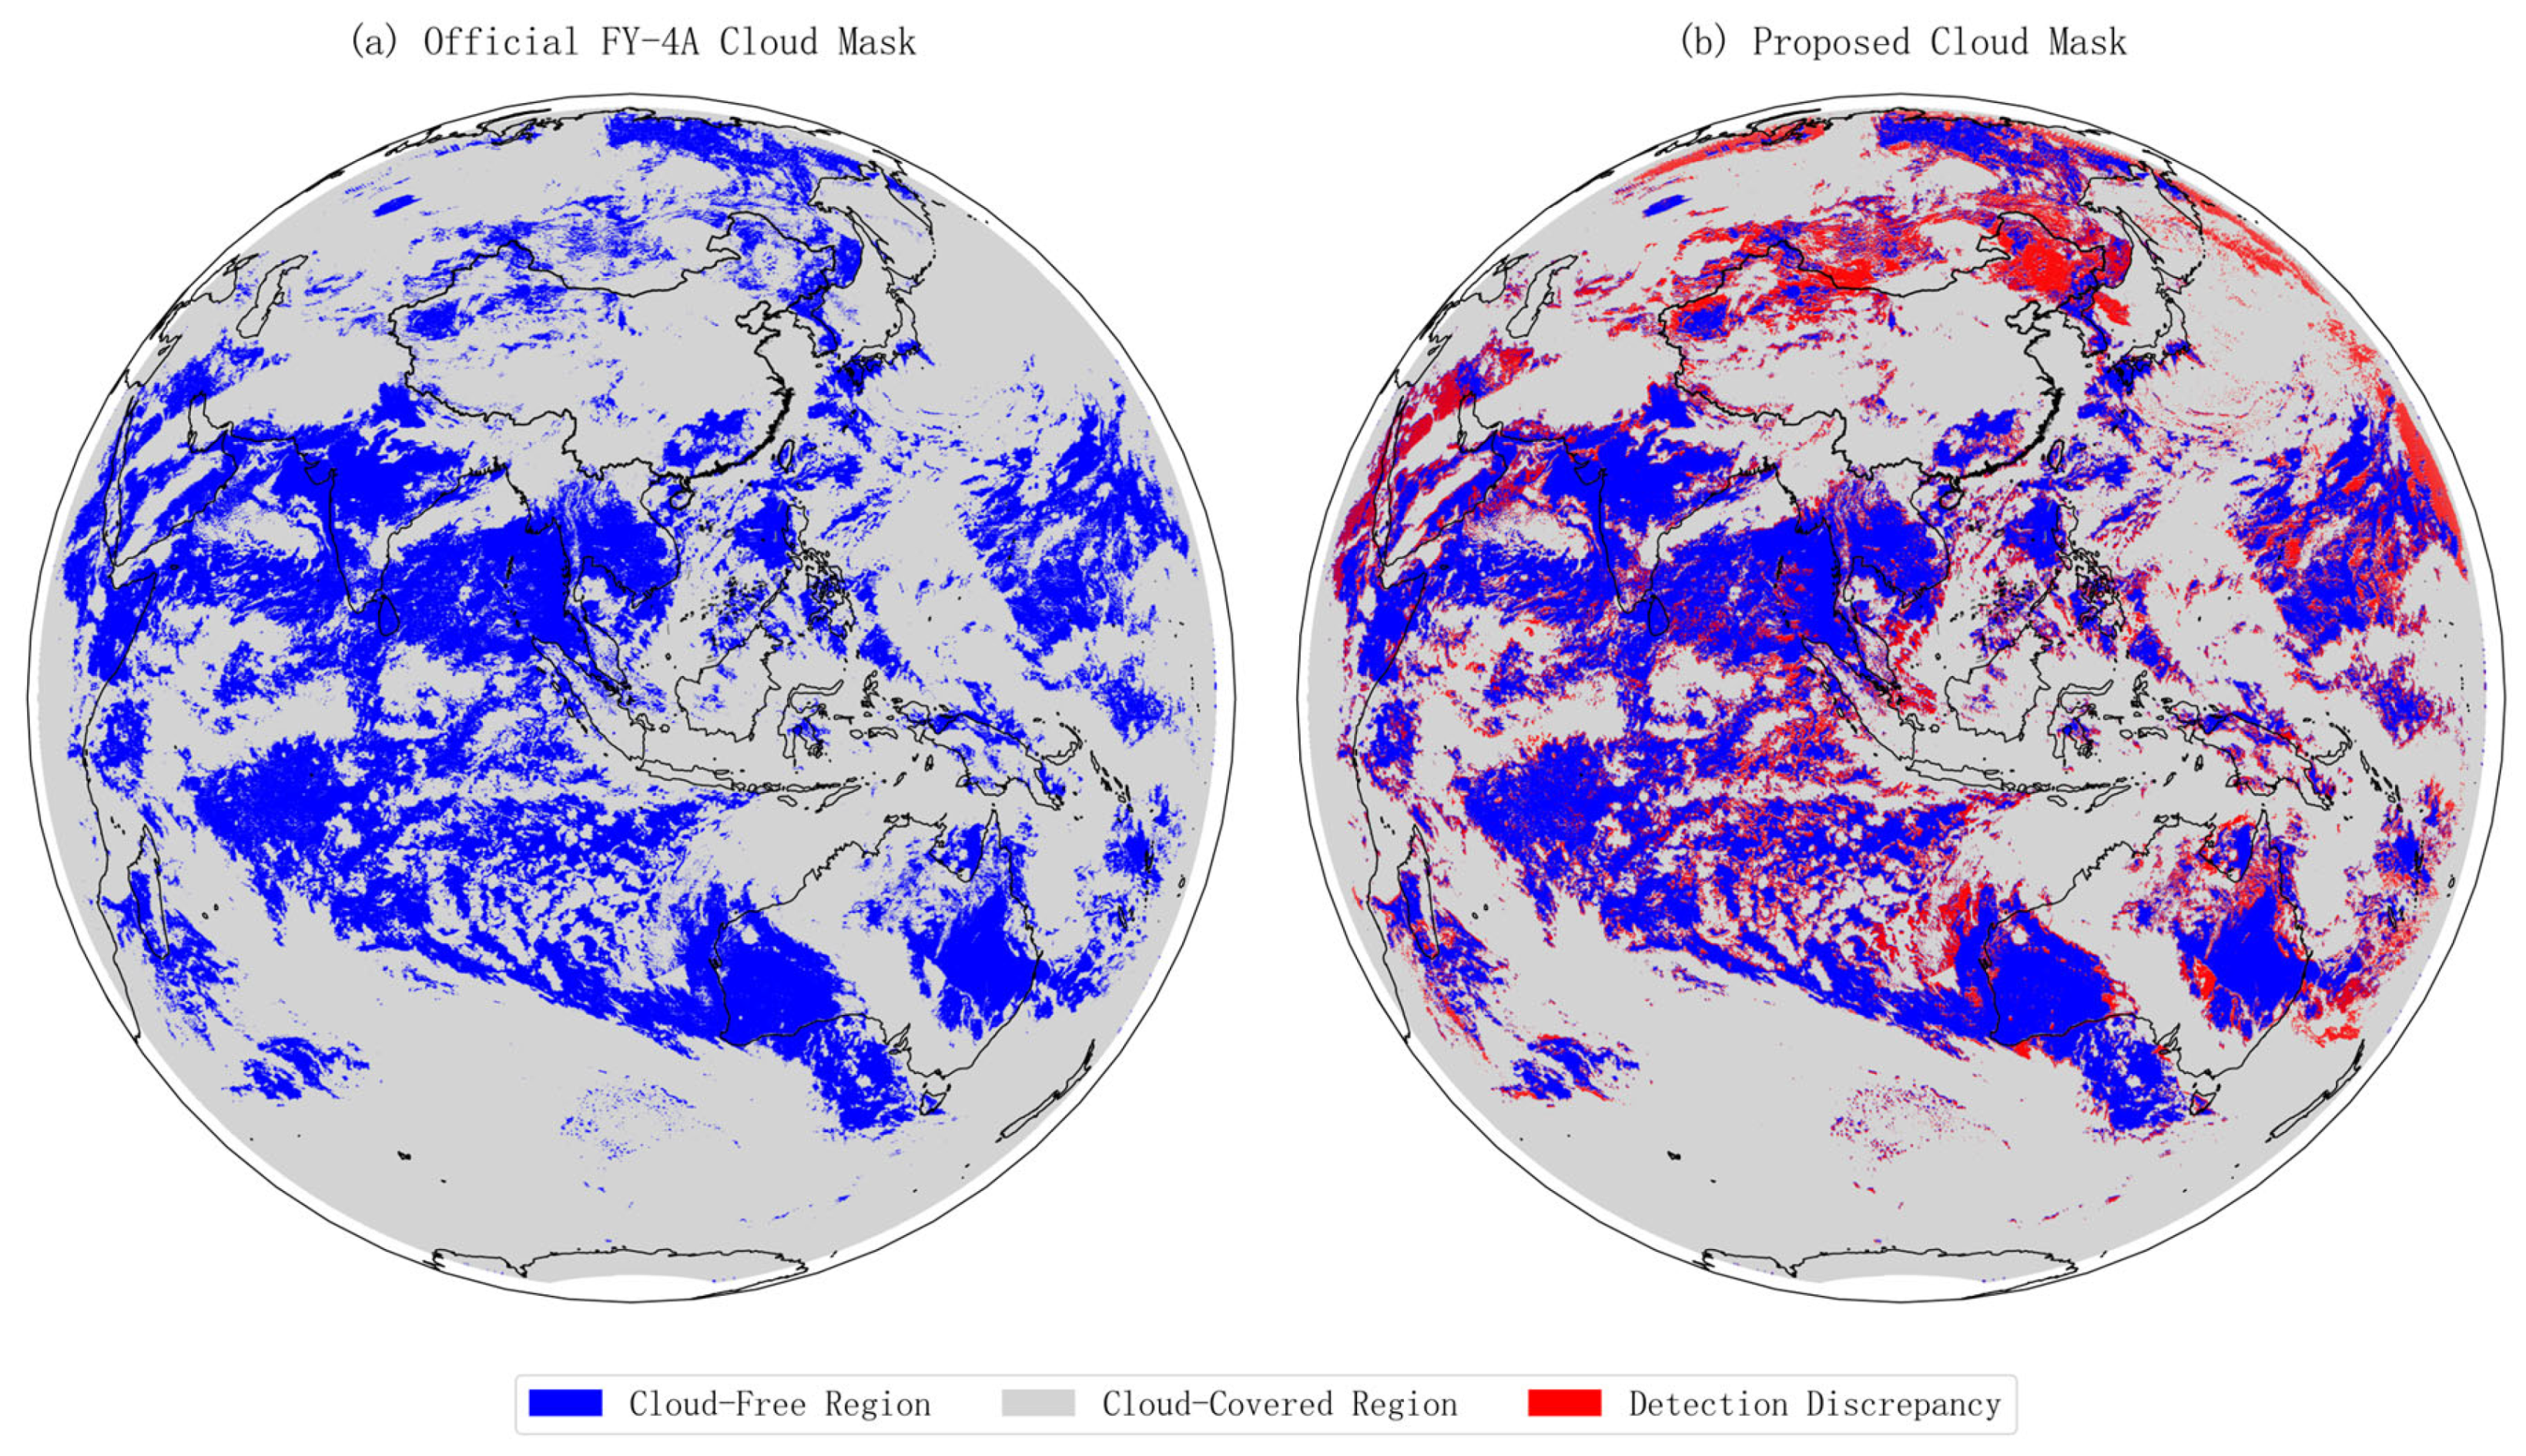
Figure 4 illustrates the cloud mask detection performance of the model using the FY-4A full-disk image from 5 January 2020, at 05:45 UTC as an example. The left panel (a) shows the cloud mask derived from the FY-4A official cloud detection product. The right panel (b) shows the distribution of points where the model detection differed from the official product. We observe that the model agrees with the official product over most areas. Misclassifications are mainly seen in the higher-latitude regions of the Northern Hemisphere. For this specific image, the model achieved an Accuracy of 0.92, Precision of 0.96, Recall of 0.93, and an F1 Score of 0.94 compared to the FY-4A cloud mask product. These metrics indicate that the model achieves high accuracy in cloud detection.
4.2. Cloud Physical Parameter Retrieval Model Analysis
Table 5 presents the MAE, RMSE, R
2, and PCCs calculated for the pressure model using the validation set.
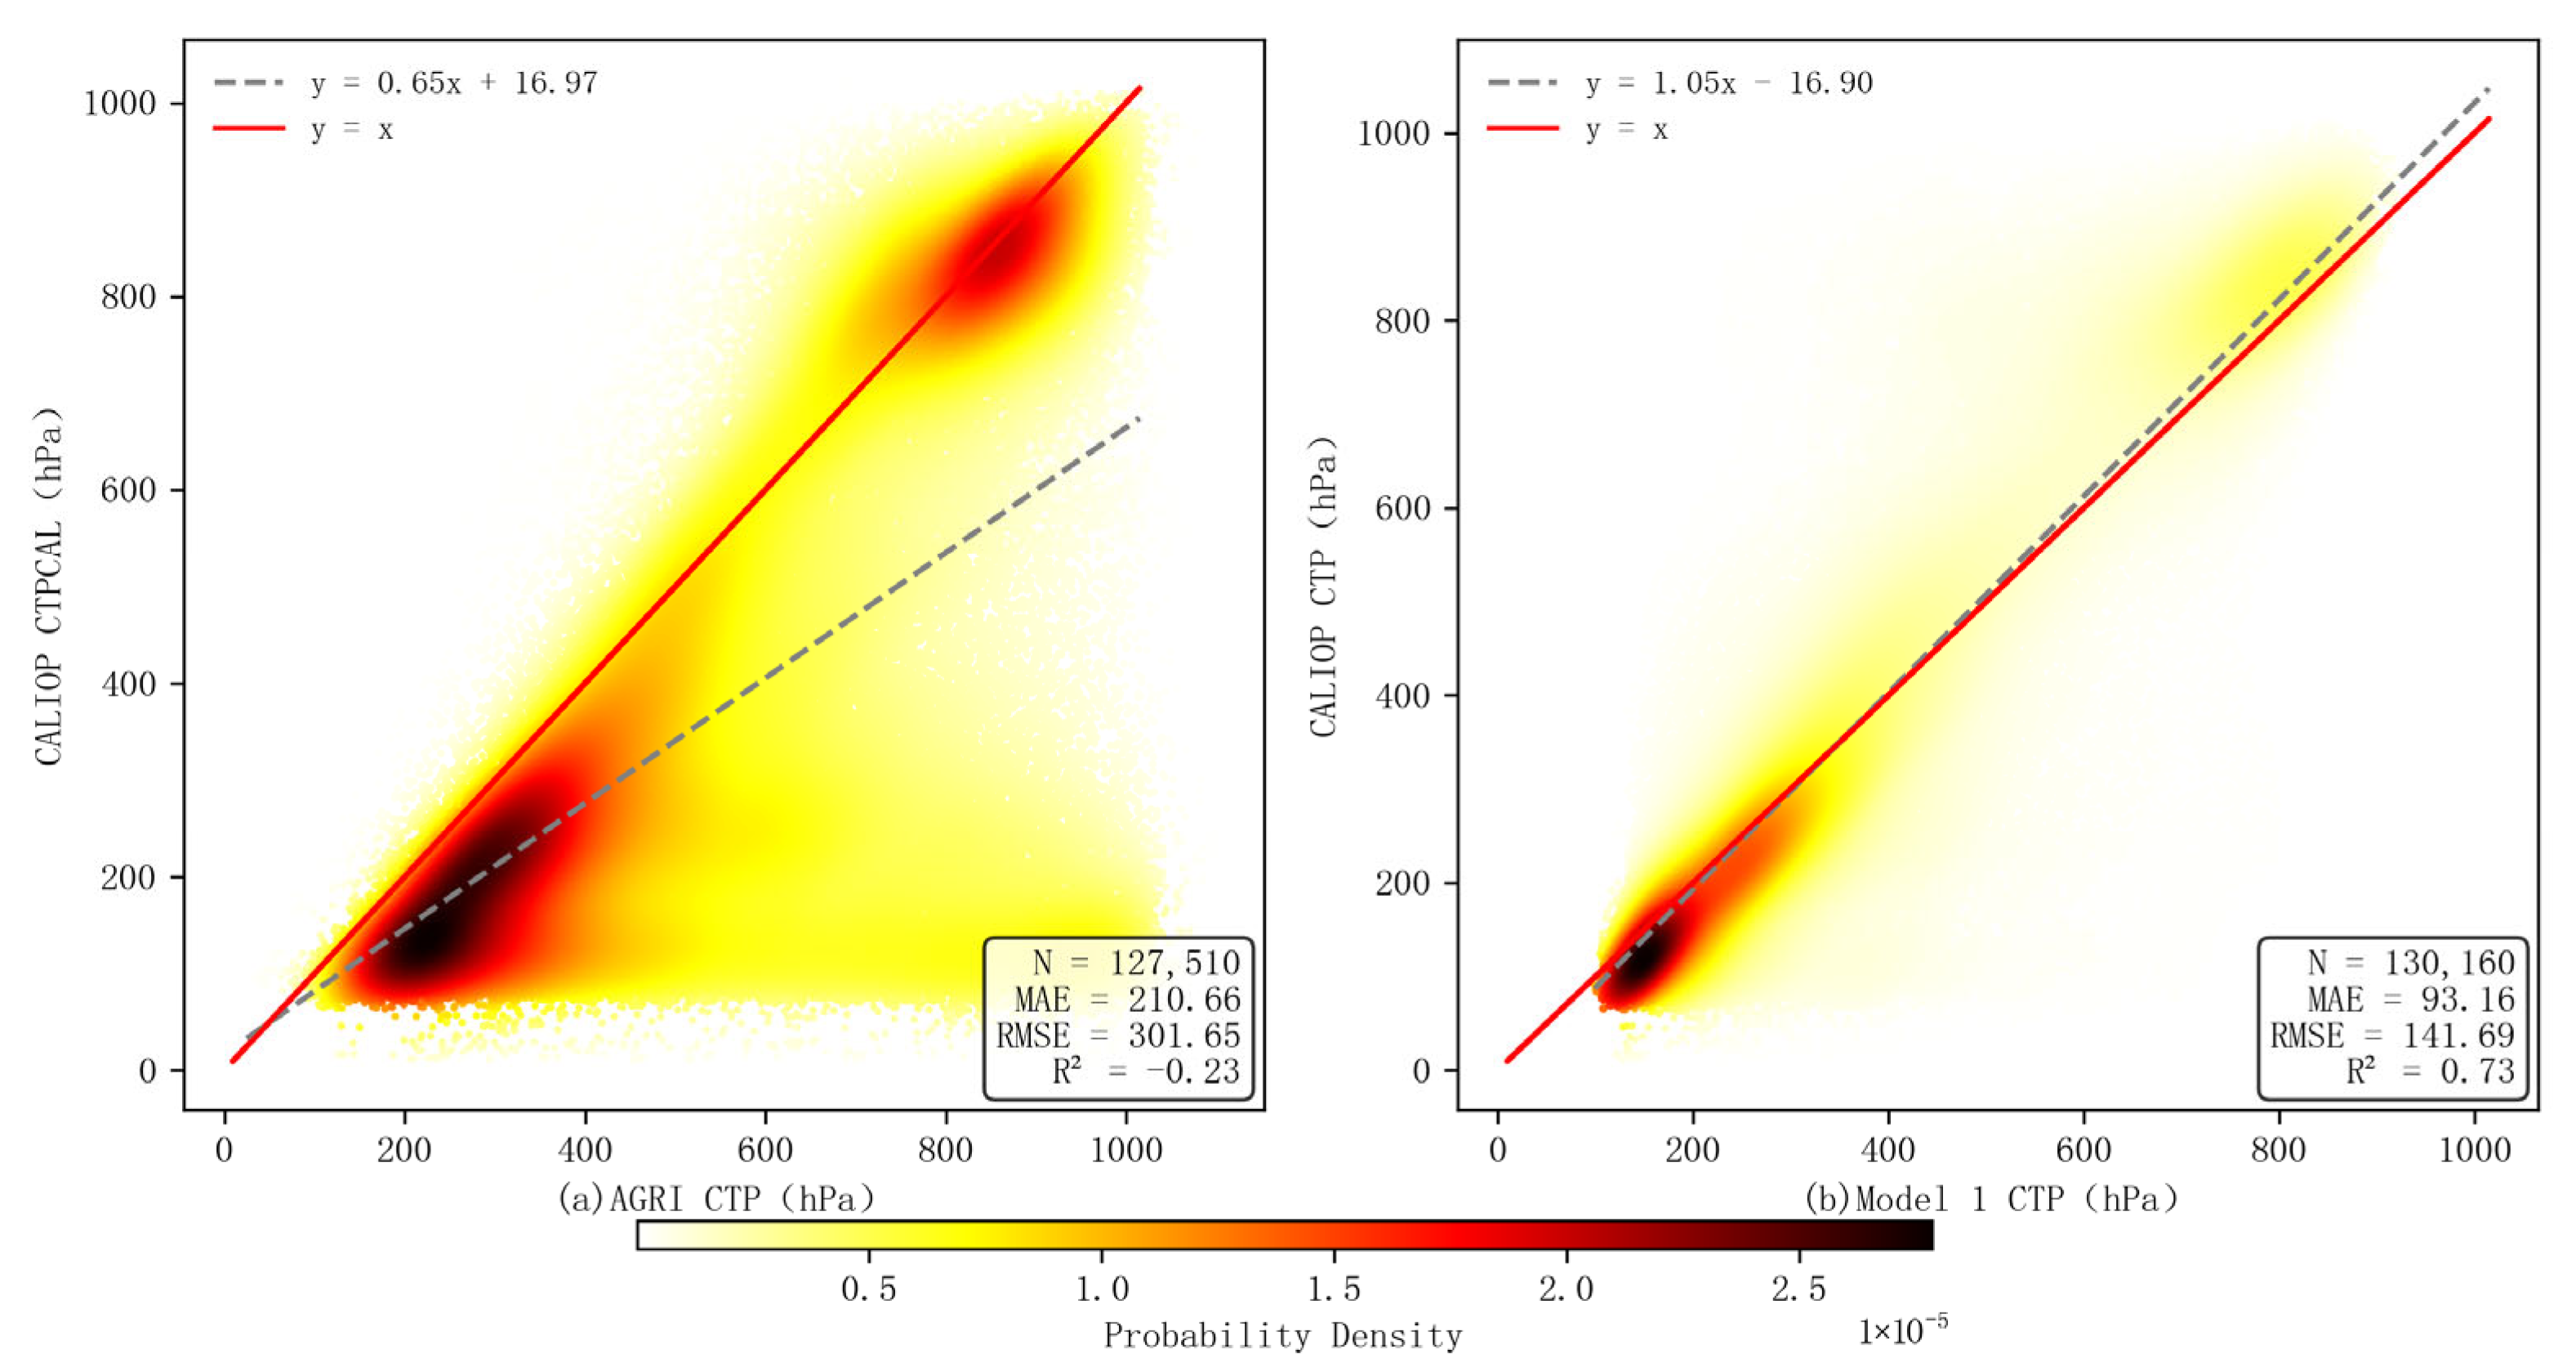
Figure 5 compares the CTP retrieval performance between the AGRI product and the model proposed in this study. In panel (a), the AGRI-retrieved CTP shows a linear correlation with CALIOP observations, but the points deviate significantly from the 1:1 line. This indicates a noticeable systematic bias in the AGRI product. The fitted equation has a slope of 0.65 and an intercept of 16.97 hPa, reflecting a tendency for AGRI to overestimate CTP in high cloud regions and underestimate it in low cloud regions. High-density regions are concentrated in mid-to-high cloud layers, showing noticeable deviation. In panel (b), the retrieval model’s CTP is compared to CALIOP. The scatter points are tightly clustered around the 1:1 line, with a linear fit slope of 1.05 and an intercept of −16.90 hPa. This shows much higher consistency between the model and CALIOP. The density distribution in
Figure 5 shows that the model effectively reduces systematic bias primarily for high-level clouds, where the scatter points are closely aligned with the 1:1 line. This indicates that the model captures the radiation–pressure relationship of high clouds much more accurately than the original AGRI product. In contrast, for low-level clouds, biases remain noticeable and the spread of points is larger, consistent with the higher MAE values shown in
Table 5. This is mainly attributed to the absence of numerical weather prediction (NWP)–based temperature–pressure information and the relatively small proportion of low-cloud samples in the training set, which limits the model’s ability to learn the nonlinear mapping in the lower troposphere. Both panels in
Figure 5 are based on the same matched dataset between AGRI and CALIOP observations; the difference in sample size arises because missing or invalid CTP values in the AGRI product were excluded, whereas the model produces continuous retrievals for all valid input pixels. Overall, the proposed model significantly improves CTP retrieval performance for high-level clouds, while the accuracy for low-level clouds remains limited and requires further optimization.
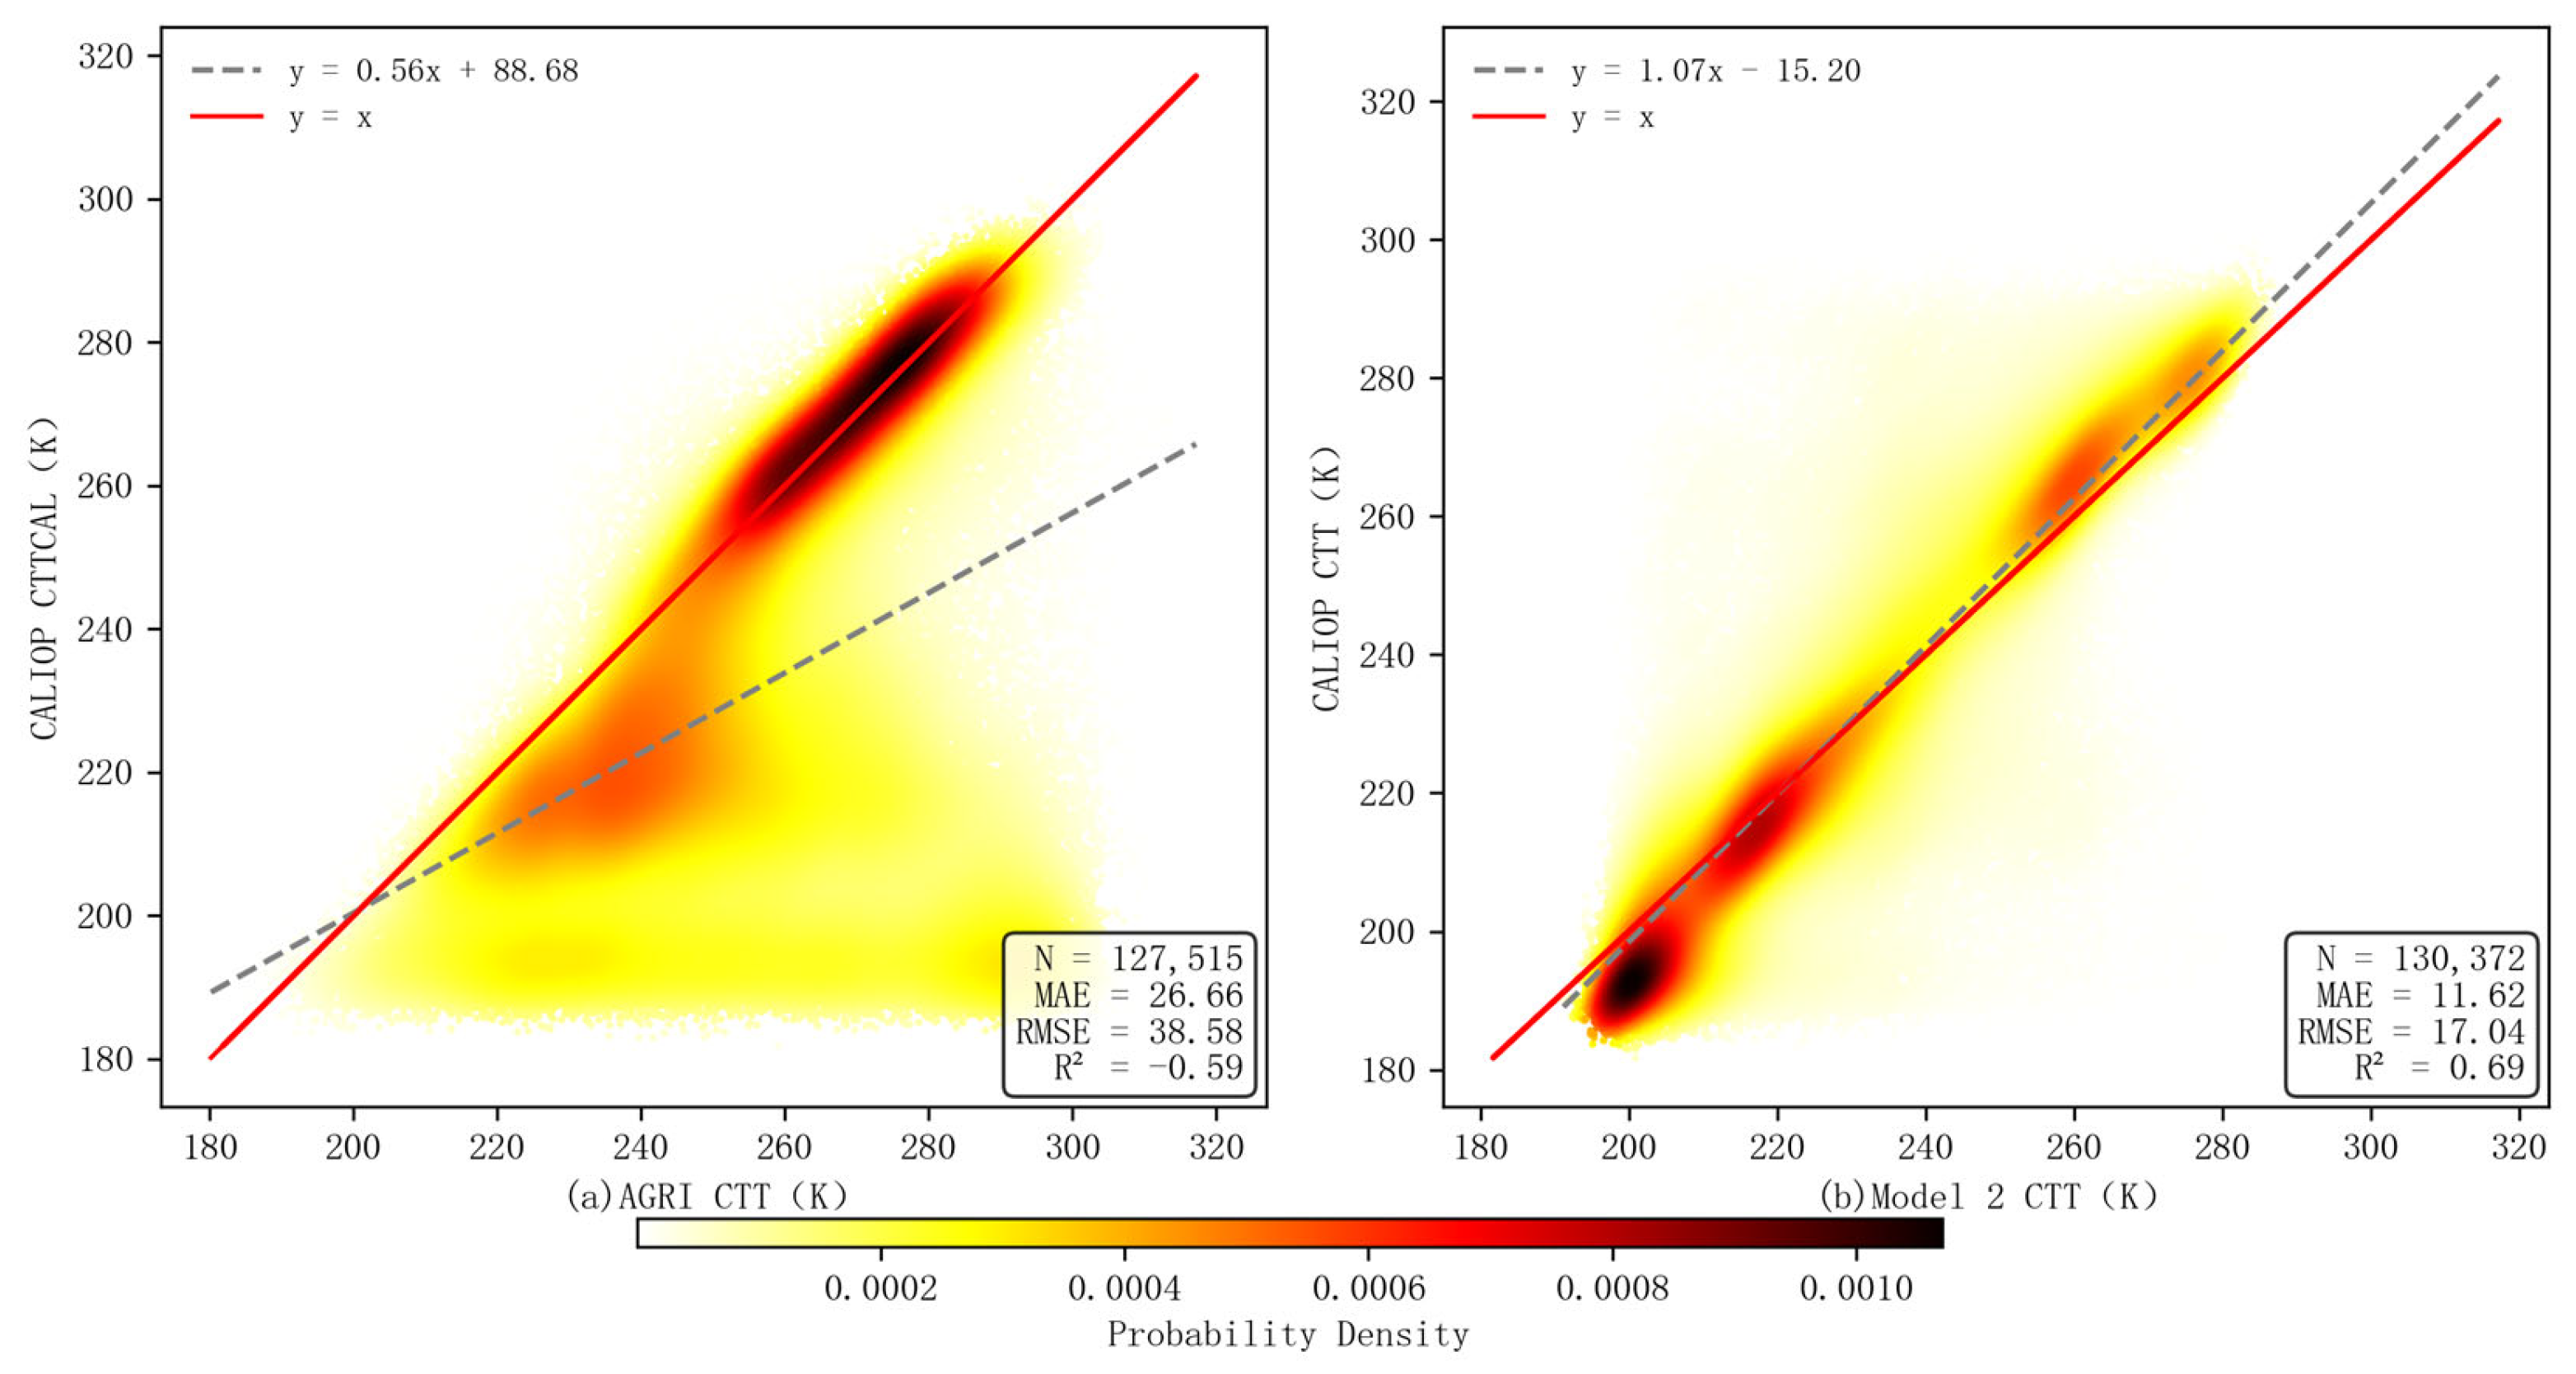
Figure 6 compares the CTT retrieval performance between the AGRI product and the model proposed in this study. The left panel (a) shows the relationship between the AGRI original product and CALIOP CTT. Although a degree of linear correlation exists, the scatter points deviate noticeably from the ideal 1:1 reference line, with a fitted slope significantly less than 1. High-density regions are clustered between 260 K and 280 K, but overall fitting accuracy is poor, indicating limited adaptability of the AGRI product across different cloud types and thicknesses. The right panel (b) shows the comparison between the proposed retrieval model output and CALIOP CTT. The point cloud is more concentrated around the red 1:1 reference line. The linear fit shows a slope close to 1 and a small intercept, indicating improved overall performance mainly driven by the better representation of high-level cold clouds. In contrast, retrievals for low-level warm clouds remain less accurate, largely due to the limited temperature–pressure information available to the network and the dominance of high-level cloud samples in the training data. Consequently, the model tends to generalize toward high-level conditions, resulting in larger uncertainties in low-level cloud retrievals. High-density regions are uniformly distributed across the CTT value range, and model predictions align much closer to CALIOP, with systematic bias significantly reduced. This demonstrates that the proposed model not only effectively improves CTT retrieval accuracy from FY-4A data but also exhibits better stability and generalization capability.
The analysis above shows that, for both pressure and temperature, the high-probability density regions are distinctly concentrated near the y = x line. By training multiple models for pressure and temperature, successful nonlinear relationship models were established between multi-source satellite cloud physical parameters, providing a solid foundation for developing the subsequent multi-stage multi-parameter CTH model.
4.3. Cloud Top Height Retrieval Model Analysis
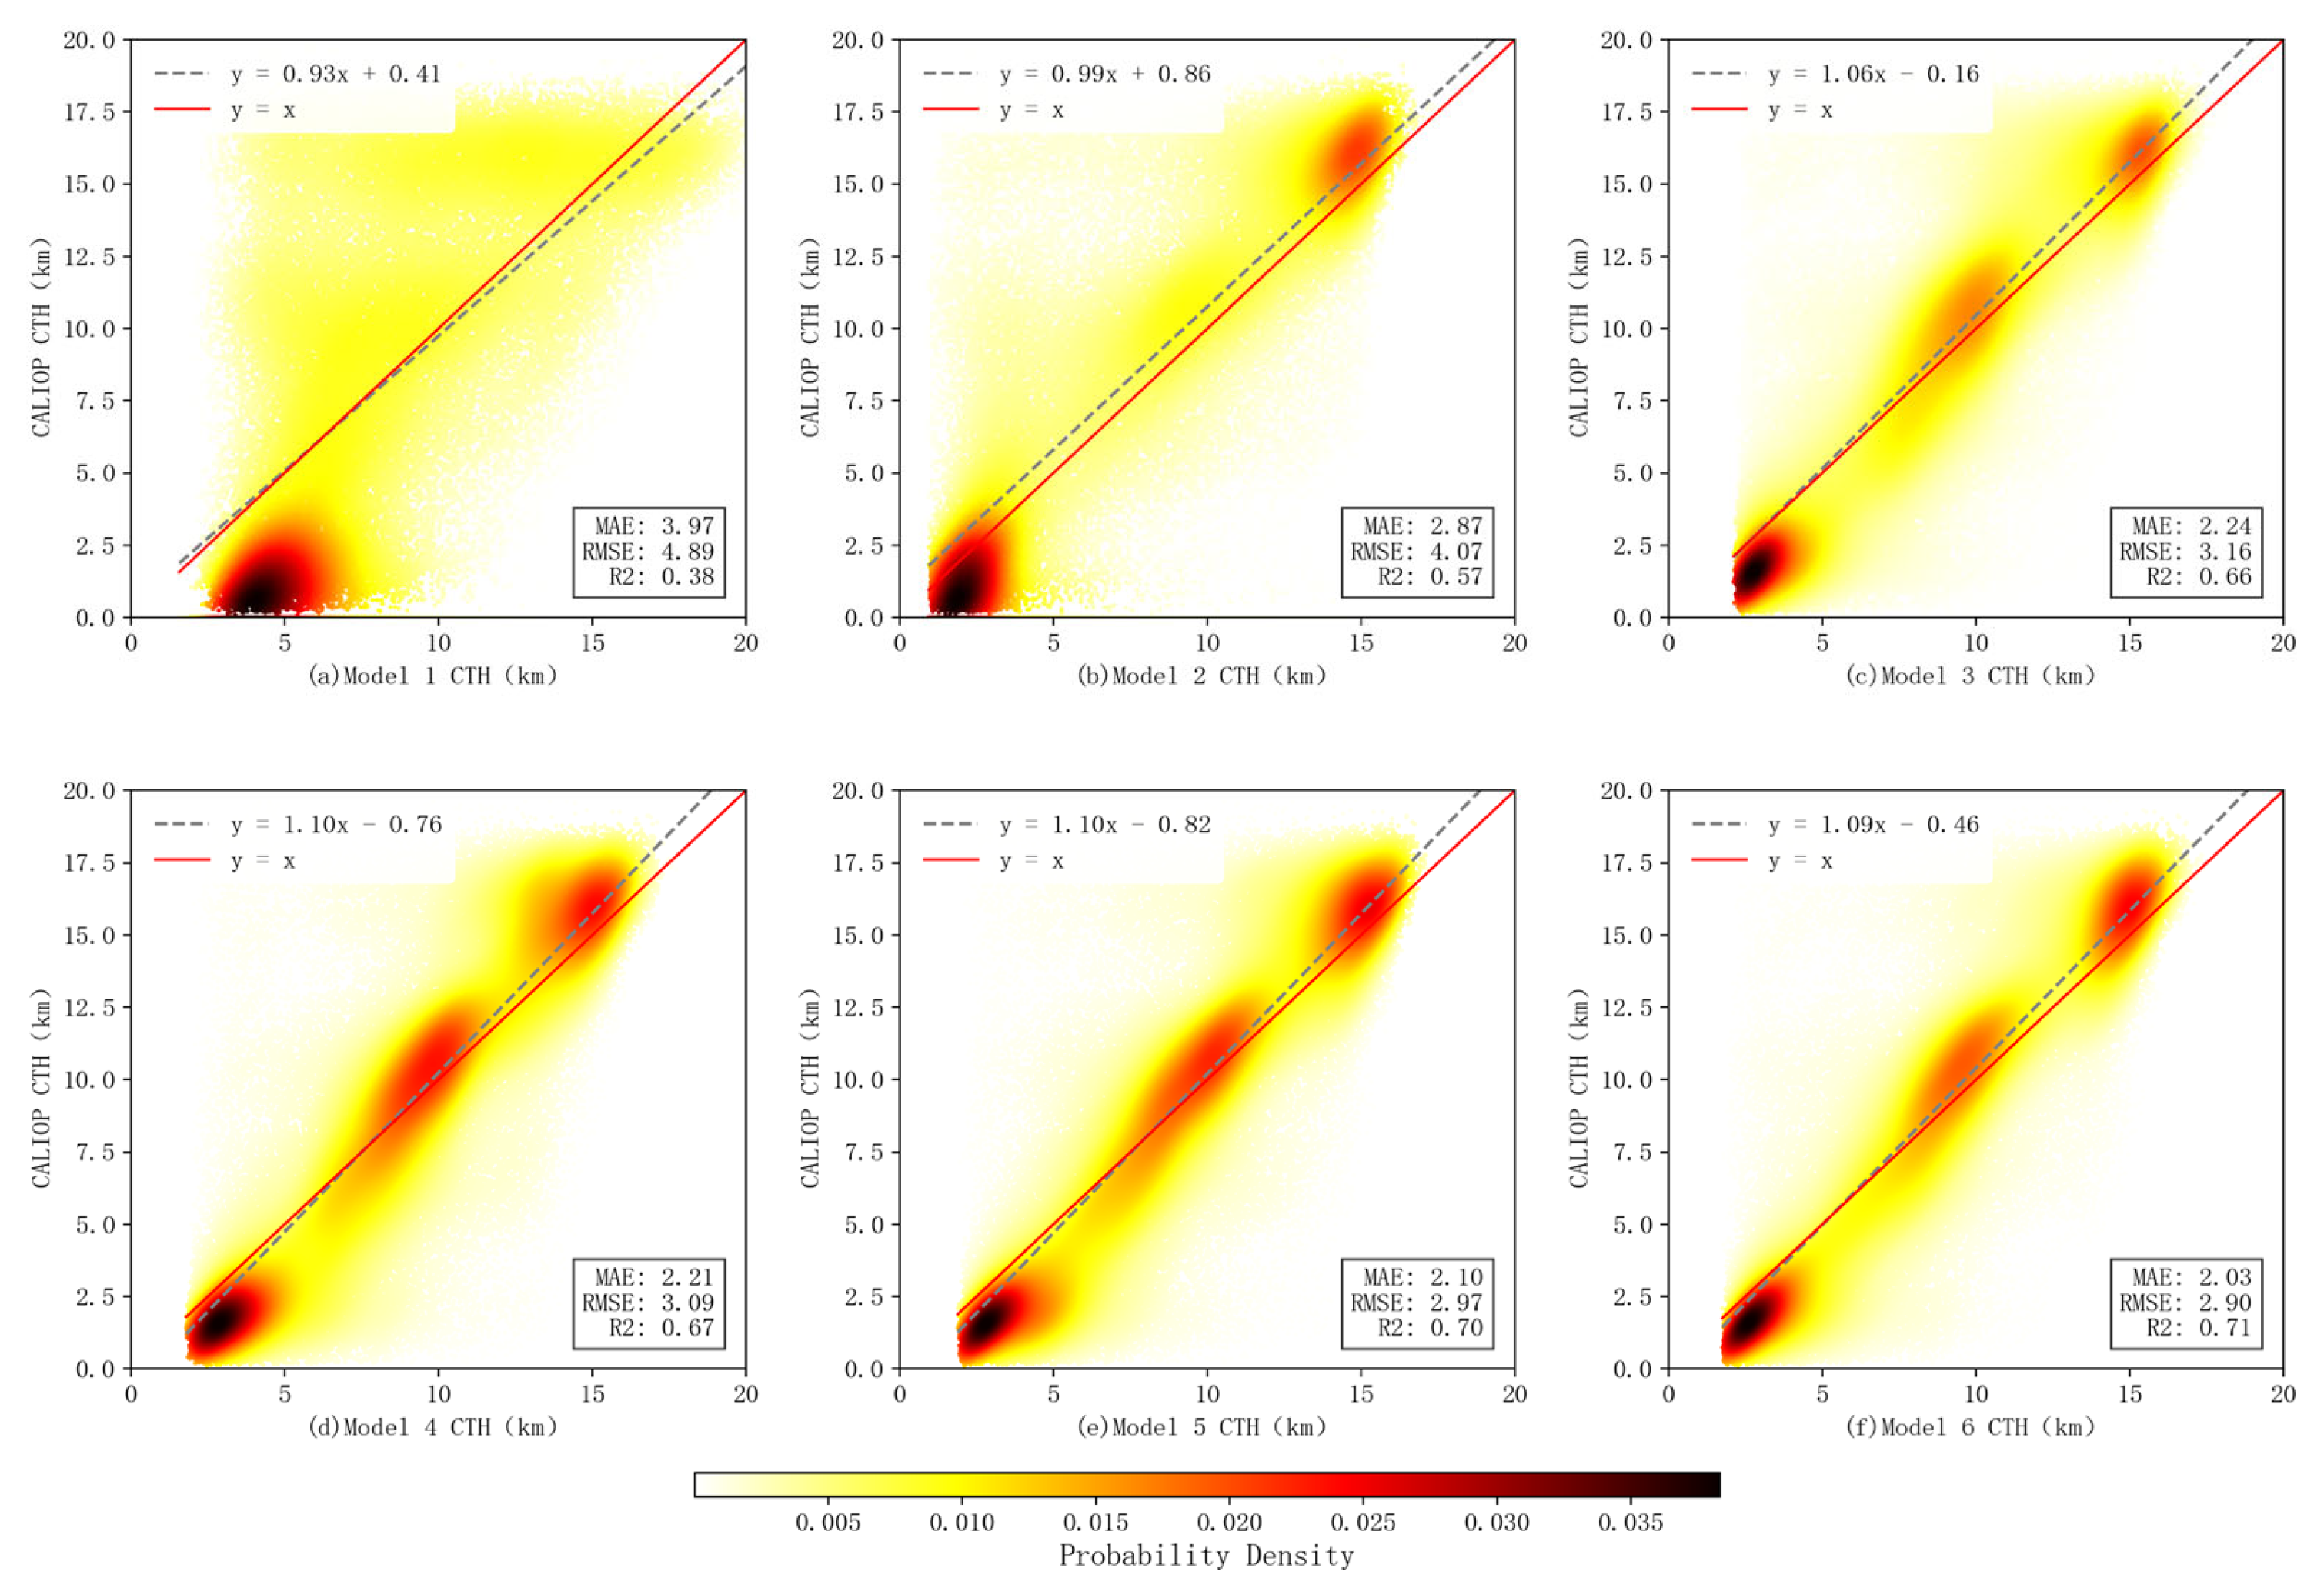
Table 6 presents the MAE, RMSE, and PCCs calculated between model outputs and CALIOP CTH. Comparing the output of Model 1 and Model 2, Model 1 had an RMSE of 4.89 km. Model 2 showed the most significant improvement, with RMSE reduced to 4.07 km, a 29.09% decrease compared to the baseline represented by Model 1. This confirms the significant enhancement achieved by incorporating the channel 12 and 13 difference and ratio combinations.
Figure 7 displays scatter plots of the model retrieval results versus the true values, corroborating the results in
Table 6. The red line represents the line of perfect agreement (y = x). The densest concentration of scatter points occurs near y = x for all models. Compared to Model 1 and Model 2, the scatter points for the other models are noticeably more clustered, indicating that the multi-stage strategy for cloud parameter retrieval significantly improves the results. Model 6 further integrates multiple cloud-parameter models and diverse cloud-layer information, achieving even better correlation and lower errors. Model 6 (our multi-stage model) achieved an RMSE of 2.90 km and PCC = 0.85. This RMSE is 49.48% lower than the official FY-4A product (5.74 km) and 28.79% lower than Model 2. These results show that Model 6 is much closer to CALIOP measurements and significantly improves CTH accuracy.
As the retrieval accuracy of the original FY-4A AGRI product has already been analyzed in
Figure 1, it is not repeated here to avoid redundancy;
Figure 7 focuses solely on the comparative performance among the proposed models.
To validate the effectiveness of the cloud parameter retrieval modules within the multi-stage model, two input schemes were compared: one using the model-trained CTTCAL and CTPCAL, and the other using the official FY-4A L2 products (CTT/CTP). The rest of the model structure remained identical, and performance differences were evaluated using the same validation set.
Table 7 shows the performance comparison between using official products and self-retrieved parameters.
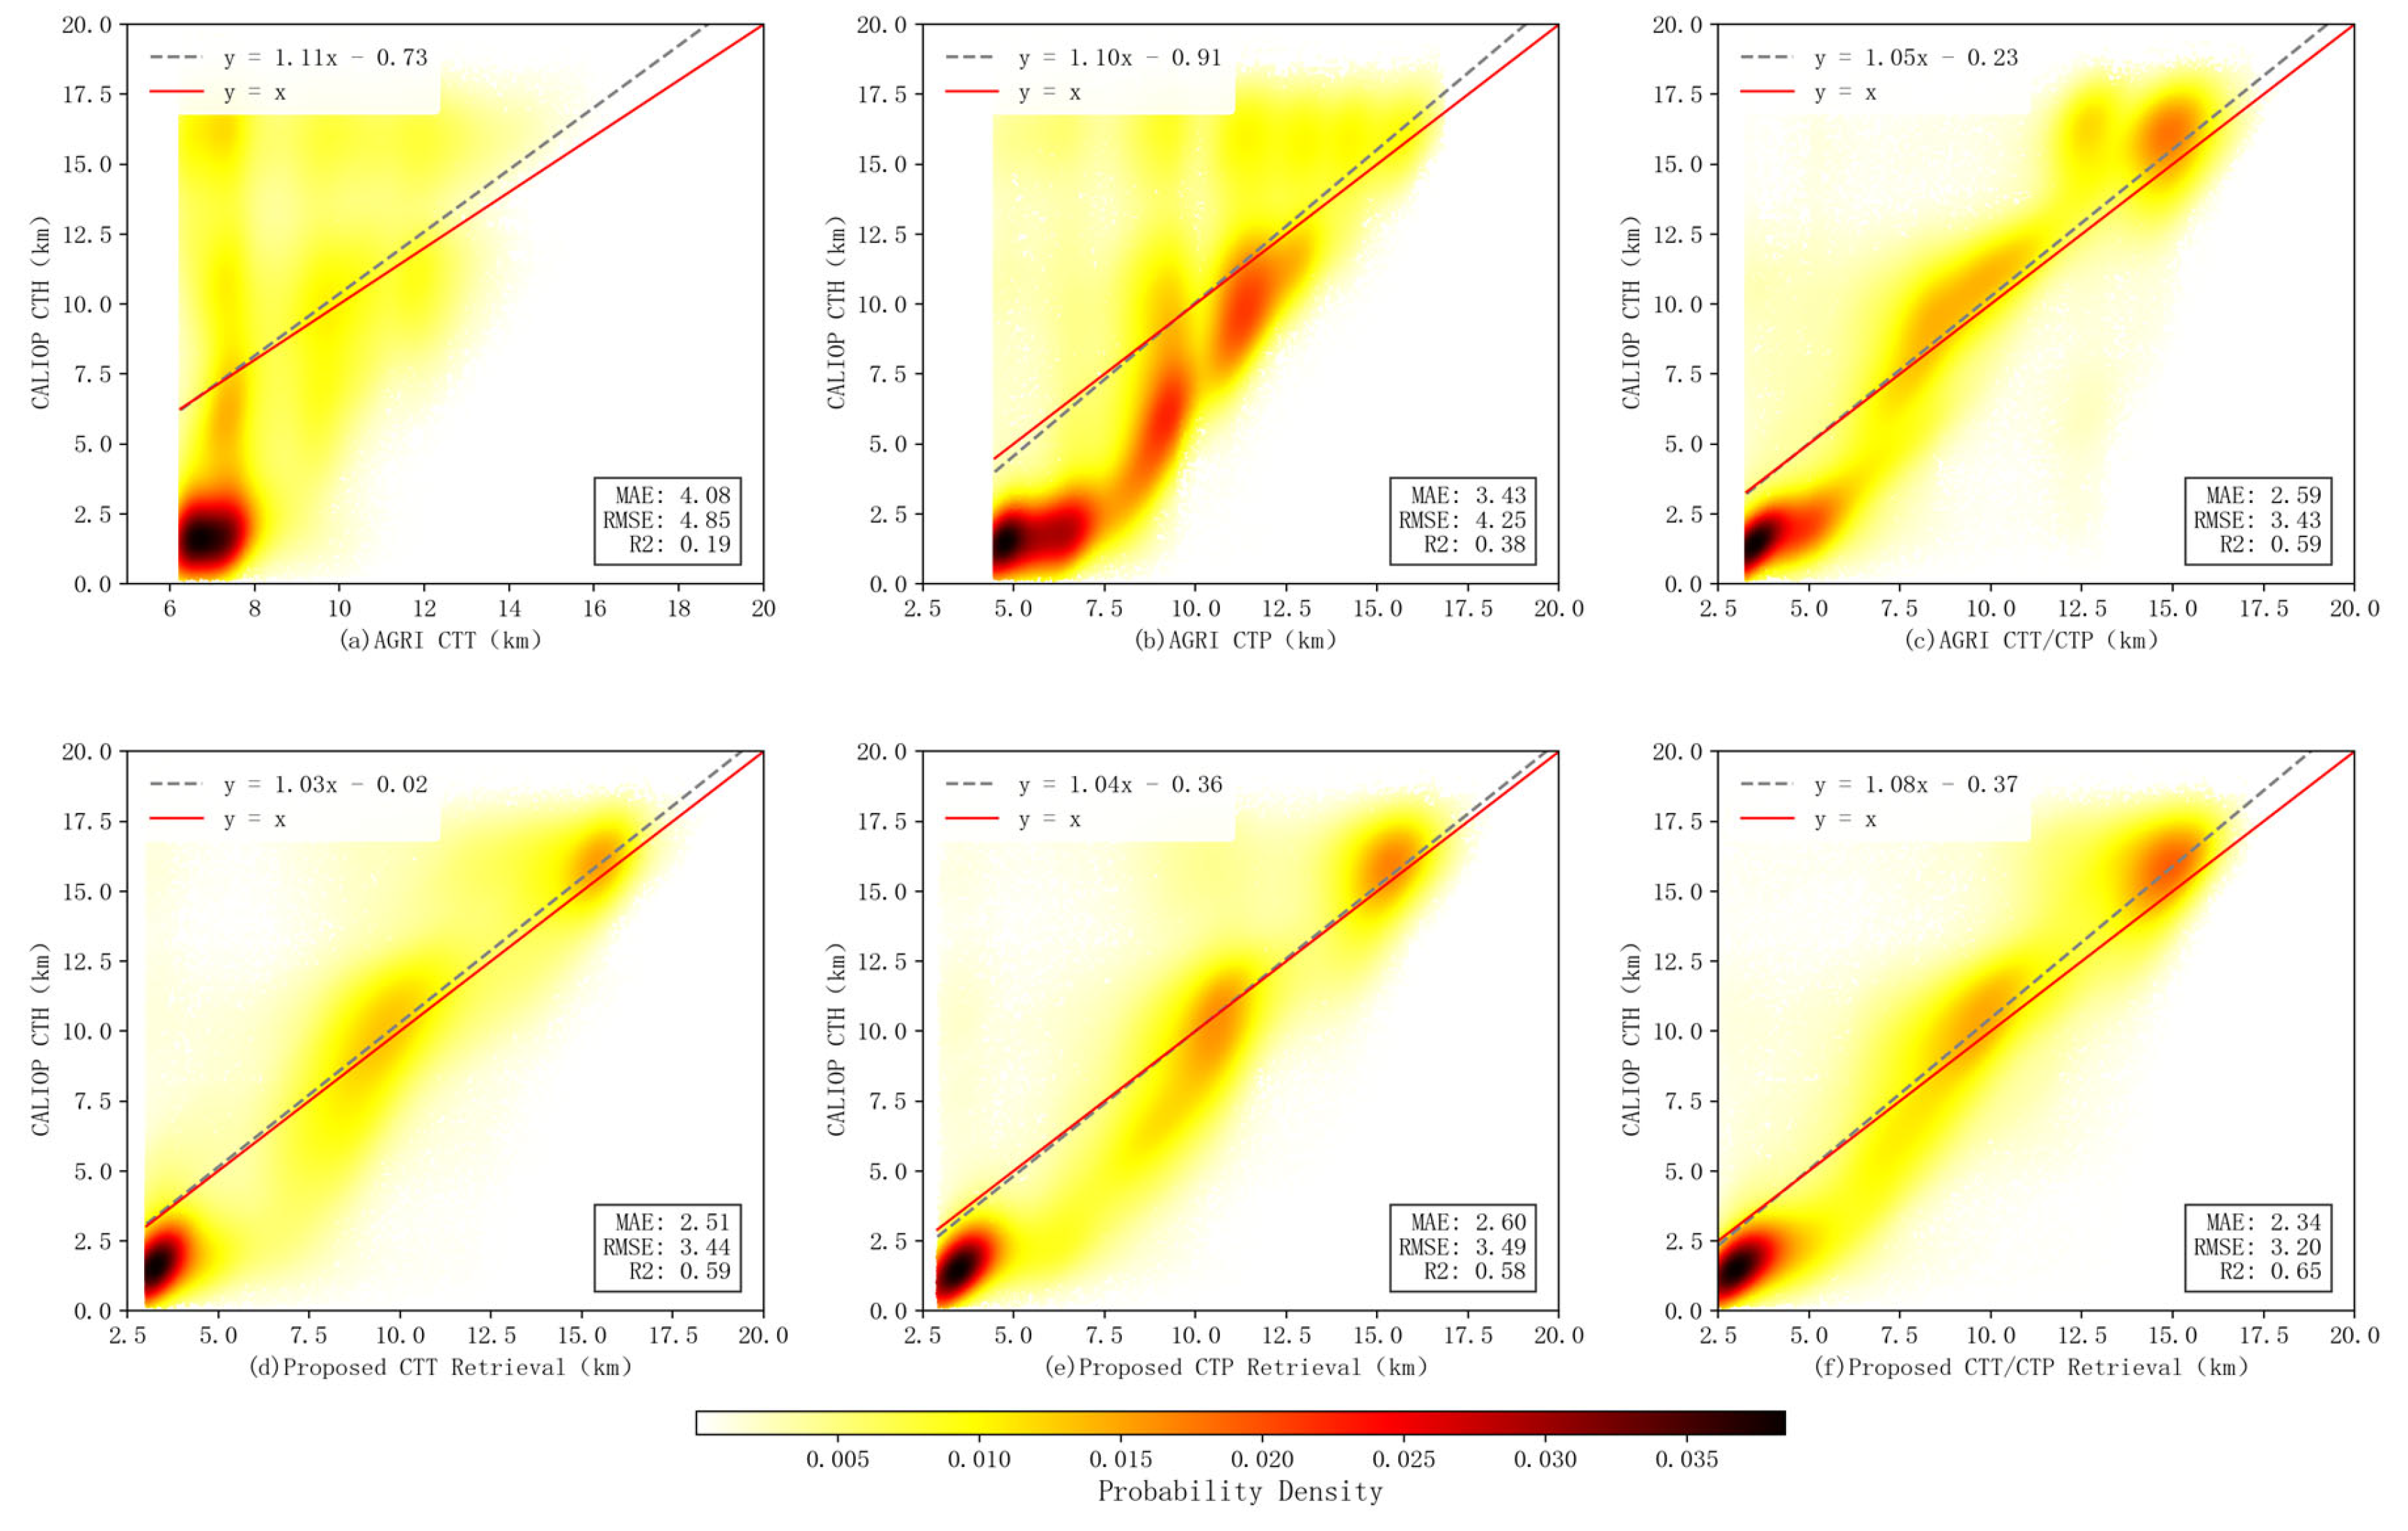
Figure 8 shows the corresponding scatter plots. The model using self-retrieved parameters performed significantly better than the scheme using official products. RMSE decreased by 29.07%, 17.88%, and 6.71% for inputs of CTT, CTP, and their combination, respectively, compared to using the corresponding official products. This advantage stems from differences in the underlying physical mechanisms. The official products rely solely on 3 infrared channels, whereas the cloud parameter models in this study utilize all 6 AGRI thermal infrared channels (Band9-14), enhanced by Band12-13 difference and ratio features to strengthen the link between water vapor path and cloud height. The proposed model establishes a direct “Radiance → Cloud Parameter → Height” mapping through end-to-end learning, circumventing error propagation from external data sources.
To evaluate the performance of each model in more detail, the retrieval accuracy for different cloud height types was analyzed. Following the ISCCP international cloud classification scheme, clouds were categorized into three types: low level, middle level, and high level. Models were comprehensively evaluated using multiple metrics (MAE, Median Error, RMSE, and PCC) calculated per cloud type, as shown in
Figure 9. The figure compares the predictive performance of the original AGRI product and the six models (Model 1–Model 6) for the three cloud types.
Overall, all metrics show clear improvement trends with model iteration. MAE, Median Error, and RMSE consistently decrease, indicating progressively smaller prediction errors, while PCC values steadily increase, reflecting a stronger correlation between model predictions and CALIOP observations. These results demonstrate the enhanced stability and accuracy of the proposed models.
Regarding performance across cloud types, high-level clouds consistently exhibit the best retrieval accuracy, with the lowest error metrics and highest PCC values, indicating that their radiative characteristics are more effectively captured by the network. In contrast, low-level clouds present the largest errors and lowest correlations. This is mainly because the model does not include numerical weather prediction (NWP) data as input, making it difficult to accurately represent the relationship between temperature and altitude in the lower troposphere. As a result, the network can only rely on climatological statistical features from the training data, leading to degraded retrieval performance and larger uncertainties for low-level clouds. Mid-level clouds perform intermediately between these two extremes.
Comparing all configurations, Model 6 achieves the best overall performance across all cloud types, confirming that the multi-stage feature integration strategy effectively enhances cloud top height retrieval accuracy.
4.4. Model Application
Typhoons are intense tropical cyclones primarily occurring over oceans, often accompanied by extreme weather such as strong winds, heavy rainfall, and storm surges, posing significant threats to coastal regions. Therefore, typhoon monitoring and early warning constitute an important topic in meteorological research.
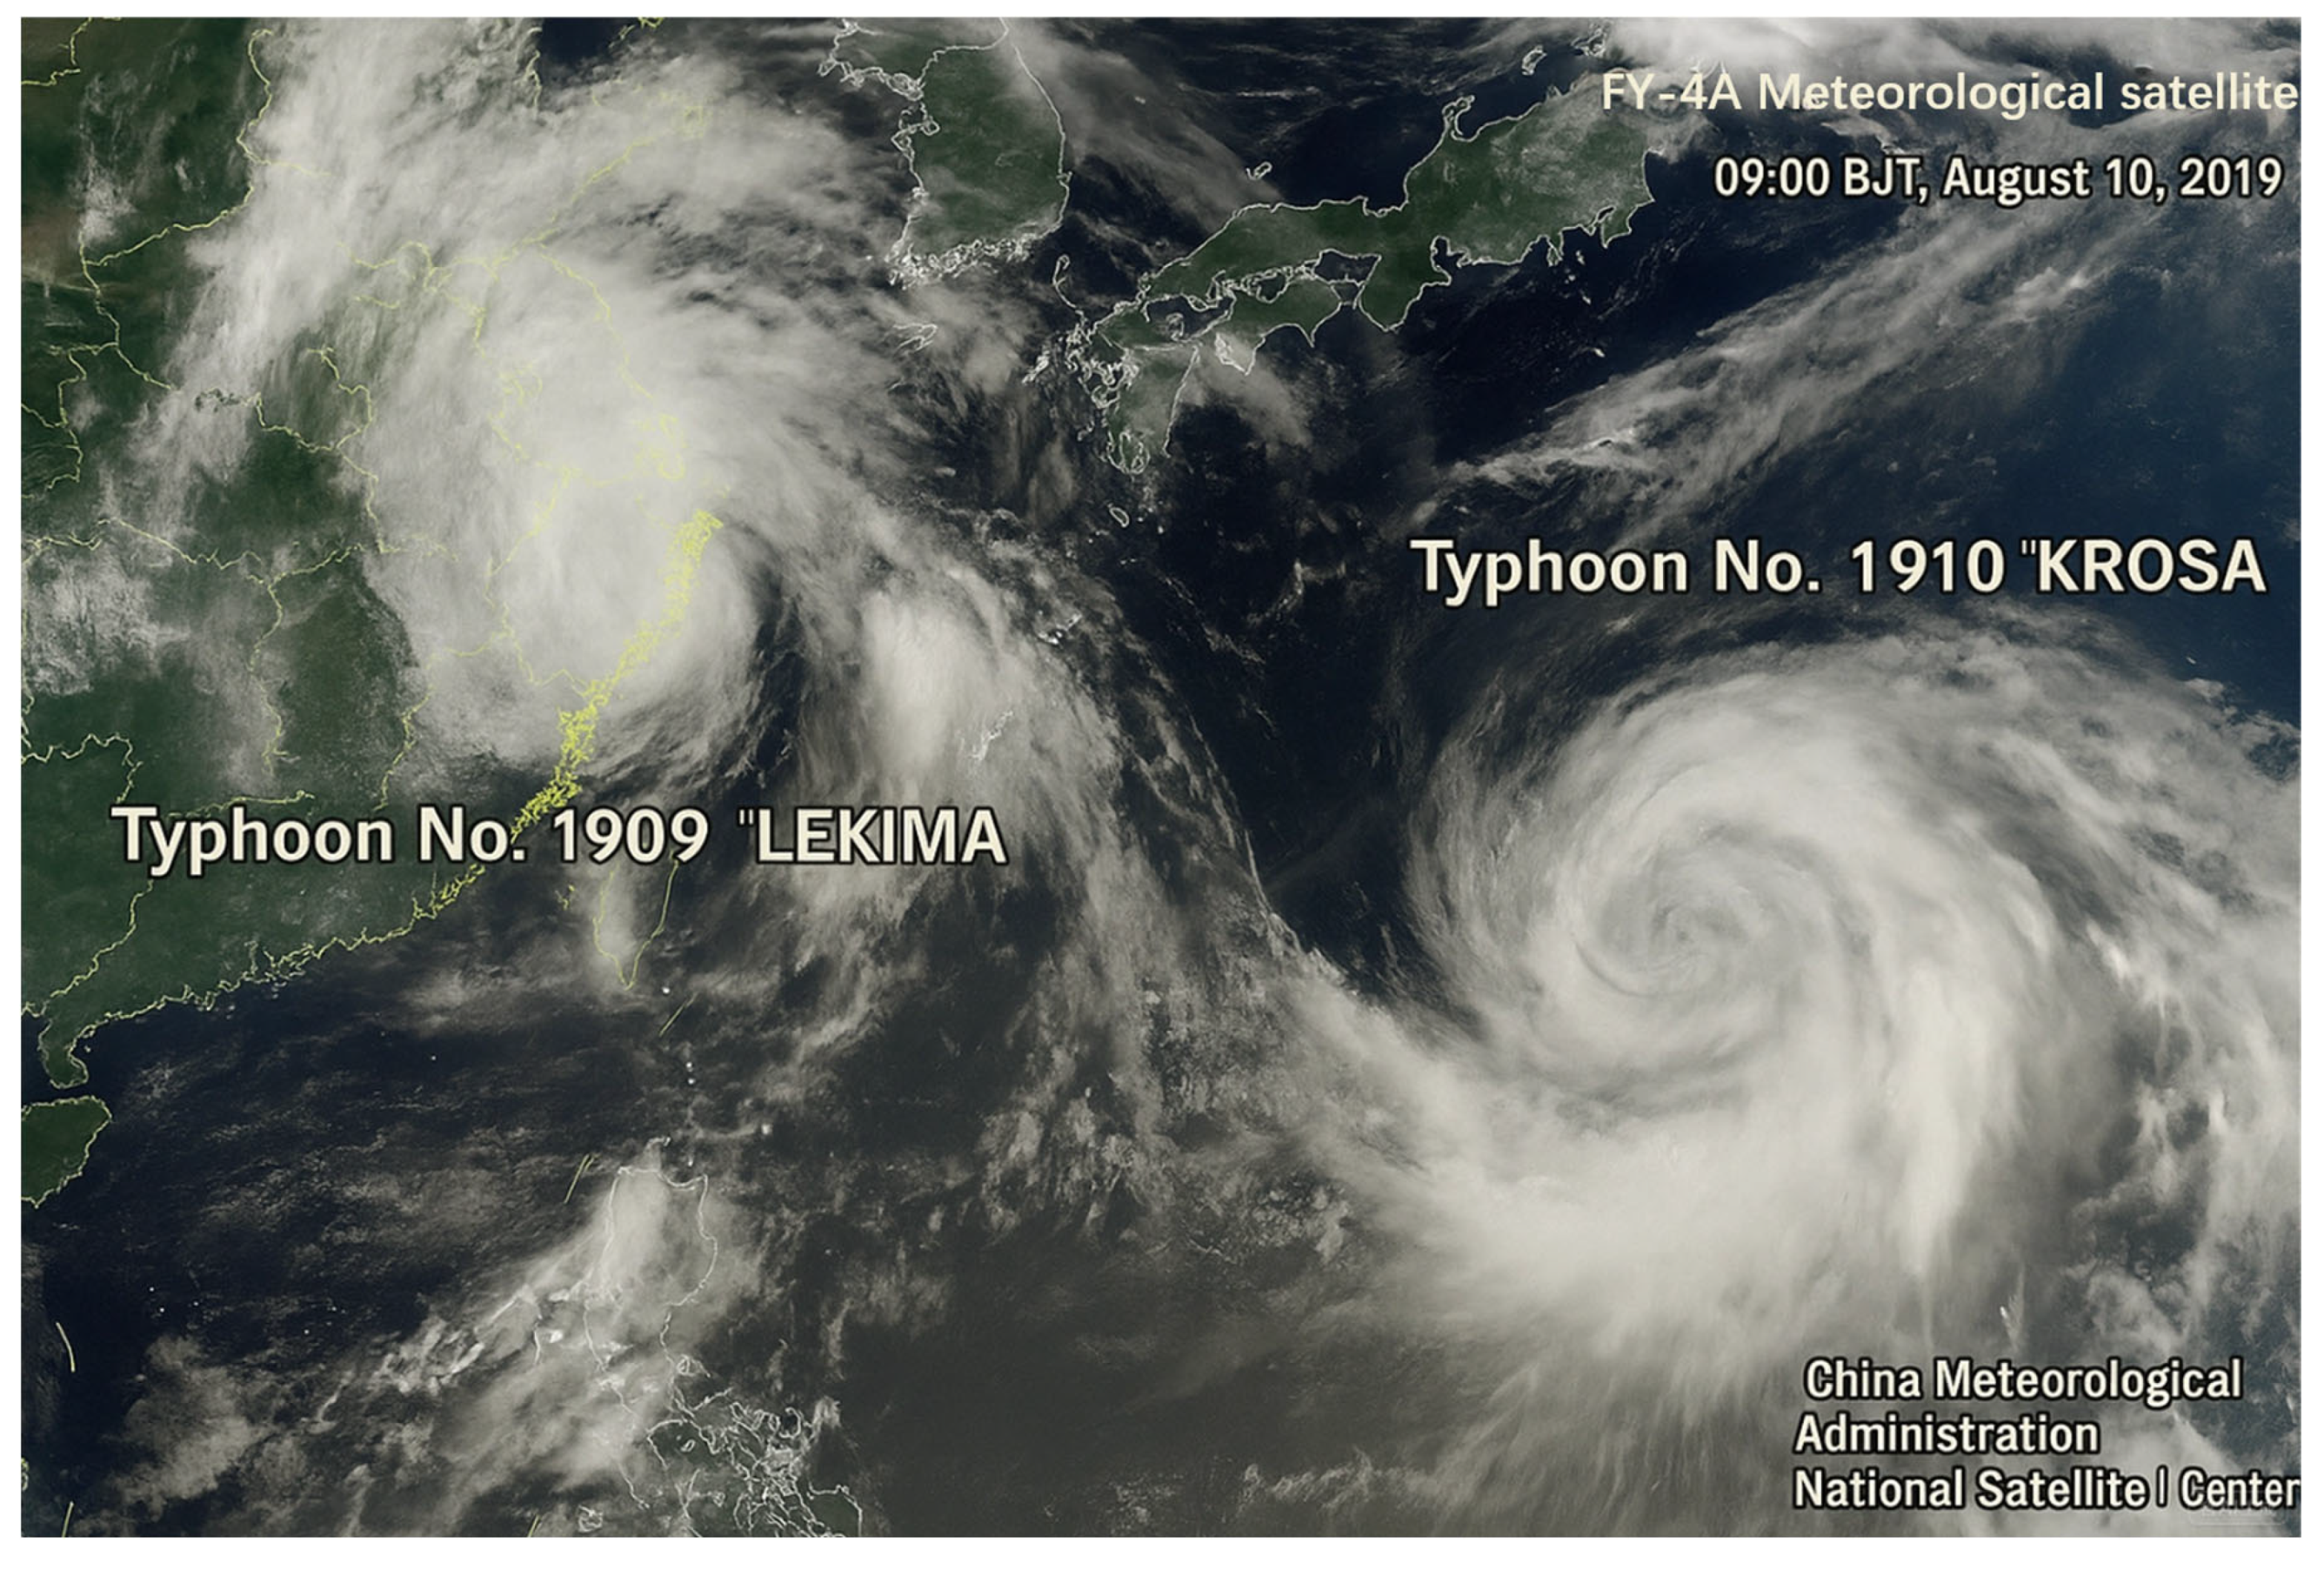
In August 2019, Typhoons “Lekima” and “Krosa” simultaneously impacted Asia. Typhoon “Lekima” formed over the sea east of Luzon Island, Philippines, was officially named at 15:00 (Beijing Time, BT) on August 4th, upgraded to a typhoon at 05:00 BT on August 7th, and further intensified to a super typhoon at 23:00 BT on August 7th. It continued moving northwest towards the coast of Zhejiang, China, making landfall in Zhejiang at 01:45 BT on August 10th, and finally dissipated on August 13th [
37]. “Krosa” was also a super typhoon, larger in scale than “Lekima” and carrying more precipitation, striking Japan forcefully on August 15th. On 10 August 2019, the NSMC released satellite true-color imagery at that time, as shown in
Figure 10.
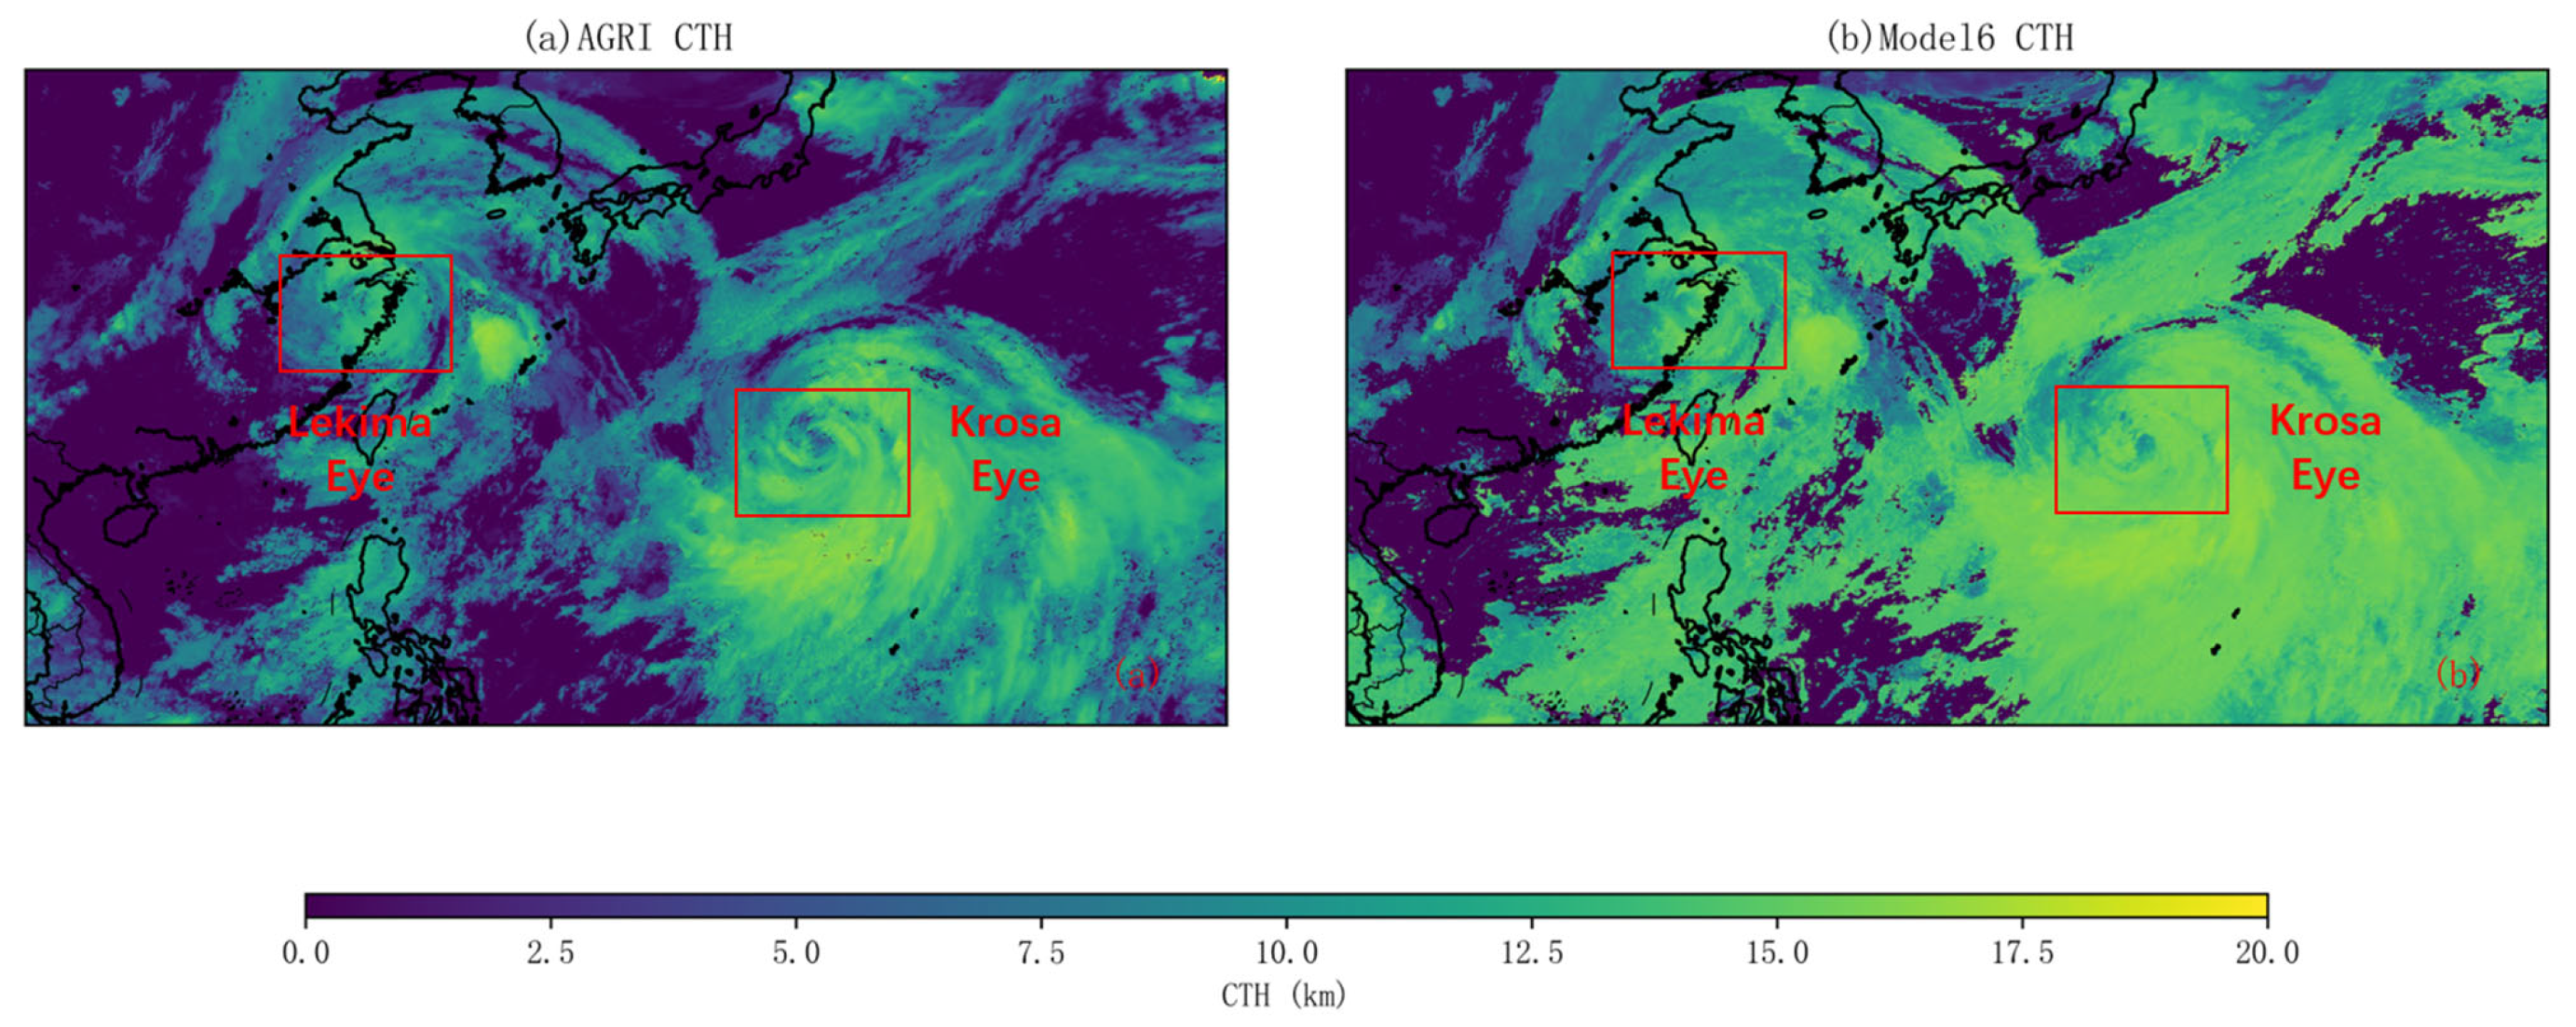
FY-4A, being a geostationary satellite, provides continuous and stable observations over most of the Eastern Hemisphere, delivering high-frequency, high-resolution data. The AGRI payload generates an image approximately every 15 min. This is particularly crucial for monitoring rapidly evolving weather systems like typhoons and rainstorms. Utilizing the trained multi-stage Model 6, CTH retrieval was performed for the “Lekima” and “Krosa” typhoons at 09:00 BT on 10 August 2019, within the typhoon study area. The results are shown in
Figure 11.
In
Figure 11, the typhoons’ eyes are identified. The red boxes indicate the locations of the typhoons’ eyes. The eye of “Krosa” is more distinct, characterized by a low-pressure center, indicating very low CTH levels at its center. In contrast, the eye of “Lekima” appears filled, lacking a distinct low-pressure center, signifying that “Lekima” was clearly in a weakening phase at this time. This distribution is relatively consistent with the cloud classification RGB composite image in
Figure 10. CTH values reach approximately 16–18 km. Overall, these maps clearly capture the main features of typhoons Lekima and Krosa, consistent with NSMC observations. This demonstrates that Model 6 is effective for typhoon CTH retrieval and is a useful tool for quantitative typhoon monitoring.
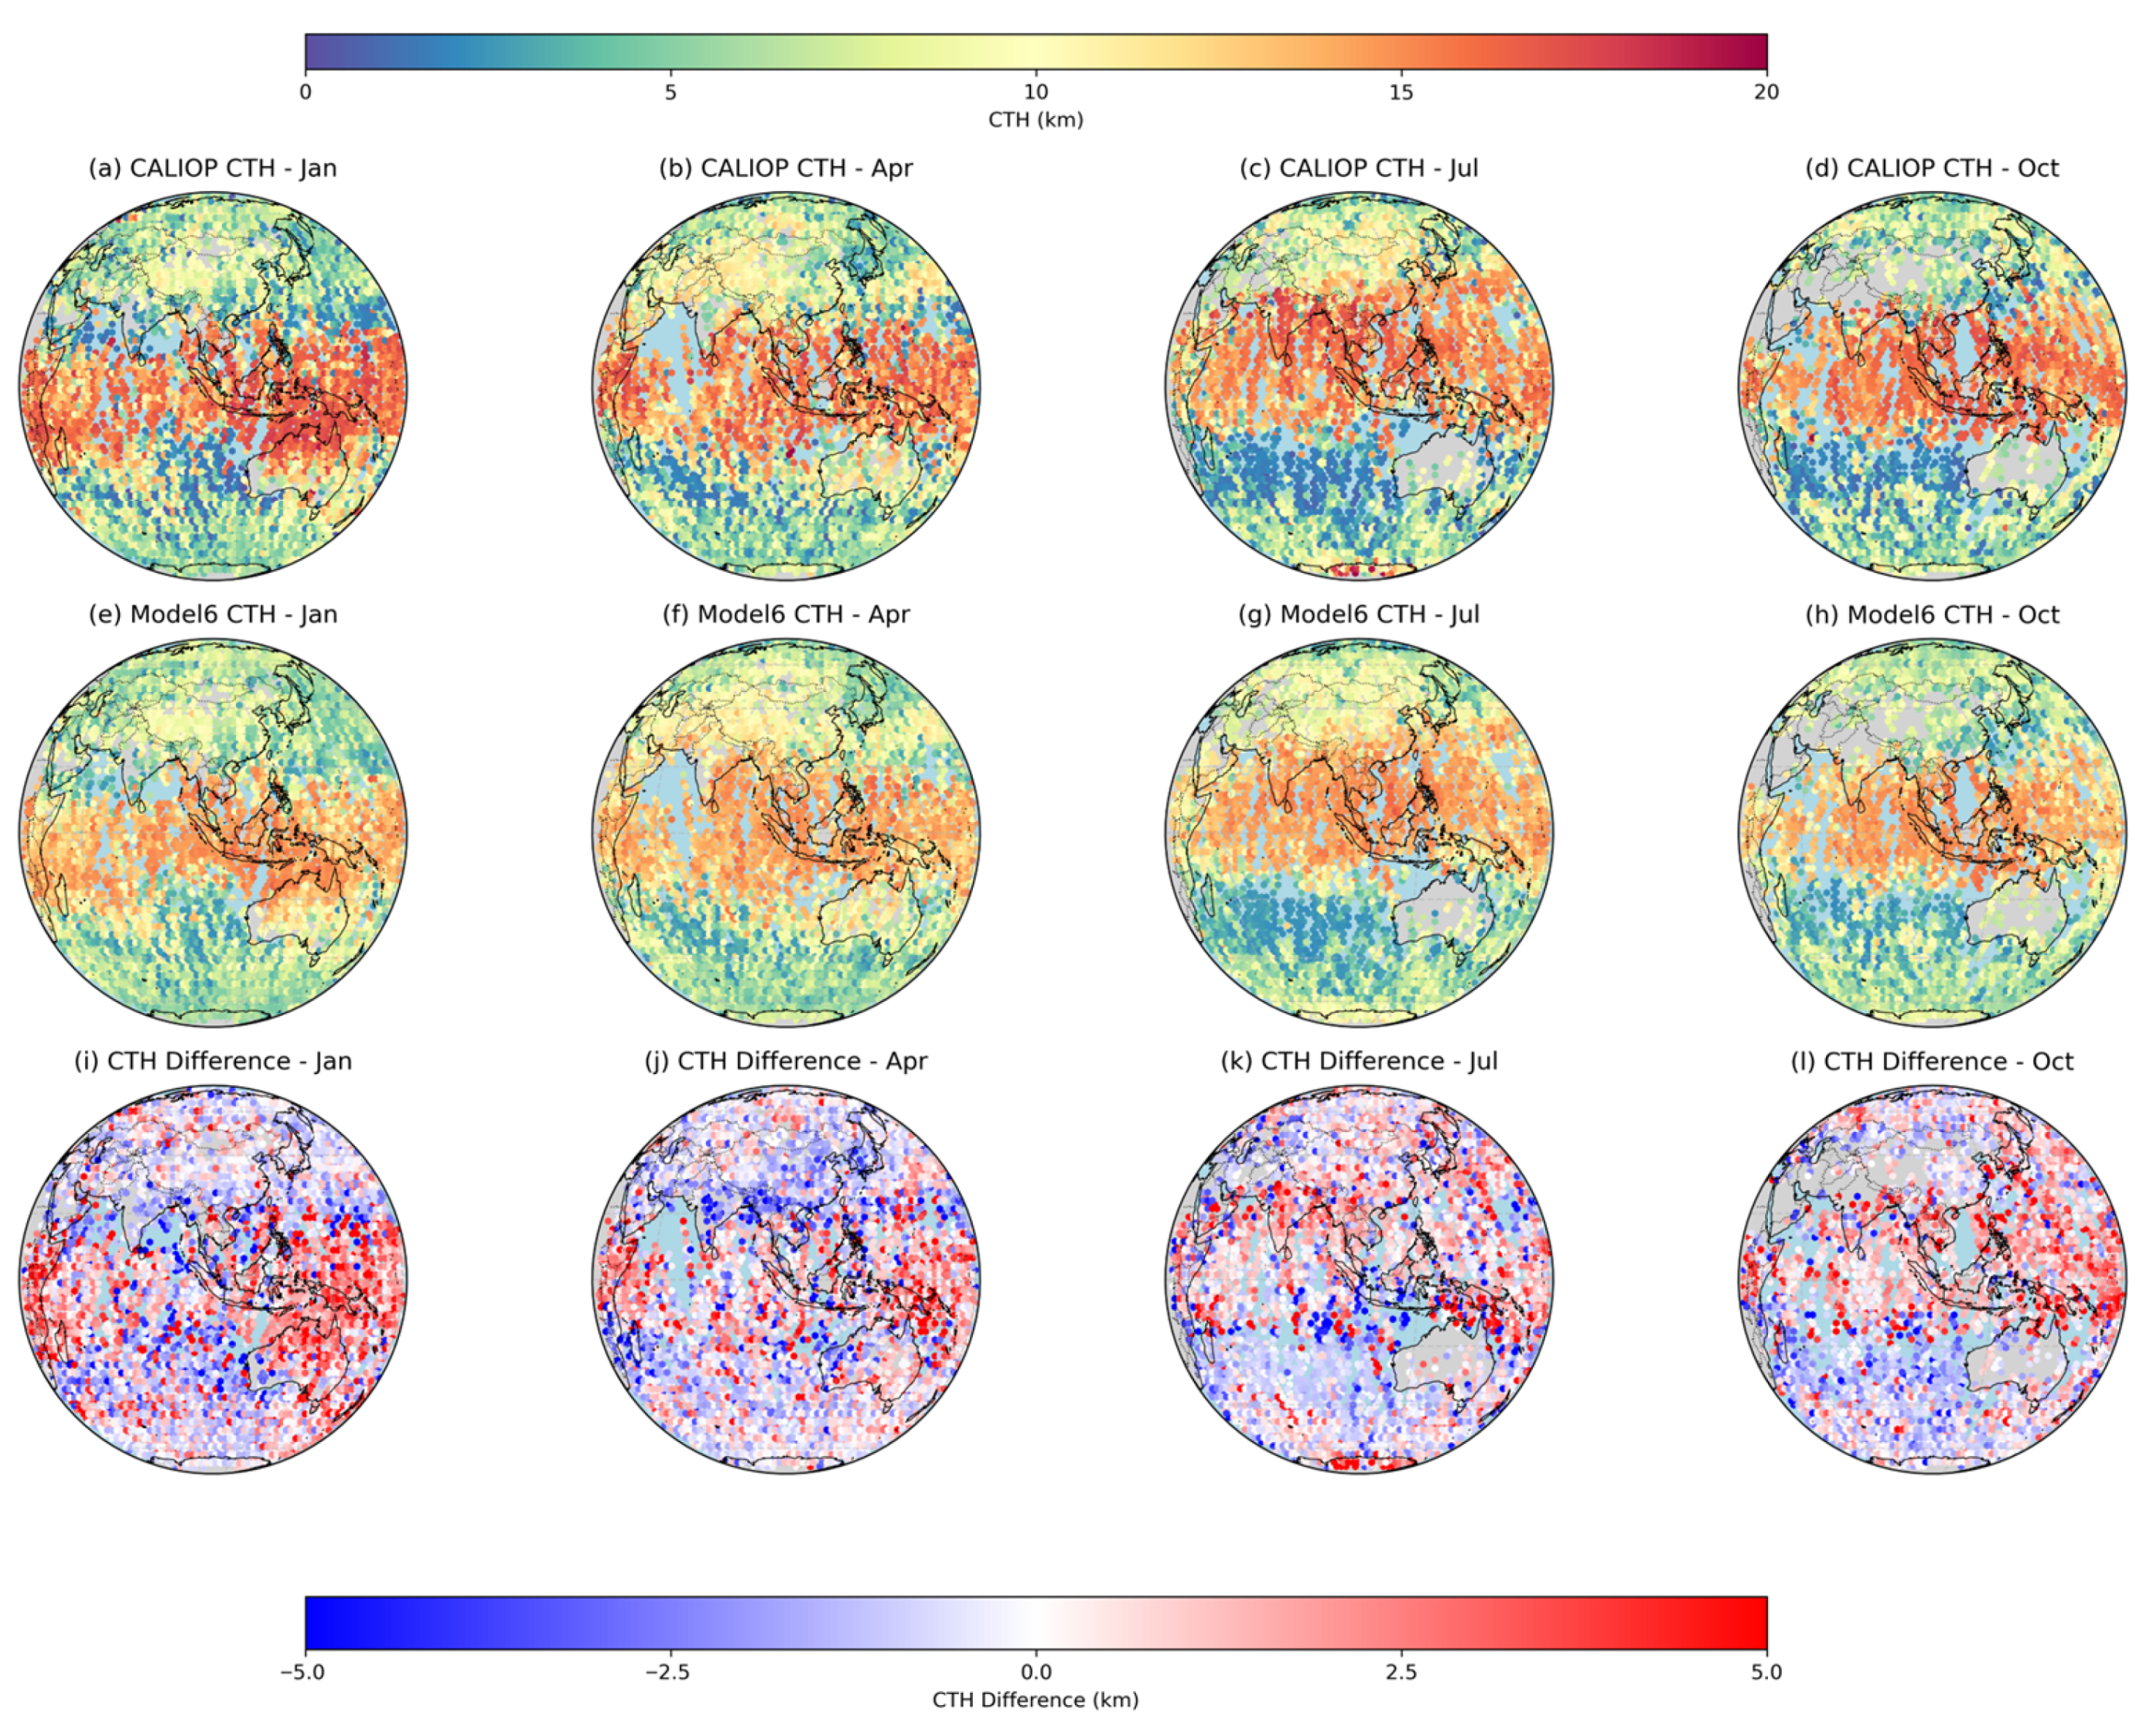
Figure 12 compares the spatial distribution of CALIOP-observed CTH and Model 6 predictions for January, April, July, and October 2021. The top row shows CALIOP truth, and the bottom row shows Model 6 predictions. The color scale represents CTH values in kilometers. CALIOP CTH exhibits prominent high values in tropical and mid–low-latitude regions, particularly near the equator in January and October, reflecting active convective activity in these areas. In contrast, Model 6 predictions show good overall consistency with the spatial distribution pattern of CALIOP, capturing seasonal variations and the locations of major cloud regions. For example, the high-cloud structures associated with the South Asian monsoon belt and the equatorial region in July are well reproduced in the Model 6 predictions. The range of extreme CTH values in the model predictions is slightly lower than CALIOP observations, with some regions showing a degree of underestimation. This may be related to limitations in the model’s ability to handle extreme samples or insufficient input feature information. Furthermore, the Model 6 predictions appear smoother overall, indicating an advantage in spatial continuity, but potentially at the cost of blurring local details.
In summary, Model 6 reproduces global CTH patterns well across seasons, showing strong spatial generalization and seasonal adaptability. It provides a promising framework for large-scale, spatially continuous cloud-top height retrieval from satellite observations.
5. Discussion and Conclusions
In this study, we proposed a Multi-Stage Deep Learning Framework integrating multi-source data fusion to retrieve cloud top height (CTH) from FY-4A/AGRI observations. The framework combines FY-4A Level 1 radiance and CALIPSO/CALIOP reference data to establish a nonlinear mapping between radiative features and cloud physical properties. By incorporating key cloud parameters, including thermal infrared brightness temperatures (Channels 9–14), cloud top temperature (CTT), and cloud top pressure (CTP), the model effectively learns complex inter-channel relationships through multiple progressive learning stages, thereby significantly improving high-level cloud top height accuracy. The proposed Model 6 achieved an RMSE of 2.90 km (49.48% lower than the official FY-4A product) and a PCC of 0.85 compared with CALIOP observations, confirming the advantages of multi-source feature fusion and deep learning in enhancing CTH retrieval accuracy. In particular, introducing difference and ratio combinations of Channels 12 and 13 improved the model’s sensitivity to cloud vertical structure, while the use of self-retrieved CTT/CTP inputs further reduced overall CTH bias relative to the operational AGRI product.
Regarding performance across cloud types, high-level clouds consistently exhibit the best retrieval accuracy, with the lowest error metrics and highest PCC values, indicating that their radiative characteristics are more effectively captured by the network. In contrast, low-level clouds present the largest errors and lowest correlations. This is mainly because the model does not include numerical weather prediction (NWP) data as input, making it difficult to accurately represent the temperature–altitude relationship in the lower troposphere. Consequently, the network can only rely on climatological statistical features learned from the training data, leading to degraded retrieval performance and larger uncertainties for low-level clouds. Mid-level clouds perform intermediately between these two extremes. Comparing all configurations, Model 6 achieves the best overall performance across all cloud types, confirming that the Multi-Stage Feature Integration Strategy effectively enhances cloud top height retrieval accuracy.
The case study of the dual typhoons “Lekima” and “Krosa” (August 2019) further demonstrated that the proposed model successfully captured the spatial distribution of CTH around typhoon eyes, revealing the intensification of “Krosa” and the weakening of “Lekima” through dynamic variations in CTH. The retrieved results show high consistency with monitoring data released by the National Satellite Meteorological Center (NSMC), highlighting the model’s potential for extreme weather applications.
Our findings are generally consistent with those of Cheng et al. [
12], who also employed CALIOP as reference data to train neural-network-based CTH retrieval models using MODIS observations. Both studies demonstrated that combining calibrated radiances with cloud parameters such as CTT and CTP significantly improves retrieval accuracy compared to using radiance data alone. Cheng et al. reported an overall PIrmse reduction of approximately 27% relative to the MODIS operational product, while our model achieved an RMSE reduction of nearly 49% relative to the FY-4A/AGRI baseline. Although the absolute magnitudes of these improvements are not directly comparable due to differences in satellite sensors, baseline product definitions, and collocation procedures, the two studies consistently highlight the critical role of CTT and CTP in enhancing CTH retrievals. Both also indicate that high-level clouds benefit the most from the proposed deep learning framework, while low-level clouds remain more challenging.
Although the proposed framework performs well in most scenarios, a slight underestimation remains for extremely deep convective clouds, likely due to incomplete representation of their spectral characteristics in the input features. The accuracy for low-level clouds could be further improved by incorporating vertical temperature profiles or auxiliary parameters from NWP or reanalysis datasets in future work. Overall, the model’s performance (RMSE ≈ 2.9 km) is within the same order of magnitude as results from other satellite-based CTH retrieval systems, such as the Himawari ACHA algorithm (RMSE ≈ 2.3 km; Huang et al. [
39]). It should be noted that the ACHA validation in [
39] was not restricted to single-layer CALIOP clouds; instead, it included both single- and multi-layer scenes from the CALIOP Level-2 1 km cloud-layer product. Consequently, the RMSE difference between the two studies partly reflects variations in sample selection and filtering criteria. Although the accuracy is slightly lower, the proposed Multi-Stage Deep Learning Framework effectively demonstrates the feasibility and potential of FY-4A–based deep learning for operational cloud top height retrieval. Unlike the official FY-4A algorithm, which relies on iterative optimal estimation combined with numerical weather prediction data, the proposed method directly retrieves CTH from radiance inputs through a forward neural network computation. This design streamlines the retrieval workflow and improving both retrieval accuracy and computational efficiency.
