Article

Analysis of Consecutive Dry Days in the MATOPIBA Region During the Rainy and Dry Seasons

by
Daniele Tôrres Rodrigues
1,2,*,
Flavia Ferreira Batista
3,
Lara de Melo Barbosa Andrade
2,
Helder José Farias da Silva
4,
Jório Bezerra Cabral Júnior
5,
Marcos Samuel Matias Ribeiro
6,
Jean Souza dos Reis
7,
Josiel dos Santos Silva
5,
Fabrício Daniel dos Santos Silva
4 and
Claudio Moisés Santos e Silva
2
1
Department of Statistic, Federal University of Piauí, Teresina 64049-550, Brazil
2
Climate Sciences Post-Graduate Program, Federal University of Rio Grande do Norte, Natal 59078-970, Brazil
3
Federal Institute of Espírito Santo (IFES), Presidente Kennedy Campus, Presidente Kennedy 29350-000, Brazil
4
Institute of Atmospheric Sciences, Federal University of Alagoas, Maceió 57072-970, Brazil
5
Institute of Geography, Development and Environment, Federal University of Alagoas, Maceió 57072-970, Brazil
6
Paragominas Campus, Federal University of Rural of Amazônia, Paragominas 68627-451, Brazil
7
Center for Data and Knowledge Integration for Health (CIDACS), Oswaldo Cruz Foundation (Fiocruz), Salvador 41745-715, Brazil
*
Author to whom correspondence should be addressed.
Atmosphere 2025, 16(11), 1284; https://doi.org/10.3390/atmos16111284
Submission received: 1 October 2025 / Revised: 29 October 2025 / Accepted: 6 November 2025 / Published: 11 November 2025
(This article belongs to the Section Climatology)

Abstract

Climate change and its impacts on precipitation patterns have intensified the occurrence of prolonged dry periods in agricultural regions of Brazil, particularly in the MATOPIBA region (comprising the states of Maranhão, Tocantins, Piauí, and Bahia). This study analyzes the seasonal variability and trends of the Consecutive Dry Days (CDDs) index in the MATOPIBA region from 1981 to 2023. Daily precipitation data from the Brazilian Daily Weather Gridded Data (BR-DWGD) dataset were used for the analysis. The novelty of this work lies in its focus on the seasonal characterization of CDD across the entire MATOPIBA field of agriculture, addressing the following main research question: how have the frequency and persistence of dry spells evolved during the rainy and dry seasons over the past four decades? The methodology involved trend detection using the Mann–Kendall test and Sen’s Slope estimator. The results indicated that during the rainy season, the average CDD ranged from 20 to 60 days, with higher values concentrated in the states of Piauí and Bahia. In contrast, during the dry period, averages exceeded 100 days across most of the region. Trend analysis revealed a significant increase in CDD over extensive areas, particularly in Tocantins and Southern Bahia. The increasing trends were estimated at 1 to 4 days per decade during the rainy season and 4 to 14 days per decade in the dry period. Although a decreasing CDD trend was observed in small areas of Northern Maranhão, possibly associated with the influence of the Intertropical Convergence Zone, the overall scenario indicates a greater persistence of long dry spells. This pattern suggests an increase in vulnerability to water scarcity and agricultural losses. These findings highlight the need for implementing adaptation strategies, such as the use of drought-tolerant cultivars, conservation management practices, irrigation expansion, and public policies aimed at promoting climate resilience in the MATOPIBA region.

1. Introduction

Climate variability and the occurrence of extreme precipitation events have gained increasing relevance in recent decades, occupying a central position in scientific, economic, and social discussions [1,2,3,4,5]. This prominence is even more evident in tropical regions, where marked rainfall seasonality combines with high levels of socioeconomic vulnerability [6,7]. In the context of global climate change, projections indicate rising air temperatures, alterations in precipitation patterns, and an intensification of extreme events such as prolonged droughts and intense rainfall episodes, particularly in tropical and semi-arid regions of Brazil [1,2,3]. These changes have direct impacts on evapotranspiration rates, soil moisture, and agricultural productivity, increasing the frequency of water deficits and hydrological stress. In the Brazilian Semi-Arid Region (SAB), these effects are recurrent and directly affect essential sectors such as rainfed agriculture, water supply, and food security [6,8].
Among the several indicators used to assess precipitation-related extremes, the maximum number of consecutive dry days (CDD) plays a key role, especially in agricultural regions where prolonged dry periods directly affect crop productivity. While other indices describe rainfall intensity and frequency, the CDD uniquely captures the persistence of dry conditions—a critical factor in regions where rainfed agriculture predominates, such as MATOPIBA. This index has been widely applied in climatological and agrometeorological studies because it effectively characterizes the duration of dry spells and their influence on soil moisture, water balance, and agricultural yield [4,5]. Its importance becomes even more evident in tropical and semi-arid regions, where rising air temperatures and shifts in precipitation regimes intensify drought conditions and hydrological stress [1,2]. Despite the existence of other well-established indices, few studies have analyzed in detail the spatial and temporal dynamics of the CDD in the MATOPIBA region, where understanding these prolonged dry spells is essential for managing agricultural risk and ensuring productivity resilience.
In addition to CDD, several other indices are commonly used to describe precipitation extremes and variability, such as the annual total precipitation on wet days (PRCPTOT), the number of days with precipitation ≥10 mm (R10 mm) and ≥20 mm (R20 mm), the maximum one-day (RX1day) and five-day (RX5day) precipitation amounts, and the simple daily intensity index (SDII) [2,4,6]. These indices collectively contribute to understanding rainfall behavior under climate change scenarios. However, the CDD remains essential because it reflects the persistence of dry conditions, which is a critical factor in evaluating drought risk and water availability across agricultural frontiers such as the MATOPIBA region [7].
The MATOPIBA region is established as the main expanding agricultural area in Brazil [8], despite being located in an area with strong trends in the occurrence and intensification of drought events [9]. Simultaneously, MATOPIBA encompasses 337 municipalities and, although it represents only 12% of the national territory, it accounts for approximately 11% of the national grain production, with emphasis on soybeans, corn, cotton, and beans [10,11]. Despite the region’s growing agricultural relevance, MATOPIBA is located in an area prone to high climatic variability, with increasing frequency and duration of dry spells. This makes the CDD index particularly relevant, as it provides direct insights into soil moisture deficits that influence soybean yield and crop resilience under water stress conditions.
In 2022, MATOPIBA produced over 36 million tons of grains, accounting for 12% of the country’s soybean production, in addition to recording one of the highest agricultural production growth rates compared to other regions [11]. It is noteworthy that, according to the United States Department of Agriculture, soybeans represented approximately 69% of all vegetable protein produced worldwide [12], thus making it one of the main global commodities [13]. This global relevance of soybeans has one of its most dynamic and strategic hubs for expansion and global food security in MATOPIBA. However, the high dependence of this and other rainfed crops on the seasonal rainfall regime makes a thorough understanding of CDD an indispensable tool for planning and risk management in the region.
In this context, understanding the behavior of this index during the rainy season that marks the annual agricultural cycle is not merely a scientific question, but a strategic necessity to ensure the economic sustainability and resilience of one of Brazil’s most important productive ecosystems. The rainy season in MATOPIBA occurs from November to April across most of the region [14]. During this interval, even short dry spells can compromise crop development, especially during the germination, flowering, and grain-filling stages, which can result in significant productivity losses and increased economic vulnerability for both smallholder farmers and large producers [15,16]. An increase in the frequency or duration of CDD during this period can lead to, for example, flower abortion, a reduction in the number of pods and grains, or even total crop loss [17,18]. Conversely, prior knowledge of CDD patterns can assist farmers and public managers in planning harvests, staggering planting schedules, and selecting cultivars more resilient to fluctuations in the water regime [19,20].
This study analyzed the behavior of the CDD index in the MATOPIBA region from 1 January 1981 to 31 December 2023, using daily precipitation data from the interpolated Brazilian Daily Weather Gridded Data (BR-DWGD) dataset [21]. The BR-DWGD provides a high-resolution (~10 km) gridded precipitation product derived from the interpolation of station data from multiple national networks, including INMET, ANA, and CEMADEN. The dataset undergoes rigorous quality control and is updated regularly, providing complete spatial coverage for the study area throughout the analyzed period. The research was conducted in two main stages: (i) estimation of average CDD values for the rainy and dry periods to characterize seasonal variability, and (ii) trend analysis using the Mann–Kendall test and Sen’s Slope estimator to identify areas with statistically significant changes in the occurrence of consecutive dry days. The novelty of this study lies in providing a comprehensive seasonal assessment of dry spell persistence across the MATOPIBA, an agricultural area, a topic that has received limited attention in previous research. The main research question focuses on how the frequency and persistence of dry periods have evolved over the past four decades under changing climate conditions. The results, organized into thematic maps, allow for the visualization of spatial and temporal patterns and trends, offering quantitative and qualitative insights into the intensification of drought conditions. The findings contribute to a better understanding of drought dynamics in MATOPIBA, providing essential information to support climate adaptation strategies and guiding public policies related to agricultural management, water resources, and social resilience.

2. Materials and Methods

2.1. Study Area

The MATOPIBA region is located between latitudes 2° S and 15° S and longitudes 42° W and 50° W (Figure 1), encompassing 337 municipalities with an estimated population of approximately 8 million inhabitants [22]. Its territory is part of both the Legal Amazon and the Brazilian Semi-Arid region, distributed across the states of Maranhão (33%), Tocantins (38%), Southwestern Piauí (11%), and Northwestern Bahia (18%), totaling approximately 74 million hectares [23,24]. Although it corresponds to about 12% of the national territory, MATOPIBA stands out for its significant contribution to Brazil’s agricultural production, establishing itself as one of the main expanding agricultural areas in the 21st century [8].
The region’s predominant climate is tropical with a dry winter (Aw), according to the Köppen classification, with mean monthly temperatures between 25 °C and 27 °C and annual precipitation ranging from 800 mm to 2000 mm, distributed in two well-defined seasons: the dry season (May to September) and the rainy season (October to April) [25]. The regional rainfall regime is primarily influenced by the positioning of the Intertropical Convergence Zone (ITCZ) as described by Utida et al. [26], and by the formation of the South Atlantic Convergence Zone (SACZ) [27]. Furthermore, frontal systems can reach the northern part of MATOPIBA [28]. The predominant vegetation is typical of the Cerrado biome, covering about 91% of the total area. There are also remnants of the Amazon Rainforest (7%) and the Caatinga biome (2%) [29].
Despite its high productive potential, the MATOPIBA region faces structural and socioeconomic challenges of great magnitude. Several microregions exhibit low Human Development Index (HDI) scores, limited water infrastructure, and high vulnerability to extreme climate events [2,30]. In this context, characterizing the behavior of the CDD index during both the dry and rainy periods plays a fundamental role by providing input for the formulation of public policies for climate change adaptation, in addition to guiding strategies for agricultural planning, water resource management, and mitigation of risks arising from climate variability.

2.2. Database

This study used daily precipitation data from the BR-DWGD dataset, provided at a spatial resolution of approximately 10 km × 10 km. This database results from the interpolation of observations obtained by an extensive national climate monitoring network, comprising 1252 weather stations (642 conventional and 610 automatic) and 11,473 rain gauges distributed across Brazil [21]. The interpolation process was performed using Inverse Distance Weighting (IDW) and Angular Distance Weighting (ADW) methods, which showed satisfactory performance in cross-validation tests [31].
For the spatial domain corresponding to MATOPIBA, 6019 pixels were selected, containing daily precipitation series for the period from 1 January 1981 to 31 December 2023, totaling 43 years of continuous data. This spatial and temporal density provides robustness to the analyses of the CDD index, enabling the investigation of its spatiotemporal variability [32,33]. The files, provided in Network Common Data Form (NetCDF), facilitate integration into different climate and geospatial analysis platforms. These data have been widely applied in recent studies on climate variability and analysis of climate extremes in Brazil [34,35].

2.3. Methodological Procedures

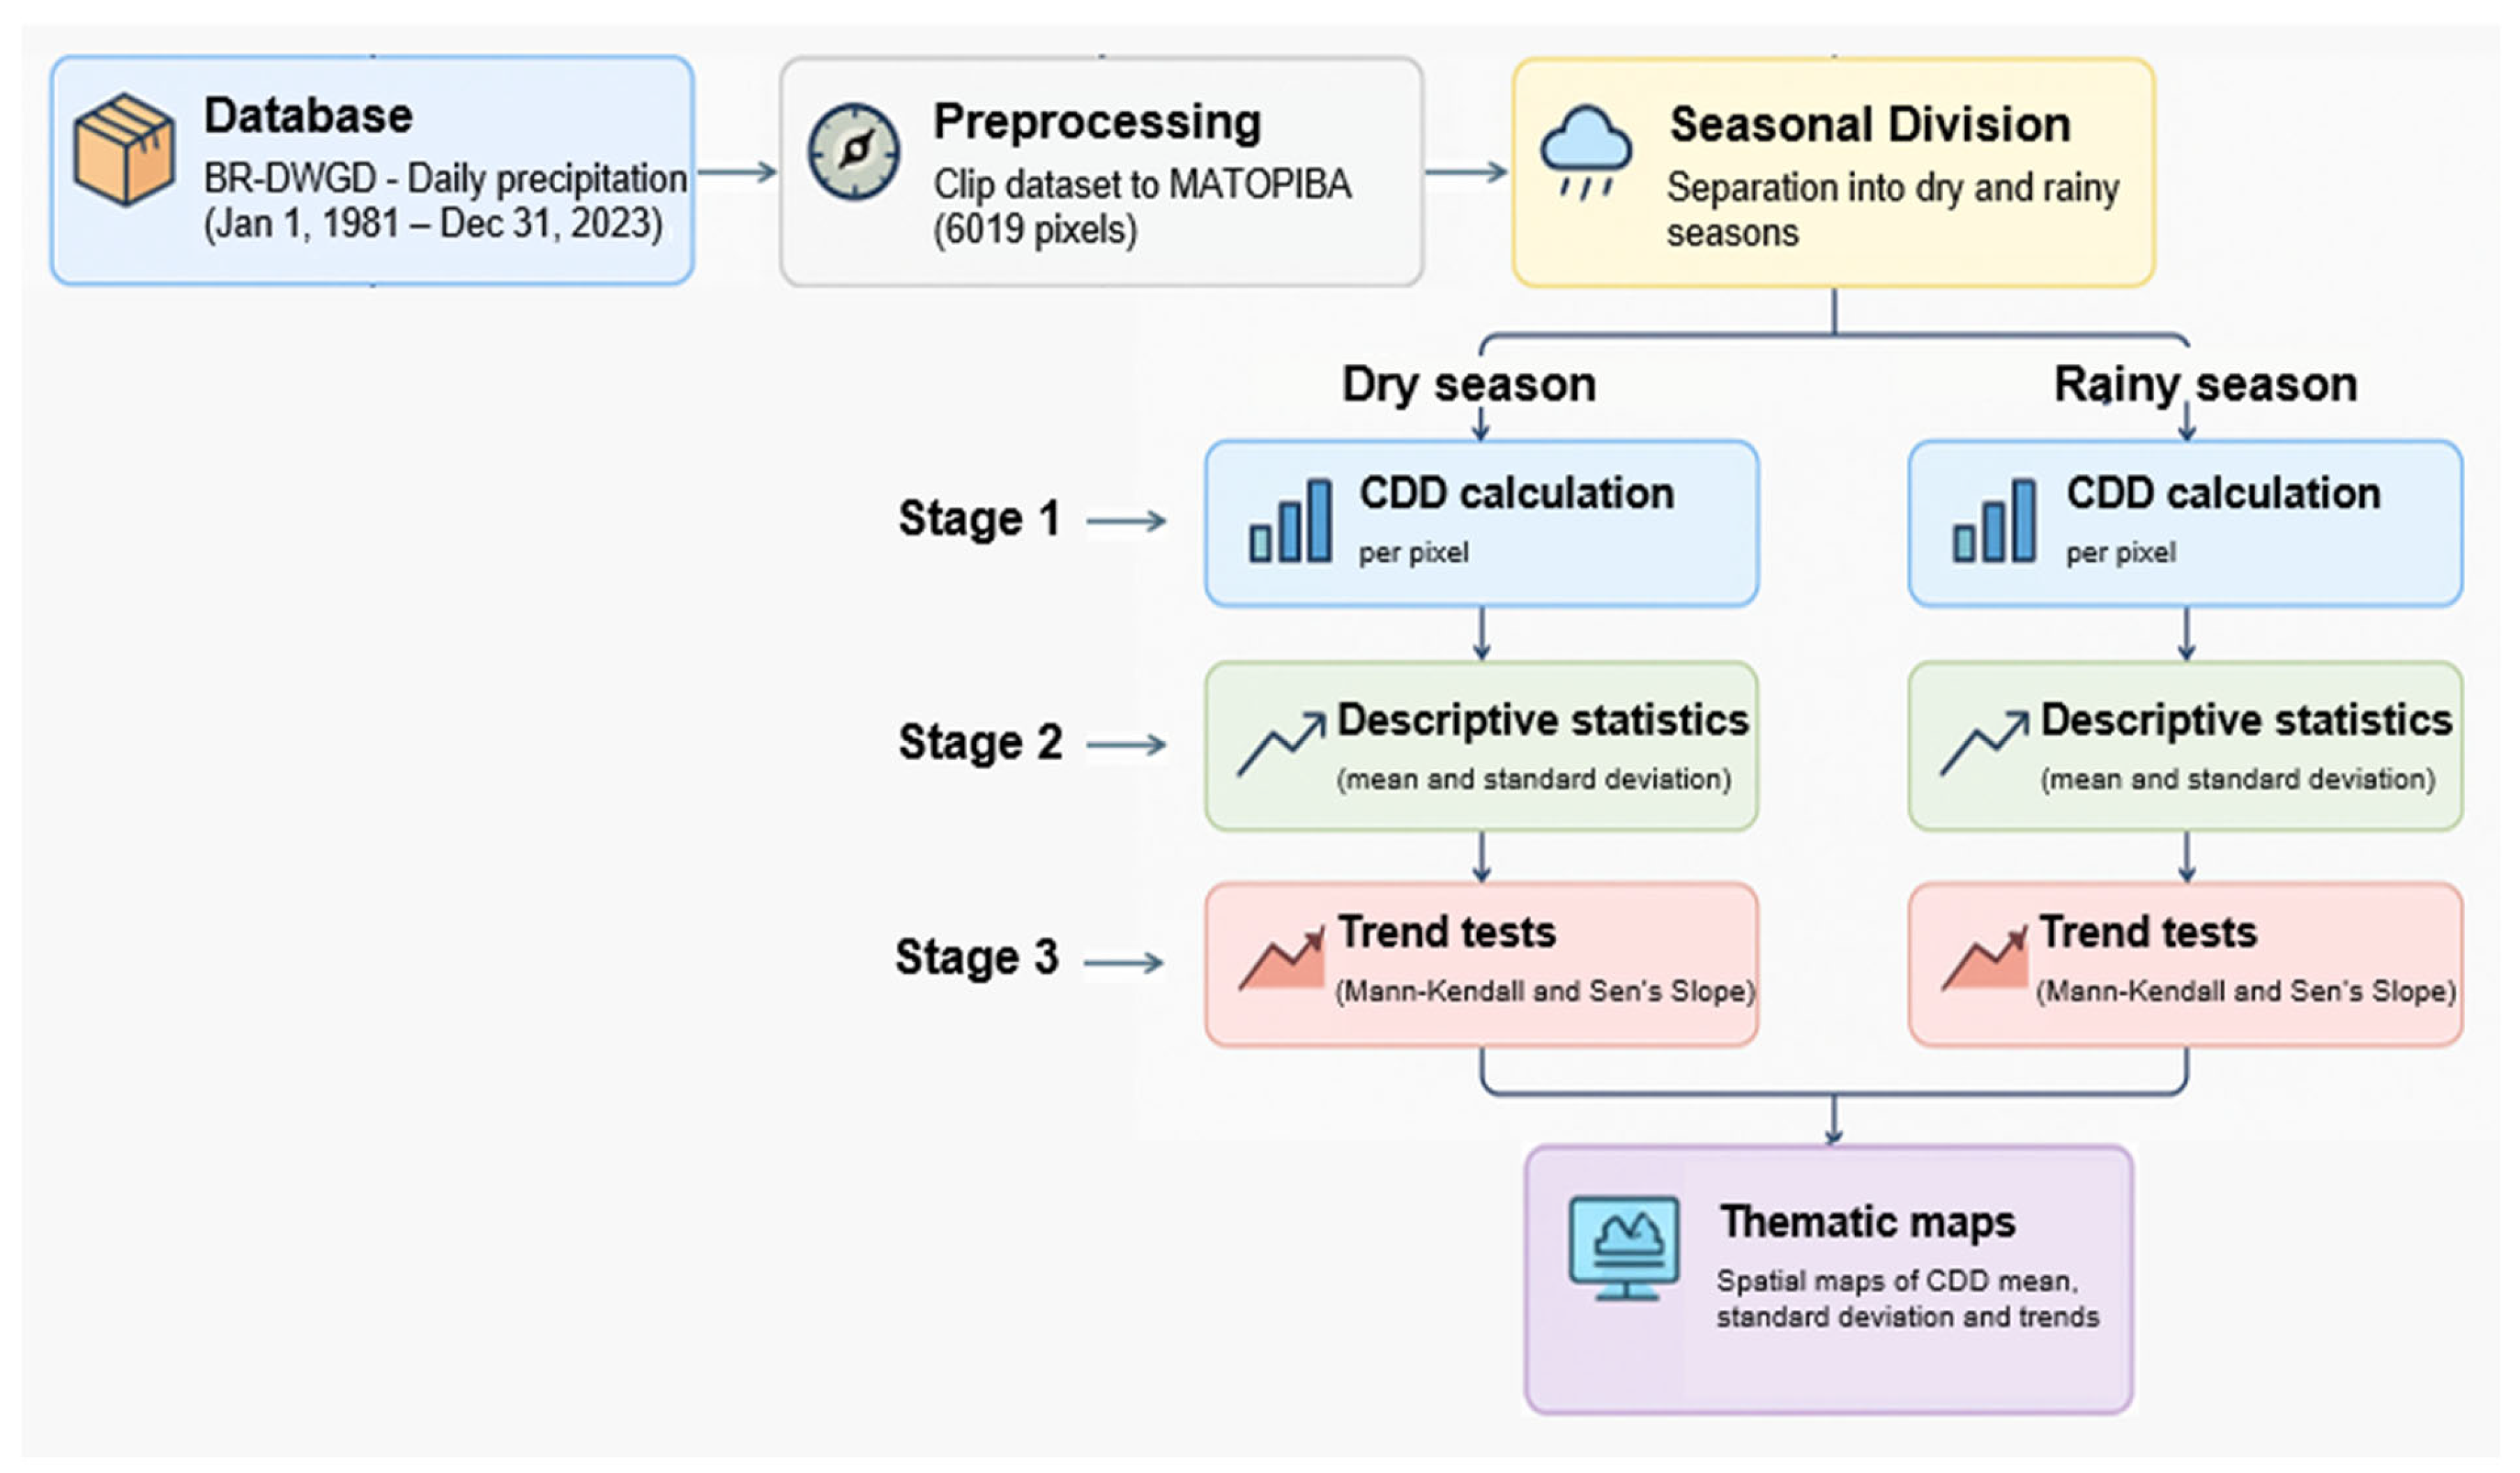
The methodological framework adopted in this study is summarized in Figure 2, which illustrates the overall workflow developed to ensure a consistent and detailed assessment of the temporal and spatial behavior of consecutive dry days across the MATOPIBA region. The analysis was structured into three main stages. In the first stage, the CDD index was calculated for each grid point within the study area, separately for the rainy and dry seasons, using daily precipitation data from 1981 to 2023. The second stage involved the computation of descriptive statistics for both precipitation and CDD, including the mean and standard deviation, which are summarized in Table 1. Finally, in the third stage, the trend analysis of the CDD index was conducted using the Mann–Kendall test and Sen’s Slope estimator, allowing the identification of statistically significant trends of CDD across the region.
The CDD index represents the maximum number of consecutive dry days (with daily precipitation less than 1 mm) within a given time interval [3]. The calculation was performed for each of the 6019 pixels, considering two seasonal periods: the rainy season (November to April) and the dry season (May to October), based on the regional climate pattern. To investigate potential changes in CDD behavior over time, the Mann–Kendall test was applied.

2.3.1. Mann–Kendall Test

This is a non-parametric method used to identify trends in time series. It assesses whether there is a monotonic trend (increase or decrease) in the data over time. To perform the Mann–Kendall test, the S statistic was calculated, which is defined by Equation (3), where x i and x j are the values of the time series at times i and j , respectively; and s g n ( x j x i ) is the sign function, defined ass + 1 if x j x i > 0 ;   0 if x j x i = 0 ;   a n d   1 if x j x i < 0 .
S = i = 1 n 1 j = i + 1 n s g n x j x i
The S statistic measures the number of pairs ( x i , x j ) where x j is greater than x i (contributing positively to S ) or where x j is less than x i (contributing negatively to S ). After calculating S , the p-value of the test is obtained by comparing S with its distribution under the null hypothesis of no trend. For time series with a significant amount of data, a normal approximation can be used, given by Equation (4).
Z = S σ S
where σ S is the standard deviation of S under the null hypothesis. If the p-value associated with the test statistic is less than the significance level (in this study, 0.05), the null hypothesis is rejected, indicating the presence of a significant trend.

2.3.2. Sen’s Slope

To quantify the slope of the trend detected by the Mann–Kendall test, Sen’s Slope statistic was used. This measure provides the slope of the trend line, indicating the annual rate of change in CDD. According to Sen [36], Sen’s slope estimator is a robust and widely used method for estimating the slope of a trend in environmental time series.
Sen’s Slope estimator is based on calculating the slope of all possible lines formed by pairs of points in a time series; that is, it represents the median rate of change between all pairs of data points. The equation for Sen’s Slope estimator is given by Equation (5), where x i and x j are the values of the time series at times i and j , respectively. x j x i j i is the slope of the line connecting points ( i , x i ) and ( j , x j ) . The median is calculated over all possible slopes formed by pairs of points.
Q = m e d i a n x j x i j i f o r   a l l   i < j
Sen’s Slope method is robust against outliers and non-normal distributions. It is a non-parametric approach that provides an estimate of the trend slope that is not influenced by the assumption of data normality or by extreme values. The advantage of this method is that it considers all possible combinations of point pairs in the time series, making it a reliable measure of central tendency.

3. Results and Discussion

3.1. Temporal and Spatial Characterization of CDD in MATOPIBA

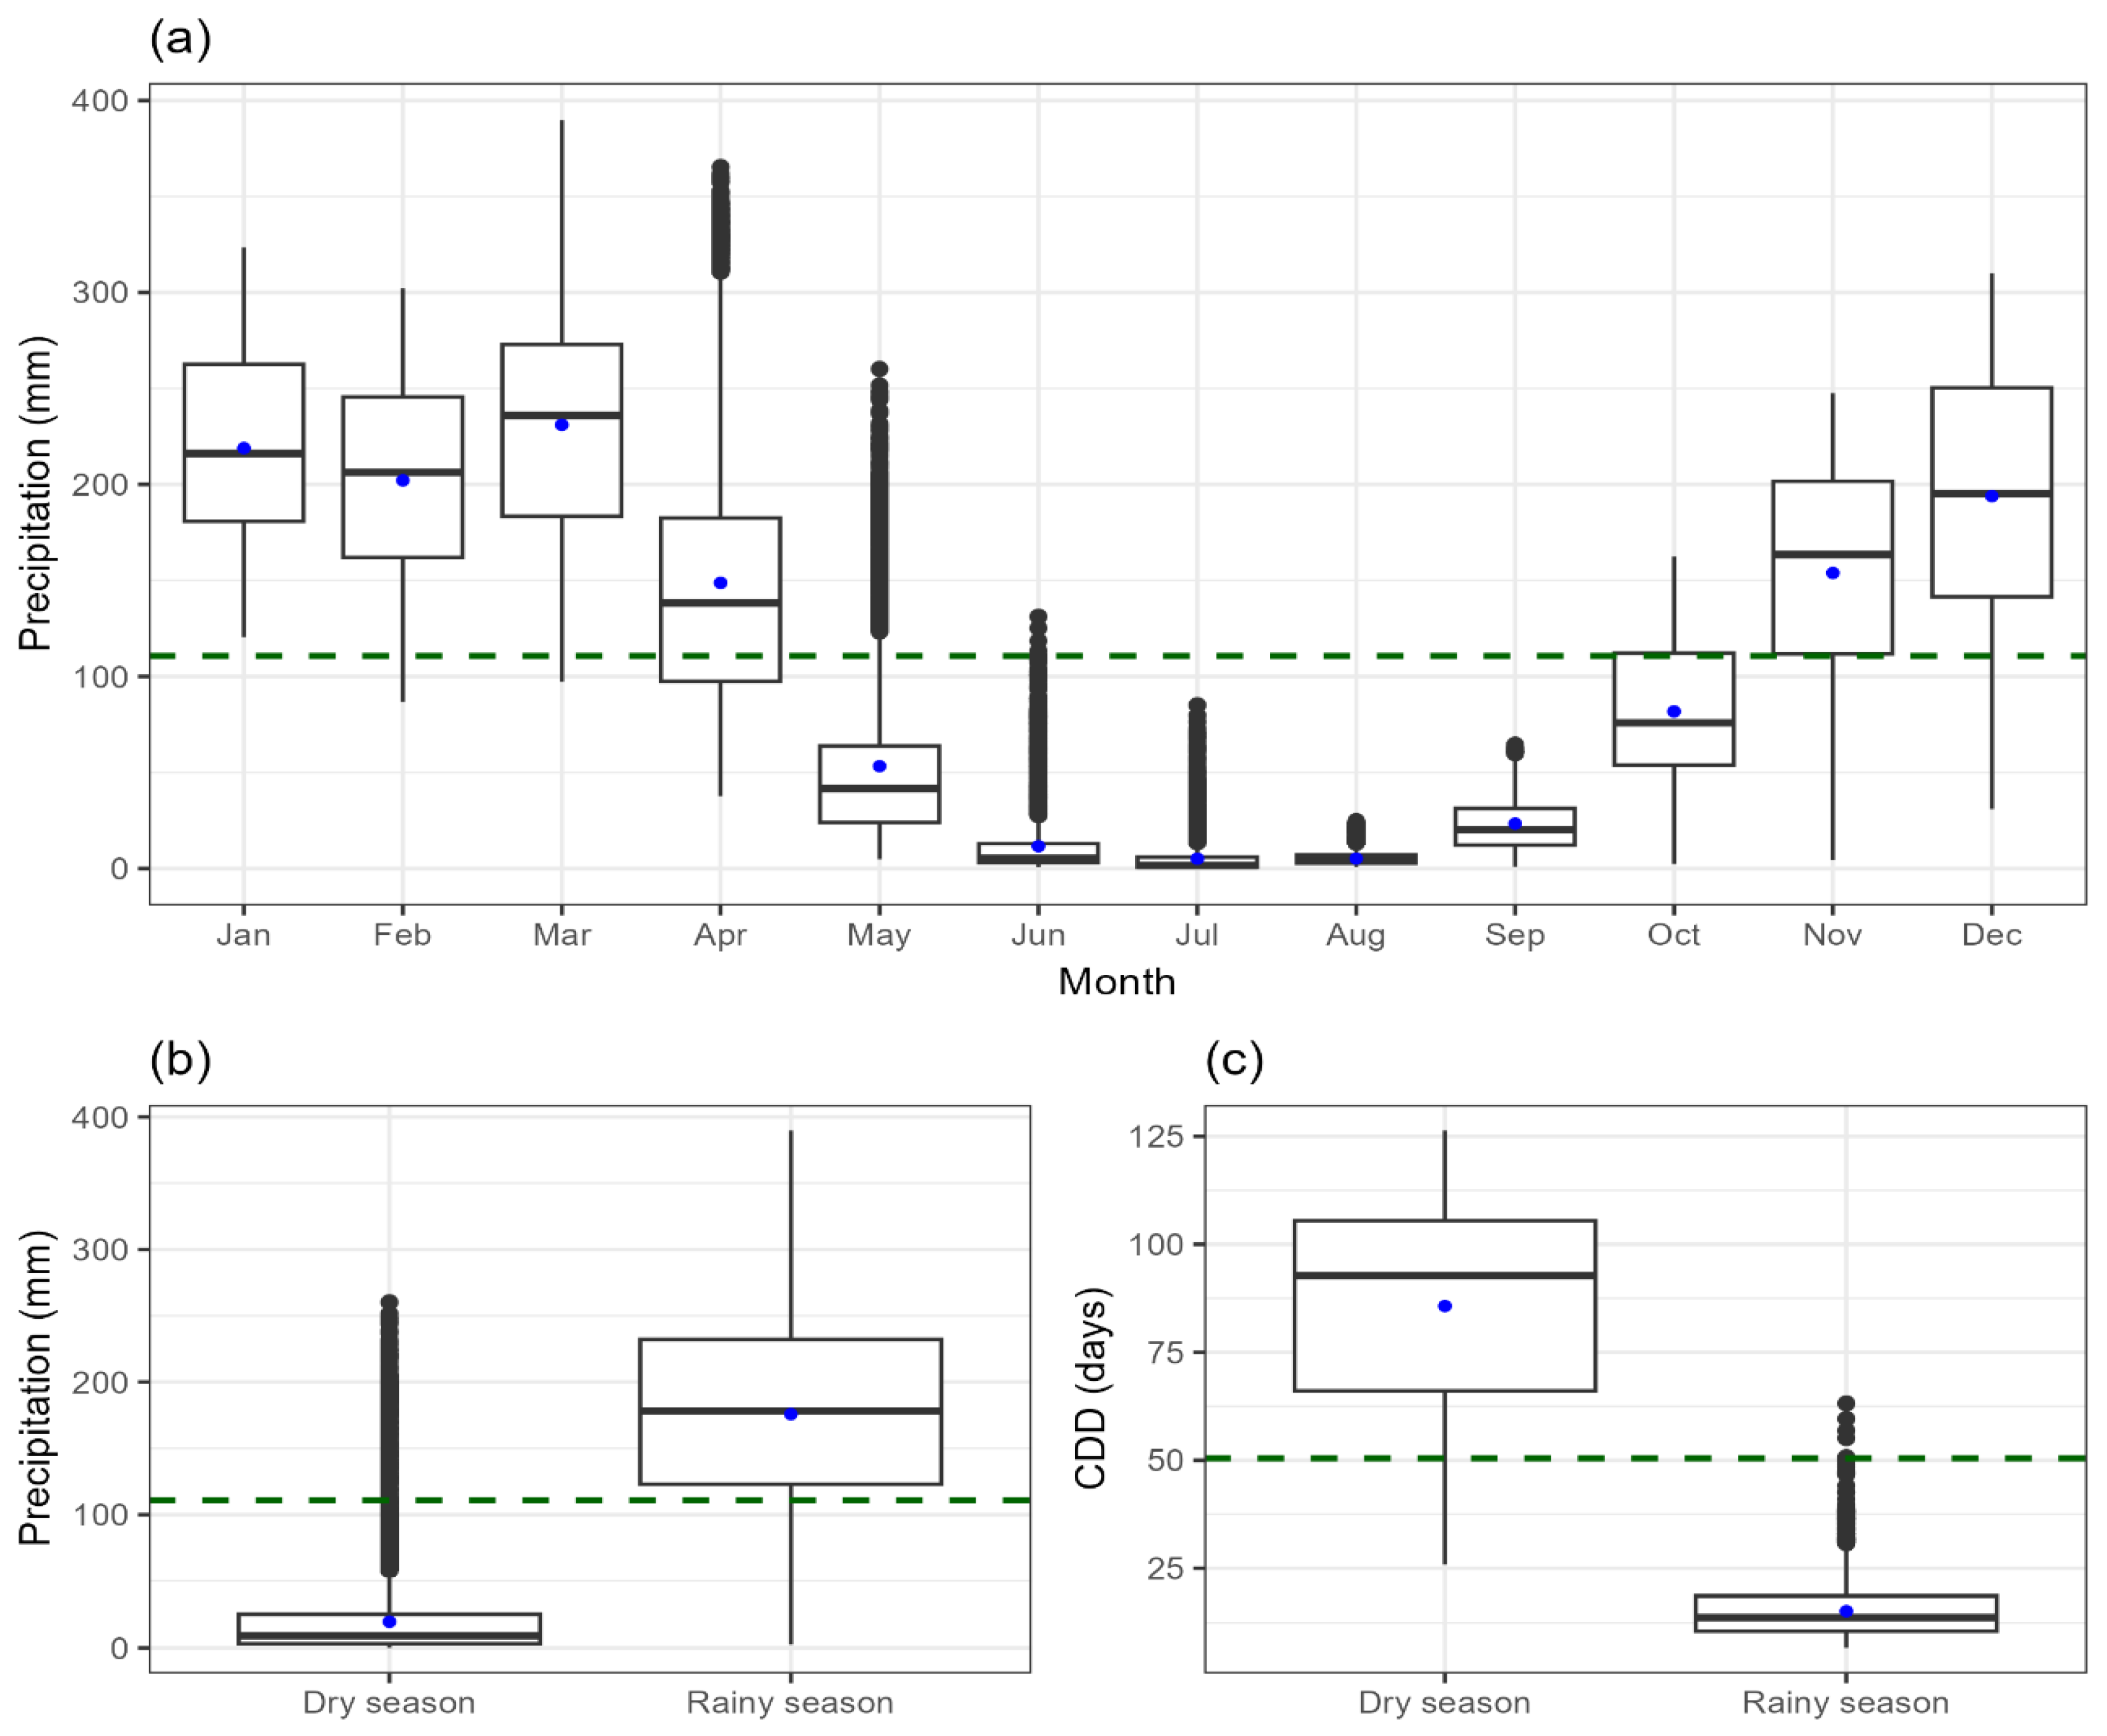
The results presented in Figure 3 demonstrate the marked seasonality of precipitation and the CDD index in the MATOPIBA region from 1981 to 2023. It is observed that during the first three months of the year (January, February, and March), the mean and median precipitation values exceed 200.0 mm (Figure 3a), reflecting the influence of the ITCZ. The mean monthly precipitation for the entire analyzed period is approximately 110.0 mm. However, it shows a pronounced contrast between wet and dry months. This variation is consistent with the seasonality previously described in the literature, where the months from November to April are characterized as the rainy season, while the dry period extends from May to October [7,37].
The comparison between seasonal periods (Figure 3b) indicates well-marked differences. The median precipitation is 9.0 mm during the dry period compared to 175.0 mm in the rainy season, thus exerting a strong influence on the rainfed crops of the MATOPIBA region [6], which depend on rainfall concentrated within a few months. This pattern has been identified by Battisti and Sentelhas [38] as a determining factor for water risk in soybean crops in the Cerrado.
Regarding the CDD index, a median of 93 days is observed during the dry period and 14 days during the rainy period, while the annual mean is 51 days (Figure 3c). These results indicate that although the rainy regime is sufficient to sustain agricultural production, intra-seasonal irregularity and dry spells even within the rainy season can compromise crop yield during critical phases such as flowering and grain filling [17,20].
The occurrence of high CDD values during the dry season, combined with dry spells within the rainy period, highlights the water vulnerability of MATOPIBA. This vulnerability is intensified by the expansion of agricultural development into Cerrado areas characterized by low water resource availability. Previous research demonstrates that the intensification of climate variability, resulting from both global changes and the influence of large-scale phenomena—primarily El Niño—increases the risk of prolonged droughts in regions within the Cerrado domain (where most of MATOPIBA is located) and in the Caatinga areas [28,39,40]. In this context, understanding these patterns is fundamental for supporting agricultural adaptation strategies and sustainable water resource management in the region.
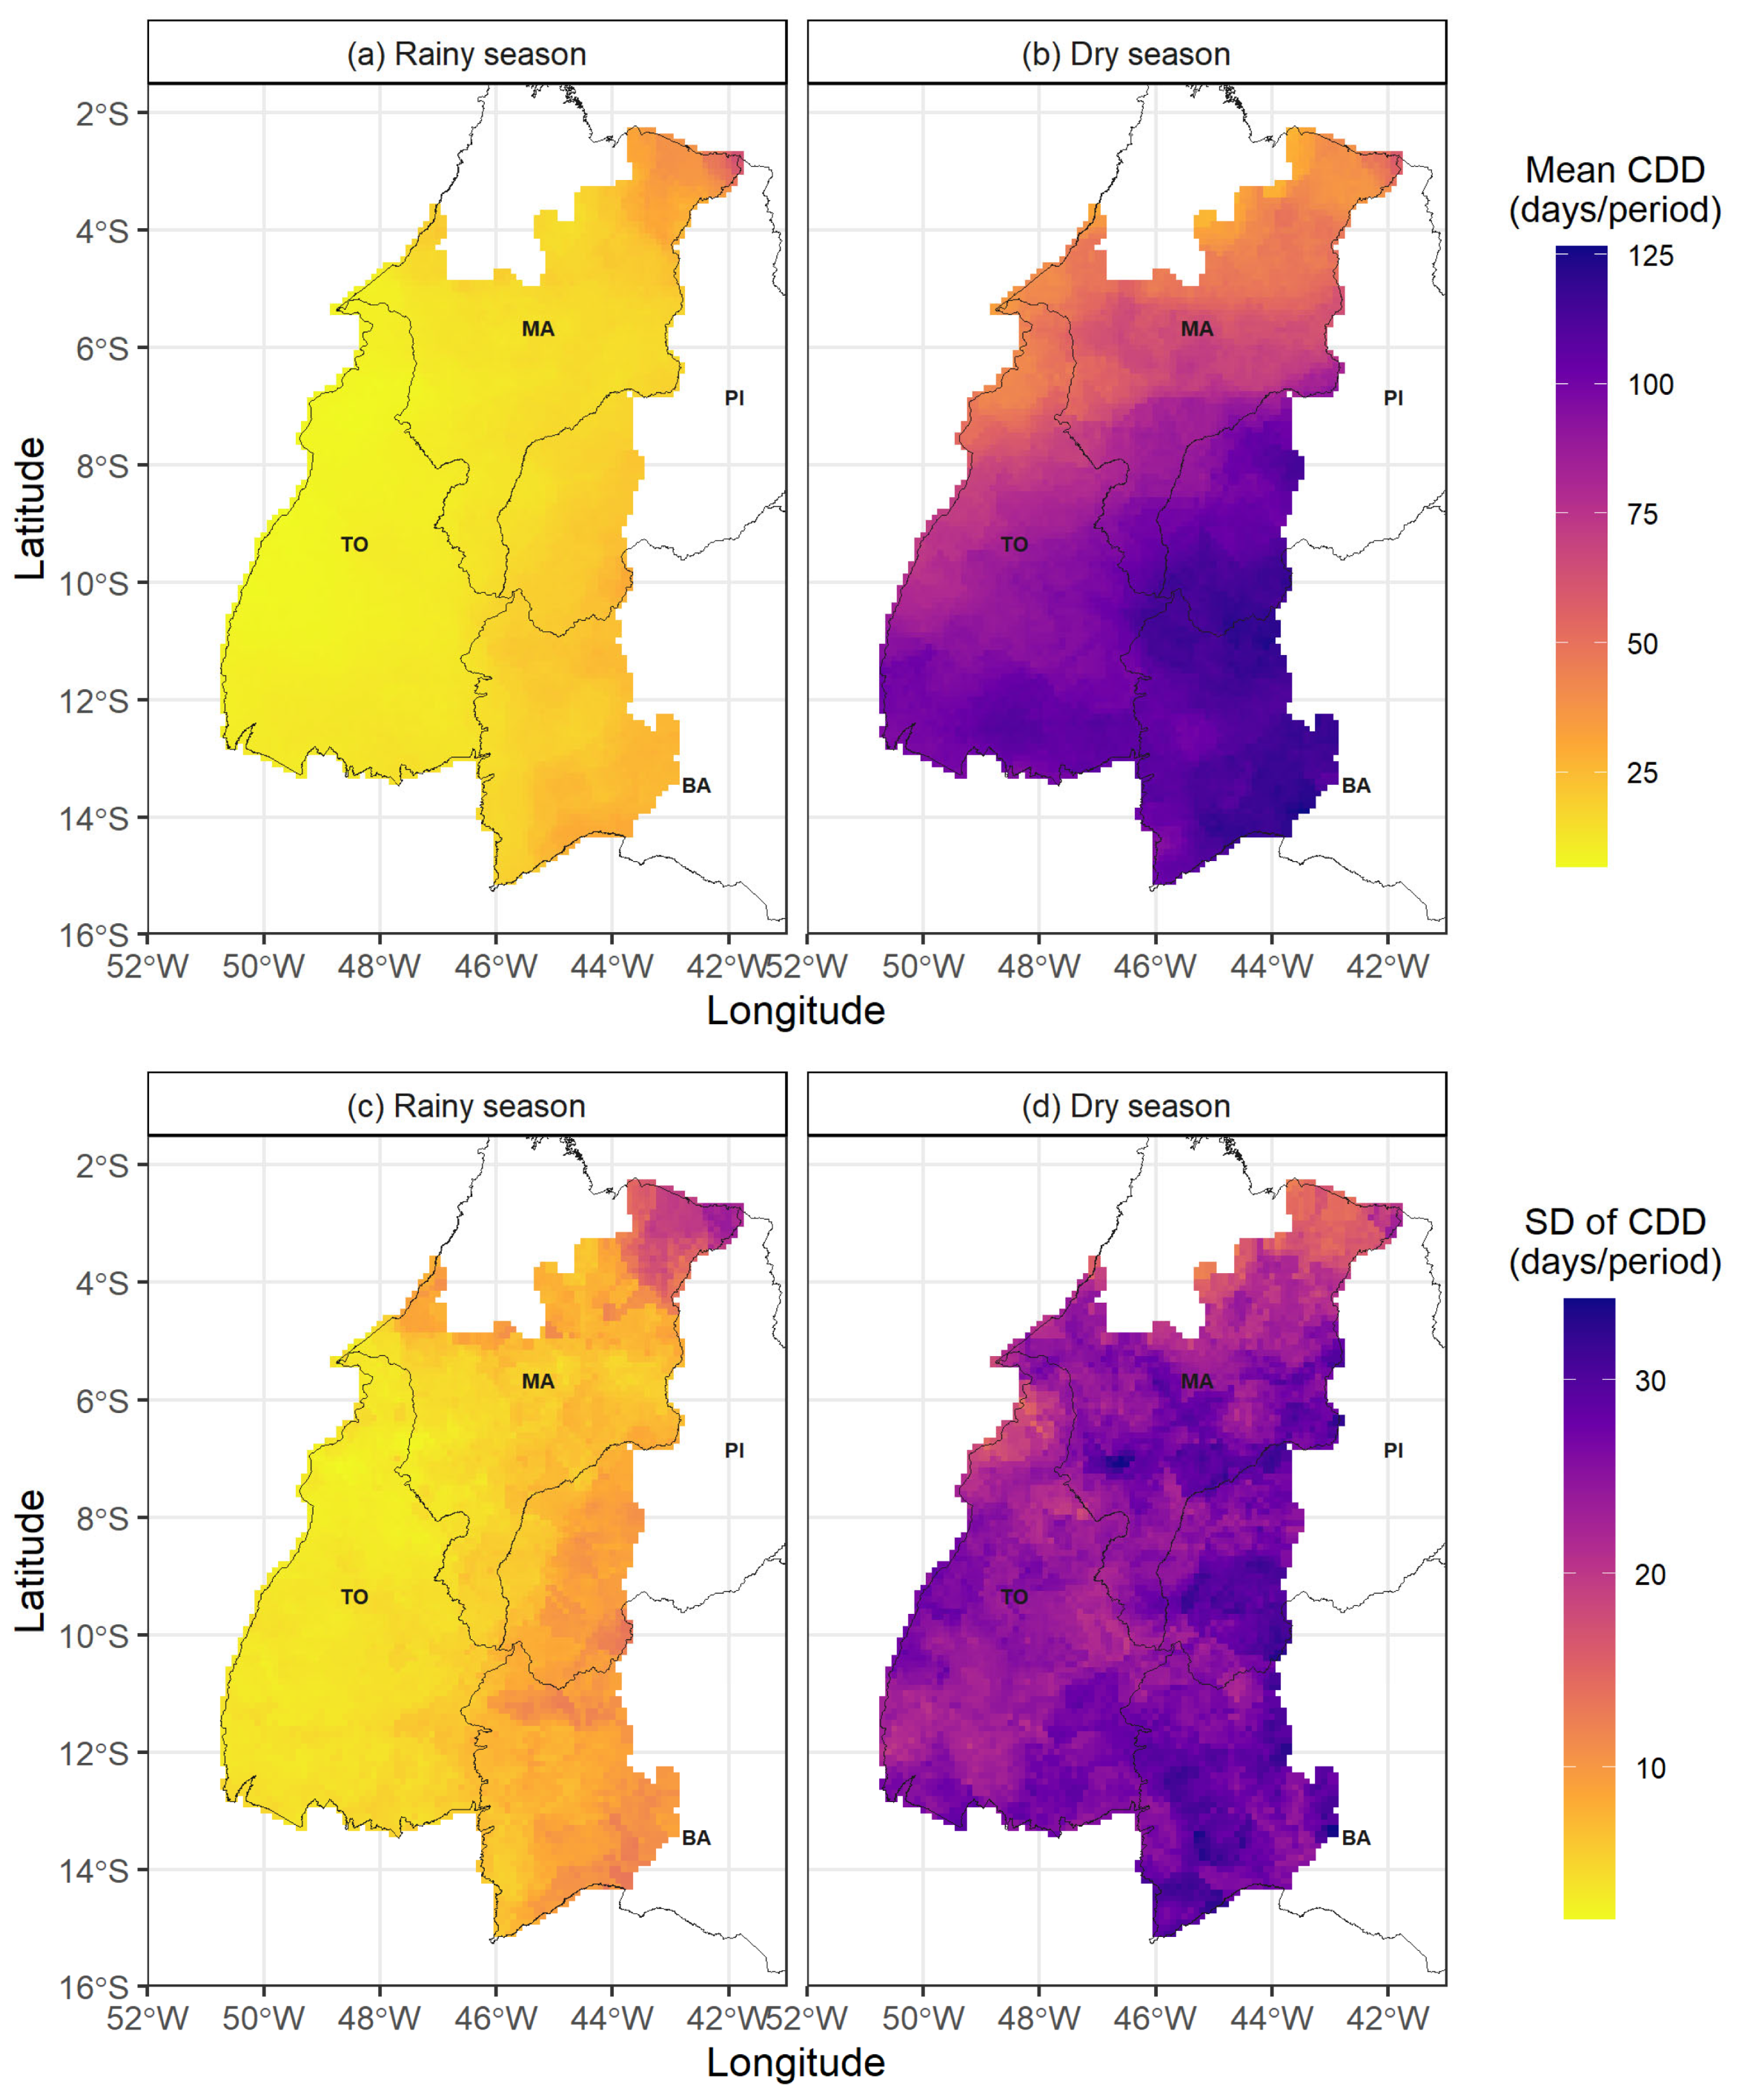
During the rainy season, the average CDD ranges between approximately 20 and 60 days (Figure 4a), with the highest values concentrated in the north of Maranhão and in areas encompassing the states of Piauí and Bahia. Although lower than those observed in the dry period (Figure 4b), these values are significant for crops sensitive to water deficit, such as soybeans. Evidence indicates that dry spells exceeding 10 consecutive days during flowering and grain filling can reduce soybean productivity by up to 30% [17]. Thus, even during the rainy season, the occurrence of CDD above this threshold represents a considerable climate risk for the region’s agriculture.
When contextualized on a broader scale, the magnitude of dry spells in MATOPIBA reveals a scenario of considerable seasonal water stress. During the dry season, the average CDD values increase substantially, exceeding 100 consecutive days without precipitation in about 37.5% of the region, particularly in Southern Tocantins and areas encompassing the states of Piauí and Bahia (Figure 4b). This pattern is comparable to that recorded in other seasonal tropical agricultural areas, such as the South American Chaco [41] and certain African savannas [42], which are characterized by the concentration of agricultural production in a single rainy season. This distribution highlights the strong seasonality of the rainfall regime, imposing serious constraints on rainfed agriculture. Under these circumstances, adaptive management practices, such as staggered planting and the adoption of supplemental irrigation, become essential to reduce losses resulting from water stress, as indicated by agrometeorological modeling studies in the region [7].
During the wet season in MATOPIBA, the median of 14 CDD, although lower than the values in the dry period, represents a higher agronomic risk compared to areas in the Central and Southern Brazilian Cerrado [43], where rainfall distribution is more regular. This highlights an intrinsic vulnerability of MATOPIBA to mid-summer droughts (veranicos). The standard deviation (SD) of CDD in this season ranged between 10 and 25 days (Figure 4c), with higher values in Northern Maranhão, a region that also showed higher averages (Figure 4a). This greater variability and persistence of dry spells reinforce the vulnerability of agricultural production, especially in areas such as Northern Maranhão, and underscore the need for specific adaptation strategies to mitigate the impacts of veranicos.
These results align with the study by Feron et al. [44], which points to increasing water stress in seasonally humid agricultural regions of South America, associated with the intensification of extreme dry events. Conversely, areas with lower average CDD during the rainy season, such as Southwestern Maranhão and the state of Tocantins, also exhibited lower SD (Figure 4c), reflecting a more stable and predictable rainfall regime. In the dry season, the deviations were higher, ranging from 20 to 35 days, especially in central MATOPIBA (Figure 4d), indicating strong interannual variability characterized by the alternation between years with extremely long droughts and years with shorter dry periods. The relationship between high averages and high CDD deviations reinforces the climatic vulnerability of regional agricultural production and the urgency for adaptive management strategies based on climate monitoring and risk planning.

3.2. Trend Analysis of CDD in MATOPIBA (1981–2023)

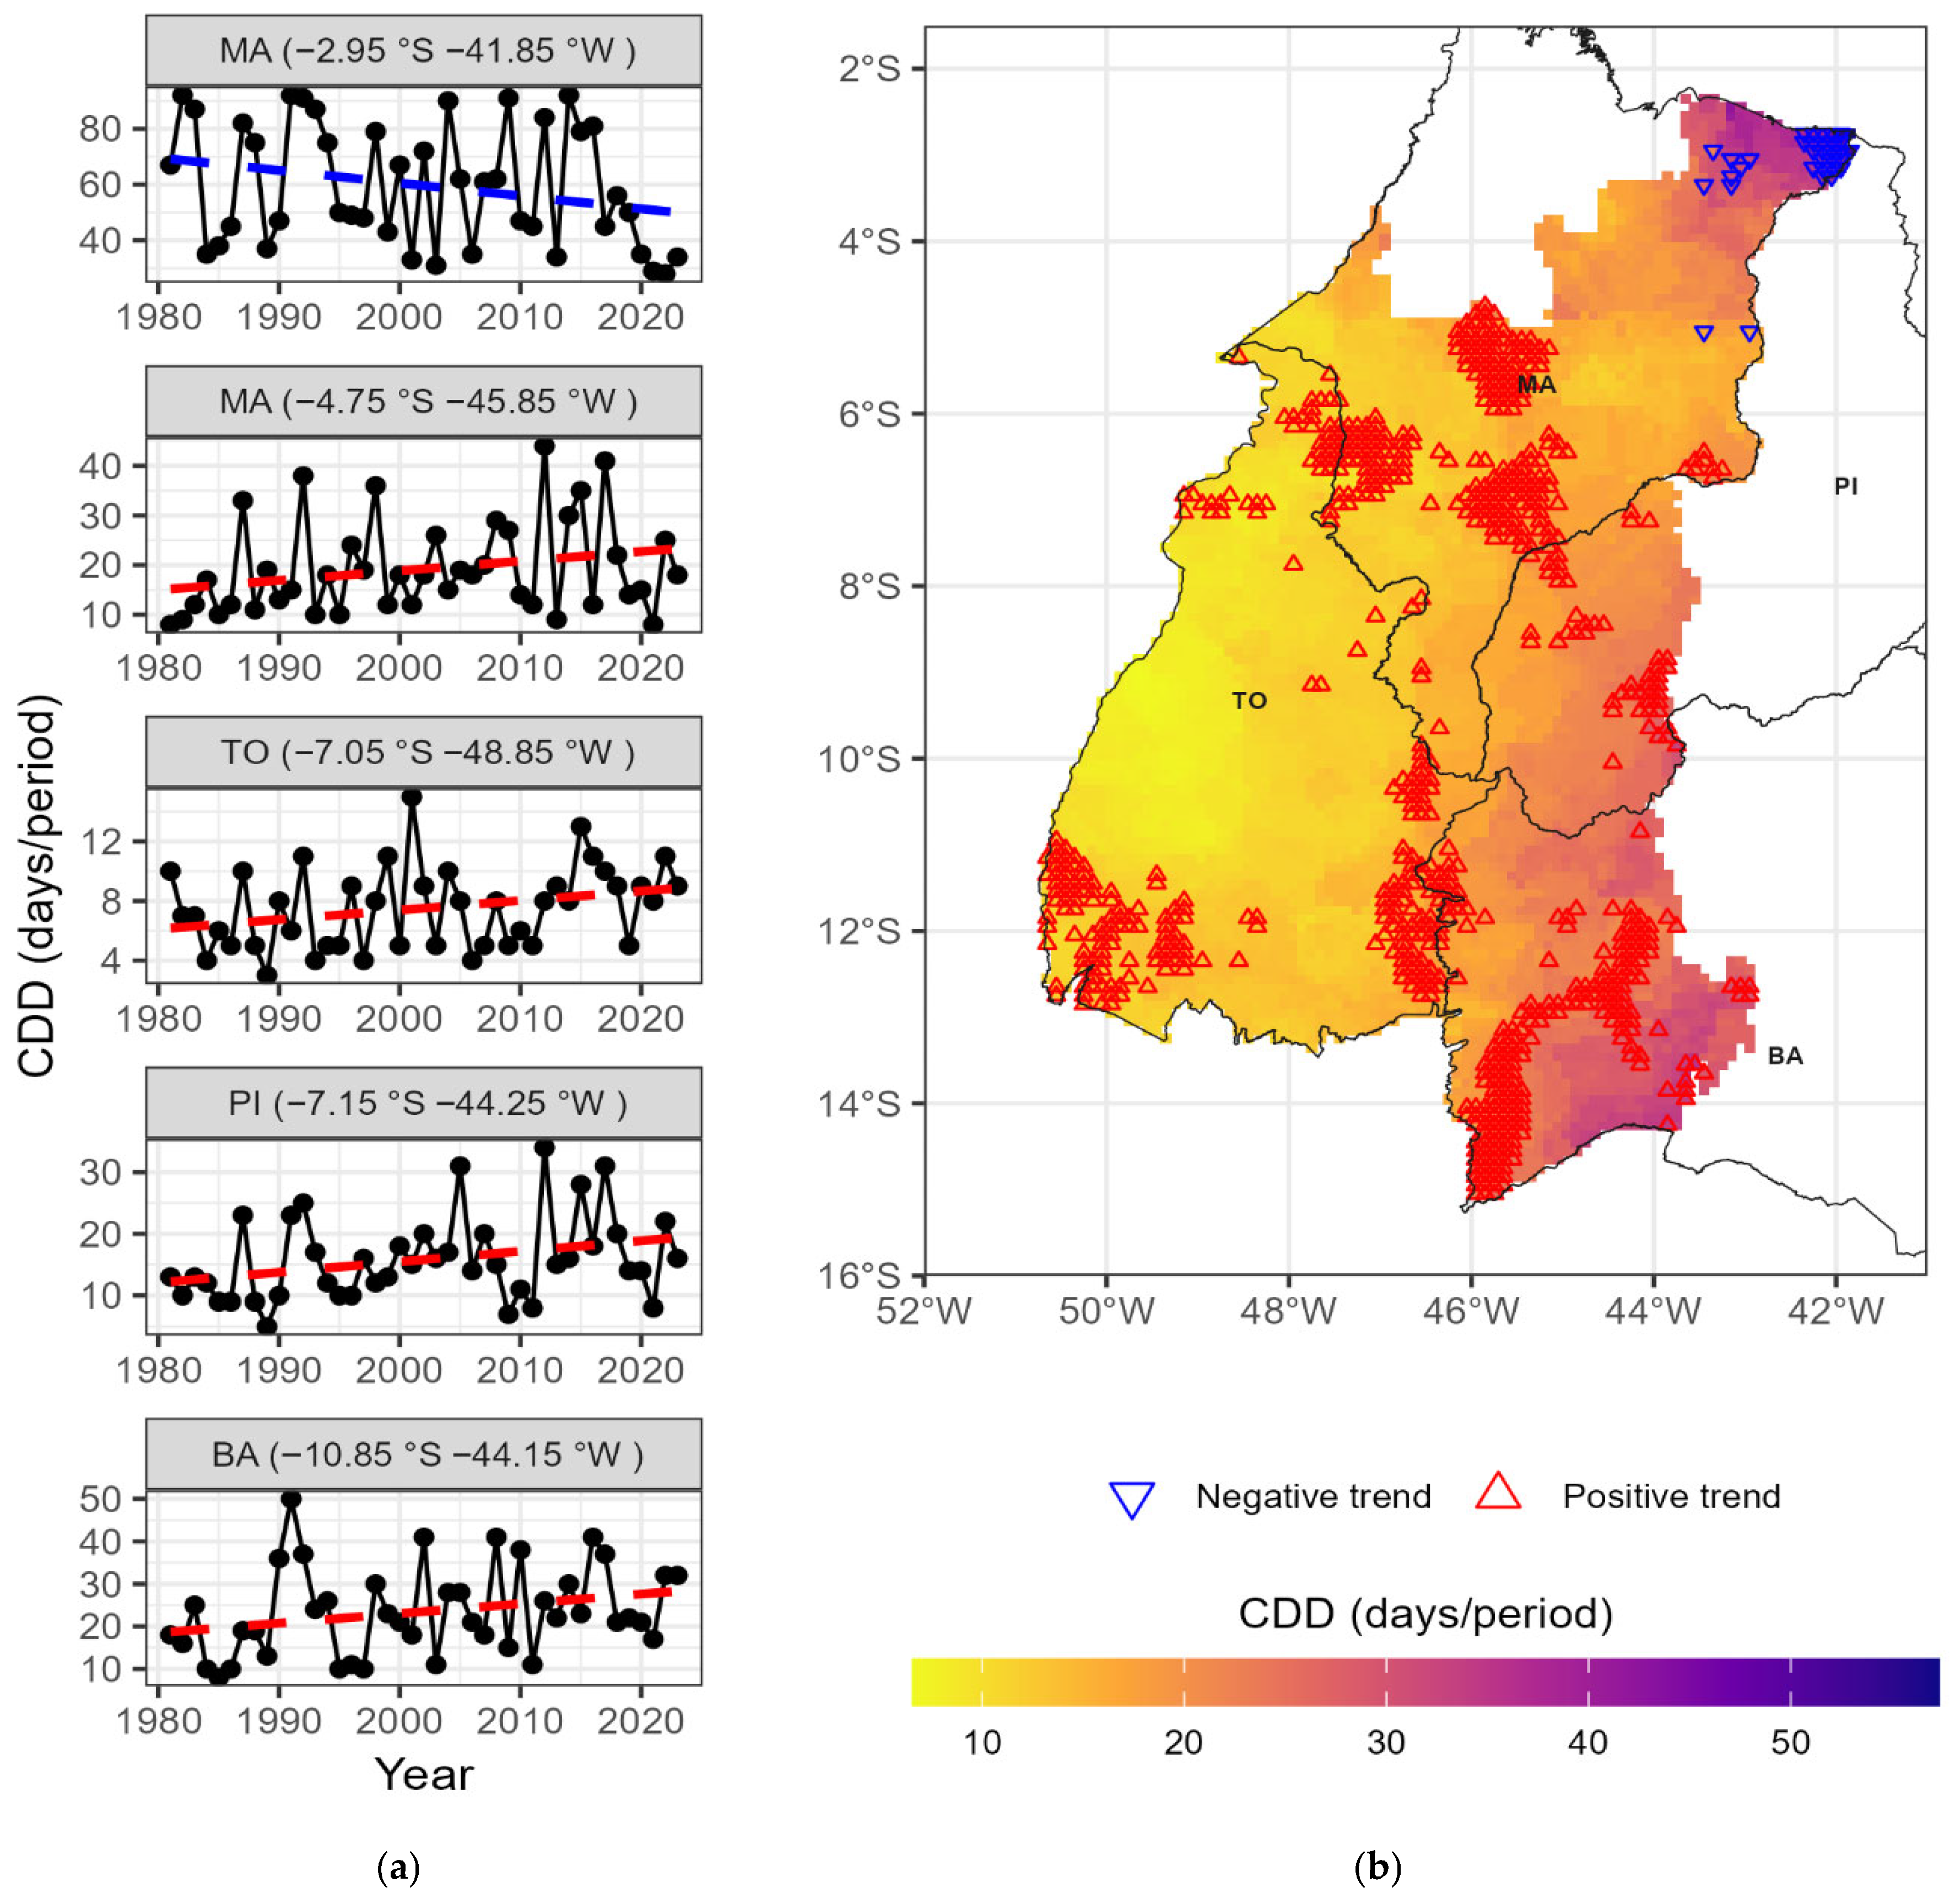
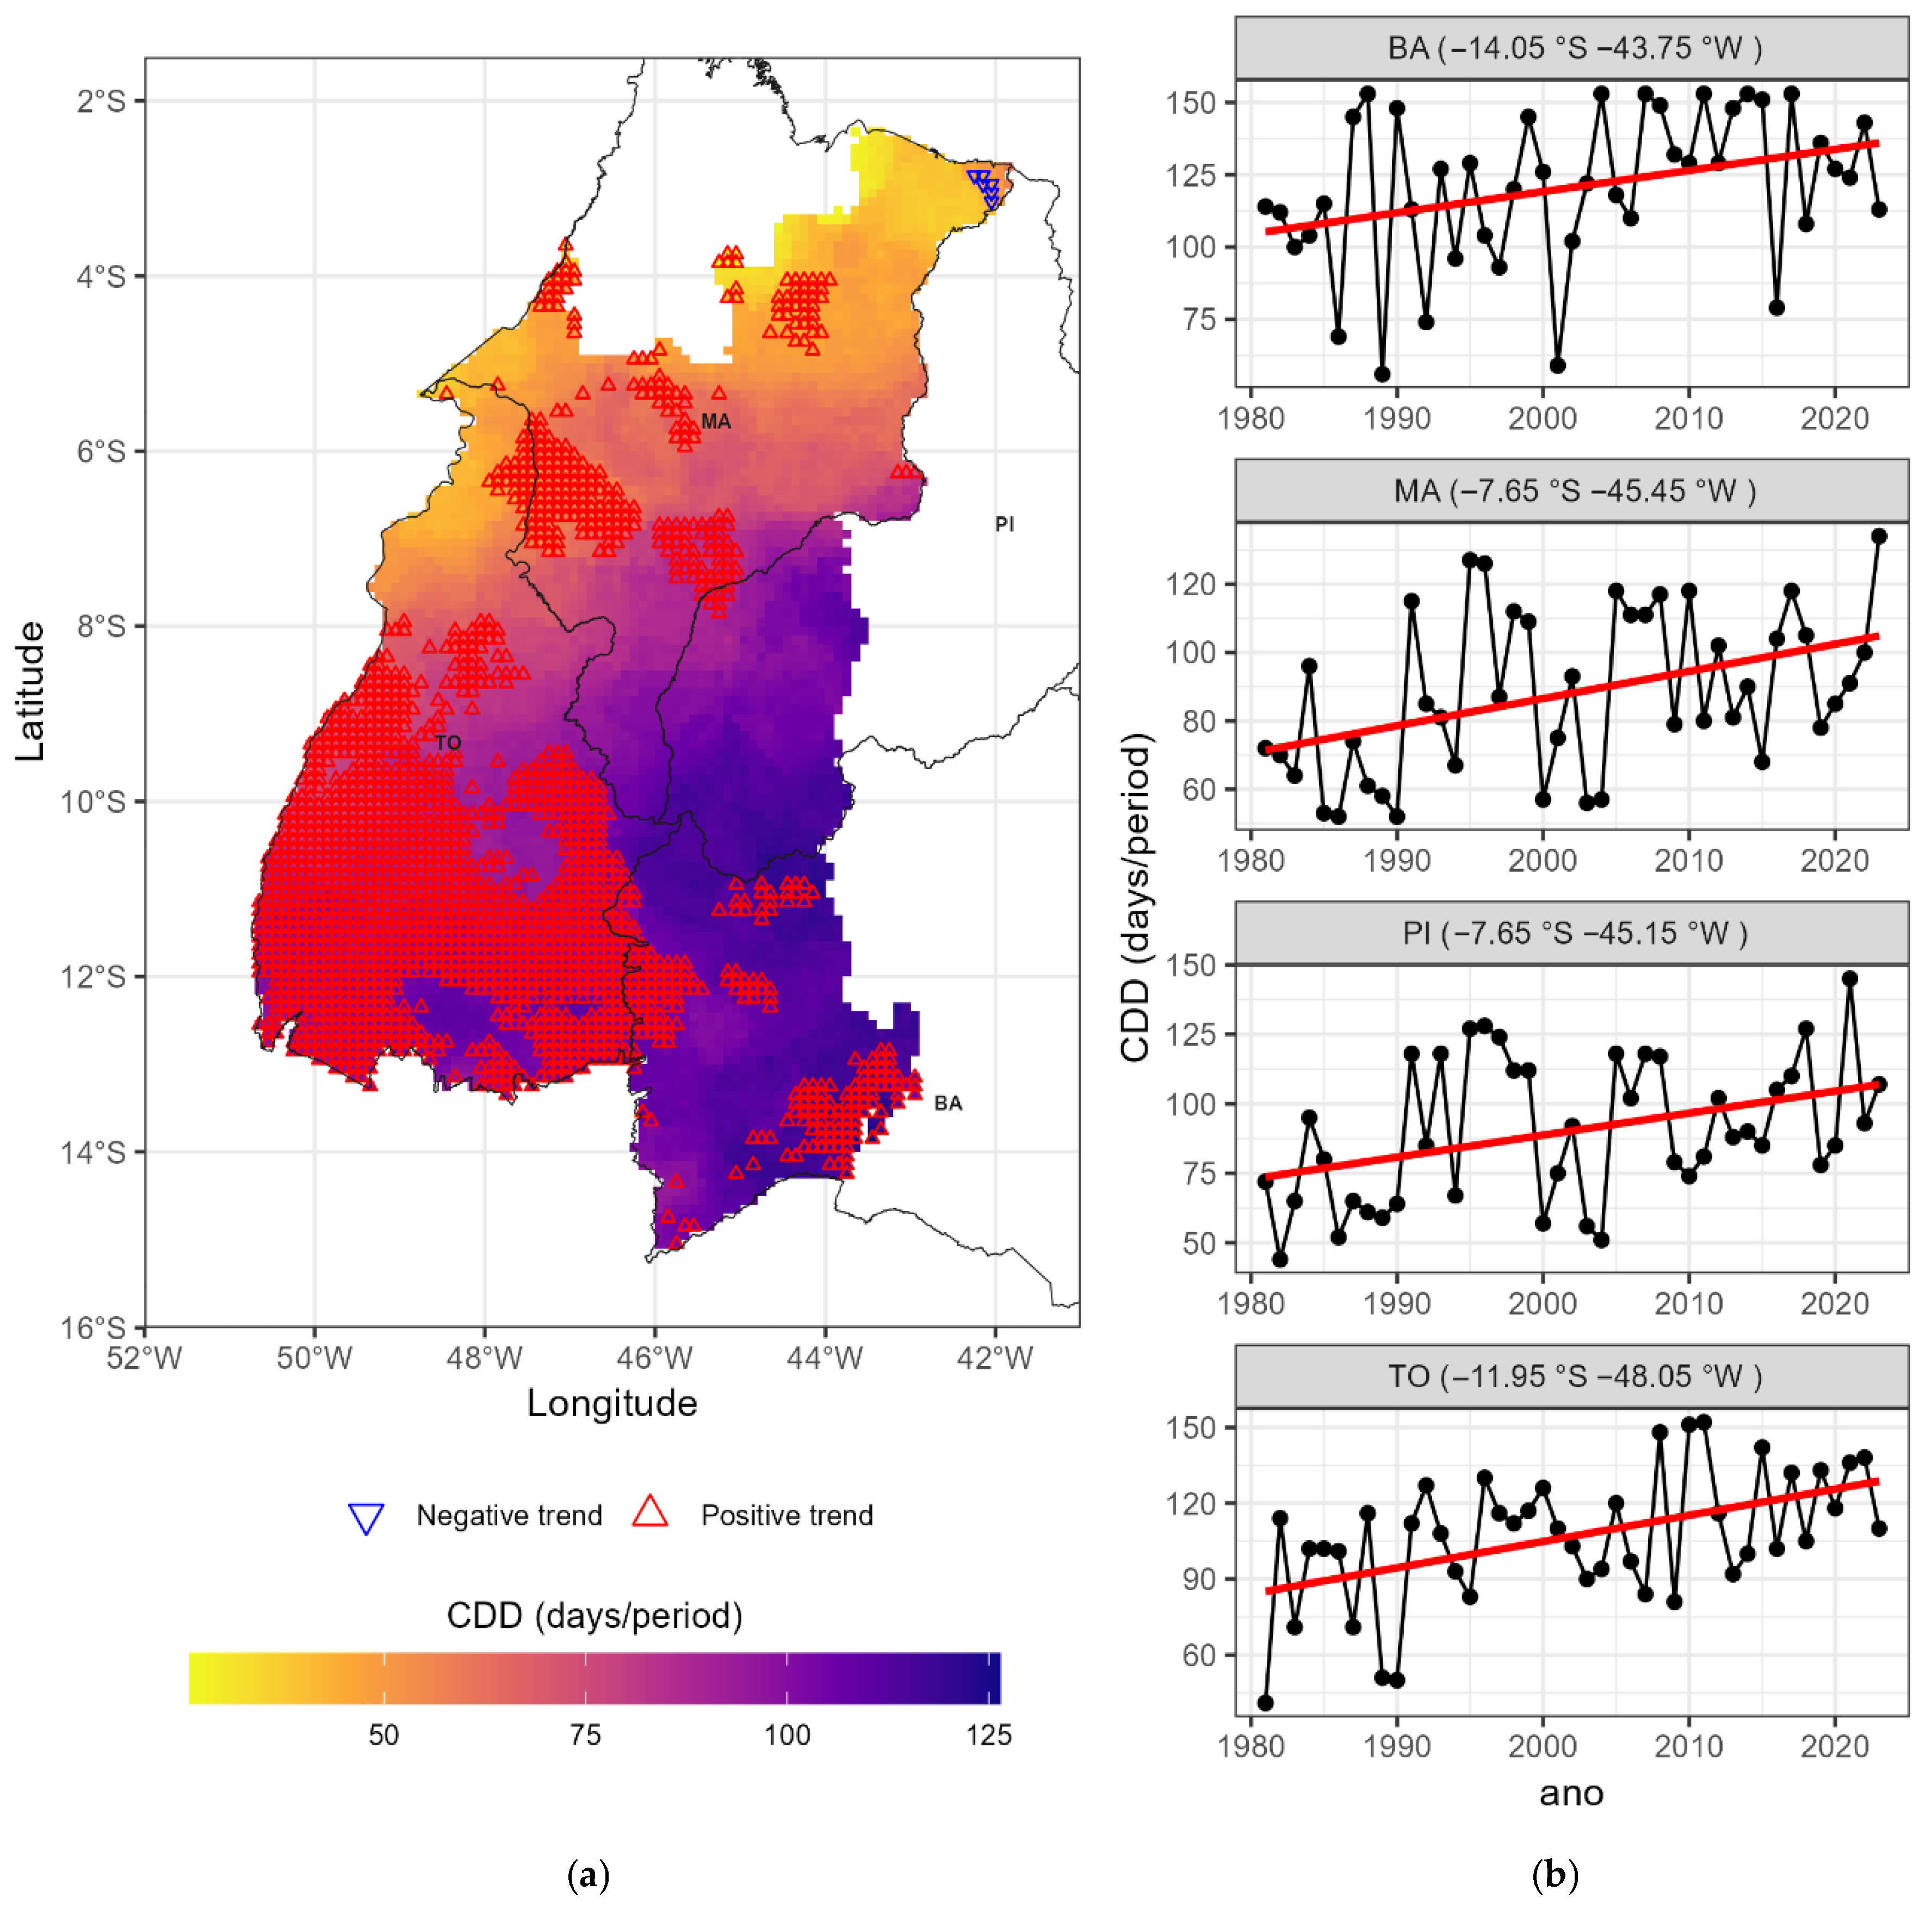
Overall, the statistically significant trends (p-value < 0.05) identified by the Mann–Kendall test during the rainy season indicate an increase in CDD over the historical series in MATOPIBA (Figure 5b). This result is particularly concerning, as the intensification of dry spell duration during the rainy season can severely threaten agricultural productivity, especially in crops sensitive to water deficit, such as soybeans and corn [17,20].
The highest average CDD values are concentrated in Piauí and Bahia, exceeding 20 days during the rainy season (Figure 5b), which increases the climate risk and socioeconomic vulnerability of producers [45]. In contrast, the decreasing CDD trend observed in Northern Maranhão constitutes a relevant finding and is consistent with some climate model projections that simulate global warming scenarios [46,47].
Classical and recent studies indicate that the differential warming of the Tropical North and South Atlantic Oceans can cause a mean southward displacement or strengthening of the convective activity of the ITCZ over Northeastern South America [26,48,49,50,51,52]. The wetting pattern identified in this sub-region may reflect the early signals of this climate reconfiguration, contrasting sharply with the aridification trend projected for the remainder of MATOPIBA [39,53]. This trend dipole—wetting in the far north and increasing aridity in other areas—suggests that climate adaptation strategies cannot be homogeneous, requiring differentiated territorial planning capable of considering the intensification of climatic gradients at a local scale. The influence of the ITCZ, intensifying rainfall in this sub-region, is a central explanatory factor for this behavior.
The time series (Figure 5a) illustrates the evolution of CDD between 1981 and 2023. In Northern Maranhão (MA, −2.95° S; −41.85° W), a negative trend is observed over the last four decades, confirming a reduction in the number of CDD, consistent with the rainfall regime associated with the ITCZ during the rainy season. In contrast, Central Maranhão (MA, −4.75° S; −45.85° W), Northern Tocantins (TO, −7.05° S; −48.85° W), Piauí (PI, −7.15° S; −44.25° W), and Bahia (BA, −10.85° S; −44.15° W) exhibit a positive trend, with a gradual increase in the persistence of dry spells. This pattern reinforces the water vulnerability of these sub-areas and highlights the need for agricultural adaptation measures, such as the use of drought-tolerant cultivars, the adoption of conservation management practices, and the expansion of irrigation in strategic areas [19,54].
During the dry season, the results reveal a more critical scenario (Figure 6). A significant increase in CDD is observed across a large portion of the region (Figure 6a), particularly in the state of Tocantins, where almost the entire territory shows positive trends. In certain areas, the average CDD exceeds 100 consecutive days without precipitation (Figure 4b), characterizing a situation of intense water stress. The time series (Figure 6b) reinforces this pattern, demonstrating a progressive rise in CDD across the four analyzed states, with greater intensity in Tocantins and Southern Bahia. These results corroborate previous investigations that identified an increase in the frequency and intensity of dry spells in the Cerrado and Brazilian Semi-Arid region, a phenomenon associated with both global climate change and interannual variability modulated by events such as El Niño and La Niña [54,55].
Table 2 summarizes the spatial distribution of statistically significant trends (p-value < 0.05) in the CDD index, disaggregated by state and by seasonal period. The results were obtained using the Mann–Kendall trend test [36], a robust non-parametric method widely used to detect monotonic trends in climatological and hydrological time series [56,57]. The table presents both the absolute number and the percentage of pixels exhibiting significant positive or negative trends, providing a spatial overview of how the persistence of dry spells has evolved across the MATOPIBA region.
During the rainy season, the proportion of pixels with significant positive trends ranges from 7.3% in Piauí to 18.8% in Bahia, indicating that even during months typically associated with higher rainfall, certain subregions already experience an increase in the persistence of dry periods. These patterns suggest reduced rainfall frequency or interruptions during the rainy season, signaling shifts in the onset and duration of the wet period [15,58]. The estimated increase in CDD, ranging from 1 to 4 days per decade, may seem modest, but over a 30-year planning horizon, it represents up to 12 additional consecutive dry days. Such an extension increases agricultural risk, especially for crops like soybean and maize, whose phenological stages (flowering and grain filling) are highly sensitive to water deficits [18,20].
In contrast, during the dry season, the trends are more pronounced and widespread. The percentage of pixels showing increasing CDD reaches 59.6% in Tocantins, followed by 20.3% in Bahia and 13.1% in Maranhão, revealing that nearly two-thirds of Tocantins is undergoing a significant intensification of drought persistence. In these areas, the CDD increased by 4 to 14 days per decade, indicating not only a prolongation of the dry season but also a potential delay in the transition to the rainy period. These results align with other studies reporting longer dry spells and increased drought severity in Central and Northeastern Brazil [9,15]. The intensification of dry periods amplifies hydrological stress and exposes rainfed agricultural systems to greater vulnerability, threatening water resources and crop yields [4,19].
Conversely, negative trends (reduction in CDD) were observed only in isolated areas, particularly in Maranhão, where about 1.7% of the pixels showed a decrease in the rainy season and 1.0% in the dry season. These few localized improvements are insufficient to offset the dominant drying tendency observed in the region. Overall, the Mann–Kendall results reveal a clear pattern of increasing drought persistence throughout the MATOPIBA region, reinforcing the evidence of climatic intensification and highlighting the urgent need for adaptive agricultural management and regional drought mitigation policies [15,43].
In addition to the identified trends, it is important to consider the potential drivers behind precipitation changes in the MATOPIBA region. These variations may be partially attributed to the effects of global warming, which intensify atmospheric instability and alter regional circulation patterns, as well as to non-climatic factors such as land-use and land-cover changes [15,16]. The rapid expansion of agriculture and the replacement of natural vegetation by large-scale monocultures have been shown to influence evapotranspiration dynamics and local energy balance, potentially modifying rainfall distribution and drought frequency [41]. Similar interactions between land-use changes and precipitation variability have been documented in recent studies over the Brazilian Northeast and Cerrado regions [1,17].
In summary, the results demonstrate that the increase in CDD during both the rainy and dry seasons represents a significant threat to water and agricultural security in MATOPIBA. The prolongation of dry spells tends to intensify productive instability and amplify the risk of economic losses, especially in areas more heavily dependent on rainfed agriculture. In this context, it becomes imperative to advance adaptation strategies, such as sustainable water resource management, crop diversification, the adoption of agroecological practices, and the expansion of irrigation infrastructure in strategic areas. Furthermore, these findings reinforce the need for public policies aimed at strengthening regional climate resilience, consistent with observations in recent studies on the intensification of droughts in the Brazilian Northeast and Cerrado [27,28,32].
Finally, this study highlights key considerations regarding its main limitations, recommendations for future research, and practical implications. Among the limitations, it is acknowledged that the analysis relied on interpolated gridded data, which, although validated for regional studies [59,60,61], may introduce uncertainties at finer spatial resolutions. Future research should incorporate multiple climatic extreme indices and investigate the relationships between CDD dynamics, soil moisture, and agricultural productivity using field measurements and remote sensing observations. From a practical perspective, the findings presented here provide strategic guidance for decision-makers, farmers, and policymakers. In particular, the spatial patterns of CDD trends can serve as a basis for identifying priority areas for irrigation investment, support the development of drought early-warning systems, and optimize planting calendars according to seasonal rainfall variability. Moreover, these results offer valuable input for regional agricultural zoning and risk management programs, such as the Agricultural Activity Guarantee Program [62] and the National Program for Agricultural Climate Risk Zoning [63], as well as for the long-term planning of water resource allocation. Collectively, these insights contribute to more effective adaptation strategies and climate-resilient agricultural policies throughout the MATOPIBA region.

4. Conclusions

This study investigated the behavior of the Consecutive Dry Days (CDDs) index in the MATOPIBA Region from 1981 to 2023, with emphasis on the contrasting rainy and dry seasons. The results show that, although average CDD values are lower during the rainy season, there is clear and spatially extensive evidence of increasing persistence of rainless days in key agricultural areas. This is critical because even short dry spells during sensitive phenological stages of soybean and maize can translate into substantial yield losses. By contrast, Northern Maranhão exhibits a localized decrease in CDDs that is consistent with the influence of the Intertropical Convergence Zone, suggesting a hydroclimatic gradient within the region.
During the dry season, the scenario is more severe. A predominance of positive CDD trends is observed across virtually the entire region, with Tocantins standing out for the spatial extent and intensity of the signal, and several locations surpassing 100 consecutive days without rainfall. The Mann–Kendall results corroborate the intensification of prolonged dry spells and point to rising agricultural and hydrological vulnerability where rainfed systems prevail. These patterns, together with the seasonal concentration of precipitation, reinforce the need for management that anticipates water scarcity and buffers climate risk.
The implications are practical and immediate. Adaptation strategies should prioritize sustainable water management, the expansion of irrigation in strategically identified hotspots, the adoption of drought-tolerant cultivars, and conservation practices that enhance soil water retention. Climate-informed planting calendars and early-warning systems can reduce exposure during the most vulnerable crop stages. At the policy level, the spatial information on CDD and its trends can guide agricultural zoning, direct investments in water infrastructure, and support programs for climate risk management tailored to the regional mosaic of vulnerabilities.
This assessment relies on a high-resolution interpolated gridded dataset that is suitable for regional analyses, while potentially underrepresenting fine-scale heterogeneity. Future work should incorporate multiple precipitation-based indices, couple CDD dynamics with soil moisture and crop yield observations from field measurements and remote sensing and explore attribution pathways involving large-scale climate drivers and land-use change. Advancing along these fronts will refine impact assessments and strengthen climate-resilient agricultural strategies throughout MATOPIBA.

Author Contributions

The contributions of each author are as follows: D.T.R.: Conceptualization, Methodology, Validation, Formal Analysis, Investigation, Data Curation, Writing—Original Draft, Visualization; C.M.S.e.S.: Conceptualization, Methodology, Supervision, Writing—Review and Editing; F.F.B.: Data Curation, Writing—Review and Editing; L.d.M.B.A.: Conceptualization, Methodology, Supervision, Writing—Review and Editing; M.S.M.R.: Data Curation, Writing—Review and Editing; J.S.d.R.: Data Curation, Writing—Review and Editing; J.B.C.J.: Methodology, Validation, Formal Analysis; H.J.F.d.S.: Writing—Review and Editing, J.d.S.S.: Writing—Review and Editing, F.D.d.S.S.: Writing—Review and Editing. All authors have read and agreed to the published version of the manuscript.

Funding

This research was funded by the Federal Institute of Espírito Santo (IFES), through the PRODIF program. The Article Processing Charge (APC) was also funded by IFES (PRODIF). We are thankful to the National Council for Scientific and Technological Development (CNPq) for the research productivity grants awarded to the first author (Process No. 311283/2025-0) and the last author (Process No. 312222/2023-8).

Institutional Review Board Statement

Not applicable.

Informed Consent Statement

Not applicable.

Data Availability Statement

Data will be made available on request.

Conflicts of Interest

The authors declare that they have no known competing financial interests or personal relationships that could have appeared to influence the work reported in this paper.

References

  1. Vale, T.M.C.D.; Spyraides, M.H.C.; Júnior, J.B.C.; Andrade, L.d.M.B.; Bezerra, B.G.; Rodrigues, D.T.; Mutti, P.R. Climate and water balance influence on agricultural productivity over the Northeast Brazil. Theor. Appl. Clim. 2024, 155, 879–900. [Google Scholar] [CrossRef]
  2. dos Santos, A.L.M.; Gonçalves, W.A.; Rodrigues, D.T.; Andrade, L.d.M.B.; e Silva, C.M.S. Evaluation of Extreme Precipitation Indices in Brazil’s Semiarid Region from Satellite Data. Atmosphere 2022, 13, 1598. [Google Scholar] [CrossRef]
  3. Zhang, X.; Alexander, L.; Hegerl, G.C.; Jones, P.; Tank, A.K.; Peterson, T.C.; Trewin, B.; Zwiers, F.W. Indices for monitoring changes in extremes based on daily temperature and precipitation data. Wiley Interdiscip. Rev. Clim. Change 2011, 2, 851–870. [Google Scholar] [CrossRef]
  4. Batista, F.F.; Rodrigues, D.T.; e Silva, C.M.S. Analysis of climatic extremes in the Parnaíba River Basin, Northeast Brazil, using GPM IMERG-V6 products. Weather Clim. Extrem. 2024, 43, 100646. [Google Scholar] [CrossRef]
  5. dos Santos, A.L.M.; Gonçalves, W.A.; Andrade, L.d.M.B.; Rodrigues, D.T.; Batista, F.F.; Lima, G.C.; e Silva, C.M.S. Space–Time Characterization of Extreme Precipitation Indices for the Semiarid Region of Brazil. Climate 2024, 12, 43. [Google Scholar] [CrossRef]
  6. dos Reis, L.C.; e Silva, C.M.S.; Bezerra, B.G.; Mutti, P.R.; Spyrides, M.H.C.; da Silva, P.E. Analysis of Climate Extreme Indices in the MATOPIBA Region, Brazil. Pure Appl. Geophys. 2020, 177, 4457–4478. [Google Scholar] [CrossRef]
  7. Reis, L.; e Silva, C.M.S.; Bezerra, B.; Mutti, P.; Spyrides, M.H.; Silva, P.; Magalhães, T.; Ferreira, R.; Rodrigues, D.; Andrade, L. Influence of Climate Variability on Soybean Yield in MATOPIBA, Brazil. Atmosphere 2020, 11, 1130. [Google Scholar] [CrossRef]
  8. de Araújo, M.L.S.; Sano, E.E.; Bolfe, É.L.; Santos, J.R.N.; dos Santos, J.S.; Silva, F.B. Spatiotemporal dynamics of soybean crop in the Matopiba region, Brazil (1990–2015). Land Use Policy 2019, 80, 57–67. [Google Scholar] [CrossRef]
  9. Stríkis, N.M.; Buarque, P.F.S.M.; Cruz, F.W.; Bernal, J.P.; Vuille, M.; Tejedor, E.; Santos, M.S.; Shimizu, M.H.; Ampuero, A.; Du, W.; et al. Modern anthropogenic drought in Central Brazil unprecedented during last 700 years. Nat. Commun. 2024, 15, 1728. [Google Scholar] [CrossRef]
  10. EMBRAPA. GeoMatopiba: Inteligência Territorial Estratégica Para o MATOPIBA; Embrapa Territorial: Campinas, Brazil, 2020; Available online: https://www.embrapa.br/geomatopiba (accessed on 10 July 2025).
  11. CONAB—Companhia Nacional de Abastecimento. Acompanhamento da Safra Brasileira de Grãos—Safra 2022/23; CONAB: Brasília, Brazil, 2023. Available online: https://www.gov.br/conab/pt-br/atuacao/informacoes-agropecuarias/safras/safra-de-graos/boletim-da-safra-de-graos (accessed on 19 July 2025).
  12. USDA—United States Department of Agriculture. Soybeans and Oil Crops Outlook; USDA: Washington, DC, USA, 2017. Available online: https://www.ers.usda.gov/topics/crops/soybeans-and-oil-crops/market-outlook (accessed on 27 September 2025).
  13. Taherzadeh, O.; Caro, D. Drivers of water and land use embodied in international soybean trade. J. Clean. Prod. 2019, 223, 83–93. [Google Scholar] [CrossRef]
  14. dos Reis, L.C.; Santos e Silva, C.M.; Bezerra, B.G.; Spyrides, M.H.C. Caracterização da Variabilidade da Precipitação no MATOPIBA, Região Produtora de Soja. 2020. Available online: https://periodicos.ufpe.br/revistas/rbgfe (accessed on 29 September 2025).
  15. Marengo, J.A.; Galdos, M.V.; Challinor, A.; Cunha, A.P.; Marin, F.R.; Vianna, M.d.S.; Alvala, R.C.S.; Alves, L.M.; Moraes, O.L.; Bender, F. Drought in Northeast Brazil: A review of agricultural and policy adaptation options for food security. Clim. Resil. Sustain. 2022, 1, e17. [Google Scholar] [CrossRef]
  16. Paredes-Trejo, F.; Barbosa, H.A.; Giovannettone, J.; Kumar, T.V.L.; Buriti, C.d.O.; Prieto, J. Assessing Satellite-Based Products in Characterizing Agricultural Drought Under Climate Change in Northeast Brazil. In Climate Change and Agriculture; Wiley: Hoboken, NJ, USA, 2022; pp. 426–442. [Google Scholar]
  17. Zhu, X.; Troy, T.J. Agriculturally Relevant Climate Extremes and Their Trends in the World’s Major Growing Regions. Earth’s Futur. 2018, 6, 656–672. [Google Scholar] [CrossRef]
  18. Sentelhas, P.C.; Battisti, R.; Zeni, R.; Rodrigues, L.A. Clima e Produtividade da Soja: Efeitos nas Produtividades Potencial, Atingível e Real Clima e Produtividade. 2015. Available online: https://repositorio.usp.br/directbitstream/eb033abf-94cf-4375-84d3-8a270ee7a77c/3093142-Clima_e_produtividade_da_soja_efeitos_nas_produtividades_potencial__ating%C3%ADvel_e_real.pdf (accessed on 5 August 2025).
  19. Assad, E.D.; Assad, M.L.R.C.L. Mudanças do clima e agropecuária: Impactos, mitigação e adaptação. Desafios e oportunidades. Estud. Avançados 2024, 38, 271–292. [Google Scholar] [CrossRef]
  20. Sentelhas, P.C.; Battisti, R.; Câmara, G.M.S.; Farias, J.R.B.; Hampf, A.C.; Nendel, C. The soybean yield gap in Brazil—Magnitude, causes and possible solutions for sustainable production. J. Agric. Sci. 2015, 153, 1394–1411. [Google Scholar] [CrossRef]
  21. Xavier, A.C.; Scanlon, B.R.; King, C.W.; Alves, A.I. New improved Brazilian daily weather gridded data (1961–2020). Int. J. Clim. 2022, 42, 8390–8404. [Google Scholar] [CrossRef]
  22. IBGE—Instituto Brasileiro de Geografia e Estatística. PAM—Produção Agrícola Municipal. Available online: https://www.ibge.gov.br/estatisticas/economicas/agricultura-e-pecuaria/9117-producao-agricola-municipal-culturas-temporarias-e-permanentes.html (accessed on 22 June 2025).
  23. Miranda, E.E.; Carvalho, C.A.; de Magalhães, L.A. Proposta de Delimitação Territorial do MATOPIBA. Campinas. 2014. Available online: https://www.infoteca.cnptia.embrapa.br/infoteca/handle/doc/1037313 (accessed on 12 January 2025).
  24. de, A. Salvador, M.; de Brito, J.I.B. Trend of annual temperature and frequency of extreme events in the MATOPIBA region of Brazil. Theor. Appl. Climtol. 2018, 133, 253–261. [Google Scholar] [CrossRef]
  25. Alvares, C.A.; Stape, J.L.; Sentelhas, P.C.; Moraes, G.J.L.; Sparovek, G. Köppen’s climate classification map for Brazil. Meteorol. Z. 2013, 22, 711–728. [Google Scholar] [CrossRef]
  26. Utida, G.; Cruz, F.W.; Etourneau, J.; Bouloubassi, I.; Schefuß, E.; Vuille, M.; Novello, V.F.; Prado, L.F.; Sifeddine, A.; Klein, V.; et al. Tropical South Atlantic influence on Northeastern Brazil precipitation and ITCZ displacement during the past 2300 years. Sci. Rep. 2019, 9, 1698. [Google Scholar] [CrossRef]
  27. Zilli, M.T.; Carvalho, L.M.V.; Lintner, B.R. The poleward shift of South Atlantic Convergence Zone in recent decades. Clim. Dyn. 2019, 52, 2545–2563. [Google Scholar] [CrossRef]
  28. Grimm, A.M. Interannual climate variability in South America: Impacts on seasonal precipitation, extreme events, and possible effects of climate change. Stoch. Environ. Res. Risk Assess. 2011, 25, 537–554. [Google Scholar] [CrossRef]
  29. Souza, C.M.; Shimbo, J.Z.; Rosa, M.R.; Parente, L.L.; Alencar, A.; Rudorff, B.F.; Hasenack, H.; Matsumoto, M.; Ferreira, L.G.; E Souza-Filho, P.W.; et al. Reconstructing Three Decades of Land Use and Land Cover Changes in Brazilian Biomes with Landsat Archive and Earth Engine. Remote. Sens. 2020, 12, 2735. [Google Scholar] [CrossRef]
  30. Evangelista, B.A.; da Silva, F.A.M.; Simon, J.; Campos, L.J.M.; Vale, T.M.D. Zoneamento de Risco Climático para Determinação de Épocas de Semeadura da Cultura da Soja na Região MATOPIBA; Boletim de Pesquisa e Desenvolvimento, 18; Embrapa Pesca e Aquicultura: Palmas, Brazil, 2017; 44p, Available online: http://www.infoteca.cnptia.embrapa.br/infoteca/handle/doc/1078131 (accessed on 10 July 2025).
  31. Xavier, A.C.; King, C.W.; Scanlon, B.R. Daily gridded meteorological variables in Brazil (1980–2013). Int. J. Clim. 2016, 36, 2644–2659. [Google Scholar] [CrossRef]
  32. Cataldi, M.; Sancho, L.; Coutinho, P.E.; Aguiar, L.d.F.; Galves, V.L.V.; Guida, A. Teleconnection Patterns and Synoptic Drivers of Climate Extremes in Brazil (1981–2023). Atmosphere 2025, 16, 699. [Google Scholar] [CrossRef]
  33. Badiru, A.; Humaire, L.; Wanderley, L.S.d.A.; Matzarakis, A. Impact of Climate Change on the Tourism Potential of Northeastern Brazil: Trend Analysis and Future Perspectives. Sustainability 2025, 17, 5290. [Google Scholar] [CrossRef]
  34. Gomes, V.K.I.; da Silva, A.S.A.; Araújo, L.d.S.; Stosic, T. Extreme Rainfall Analysis in Pernambuco, Northeast Brazil, Using a High-Resolution Gridded Dataset. Int. J. Clim. 2024, 44, 5693–5710. [Google Scholar] [CrossRef]
  35. Rasera, J.B.; da Silva, R.F.; Piedade, S.; Filho, F.d.A.A.M.; Delbem, A.C.B.; Saraiva, A.M.; Sentelhas, P.C.; Marques, P.A.A. Do Gridded Weather Datasets Provide High-Quality Data for Agroclimatic Research in Citrus Production in Brazil? Agriengineering 2023, 5, 924–940. [Google Scholar] [CrossRef]
  36. Sen, P.K. Estimates of the regression coefficient based on Kendall’s Tau. J. Am. Stat. Assoc. 1968, 63, 1379–1389. [Google Scholar] [CrossRef]
  37. Lindemann, D.; Avila-Diaz, A.; Freitas, R. Extremos de precipitação durante o período de plantio da soja na região do MATOPIBA. Ciência Nat. 2025, 47, 24. [Google Scholar] [CrossRef]
  38. Battisti, R.; Sentelhas, P.C. Characterizing Brazilian soybean-growing regions by water deficit patterns. Field Crop. Res. 2019, 240, 95–105. [Google Scholar] [CrossRef]
  39. Marengo, J.A.; Souza, C.M.; Thonicke, K.; Burton, C.; Halladay, K.; Betts, R.A.; Alves, L.M.; Soares, W.R. Changes in Climate and Land Use Over the Amazon Region: Current and Future Variability and Trends. Front. Earth Sci. 2018, 6, 228. [Google Scholar] [CrossRef]
  40. Kayano, M.T.; Andreoli, R.V. Relations of South American summer rainfall interannual variations with the Pacific Decadal Oscillation. Int. J. Clim. 2007, 27, 531–540. [Google Scholar] [CrossRef]
  41. Bracalenti, M.A.; Müller, O.V.; Lovino, M.A.; Berbery, E.H. The agricultural expansion in South America’s Dry Chaco: Regional hydroclimate effects. Hydrol. Earth Syst. Sci. 2024, 28, 3281–3303. [Google Scholar] [CrossRef]
  42. Sankaran, M. Droughts and the ecological future of tropical savanna vegetation. J. Ecol. 2019, 107, 1531–1549. [Google Scholar] [CrossRef]
  43. Magalhães, A.J.d.S.; Alves, J.M.B.; da Silva, E.M.; Nunes, F.T.; Barbosa, A.C.B.; dos Santos, A.C.S.; Sombra, S.S. Veranicos no Brasil: Observações e Modelagens (CMIP5). Rev. Bras. Meteorol. 2019, 34, 597–626. [Google Scholar] [CrossRef]
  44. Feron, S.; Cordero, R.R.; Damiani, A.; MacDonell, S.; Pizarro, J.; Goubanova, K.; Valenzuela, R.; Wang, C.; Rester, L.; Beaulieu, A. South America is becoming warmer, drier, and more flammable. Commun. Earth Environ. 2024, 5, 501. [Google Scholar] [CrossRef]
  45. Marengo, J.A.; Cunha, A.P.; Cuartas, L.A.; Leal, K.R.D.; Broedel, E.; Seluchi, M.E.; Michelin, C.M.; Baião, C.F.D.P.; Angulo, E.C.; Almeida, E.K.; et al. Extreme Drought in the Brazilian Pantanal in 2019–2020: Characterization, Causes, and Impacts. Front. Water 2021, 3, 639204. [Google Scholar] [CrossRef]
  46. de Medeiros, F.J.; de Oliveira, C.P. Assessment of dry and heavy rainfall days and their projected changes over Northeast Brazil in Coupled Model Intercomparison Project Phase 6 models. Int. J. Clim. 2022, 42, 8665–8686. [Google Scholar] [CrossRef]
  47. Avila-Diaz, A.; Torres, R.R.; Zuluaga, C.F.; Cerón, W.L.; Oliveira, L.; Benezoli, V.; Rivera, I.A.; Marengo, J.A.; Wilson, A.B.; Medeiros, F. Current and Future Climate Extremes Over Latin America and Caribbean: Assessing Earth System Models from High Resolution Model Intercomparison Project (HighResMIP). Earth Syst. Environ. 2023, 7, 99–130. [Google Scholar] [CrossRef]
  48. Moura, A.D.; Shukla, J. On the Dynamics of Droughts in Northeast Brazil: Observations, Theory and Numerical Experiments with a General Circulation Model. J. Atmos. Sci. 1981, 38, 2653–2675. [Google Scholar] [CrossRef]
  49. Uvo, C.B. A Zona de Convergência Intertropical (ZCIT)e sua Relação com a Precipitação da Região Norte do Nordeste Brasileiro. 1989. Available online: http://marte3.sid.inpe.br/col/sid.inpe.br/iris@1905/2005/07.27.09.06/doc/6033.pdf (accessed on 10 February 2025).
  50. Nobre, P.; Srukla, J. Variations of Sea Surface Temperature, Wind Stress, and Rainfall over the Tropical Atlantic and South America. J. Clim. 1996, 9, 2464–2479. [Google Scholar] [CrossRef]
  51. de Carvalho, M.Â.V.; Oyama, M.D. Variabilidade da largura e intensidade da Zona de Convergência Intertropical atlântica: Aspectos observacionais. Rev. Bras. Meteorol. 2013, 28, 305–316. [Google Scholar] [CrossRef]
  52. Xie, S.-P.; Carton, J.A. Tropical Atlantic Variability: Patterns, Mechanisms, and Impacts; AGU Publications: Washington, DC, USA, 2013; pp. 121–142. [Google Scholar] [CrossRef]
  53. Torres, R.R.; Marengo, J.A. Uncertainty assessments of climate change projections over South America. Theor. Appl. Clim. 2013, 112, 253–272. [Google Scholar] [CrossRef]
  54. Paredes-Trejo, F.J.; Barbosa, H.; Kumar, T.L. Validating CHIRPS-based satellite precipitation estimates in Northeast Brazil. J. Arid. Environ. 2017, 139, 26–40. [Google Scholar] [CrossRef]
  55. Marengo, J.; Cunha, A.P.; Alves, L. A seca de 2012-15 no semiárido do Nordeste do Brasil no contexto histórico. Climanalise 2016, 4, 49–54. [Google Scholar]
  56. Silva, J.d.S.; Júnior, J.B.C.; Rodrigues, D.T.; Silva, F.D.d.S. Climatology and significant trends in air temperature in Alagoas, Northeast Brazil. Theor. Appl. Clim. 2023, 151, 1805–1824. [Google Scholar] [CrossRef]
  57. Amorim, A.C.B.; Lucio, P.S.; e Silva, C.M.S.; Rodrigues, D.T.; Neto, F.A.d.B. Regionalização e Análise da Tendência da Precipitação do Rio Grande do Norte Associados a Padrões de TSM. Rev. Bras. Meteorol. 2020, 35, 269–280. [Google Scholar] [CrossRef]
  58. Morales, F.E.C.; Rodrigues, D.T.; Marques, T.V.; Amorim, A.C.B.; de Oliveira, P.T.; e Silva, C.M.S.; Gonçalves, W.A.; Lucio, P.S. Spatiotemporal Analysis of Extreme Rainfall Frequency in the Northeast Region of Brazil. Atmosphere 2023, 14, 531. [Google Scholar] [CrossRef]
  59. Tomasella, J.; Cunha, A.P.M.A.; Simões, P.A.; Zeri, M. Assessment of trends, variability and impacts of droughts across Brazil over the period 1980–2019. Nat. Hazards 2023, 116, 2173–2190. [Google Scholar] [CrossRef]
  60. dos Santos Silva, F.D.; da Costa, C.P.W.; dos Santos Franco, V.; Gomes, H.B.; da Silva, M.C.L.; dos Santos Vanderlei, M.H.G.; Costa, R.L.; da Rocha, R.L., Jr.; Cabral, J.B., Jr.; dos Reis, J.S.; et al. Intercomparison of Different Sources of Precipitation Data in the Brazilian Legal Amazon. Climate 2023, 11, 241. [Google Scholar] [CrossRef]
  61. Batista, F.F.; Rodrigues, D.T.; e Silva, C.M.S.; Andrade, L.d.M.B.; Mutti, P.R.; Potes, M.; Costa, M.J. Performance Assessment of IMERG V07 Versus V06 for Precipitation Estimation in the Parnaíba River Basin. Remote Sens. 2025, 17, 3613. [Google Scholar] [CrossRef]
  62. Ministry of Agrarian Development and Family Agriculture. Programme for Agricultural Activity Guarantee (PROAGRO); Federal Government: Brasília, Brazil, 2025. Available online: https://www.gov.br/mda/pt-br/assuntos/proagro (accessed on 23 October 2025).
  63. Ministry of Agriculture and Livestock. National Programme of Agricultural Climate-Risk Zoning (ZARC); Secretariat of Agricultural Policy, Department of Risk Management: Brasília, Brazil, 2025. Available online: https://www.gov.br/agricultura/pt-br/assuntos/riscos-seguro/programa-nacional-de-zoneamento-agricola-de-risco-climatico (accessed on 23 October 2025).
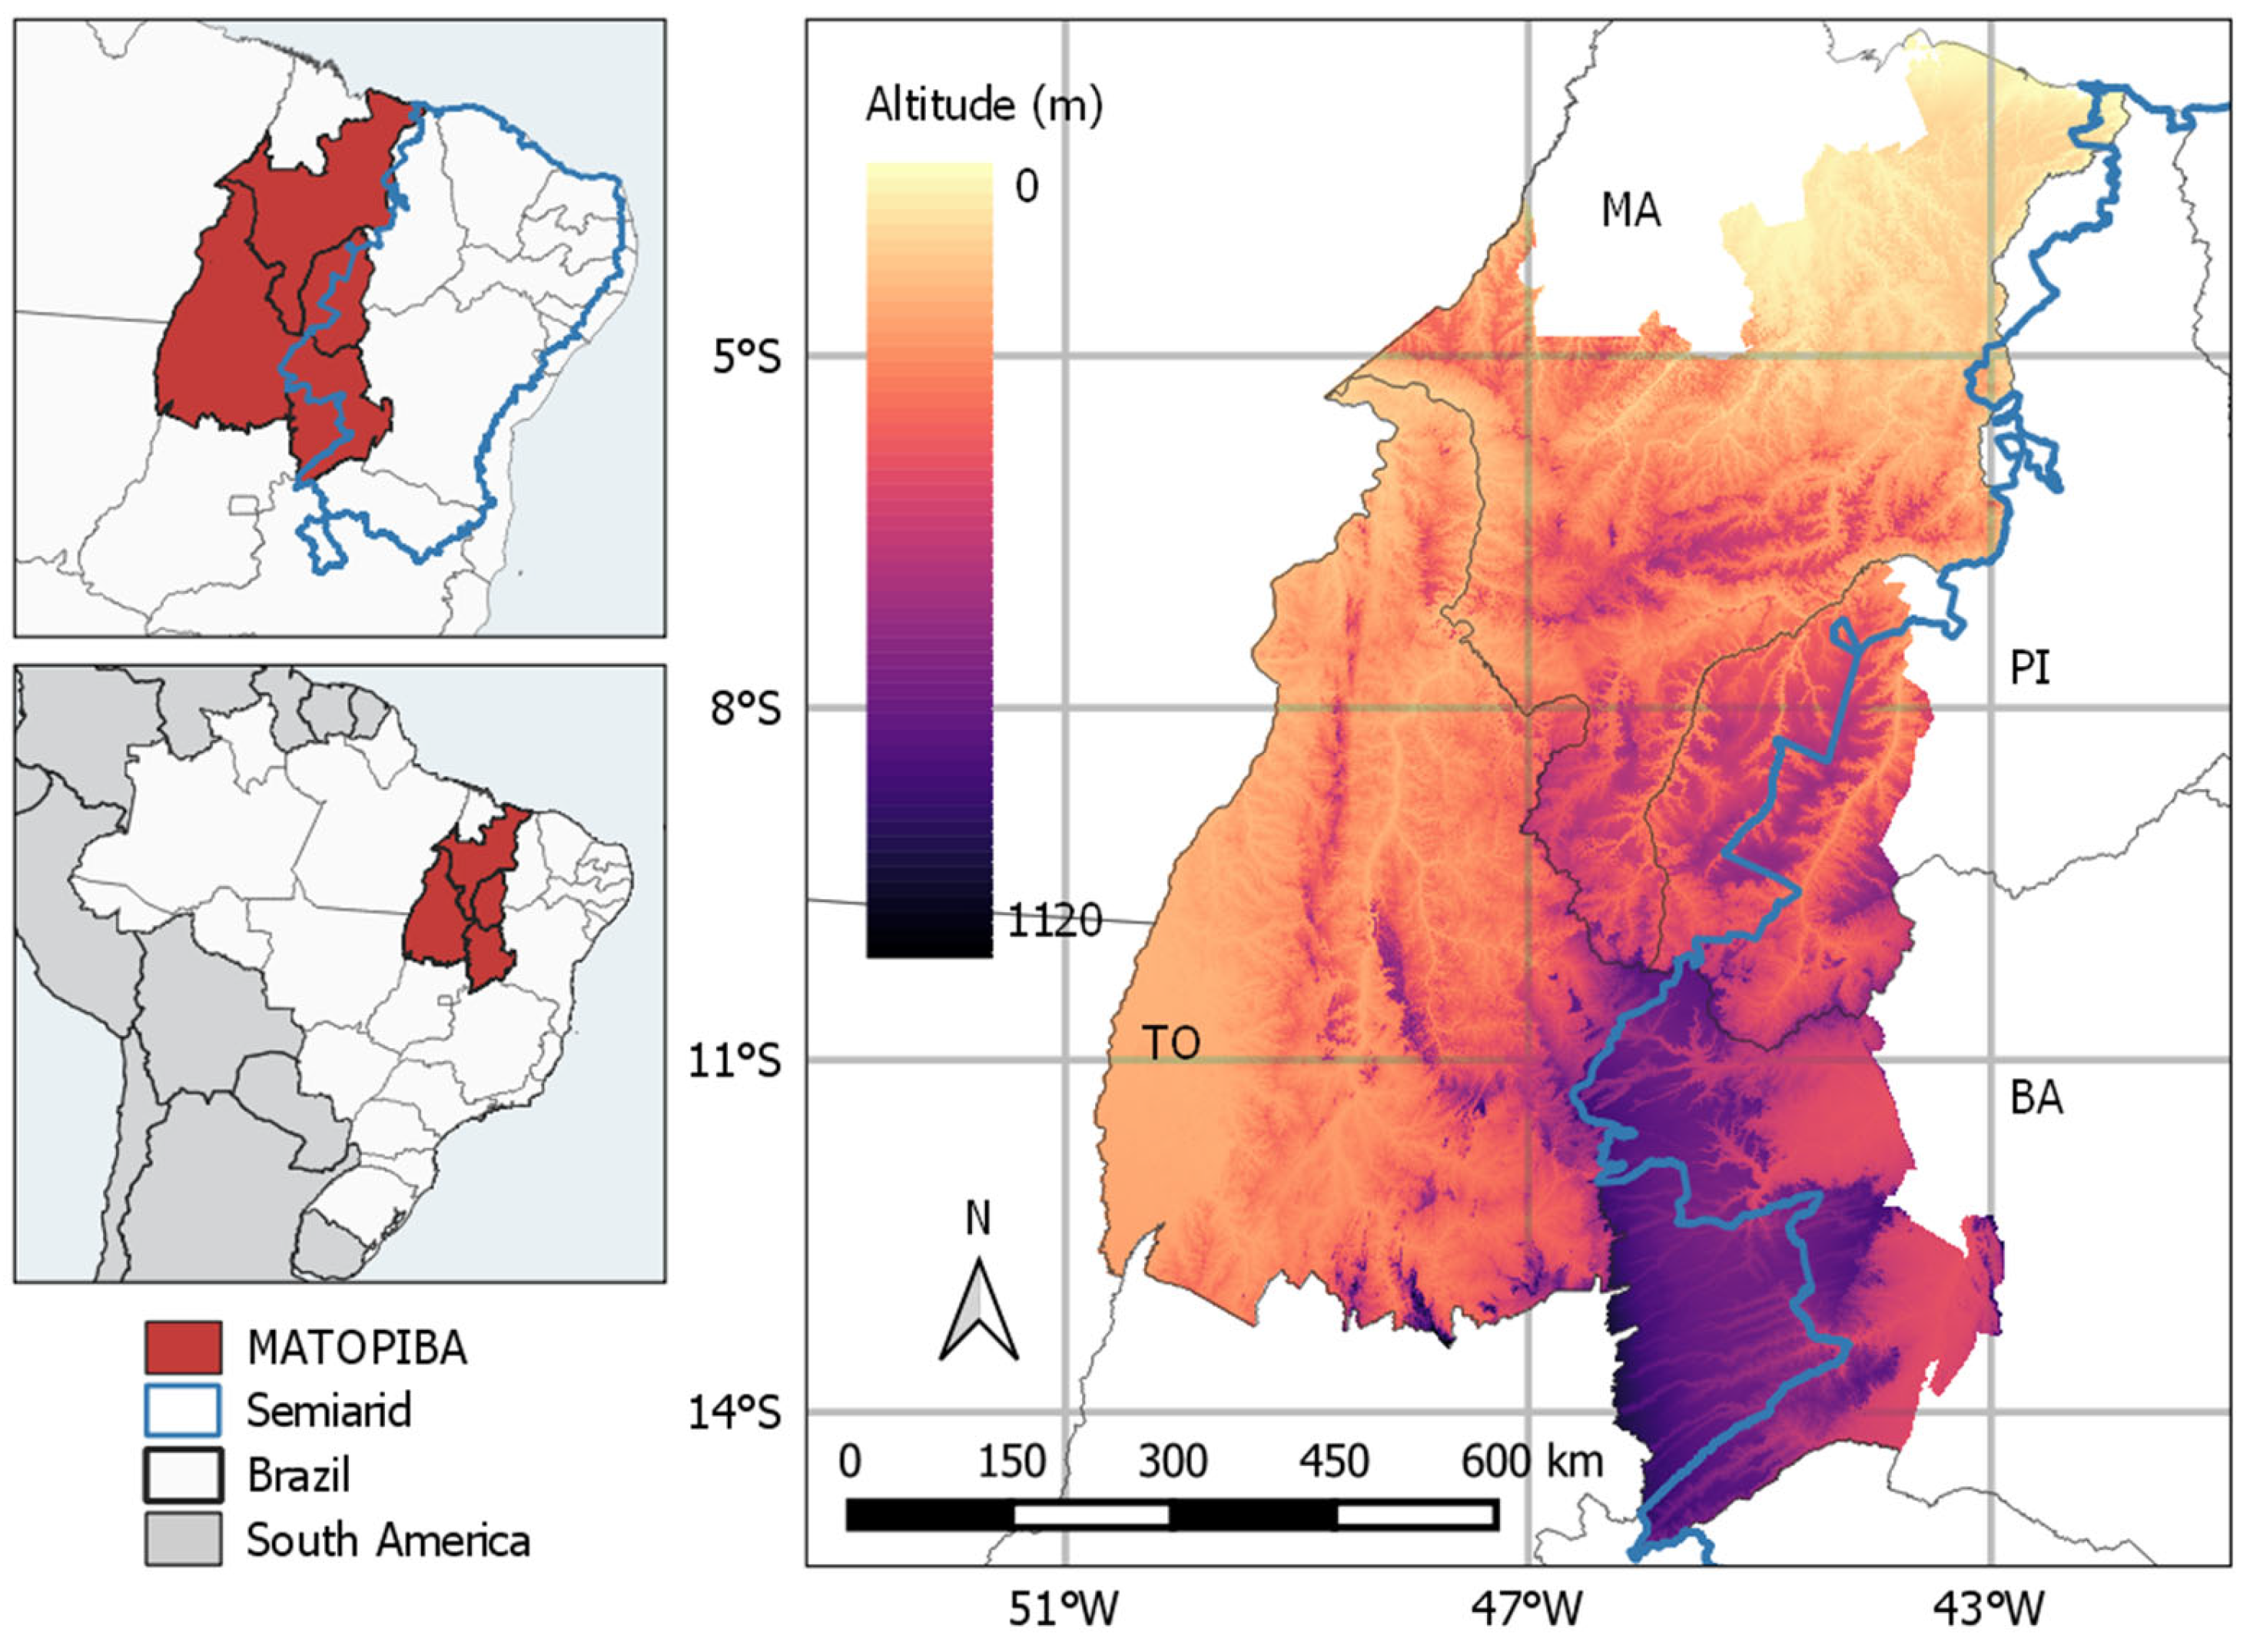
Figure 1. Location and topography of the MATOPIBA study area.
Atmosphere 16 01284 g001
Figure 2. Flowchart of methodological procedures.
Atmosphere 16 01284 g002
Figure 3. Distribution of monthly precipitation and the CDD index in MATOPIBA (1981–2023): (a) precipitation by month, (b) comparison between the dry and rainy seasons, and (c) number of CDD for both seasons. The blue circle indicates the mean of the boxplot, and the green dotted line indicates the overall mean for the entire analyzed period.
Atmosphere 16 01284 g003
Figure 4. Spatial distribution of the mean (a,b) and standard deviation (c,d) of the CDD index for the rainy season (a,c) and dry season (b,d) in MATOPIBA (1981–2023).
Atmosphere 16 01284 g004
Figure 5. Time series (a) and spatial distribution of CDD (b) with significant trends (p-value < 0.05) during the rainy season in MATOPIBA (1981–2023). The red and blue dashed lines in (a) indicate positive and negative trends, respectively.
Atmosphere 16 01284 g005
Figure 6. Time series (b) and spatial distribution of CDD (a) with significant trends (p-value < 0.05) during the dry season in MATOPIBA (1981–2023). The red line in (b) indicate positive trends.
Atmosphere 16 01284 g006
Table 1. Equations of descriptive statistics.
Descriptive StatisticsEquation
Mean x ¯ = 1 n i = 1 n x i   (1)
Standard Deviation (SD) S D = i = 1 n x i x ¯ 2   n 1 (2)
Notes: xi represents the individual values of the time series, and n denotes the total number values of the time series.
Table 2. Results of the Mann–Kendall test showing the number and percentage of pixels with statistically significant trends (p-value < 0.05) in the CDD index, by state and seasonal period in the MATOPIBA region.
TrendStateNumber of Pixels (Percentage) with Significant TrendsTotal Number of Pixels
Rainy SeasonDry Season
IncreaseMaranhão/MA217 (11.1%)269 (13.1%)1950
Tocantins/TO234 (10.2%)1367 (59.6%)2292
Piauí/PI49 (7.3%)7 (1.0%)675
Bahia/BA207 (18.8%)224 (20.3%)1102
DecreaseMaranhão/MA33 (1.7%)6 (1.0%)1950
Disclaimer/Publisher’s Note: The statements, opinions and data contained in all publications are solely those of the individual author(s) and contributor(s) and not of MDPI and/or the editor(s). MDPI and/or the editor(s) disclaim responsibility for any injury to people or property resulting from any ideas, methods, instructions or products referred to in the content.