Article

Fair Weather and Electric Field Convective Generator

Institute of Cosmophysical Research and Radio Wave Propagation FEB RAS, Mirnaya Str., 7, Elizovskiy District, Kamchatka, 684034 Paratunka, Russia
Atmosphere 2025, 16(11), 1282; https://doi.org/10.3390/atmos16111282
Submission received: 15 October 2025 / Revised: 7 November 2025 / Accepted: 10 November 2025 / Published: 11 November 2025
(This article belongs to the Section Atmospheric Techniques, Instruments, and Modeling)

Abstract

Atmospheric electricity measurements are very sensitive to weather conditions. Fair weather for atmospheric electricity in Kamchatka (Russia) was determined by the method of expert assessment at an observatory. After the transition to automated digital methods for measuring meteorological parameters, the necessity to determine the criteria of fair weather appeared. In this paper we developed the criteria for fair weather based on digital measurements in summer and winter observation periods in view of a limited set of meteorological instruments. A database of fair weather since 2009 up to the present was created. We suggest the algorithm to determine fog during a day on the basis of air humidity measurements. The morning convective generator effect occurs sometimes in diurnal variations in atmospheric electricity. The morning convection maximum is determined by the sunrise time. This entails the problems of averaging the electric field diurnal variation over a long time period. We suggest taking into account the days with morning convective generator effect and the days without this effect separately when processing a long series of data.

1. Introduction

Atmospheric electric field (AEF) is formed by the potential difference between the positively charged ionosphere and the negatively charged ground. This ground–ionosphere condenser is charged in the regions with lightning and discharged in fair weather (FW) regions. The flowing currents form the global electric circuit (GEC) [1,2,3]. In the quasi-steady case, the vertical component of electric field strength is equal to the potential gradient (PG) with an opposite sign, E z = P G . PG diurnal variation over oceans demonstrates unitary diurnal variation, reaching the minimum at about 03:00 UT and the maximum at about 19:00 UT, that is called the Carnegie curve [4]. The PG diurnal average demonstrates strong similarity with the Carnegie curve in polar regions [5,6,7]. At Vostok station (Antarctica), almost ideal correlation both in form and in amplitude was observed between the PG average curve and the Carnegie curve [5]. However, the PG, measured at middle and southern latitudes, shows deviations both in form and in amplitude compared to the Carnegie curve [8,9]. This occurs mainly due to the geographic location of measurements, air pollution impact, and meteorological parameter changes (temperature, wind, relative humidity, etc.). PG diurnal variation maximums at many stations fall within the local morning time close to sunrise. Such maximums are observed in China [10], Pakistan [11,12], India [13,14], and Israel [15,16]. There are cases when the PG diurnal maximums occur during local evening or nighttime hours [17,18].
We consider a PG morning maximum. The first report on the sunrise effect in diurnal variations in the electric parameters in the near-Earth atmosphere appeared in [19]. It was found that electric parameters, such as the electric field strength, air conductivity, conductivity currents, and spatial charge, tend to decrease during night and subsequently increase at sunrise. The main characteristics of the sunrise effect in electric field time variations were studied in detail by many authors. It turned out that the effect starts either at sunrise [20] or 20–30 min later [21]. Its duration is ∼4–7 h [22], ∼4 h [23], ∼3–4 h [24], and ∼3 h [21]. The delay of the field strength maximum relative to the sunrise instant is ∼2.5 h [20], ∼2–4 h [25], and ∼1–1.5 h [21]. The strength value at the effect maximum is larger than the presunrise level by factors of ∼2.5–3 [20], ∼3 [22], and ∼4 [21]. Chalmers noted that increases in the conductive current of atmosphere–ground and in PG were observed during the sunrise and just after it [26]. This is associated with convective and turbulent processes in the near-ground air due to the beginning of warming of the ground surface and the up-transfer of ions. Current generation in the morning was called morning convective generator (MCG) [20]. At Paratunka observatory ( φ = 52.97 ° N; λ = 158.25 ° E), located 50 km from the Pacific Ocean coast on Kamchatka peninsula (Russia), the PG maximum is observed at local morning time in FW conditions.
The history of determining the FW dates back more than a century. During the Carnegie schooner expedition, FW criteria included a description of the PG curve. This was necessary to determine the norm for PG measurements. When the norm was determined, PG description was excluded from the criteria. This made it possible to search for PG anomalies in FW conditions. In cases with a limited set of meteorological instruments, there is a necessity to find approaches which would compensate for data absence. The authors [27] proposed to use ERA5 reanalysis for measurements at Lerwick observatory. At Paratunka observatory, there is no instrument to measure the amount of clouds; however, there is an instrument to measure solar energy flux density. The paper presents criteria for FW meteorological parameters, which completely describe weather states and allow us to apply them in real time.

2. History of Determination of Fair Weather

During the Carnegie schooner expeditions (1909–1929), when PG unitary variation was determined, the criteria for data sampling were as follows [28]:
  • No negative PG values during a day;
  • PG is always less than 1000 V/m during a day.
An approach similar to magnetic measurements was used at Lerwick observatory (UK) (1927–1963). The UK Met Office classification system recorded a day with only positive PG values as type 0, while days with negative PG records were categorized as 1 or 2 according to the duration of negative PG. A letter (a, b, or c) was appended after those numbers to signify the range and frequency of extreme PG values encountered [29].
In 1964, other criteria were introduced. They were based on the recommendations of the working party of the United Committee on Atmospheric Electricity organized on the basis of the International Association of Meteorology and Atmosphere Physics (IAMAP) and International Association of Geomagnetism and Aeronomy (IAGA). They are as follows:
  • No hydrometeors (any water or ice particles that have formed in the atmosphere or at the Earth’s surface as a result of condensation or sublimation);
  • No low stratus clouds (cloud base is higher than 300 m);
  • Cumuliform clouds in amounts of up to three eighths until they affect the PG record;
  • Ground wind average hourly velocity (measured at the height of 10 m) of less than 8 m/s.
These four criteria can significantly affect the PG data sampling. Criterion 1 is used to avoid rain, hail and snow effects. Criterion 2 is used to avoid fog and very low cloudiness effects. Criterion 3 is used to avoid strong effects, which may occur as a result of the passage of an intensely electrified convective cloud over an observation point. Criterion 4 decreases local effects associated with the resuspension of dust and snow, which can transfer charge and minimize bias currents occurring during space charge blow out [28].
In 1965, in the “Instruction on preparation of the content and publication of the results of atmospheric electric observations”, published by the Main Geophysical Observatory (MGO) named after Alexander Ivanovich Voeykov in Leningrad, electrically favorable conditions implied the absence of negative PG, PG exceeding 1000 V/m and the amount of clouds being less than three eighths, as well as an absence of precipitation, fog, local or remote lightning [30].
Then, fair weather conditions were determined as follows: air temperature within the range from 50 to +50 °C; air pressure from 650 to 1080 hPa; amount of clouds of not more than 3; wind velocity up to 6 m/s; and the absence of thunderstorm, precipitation, fog, mist, snowdrift, snowstorm.
At the present time, the Russian Meteorological Service accepts the following fair weather conditions: absence of thunderstorm, precipitation, frost, rime, fog, intensive or moderate mist (visibility is more than 4 km); low cloudiness, in particular cumulus clouds (cloud amounts not more than three eighths); and an absence of snowstorm, snowdrift, dust wind and wind exceeding 6 m/s [31].
In the GloCAEM (Global Coordination of Atmospheric Electricity Measurements) network, the following fair weather criteria were accepted [28,32]:
  • No hydrometeors;
  • No low stratus clouds. At most, 3 octas of cumulus clouds or no more than 1 octa when electric effects are clear;
  • Wind velocity at a height of 2 m is determined by the following formula: 1 m/s < u2 < 7 m/s.
In the Chinese Meridian Project network, the following criteria were accepted [10]:
(1)
Wind speed <8 m/s;
(2)
Relative humidity ≤80%;
(3)
Visibility ≥15 km;
(4)
No precipitation;
(5)
AEF value between 0 and 1 kV/m;
(6)
Geomagnetic activity index K p < 3 .
Not all the observatories where AEF is measured are equipped with a complete set of meteorological instruments which make it possible to take all FW factors into account. In this paper, we consider the ways of determining the FW conditions based on a limited set of measurements of meteorological parameters.

3. Measurement Instrumentation and Methods at Paratunka Observatory

Paratunka observatory is located in the south of Kamchatka peninsula. The distance to the Pacific ocean is about 30 km. The coordinates of the location are φ = 52.97 ° N and λ = 158.25 ° E. The height above sea level is 76 m. The main instrument for AEF measurements at the Paratunka observatory is the Pole-2 sensor, developed at the Main Geophysical Observatory, Russia. Pole-2 is an electrostatic fluxmeter type device. Pole-2 is installed on the site 200 m from the administrative building at a height of 3 m. The area around it is cleared from trees within a radius of 12 m. The design of the sensor installation is such that the surfaces of constant electric field strength are parallel to the ground (Figure 1). The lattice design allows air ions to rise freely from the ground surface to the measurement point.
An experiment to estimate the reduction was carried out at Paratunka observatory. The second AEF sensor was installed at the ground level. Then, the data measured at a height of 3 m and the data measured at the ground level were compared and the value of the relation for these data was estimated. To form a database of AEF measurements, we multiply the data obtained at a height of 3 m by this coefficient and obtain the data adjusted for the ground level. This coefficient is constant for all seasons.
The electric characteristics of the lower atmosphere are highly dependent on meteorological conditions. Therefore, the instruments of Paratunka observatory include a digital weather station. It measures the following parameters: air temperature, humidity, wind velocity, wind direction, air pressure, precipitation level and solar energy flux density. The measurement interval is 10 min. A researcher keeps a log of observations. Meteorological phenomena, the level of cloudiness, the snow level in winter, and fog are recorded there. The rain gauge can measure only liquid precipitation correctly. The phenomenon of snowfall is determined by records in the observation log and by measuring the snow cover.

4. Morning Convective Generator Effect

PG diurnal variation maximums, coinciding in time with local sunrise, are observed in fair weather conditions at many observatories across the globe. Such observatories are located at middle and southern latitudes. PG diurnal variation maximums close to sunrise are also determined when data over a several-year period are averaged [10,11,14,15,16].
The morning convective generator effect can be represented as follows. Electric current density in the atmosphere in FW conditions is described by the following formula:
j = λ E + ρ V + D t ρ ,
where λ is the electrical conductivity of the atmosphere; E is the electric field strength; ρ is the density of electric charges; V is the hydrodynamic velocity of the medium; and D t is the turbulent diffusion coefficient. In a quasistationary case, current density is determined by the first term and attributed to the effect of the global electric circuit (GEC). After the sunrise, as a result of turbulent heat transfer, turbulent mixing processes ( D t ρ ) come into action, as well as the upward transfer ( ρ V ) of positive space charge, accumulated over a night near the ground surface, by air convective flow. This, in its turn, causes PG increase near the ground surface and the intensification of electric conductive current.
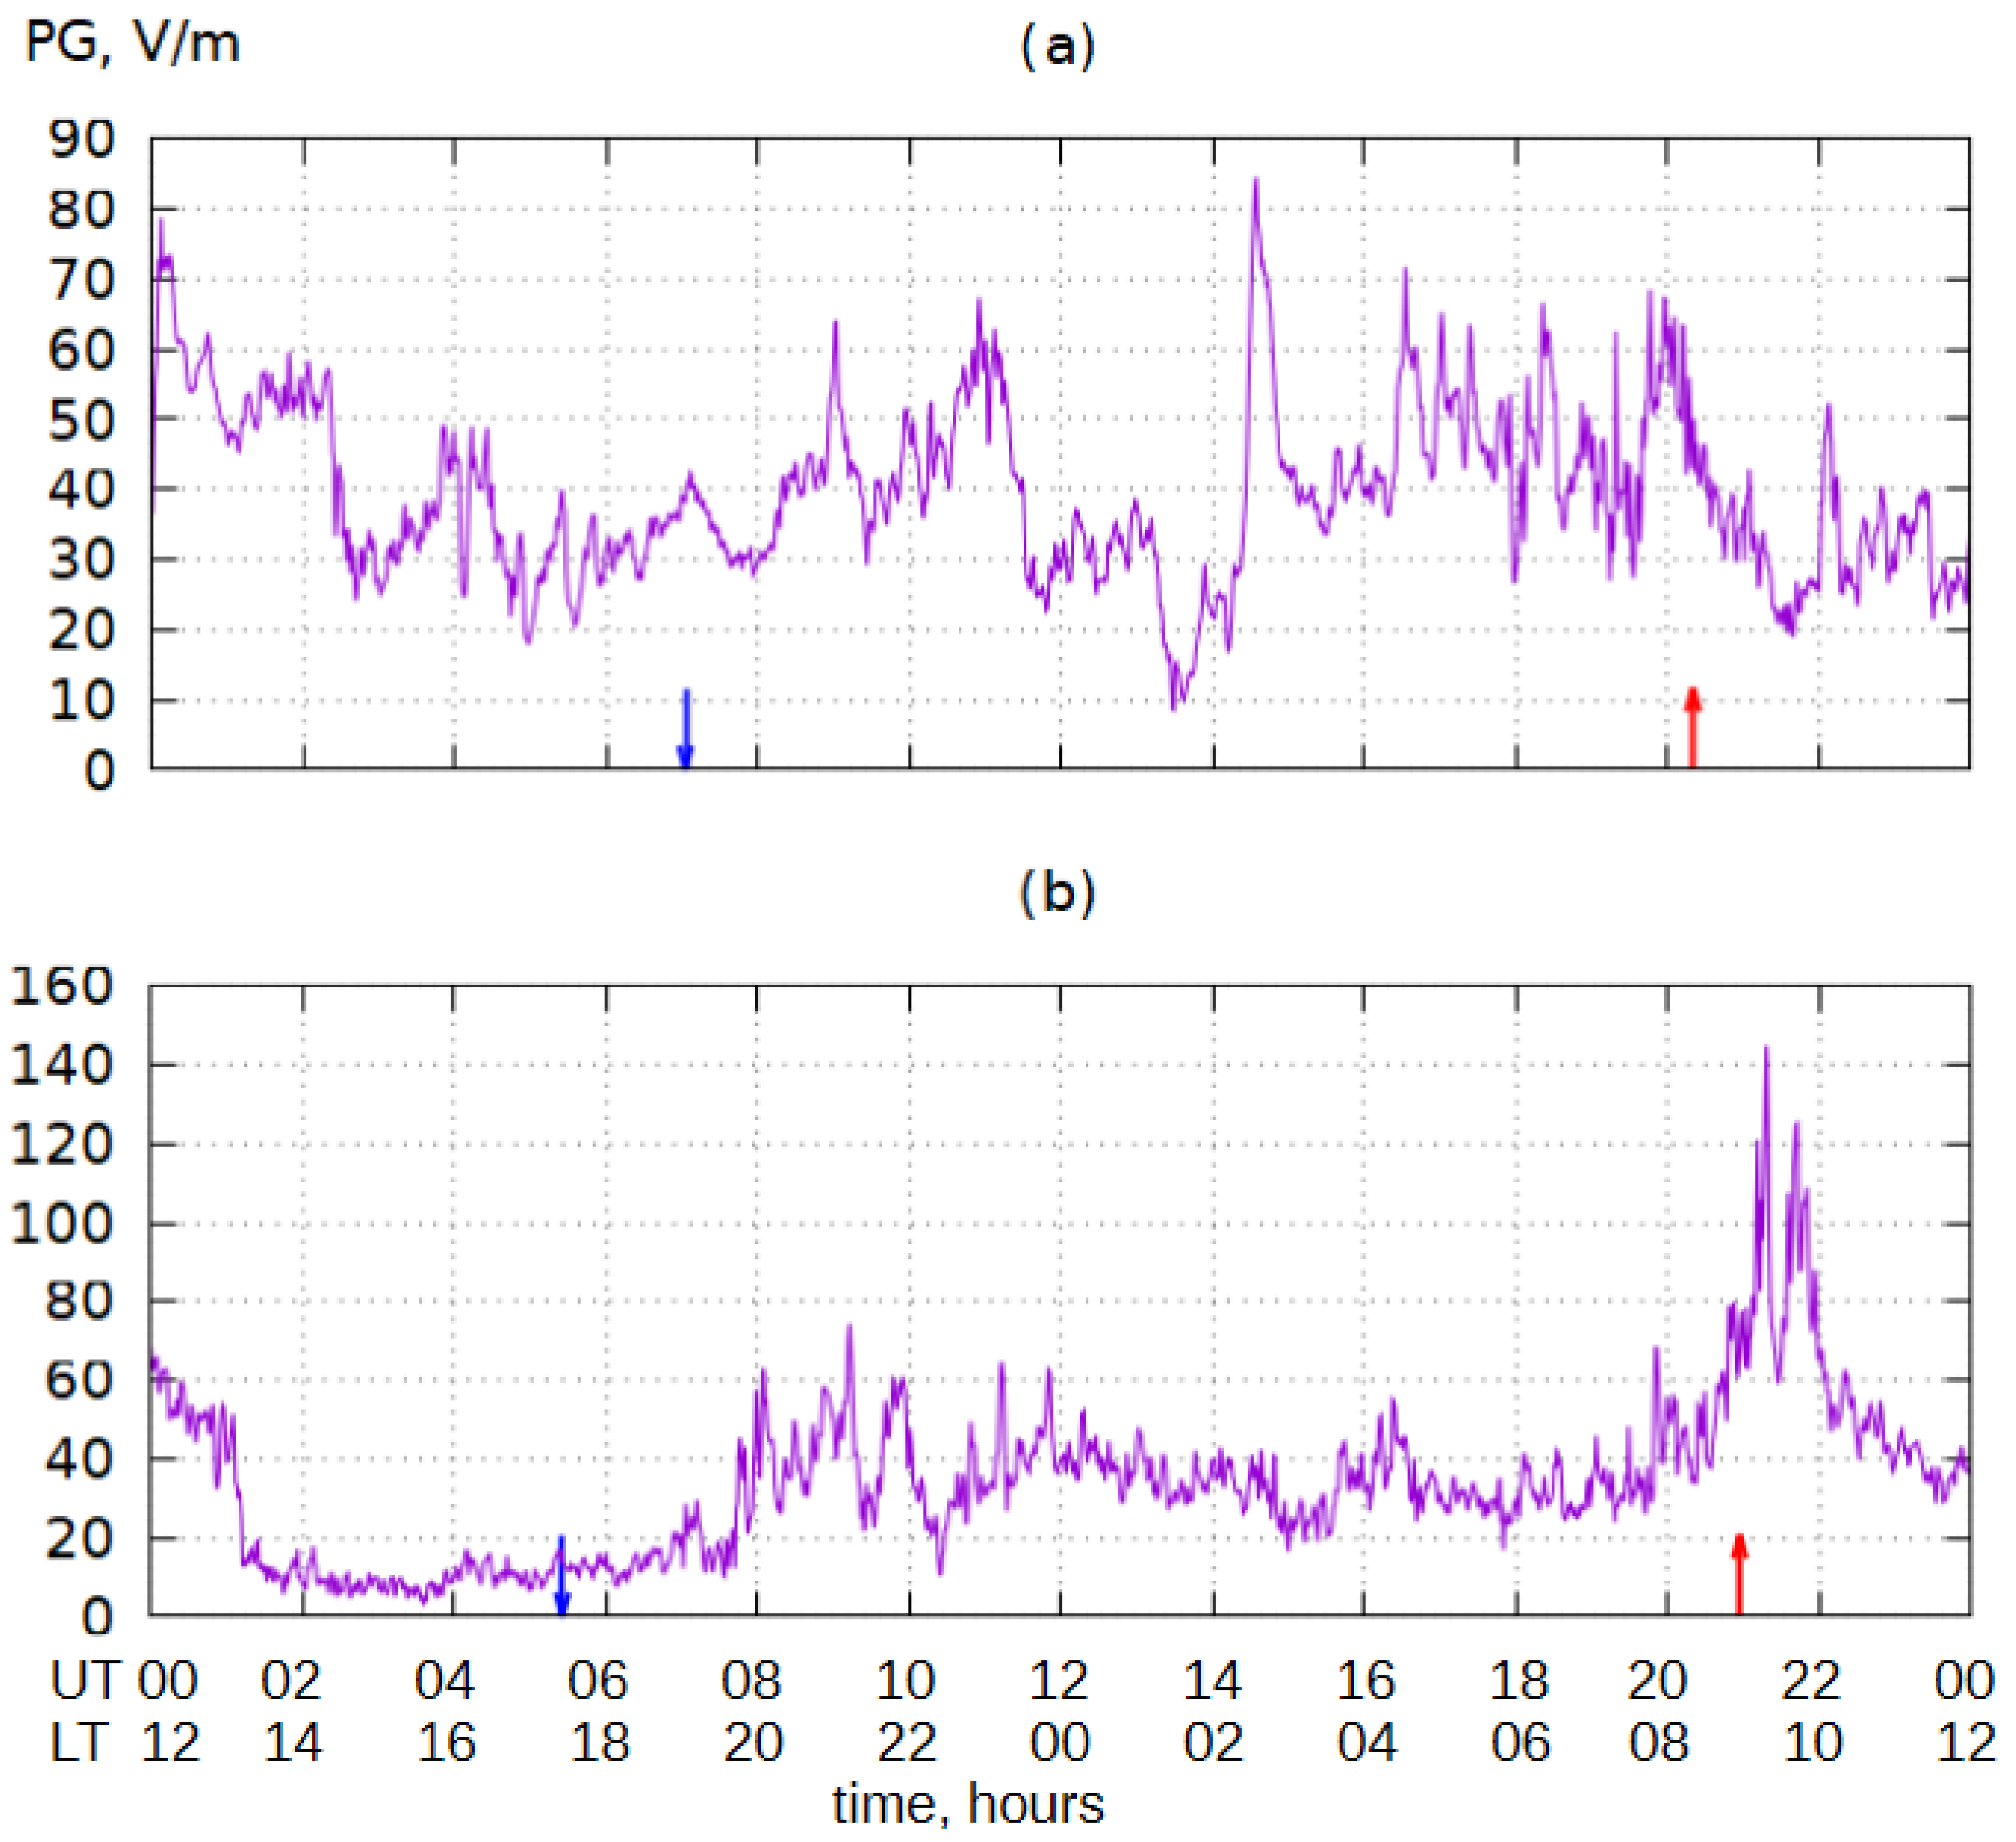
Figure 2 shows the examples of PG diurnal variation in FW conditions at Paratunka observatory. Local time in Paratunka is shifted by 12 h relative to universal time, LT = UTC + 12. Figure 2a illustrates the PG diurnal variation on 28 February 2025. The maximum wind velocity at a height of 25 m was 4.0 m/s, air pressure was 1009.4 hPa, and solar energy flux density was 642 W/m2. Figure 2b represents the PG diurnal variation on 3 November 2024. The maximum wind velocity at a height of 25 m was 4.5 m/s, air pressure was 1007.4 hPa, and solar energy flux density was 455 W/m2.
As we see for similar weather conditions, the morning convection effect is observed (Figure 2b) in some cases and not observed in other cases (Figure 2a).
The peculiarity of Paratunka observatory location is the time closeness of unitary variation maximum to PG maximum in local mornings. To determine the PG morning maximum nature, the following experiment was carried out. The PG was measured simultaneously with air temperatures at heights of 3 and 25 m. Graphs of temperature difference dT at these heights and PG graphs were constructed. A high correlation of 0.7 between dT and PG was obtained. This experiment was described in detail in the paper [31].
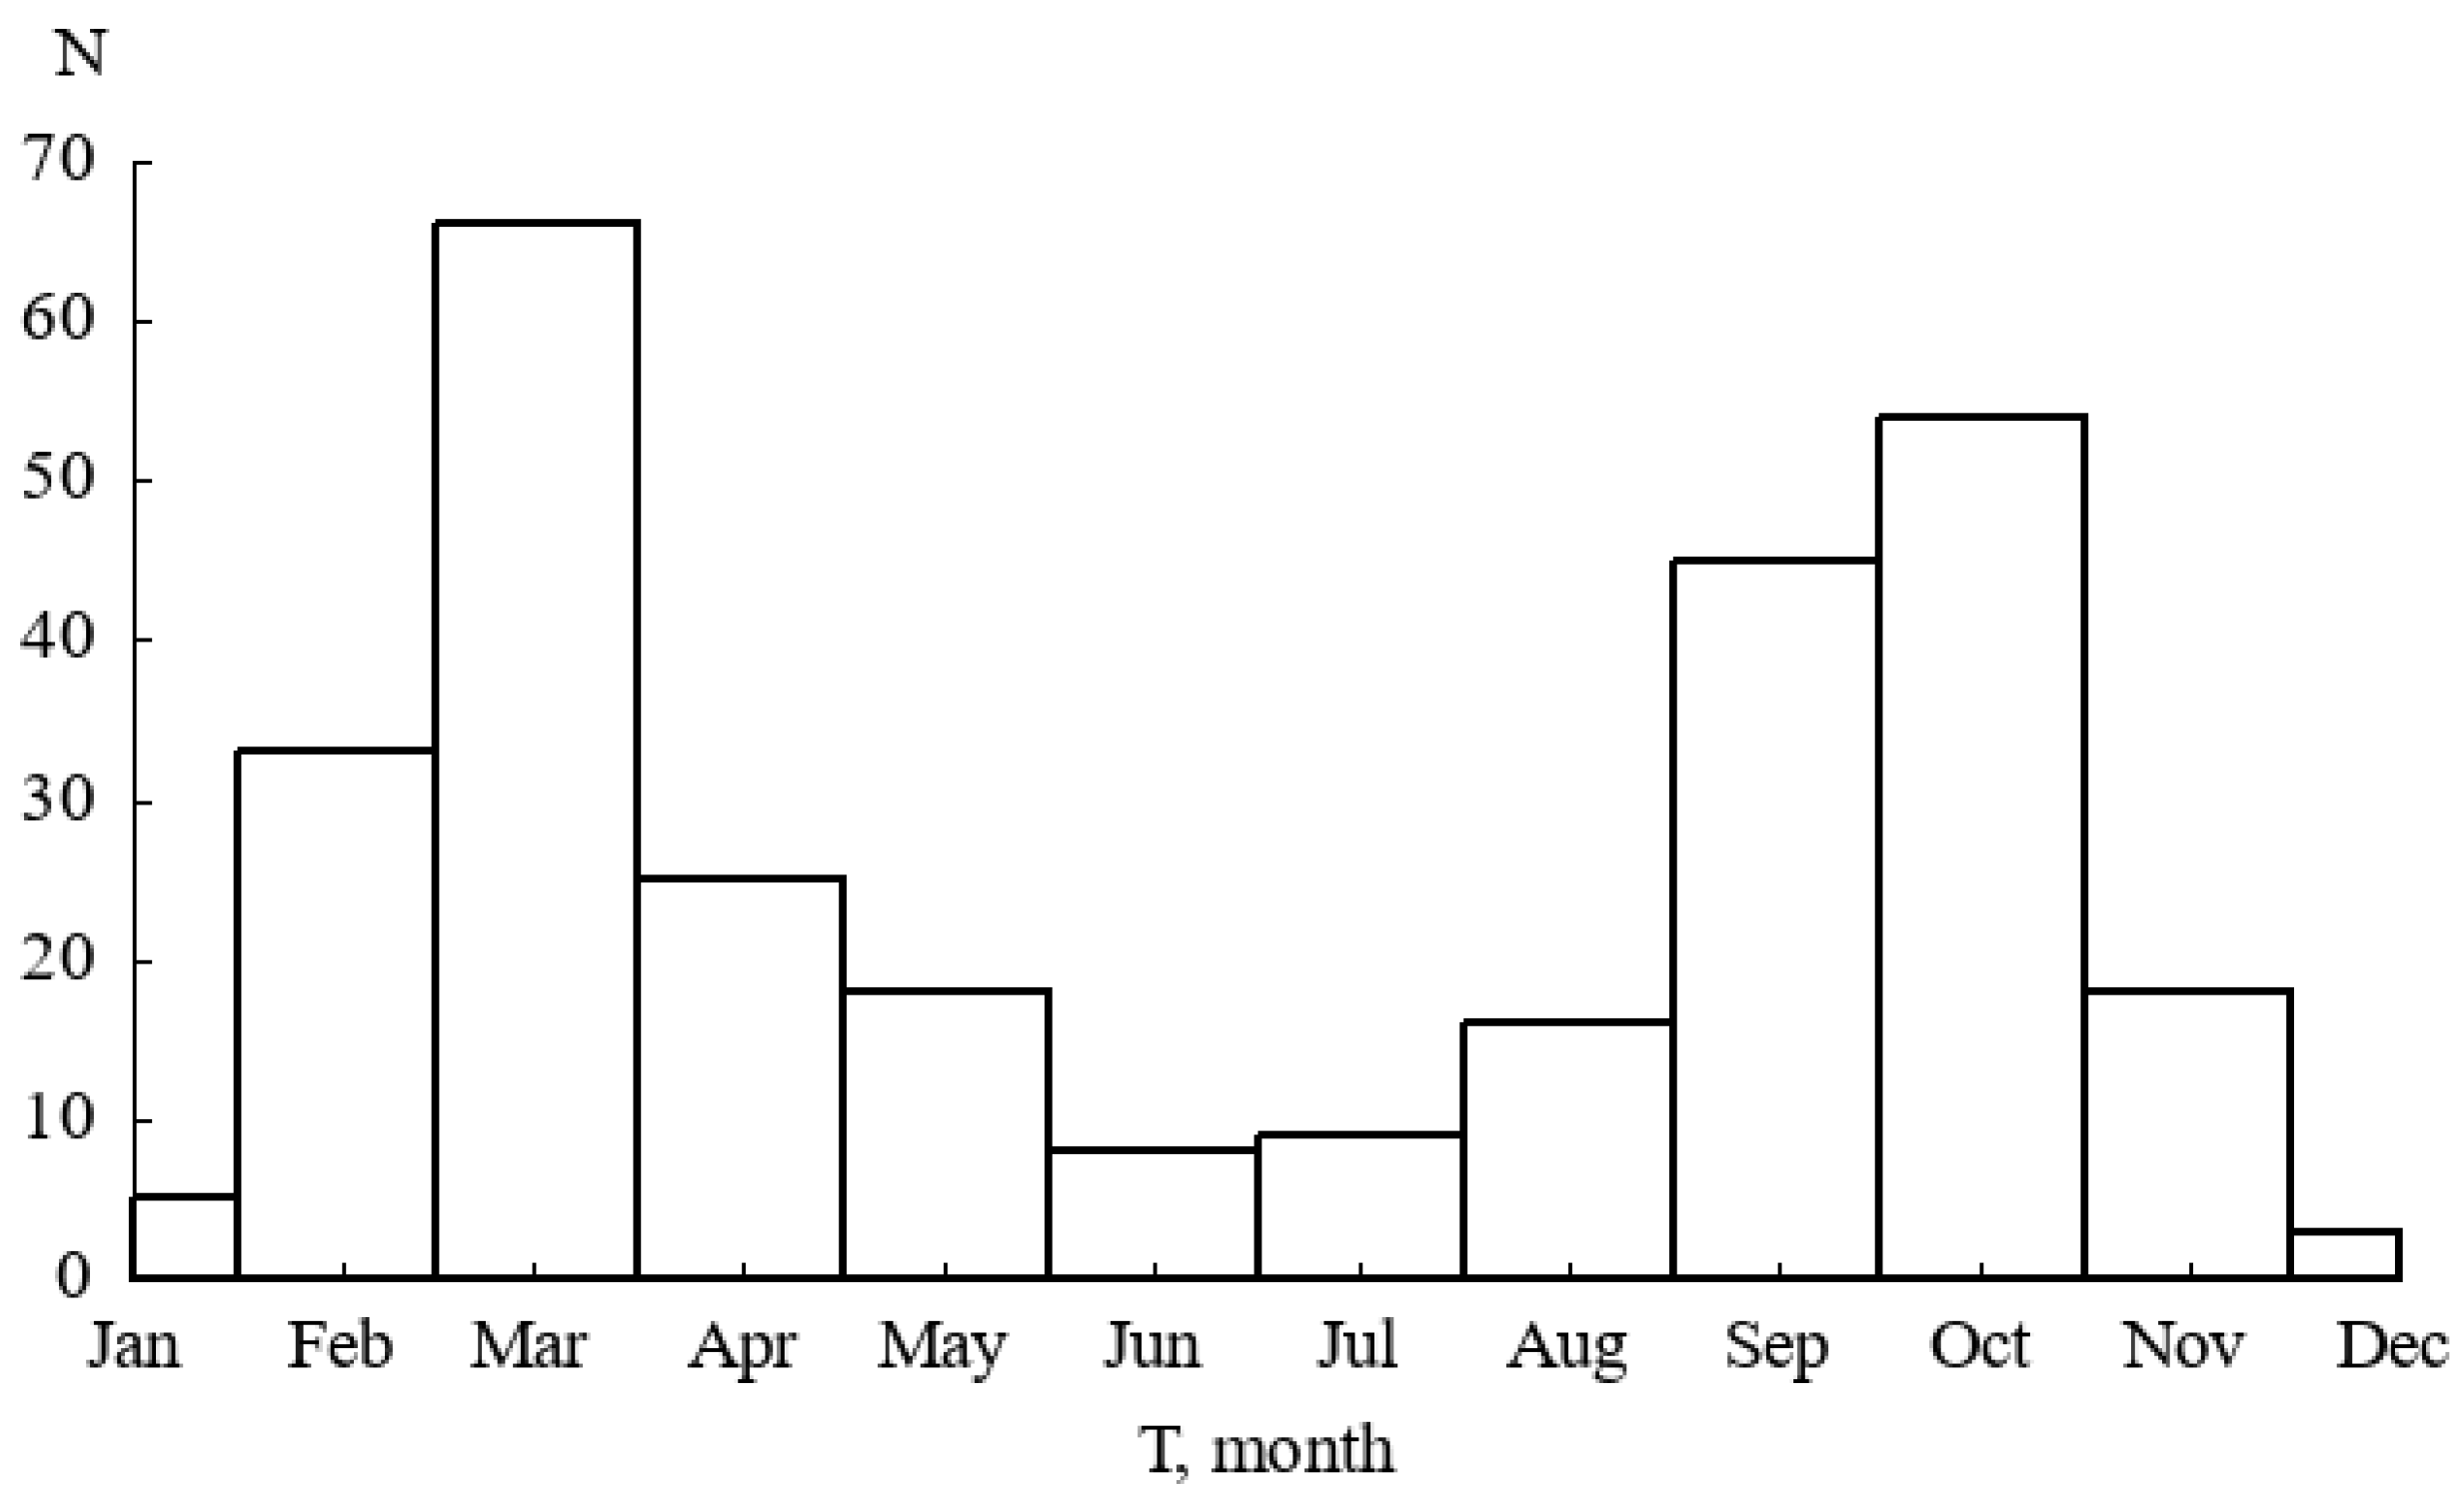
Days with morning convection effect were selected for the period from 1 July 2009 until 1 November 2020. There were 300 days in total. Figure 3 shows a histogram of the monthly distribution of such days. PG diurnal variation with maximum values during morning hours in FW conditions is more frequently observed in March and October.
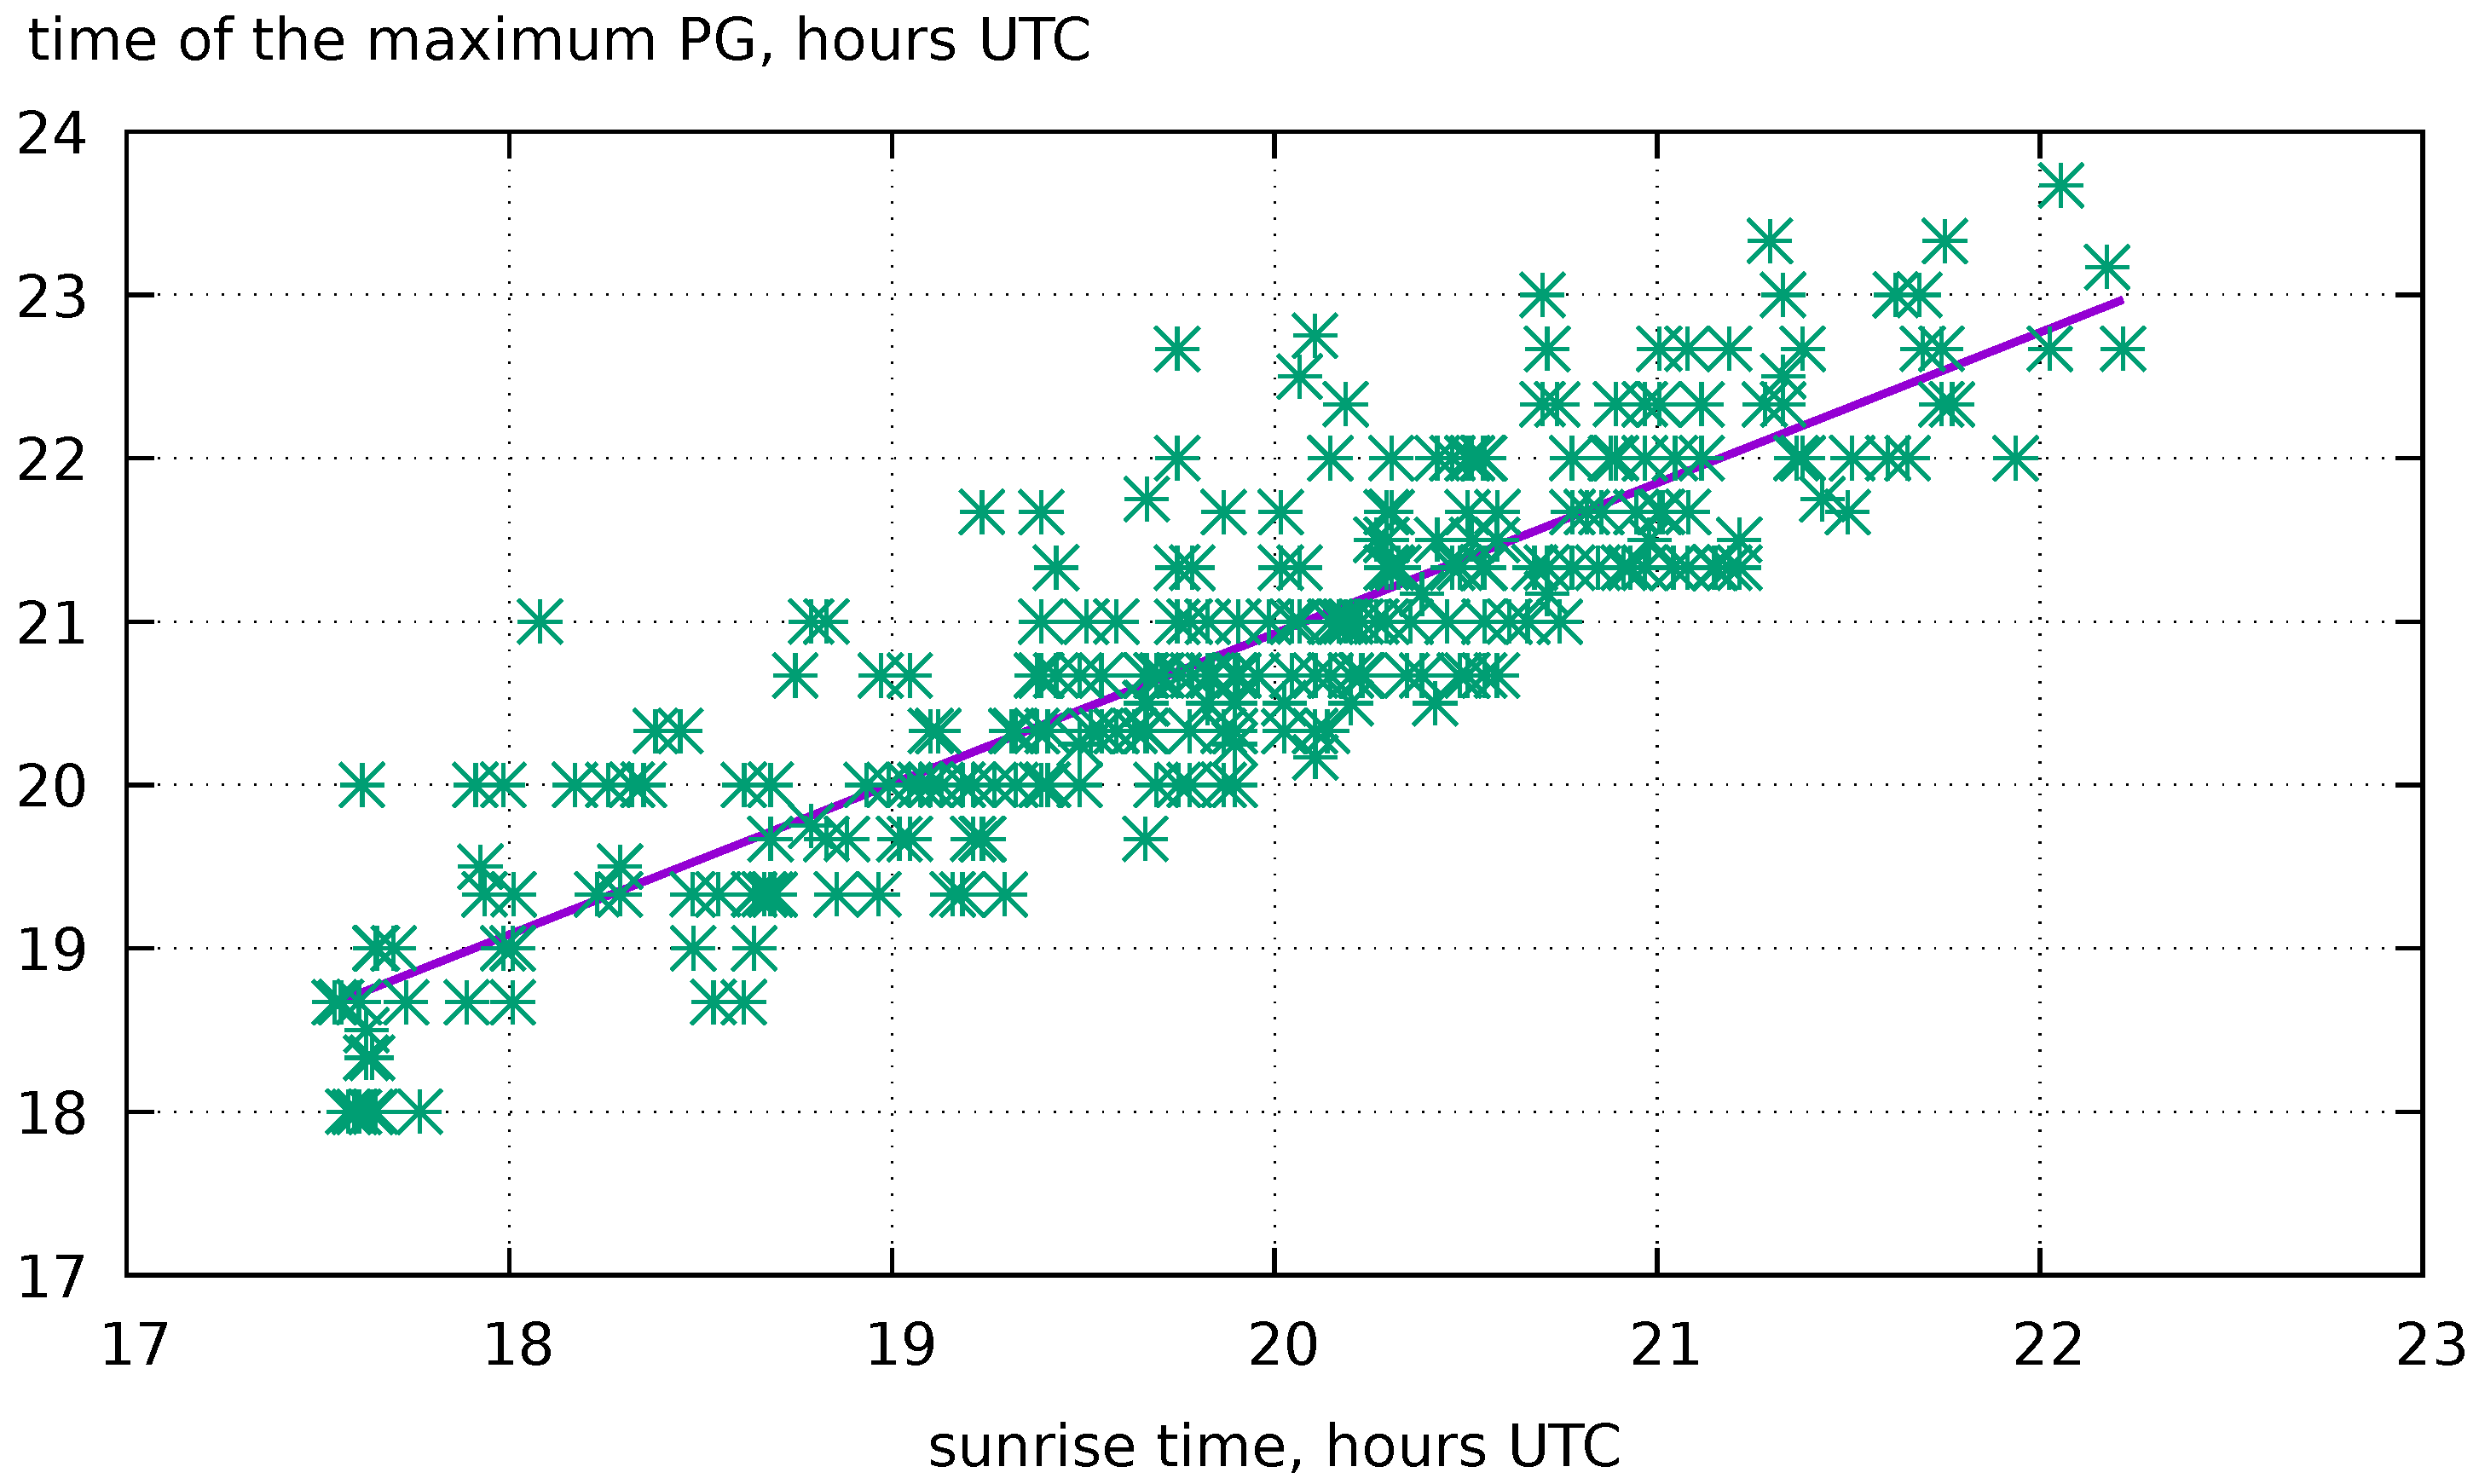
We construct the following graph. We plot the sunrise time UTC on the abscissa and the PG diurnal variation maximum time UTC in FW conditions on the ordinate. Then we approximate the data according to the formula Y = AX + B. If the A coefficient in this formula is close to zero, then the PG maximum near Paratunka observatory is determined by unitary variation. If the A coefficient is close to 1, the PG coefficient is determined by local factors. In Figure 4, the asterisks show the observed maximums of PG diurnal variation in FW conditions, and the straight line indicates their approximations according to this formula. As a result of the approximation, it was obtained that A = 0.92, B = 2.5, and the mean-root-square error is =0.03. The correlation coefficient is equal to 0.9. Thus, the PG diurnal variation maximum time is shifted during a year, along with the sunrise time in the region.

5. Selecting the Fair Weather Criteria

In all cases, the morning convective generator occurs in fair weather conditions; as such, we will take just these parameters of meteorological measurements as the basis. Air pressure, relative humidity, wind velocity at the height of 25 m, air temperature and solar energy flux density are measured at the observatory automatically in real time. Moreover, observers keep a log where they record weather conditions manually. The MCG occurs during the following magnitude values over a day:
  • Humidity minimum 16–67%;
  • Wind 0–12 m/s;
  • Air pressure 982.2–1035.9 hPa;
  • Solar radiation 352–520 W/m2.
We consider each parameter separately.

5.1. Precipitation

Hydrometeors must not be presented in FW conditions. The precipitation gauge must show 0 mm. However, real precipitation gauges cannot always catch all types of hydrometeors and we relied on observation log records when selecting archive data. An indirect indication of precipitation is the air humidity value.

5.2. Air Humidity

The more significant parameter of FW is not the air average humidity but its minimum value. Having set the minimum threshold value of humidity, we can eliminate drizzle, slight rain, humid and cloudy weather, as well as long-time fog.
When analyzing the data, we obtained the following values: for the summer period H m i n < 67 % , for the winter period H m i n < 69 % .

5.3. Fog

The PG diurnal variation is affected not by short-time but long-time fog. At other observatories, fog is determined by the visibility distance. For the Kamchatka climate, an air humidity of more than 95% for more than 3 h is considered characteristic if of fog. This threshold humidity value helps us to determine not only fog but wet cloudy weather as well.

5.4. Solar Energy Flux Density

Cloudiness level can be assessed by the solar energy flux density. Clouds prevent the penetration of sunlight into the ground surface and decrease its value. Processing results showed that this value should be >520 W/m2 for summertime and >350 W/m2 for wintertime in FW conditions.

5.5. Wind Velocity

It is very important to know at what height a sensor is installed for wind velocity measurements. At Paratunka observatory, the measurements are carried out at a height of 25 m. In order to reduce the wind velocity value at a height of 25 m to the wind velocity at a height of 2 m, we use the following formula [34]:
u 2 = u 25 / ( 25 / 2 ) 1 / 7 .
The wind velocity equal to 12 m/s at a height of 25 m corresponds to the wind velocity of 8.4 m/s at a height of 2 m. This value is close to the analogous criteria of FW.
It was suggested by the authors of [28] that we begin the left limit for the wind velocity not from 0 but from 1 m/s. The reason for such a change was as follows. In the conditions of wind low velocity, charged aerosol can be collected near the PG sensor. It will be scattered during over-ventilation. The collected aerosol scattering will prevent the MCG generation. We consider to what extent the application of such a criterion for wind velocity will release from the MCG effect under the observation conditions at Paratunka observatory. We select the MCG effect data from July 2009 to 1 April 2025 with 10 min averaging. We estimate the wind velocity maximum value over a day. According to Formula (2), a wind velocity of 1 m/s at a height of 2 m corresponds to a wind velocity of 1.4 m/s at a height of 25 m. The statistics include 542 cases of MCG. Of these, only 22 cases occurred when the wind velocity was <1.5 m/s. This means that if we rise the lower boundary of wind velocity criterion from 0 to 1.4 m/s, we exclude only 4% of MCG cases.

5.6. Air Pressure

Air pressure is an important factor of weather. Low air pressure indicates cyclone approach, which entails rain, snow, wind, and low clouds. High air pressure means anticyclone, clear weather, windless conditions, and a clear sky. However, the criteria listed above describe weather states more accurately and overlap with the range of acceptable values for air pressure. Thus, any limits on this criterion are needless.

5.7. Additional Parameters

Kamchatka is a region with high seismic activity. In FW conditions, negative PG anomalies are sometimes observed before earthquakes [35]. During magnetic storms, positive and negative anomalies are observed [36]. Thus, if we want to investigate PG anomalies associated with seismic activity, we have to demand the planetary magnetic activity index K p < 4 . If we want to investigate the solar activity impact on PG in FW conditions, we should introduce limits for seismic activity in the region with a magnitude < 4 .
The climate peculiarity of Kamchatka peninsula is its formation by the cyclones passing at middle latitudes of the Pacific ocean. As a result of this, meteorological parameters on the peninsula change very slowly compared to changes on the continents. Thus, it is reasonable here to apply weather criteria over a day under investigation.
Thus, FW criteria during a day for Paratunka observatory are as follows:
For summer time
  • Precipitation 0 mm;
  • Maximum wind velocity u 25 < 12 m/s;
  • Air humidity minimum <67%;
  • Maximum solar energy flux density >520 W/m2;
  • Air humidity of more than 95% for less than 3 h.
For winter time
  • Precipitation 0 mm;
  • Maximum wind velocity u 25 < 12 m/s;
  • Air humidity minimum <69%;
  • Maximum solar energy flux density >350 W/m2;
  • Air humidity of more than 95% for less than 3 h.

6. Application of FW Criteria for Long Data Series Processing

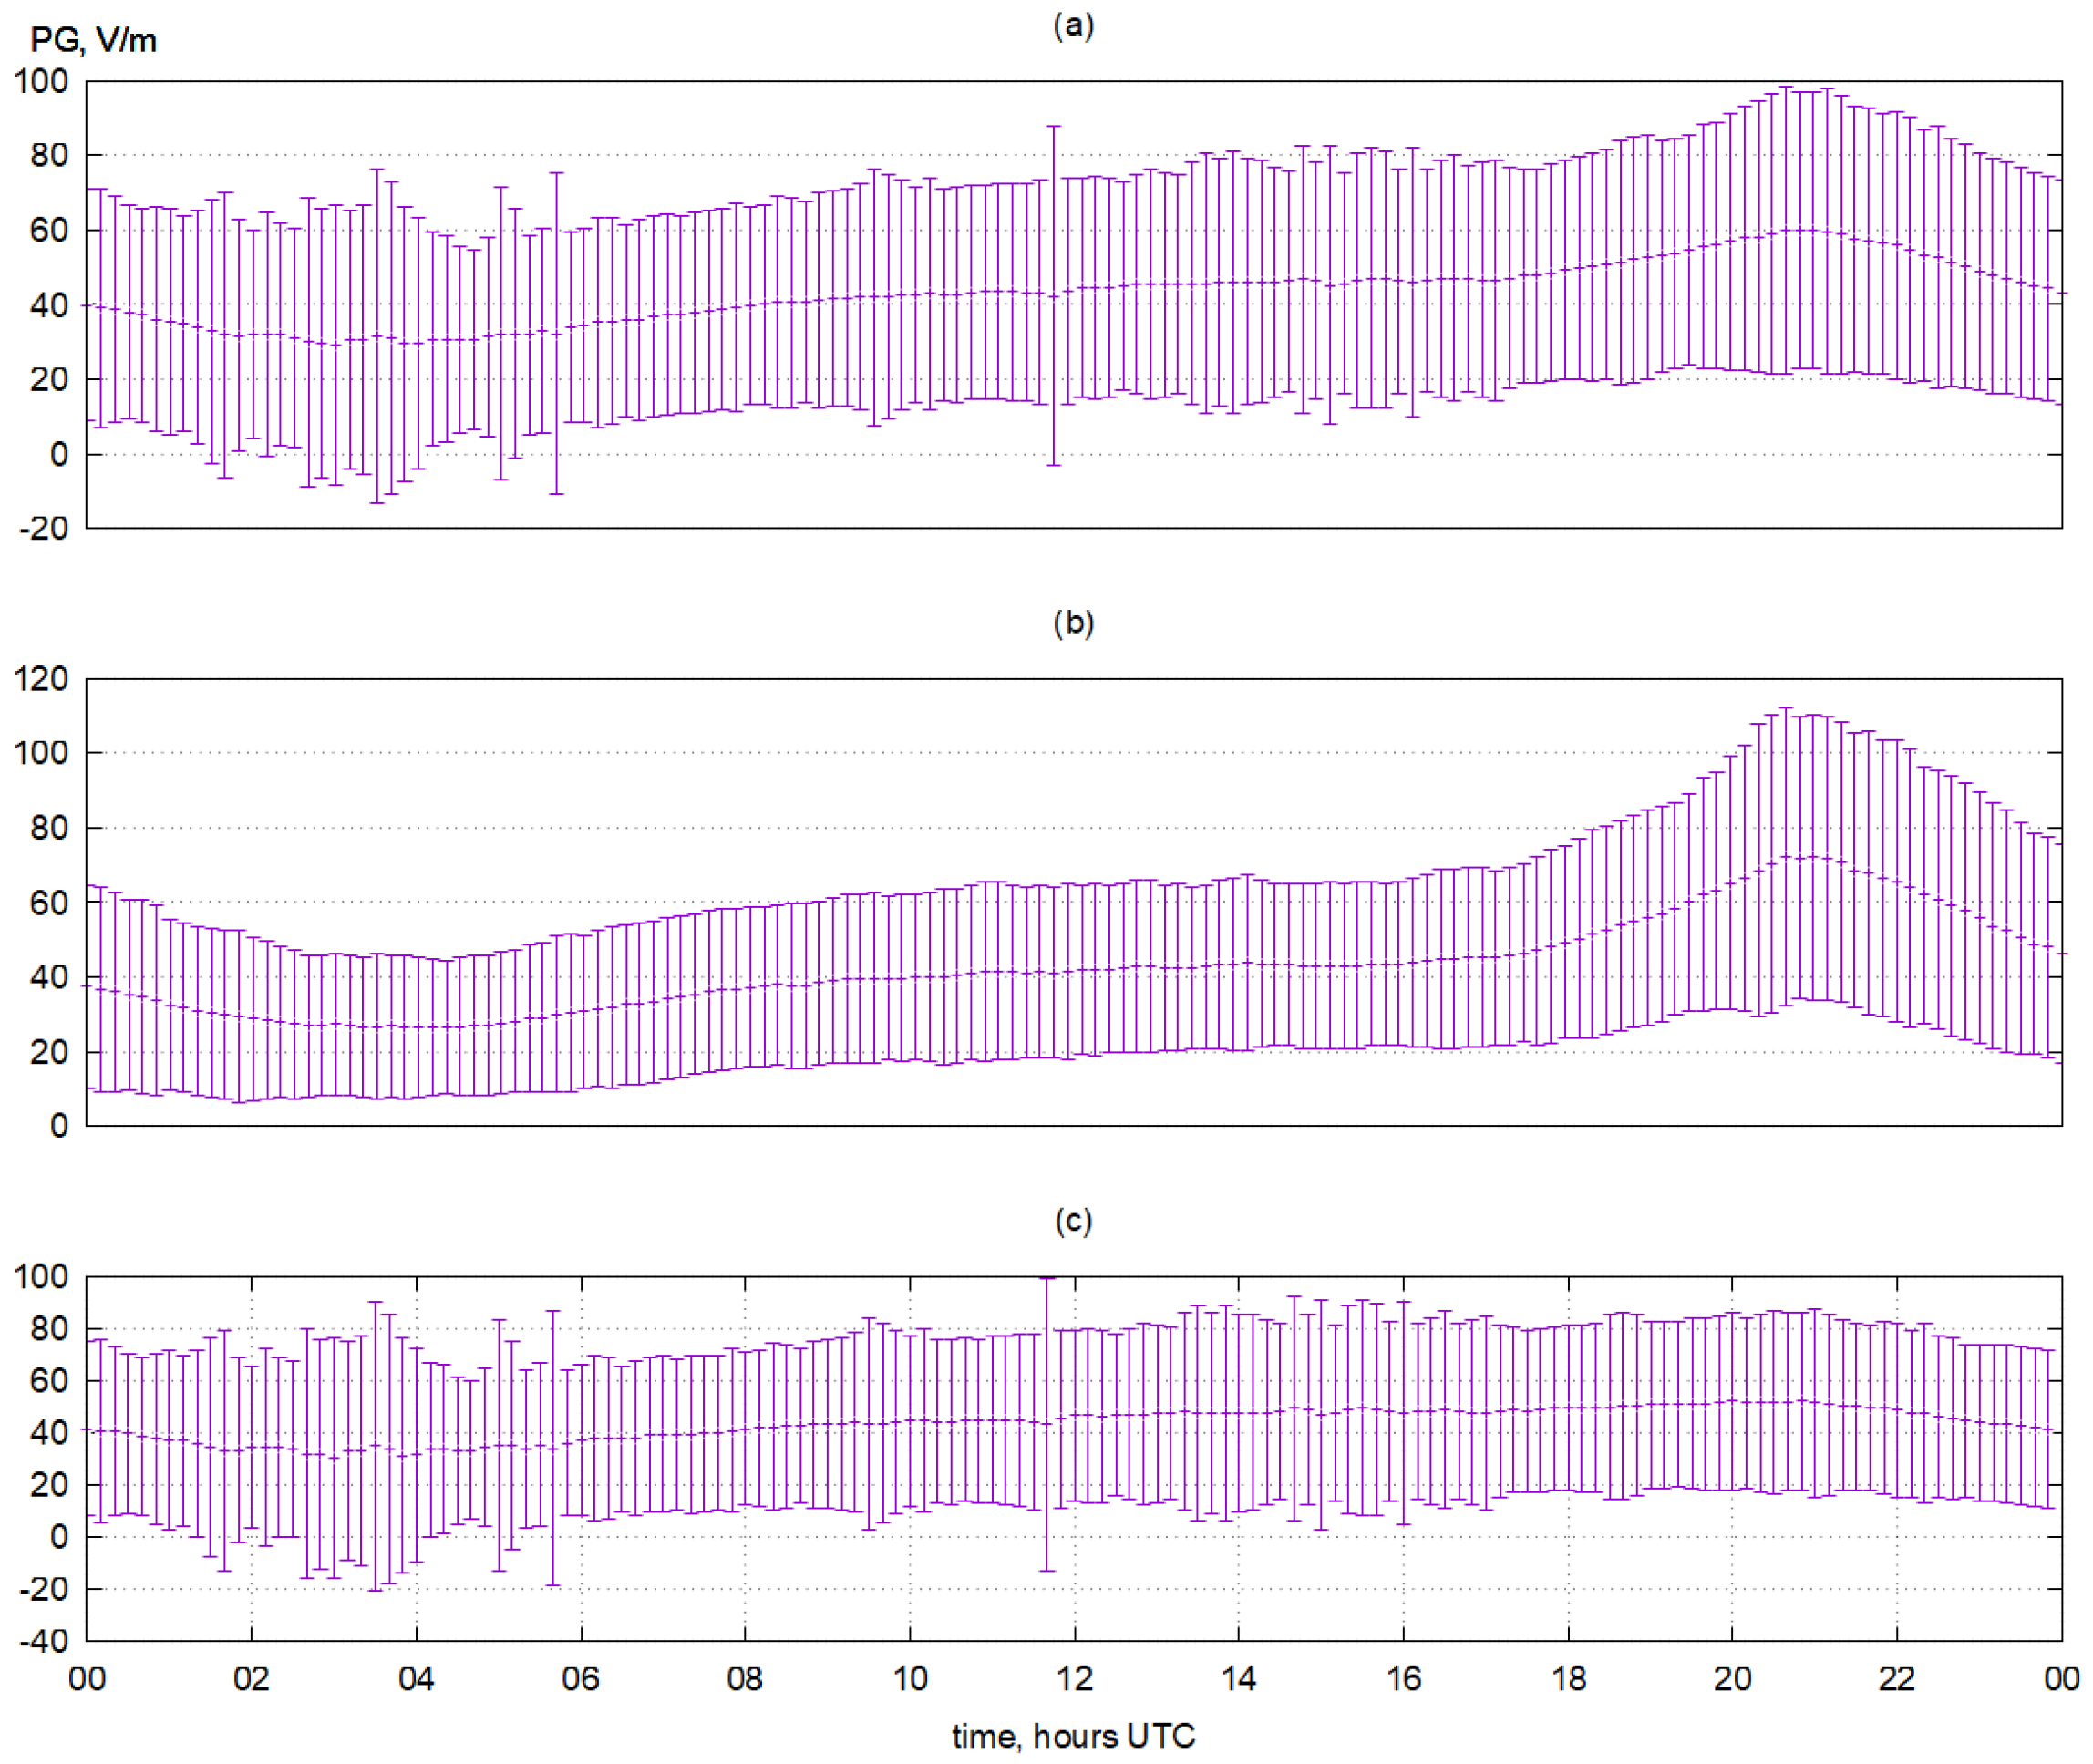
We apply the obtained FW criteria for processing the PG data at Paratunka observatory. When processing the long series of data, we can take into account the challenges. We should accept that morning convection is the determining factor of PG diurnal variations in FW conditions. Figure 5 shows the PG diurnal variation for the period from 1 July 2009 to 1 January 2025 with root-mean-square deviation (1362 events). Figure 5a shows all the PG data during FW conditions that we obtained. We see diurnal variation maximum during the local morning hours. Figure 5b illustrates only the data obtained when MCG (525 events) occurred, while Figure 5c presents the data without the MCG effect (837 events). The MCG effect occurred in 39% of the total number of days with FW. For the Kamchatka climate, 90 days per year are characterized by fair weather, as determined with the suggested criteria.
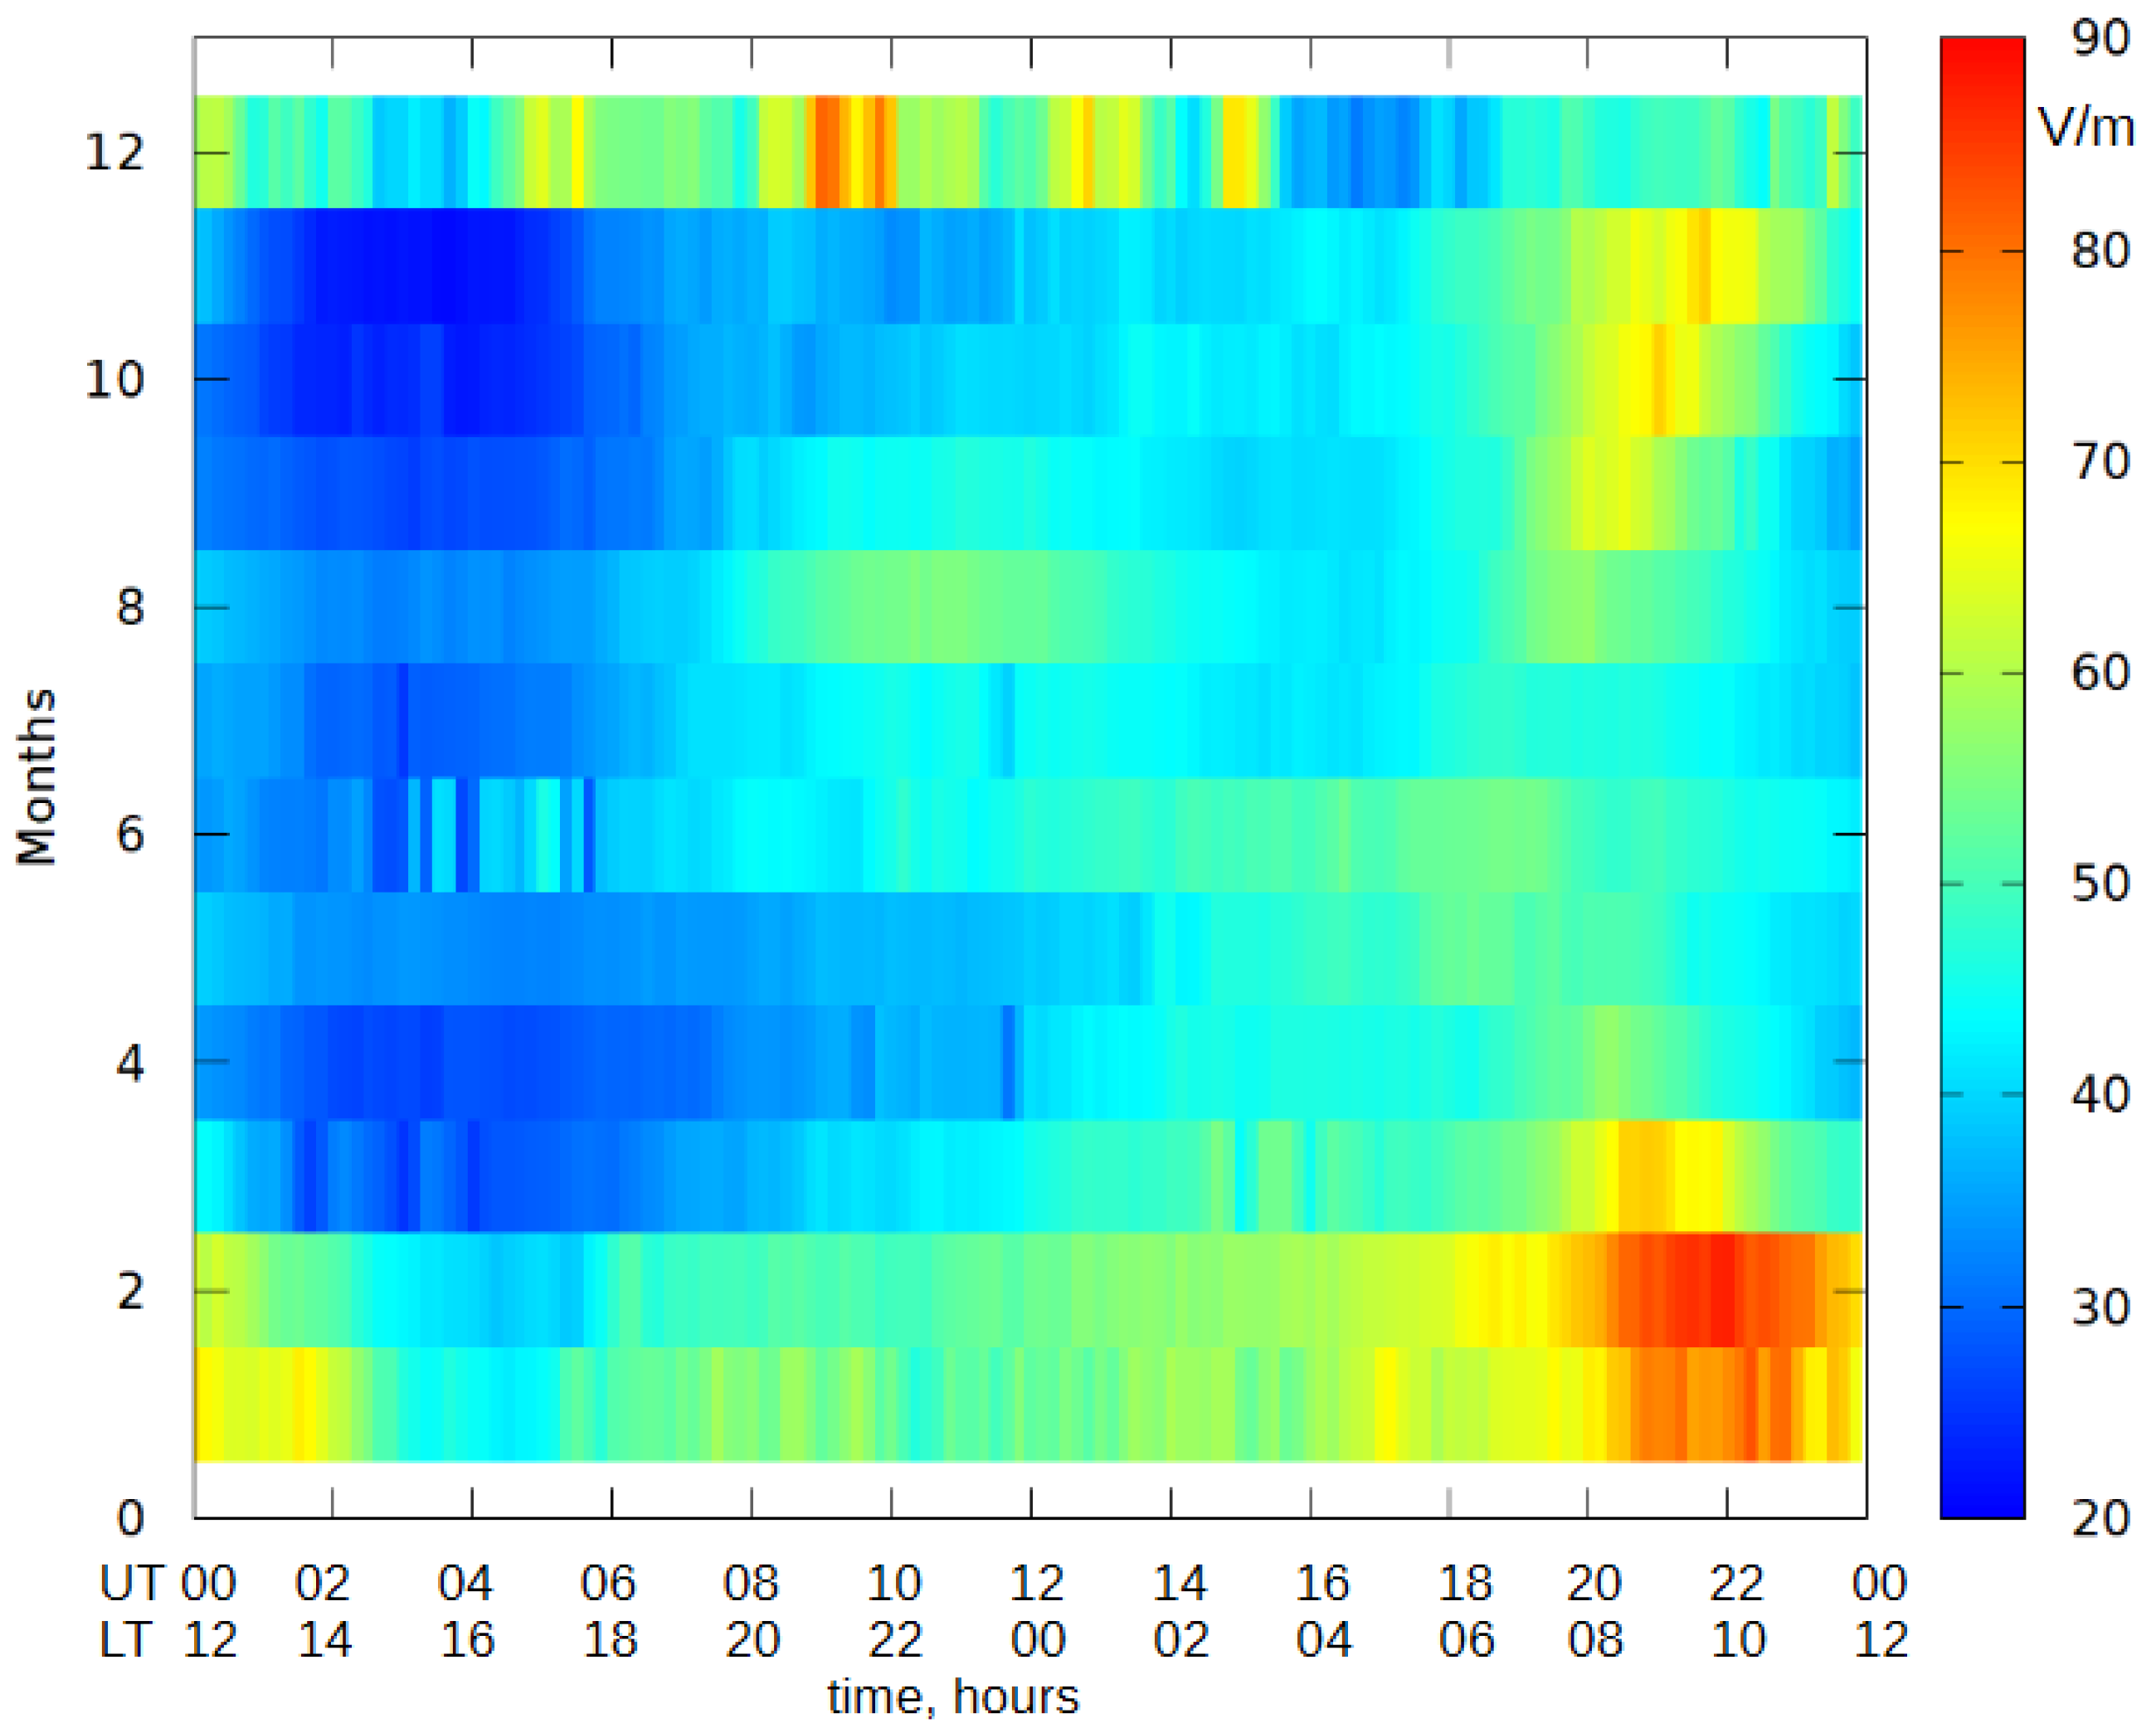
Figures such as Figure 5 have the following disadvantage. The maximum time is determined by the sunrise time. For Paratunka observatory ( φ = 52 ° 58 21 ), the sunrise time difference within a year achieves 4.6 h. This gives high error in the determination of the maximum time. A more informative graph is illustrated in Figure 6. It shows the contour plot of diurnal–annual variation in FW AEF values for the same time period for all the values. Data for December are less representative, as long as there are not always days with FW conditions. The MCG effect can also be seen on this graph.
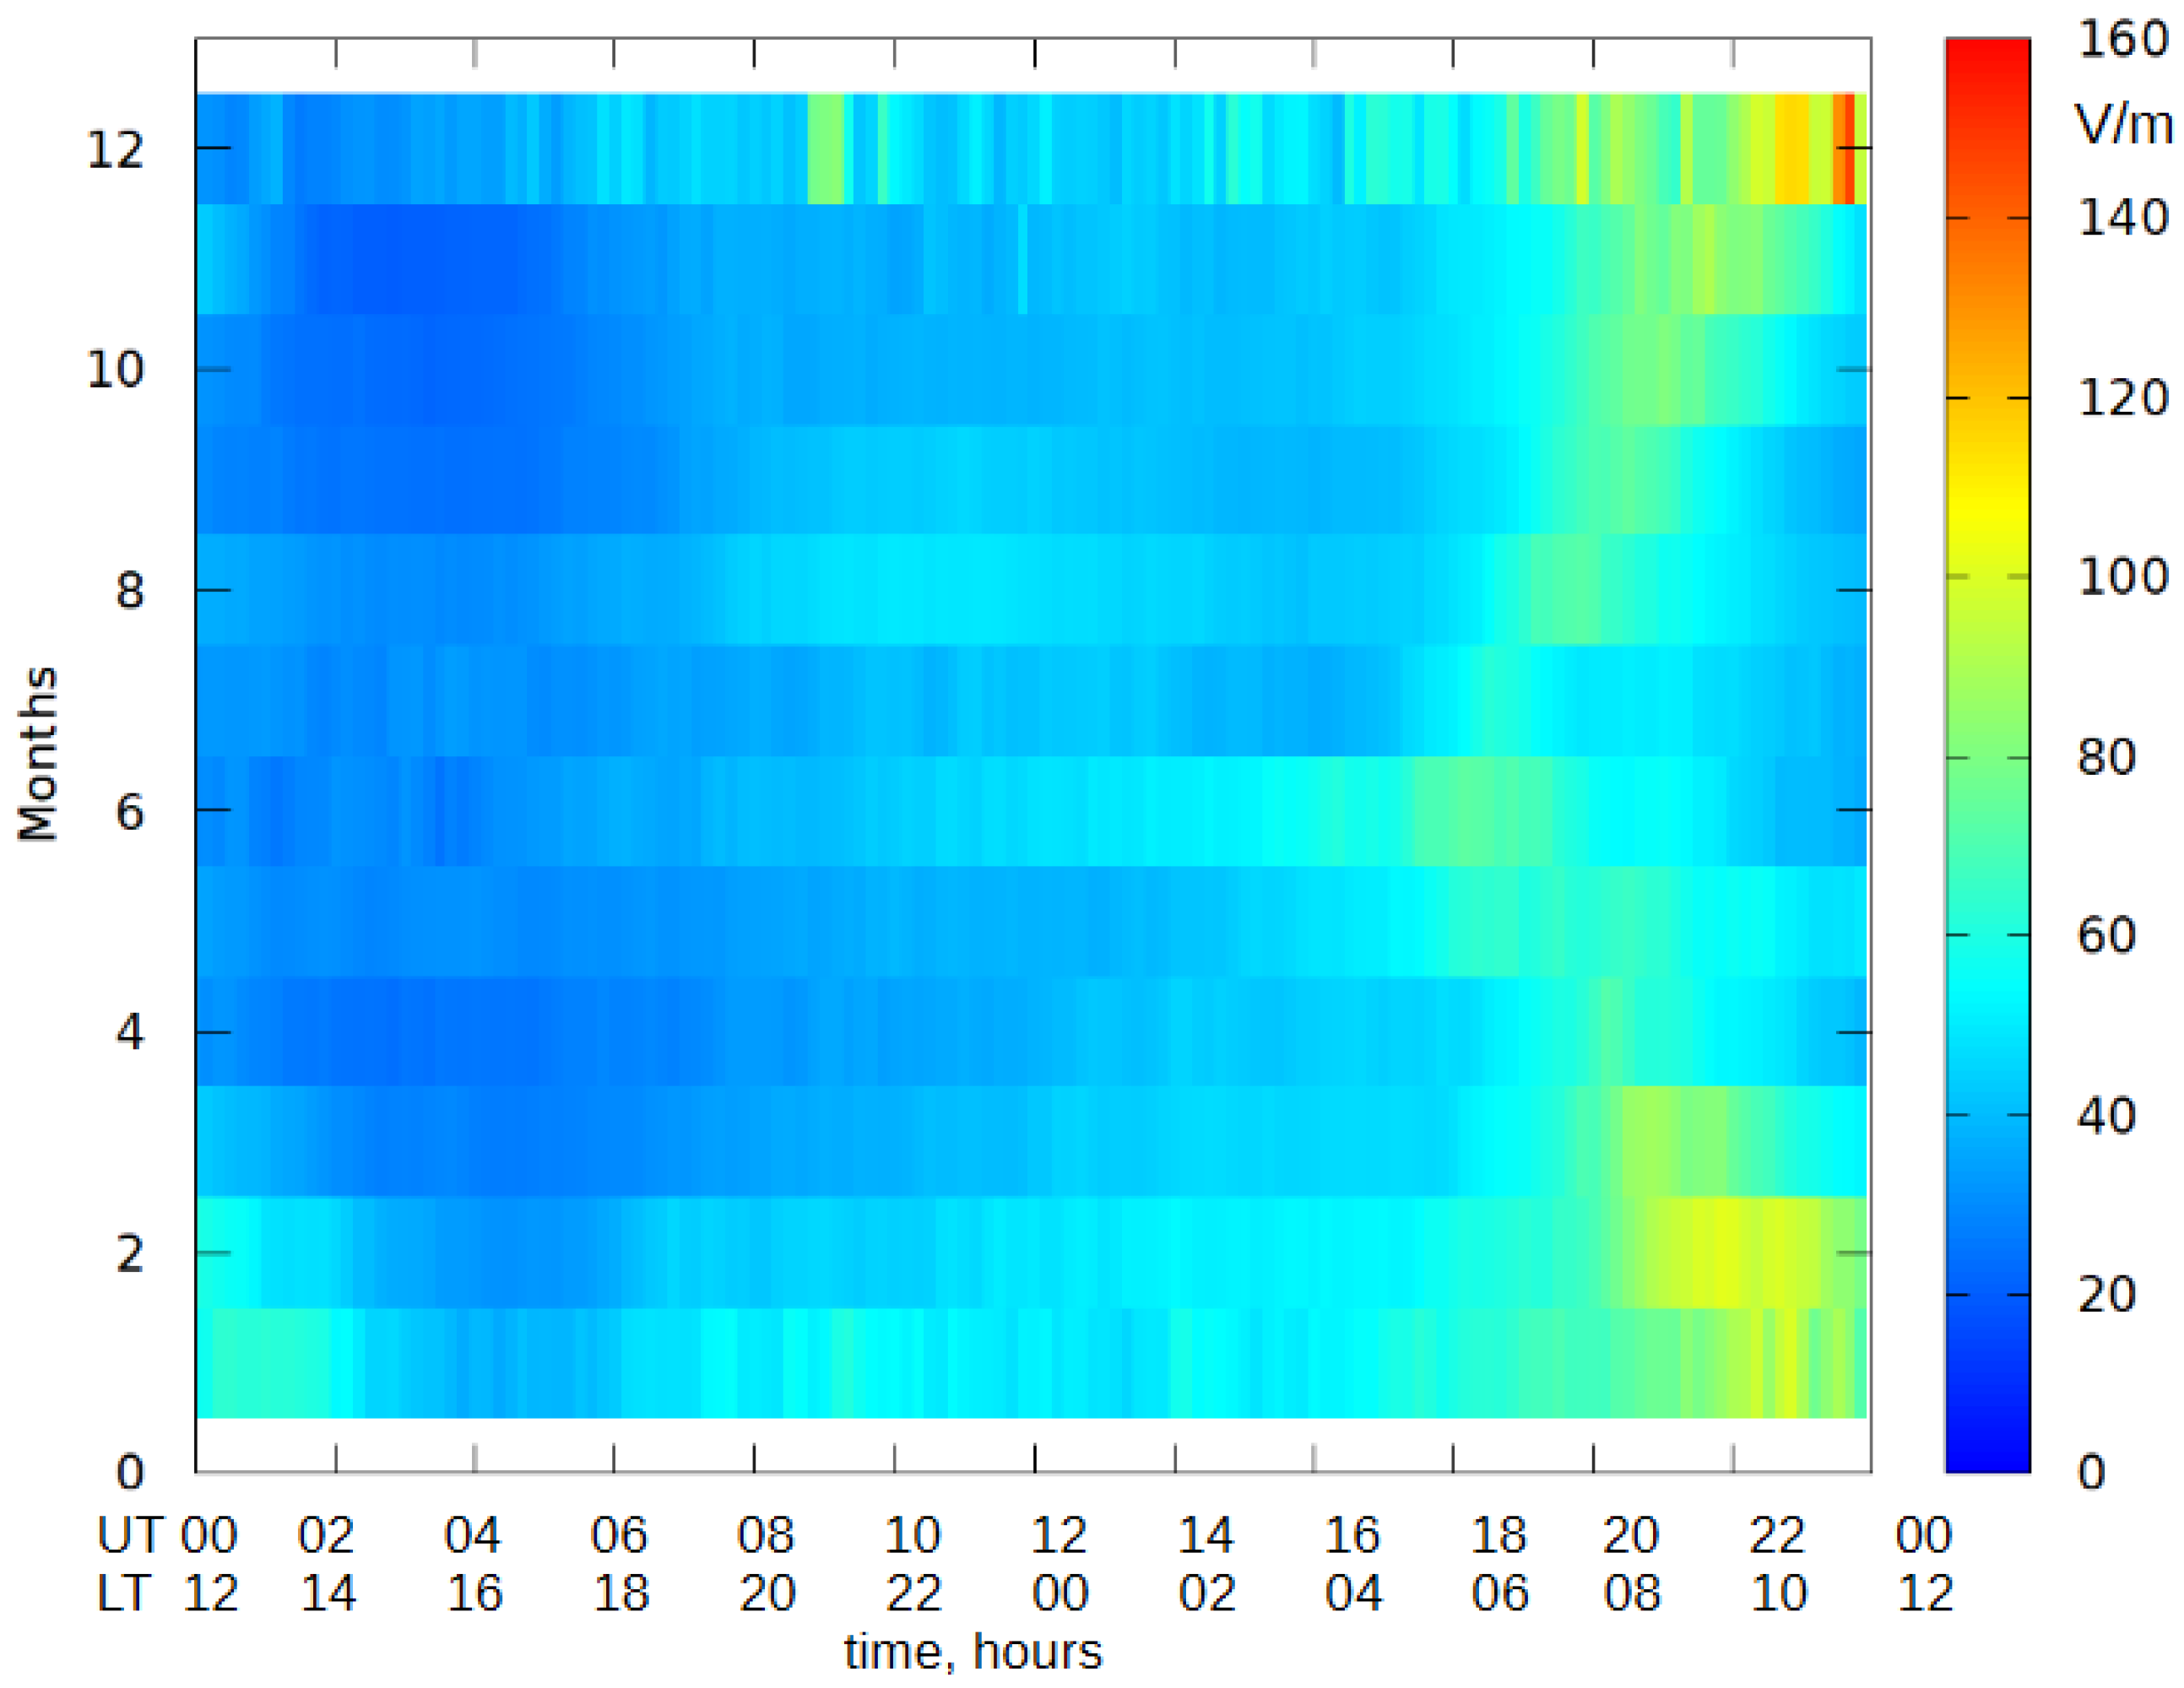
For more accurate detection of the MCG effect, we construct a similar graph for the days with convection effect (Figure 7). It can clearly be seen that diurnal variation maximums migrate along with the time of sunrise, forming the “<” sign. For the observatories in the southern hemisphere, they will form the “>” sign over a year via the same mechanism of maximum formation, as, for example, stated by the authors of [9].

7. Conclusions

1. The descriptive character of fair weather for atmospheric electricity measurements, when the meteorological parameter set is limited, was changed to concrete numerical values during a day.
For summer time
  • Precipitation 0 mm;
  • Maximum wind velocity u 25 < 12 m/s;
  • Air humidity minimum <67%;
  • Maximum solar energy flux density >520 W/m2;
  • Air humidity of more than 95% for less than 3 h.
For winter time
  • Precipitation 0 mm;
  • Maximum wind velocity u 25 < 12 m/s;
  • Air humidity minimum <69%;
  • Maximum solar energy flux density >350 W/m2;
  • Air humidity of more than 95% for less than 3 h.
2. For the mid-latitudinal Paratunka observatory, the AEF diurnal variation in FW conditions is determined by electric field morning convective generator in 39% of cases.
3. At Paratunka observatory, the morning convective generator of atmospheric electricity is most frequently observed in March and October.

Funding

The research was carried out as a part of the implementation of Russian Federation state assignment 124012300245-2.

Institutional Review Board Statement

Not applicable.

Informed Consent Statement

Not applicable.

Data Availability Statement

Common Use Center “North-Eastern Heliogeophysical Center” http://www.ikir.ru/en/CUC/ (accessed on 15 October 2025).

Conflicts of Interest

The author declares no conflicts of interest.

Abbreviations

The following abbreviations are used in this manuscript:
AEFAtmospheric electric field
FWFair weather
GECGlobal electric circuit
PGPotential gradient
GloCAEMGlobal Coordination of Atmospheric Electricity Measurements
MCGMorning convective generator

References

  1. Rycroft, M.J.; Israelsson, S.; Price, C. The global atmospheric electric circuit, solar activity and climate change. J. Atmos. Sol.-Terr. Phys. 2000, 62, 1563–1576. [Google Scholar] [CrossRef]
  2. Rycroft, M.J.; Nicoll, K.A.; Aplin, K.L.; Harrison, R.G. Recent advances in global electric circuit coupling between the space environment and the troposphere. J. Atmos. Sol. Terr. Phys. 2012, 90–91, 198–211. [Google Scholar] [CrossRef]
  3. Tinsley, B.A. The global atmospheric electric circuit and its effects on cloud microphysics. Rep. Prog. Phys. 2008, 71, 066801. [Google Scholar] [CrossRef]
  4. Harrison, R.G. The Carnegie Curve. Surv. Geophys. 2013, 34, 209–232. [Google Scholar] [CrossRef]
  5. Burns, G.B.; Tinsley, B.A.; Frank-Kamenetsky, A.V.; Troshichev, O.A.; French, W.J.R.; Klekociuk, A.R. Monthly diurnal global atmospheric circuit estimates derived from Vostok electric field measurements adjusted for local meteorological and solar wind influences. J. Atmos. Sci. 2012, 69, 2061–2082. [Google Scholar] [CrossRef]
  6. Jeeva, K.; Gurubaran, S.; Williams, E.R.; Kamra, A.K.; Sinha, A.K.; Guha, A.; Selvaraj, C.; Nair, K.U.; Dhar, A. Anomalous diurnal variation of atmospheric potential gradient and air-Earth current density observed at Maitri, Antarctica. J. Geophys. Res. 2016, 121, 593–12611. [Google Scholar] [CrossRef]
  7. Harrison, R.G.; Mkrtchyan, H.; Nicoll, K.A. Atmospheric electricity data from Lerwick during 1964 to 1984. Geosci. Data J. 2025, 12, e70009. [Google Scholar] [CrossRef]
  8. Pawlak, I.; Odzimek, A.; Kepski, D.; Tacza, J. Diurnal, seasonal, and annual variations of the fair-weather atmospheric potential gradient and effects of reduced number concentration of condensation nuclei on potential gradient and air conductivity from long-term atmospheric electricity measurements at Świder, Poland. Ann. Geophys. 2025, 43, 391–416. [Google Scholar]
  9. Tacza, J.; Raulin, J.-P.; Morales, C.A.; Macotela, E.; Marun, A.; Fernandez, G. Analysis of long-term potential gradient variations measured in the Argentinian Andes. Atmos. Res. 2021, 248, 105200. [Google Scholar] [CrossRef]
  10. Peng, J.-N.; Fu, S.; Xu, Y.-Y.; Li, G.; Chen, T.; Xu, E.-M. Variations in the Surface Atmospheric Electric Field on the Qinghai–Tibet Plateau: Observations at China’s Gar Station. Atmosphere 2025, 16, 976. [Google Scholar] [CrossRef]
  11. Gurmani, S.; Ahmad, N.; Tacza, J.; Iqbal, T. First seasonal and annual variations of atmospheric electric field at a subtropical station in Islamabad, Pakistan. J. Atmos. Sol.-Terr. Phys. 2018, 179, 441–449. [Google Scholar] [CrossRef]
  12. Gurmani, S.; Ahmad, N.; Tacza, J.; Hussain, T.; Shafaq, S.; Iqbal, T. Comparative analysis of local and global atmospheric electric field at the Northern Pakistan. J. Atmos. Sol.-Terr. Phys. 2020, 206, 105326. [Google Scholar] [CrossRef]
  13. Kundu, S.; Bagiya, M.S.; Gurubaran, S.; Nayak, S.; Hazarika, N.K.; Dimri, A.P. Investigation of Fair Weather Atmospheric Electric Field Variations from the Eastern Himalaya Syntaxis inNorth-East Region of India. Adv. Space Res. 2025, 76, 985–997. [Google Scholar] [CrossRef]
  14. De, S.; Paul, S.; Barui, S.; Pal, P.; Bandyopadhyay, B.; Kala, D.; Ghosh, A. Studies on the seasonal variation of atmospheric electricity parameters at a tropical station in Kolkata, India. J. Atmos. Sol.-Terr. Phys. 2013, 105, 135–141. [Google Scholar] [CrossRef]
  15. Yaniv, R.; Yair, Y.; Price, C.; Katz, S. Local and global impacts on the fair-weather electric field in Israel. Atmos. Res. 2016, 172, 119–125. [Google Scholar] [CrossRef]
  16. Yaniv, R.; Yair, Y.; Price, C.; Reuveni, Y. No Response of Surface-Level Atmospheric Electrical Parameters in Israel to Severe Space Weather Events. Atmosphere 2023, 14, 1649. [Google Scholar] [CrossRef]
  17. Pustovalov, K.N.; Nagorskiy, P.M.; Oglezneva, M.V.; Smirnov, S.V. Variability of the surface electric field under the influence of meteorological conditions according to observations in Tomsk. Atmos. Ocean Opt. 2024, 37, 815–821. [Google Scholar] [CrossRef]
  18. Li, R.; Ti, S.; Li, L.; Song, J.; Chen, T. Diurnal variations of atmospheric electric fields on fair weather days and its correlations with aerosols, wind speed, irradiance, and relative humidity. Sci. Rep. 2025, 15, 7030. [Google Scholar] [CrossRef]
  19. Nichols, E.H. Investigation of Atmospheric Electrical Variations at Sunrise and Sunset. Proc. R. Soc. A. 1916, 92, 401–408. [Google Scholar]
  20. Kasemir, H.W. Zur Stromungstheorie des Luftelektrischen Feldes III: Der Austaus-Chgenerator. Arch. Meteor. Geophys. Bioclimatol. Ser. A 1956, 9, 357–370. [Google Scholar] [CrossRef]
  21. Marshall, T.C.; Rust, W.D.; Stolzenburg, M.; Roedes, W.P.; Krehbiel, P.R. A Study of Enhanced Fair-Weather Electric Fields Occurring Soon after Sunrise. J. Geophys. Res. 1999, 104D, 24455–24469. [Google Scholar] [CrossRef]
  22. Muhleisen, R. The Influence of Water on the Atmospheric Electrical Field. In Recent Advances in Atmospheric Electricity; Pergamon: London, UK, 1958. [Google Scholar]
  23. Kamra, A.K. Effect of Wind on Diurnal and Seasonal Variations of Atmospheric Electric Field. J. Atmos. Terr. Phys. 1969, 31, 1281–1286. [Google Scholar] [CrossRef]
  24. Selvam, A.M.; Manohar, G.K.; Khandalgaonkar, S.S.; Ramachandra Murty, A.S.; Ramana Murty, B.V. Diurnal and Seasonal Variations of Space Charge, Electric Field and Cloud Condensation Nuclei in the Lowest Layer of the Atmosphere. Tellus 1980, 32, 232–244. [Google Scholar] [CrossRef]
  25. Moore, C.B.; Vennegut, B.; Semonin, R.G.; Bullock, J.W.; Bradley, W. Fair-Weather Atmospheric Electric Potential Gradient and Space Charge over Central Illinois, Summer 1960. J. Geophys. Res. 1962, 67, 1061–1071. [Google Scholar] [CrossRef]
  26. Chalmers, J.A. Atmospheric Electricity, 2nd ed.; Pergamon: London, UK, 1967. [Google Scholar]
  27. Mkrtchyan, H.; Nicoll, K.A.; Harrison, R.G. Evaluating meteorological reanalysis for identifying fair-weather conditions in historical atmospheric electricity data. Q. J. R. Meteorol. Soc. 2025, e5066. [Google Scholar] [CrossRef]
  28. Harrison, R.; Nicoll, K. Fair weather criteria for atmospheric electricity measurements. J. Atmos. Sol.-Terr. Phys. 2018, 179, 239–250. [Google Scholar] [CrossRef]
  29. Harrison, R.G.; Riddick, J.C. Atmospheric Electricity Observations at Lerwick Geophysical Observatory. Hist. Geo- Space Sci. 2022, 13, 133–146. [Google Scholar] [CrossRef]
  30. Odzimek, A. Personal Communication OYB Observatories’ Year Book, Annual Volumes for 1964. Meteorological Office; HMSO: London, UK, 2018. [Google Scholar]
  31. Smirnov, S.E. Influence of a convective generator on the diurnal behavior of the electric field strength in the near-Earth atmosphere in Kamchatka. Geomagn. Aeron. 2013, 53, 515–521. [Google Scholar] [CrossRef]
  32. Nicoll, K.A.; Harrison, R.G.; Barta, V.; Bor, J.; Brugge, R.; Chillingarian, A.; Chum, J.; Georgoulias, A.K.; Guha, A.; Kourtidis, K.; et al. A global atmospheric electricity monitoring network for climate and geophysical research. J. Atmos. Sol.-Terr. Phys. 2019, 184, 18–29. [Google Scholar] [CrossRef]
  33. Smirnov, S. Atmospheric Electricity Measurements in the Pacific Northwest, Russia. Appl. Sci. 2023, 13, 2571. [Google Scholar] [CrossRef]
  34. Wind Speed at Height z Above Surface Given Standard Reference Wind Speed Calculator. Available online: https://www.calculatoratoz.com/en/wind-speed-at-height-z-above-the-surface-when-standard-reference-wind-speed-is-known-calculator/Calc-23765#FormulaPanel (accessed on 5 November 2025).
  35. Smirnov, S. Association of the negative anomalies of the quasistatic electric field in atmosphere with Kamchatka seismicity. Nat. Hazards Earth Syst. Sci. 2008, 8, 745–749. [Google Scholar] [CrossRef]
  36. Smirnov, S. Reaction of electric and meteorological states of the near-ground atmosphere during a geomagnetic storm on 5 April 2010. Earth Planets Space 2014, 66, 154. [Google Scholar] [CrossRef]
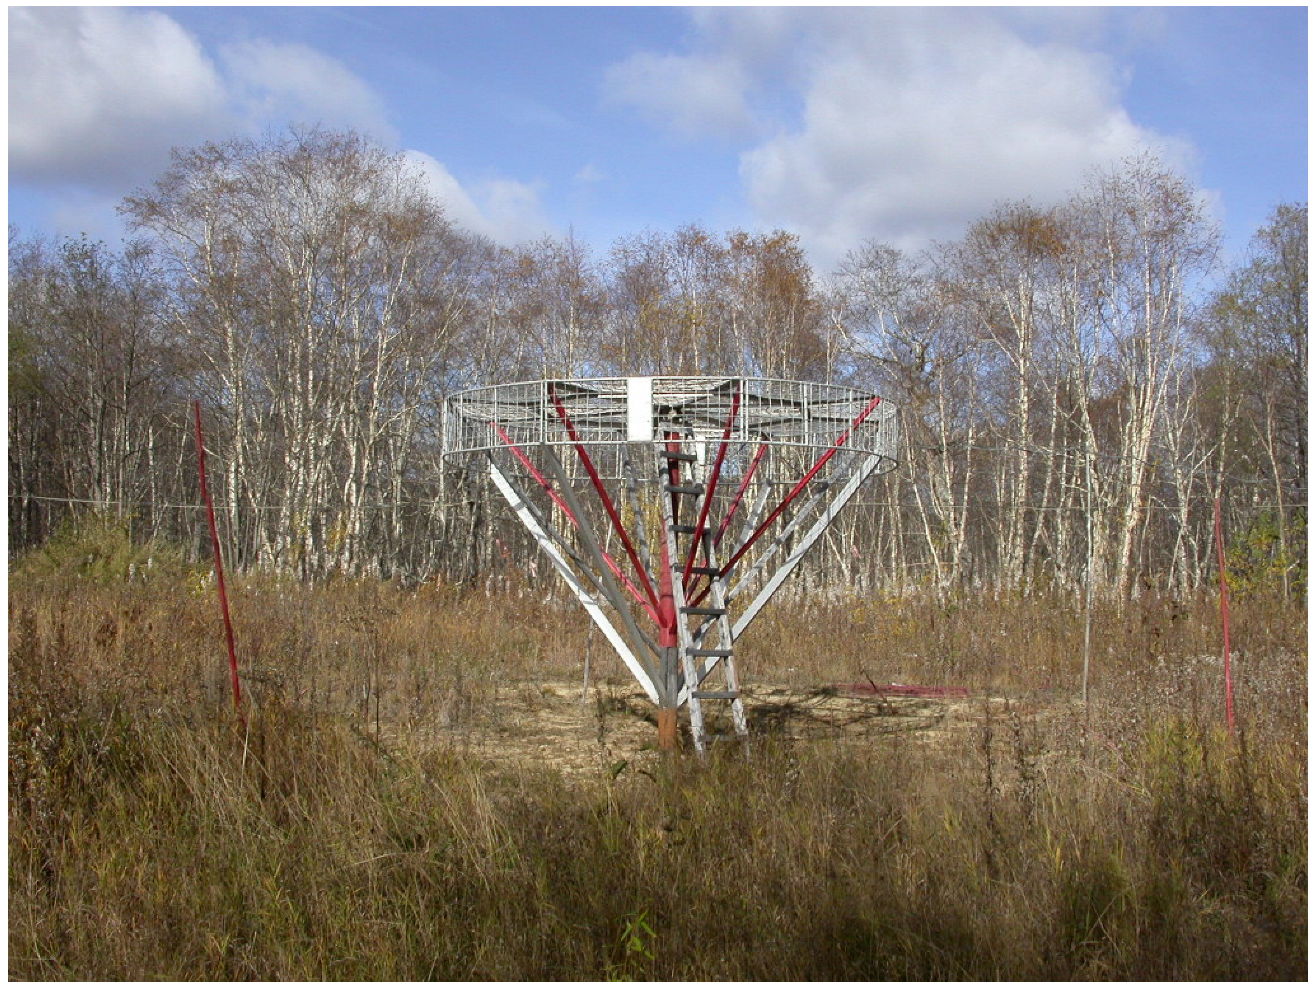
Figure 1. Installation of the Pole-2 instrument at the observatory [33].
Atmosphere 16 01282 g001
Figure 2. PG diurnal variations on (a) 28 February 2025 and (b) 3 November 2024. Blue arrow indicates the sunset time; red arrow indicates the sunrise time.
Atmosphere 16 01282 g002
Figure 3. Histogram of monthly distribution of the number of days with the PG morning maximum.
Atmosphere 16 01282 g003
Figure 4. The asterisks indicate the PG diurnal variation maximums. The straight line is the linear approximation value. The abscissa axis is the sunrise time; the ordinate axis is the time of the PG diurnal variation maximum.
Atmosphere 16 01282 g004
Figure 5. Diurnal variations in PG: (a) all data under fair weather conditions, (b) data with the MCG effect, and (c) data without the MCG effect.
Atmosphere 16 01282 g005
Figure 6. Contour plot of diurnal–annual variation in FW AEF values. The x-axis shows both UT and LT. The y-axis denotes calendar month.
Atmosphere 16 01282 g006
Figure 7. Contour plot of diurnal–annual variation in FW AEF values with convection. The x-axis shows both UT and LT. The y-axis denotes calendar month.
Atmosphere 16 01282 g007
Disclaimer/Publisher’s Note: The statements, opinions and data contained in all publications are solely those of the individual author(s) and contributor(s) and not of MDPI and/or the editor(s). MDPI and/or the editor(s) disclaim responsibility for any injury to people or property resulting from any ideas, methods, instructions or products referred to in the content.