Abstract
Reliable precipitation estimates are critical for climate analysis and ecosystem management in regions with complex topography and limited ground-based observations. Bolivia, where the Andes, inter-Andean valleys, and Amazonian lowlands converge, presents sharp climatic heterogeneity that challenges both satellite retrievals and reanalysis products. This study evaluated three widely used datasets, MSWEP V2.2, CHIRPS V2, and ERA5-Land, against monthly station records from 1980 to 2022 to identify the most reliable precipitation estimations for hydrological and climate applications in five distinct regions. We applied a robust validation framework that integrates continuous and categorical performance metrics into a Combined Accuracy Index (CAI), providing a balanced measure of magnitude and event detection skill. Additionally, we implemented a conservative trend analysis with explicit correction for serial autocorrelation to ensure reliable identification of long-term changes. The results showed that MSWEP V2.2 consistently outperforms CHIRPS V2 and ERA5-Land across most regions, achieving the highest combined skill. In the Altiplano, MSWEP reached a CAI of 0.91, compared to CHIRPS (0.80) AND ERA5-Land (0.68). In the Valles region, MSWEP also led with 0.85, outperforming CHIRPS (0.79) and ERA5-Land (0.51). By contrast, CHIRPS V2 performed better in the Llanos (0.85) relative to MSWEP (0.82) and ERA5-Land (0.79). In the Chaco, MSWEP and CHIRPS performed similarly (0.80 and 0.81, respectively), while ERA5-Land scored 0.70. In the Amazonian lowlands, all three products performed well, with MSWEP ranking first (0.93), followed by ERA5-Land (0.88) and CHIRPS (0.86). ERA5-Land systematically overestimated precipitation across Bolivia, with annual biases above 36 mm month−1. Trend analysis revealed significant precipitation declines, particularly in the Llanos (MSWEP: −0.88 mm year−1; CHIRPS: −1.19 mm year−1; ERA5-Land: −0.90 mm year−1), while changes in the Altiplano, Valles and Amazonia were weaker or nonsignificant. These findings highlight MSWEP V2.2 as the most reliable dataset for Bolivia. The methodological framework proposed here offers a transferable approach to validate gridded products in other data-scarce and environmentally diverse regions.
1. Introduction
Accurate characterization of precipitation remains one of the greatest challenges for climate and hydrological studies in regions of complex topography and climatic heterogeneity []. This challenge is particularly pronounced in Bolivia, where the Andes, inter-Andean valleys, and the Amazon lowlands converge within a relatively small geographic area, generating sharp gradients in rainfall regimes [,,,]. In this country, precipitation sustains ecosystems of global relevance, ranging from the high Andean wetlands to the Amazon tropical rainforests, and it supports agriculture, hydropower, water security, and biodiversity []. However, despite its importance, reliable precipitation data in Bolivia remain scarce, unevenly distributed, and of variable quality, limiting our ability to monitor extremes, assess climate risks, and inform adaptation strategies.
In recent decades, a suite of high-resolution satellite-based and reanalysis products has emerged as an alternative to overcome the limitation of sparse ground-based networks over regions with complex terrain. Remote sensing precipitation estimations rely on the development of infrared sensors, passive microwave, and radar, which provide high resolution, wide coverage, continuous, and long-term gridded precipitation estimations []. Examples of high-resolution remote sensing precipitation products include the Global Precipitation Measurement (GPM) mission’s Integrated Multi-Satellite Retrievals (IMERG) algorithm, which synthesizes multi-source microwave, infrared, and gauge observations to provide precipitation estimates at a relatively high spatial resolution of 0.1° × 0.1° []. The CMORPH Climate Data Record (CDR) primarily uses passive microwave data, supplementing it with infrared imagery and “morphing motion vector techniques” to track cloud systems and fill observation gaps at 0.08° × 0.08° spatial resolution []. PERSIANN-CCS utilizes artificial neural networks to process infrared cloud imagery and derive precipitation at 0.04° × 0.04° resolution, with some versions, such as PERSIANN-CDR, being adjusted using monthly gauge products at 0.25° × 0.25° resolution []. The Climate Hazards Group InfraRed Precipitation with Stations (CHIRPS) is a quasi-global rainfall product designed primarily for monitoring droughts and global environmental changes. It is developed by combining the Satellite-only Climate Hazards group Infrared Precipitation (CHIRP), Climate Hazards group Precipitation climatology (CHPclim), and data from ground stations, including the Global Historical Climatological Network (GHCN) and various national and regional meteorological services []. The Multi-Source Weighted-Ensemble Precipitation (MSWEP) is a global gridded precipitation product that merges gauge, satellite, and reanalysis data to provide comprehensive precipitation estimates at 0.1° × 0.1° resolution. On the other hand, reanalysis products such as ERA5-Land integrate multi-source data (satellite, radar) through a 4D-Var assimilation system and use coupled atmosphere–land–ocean models to optimize precipitation estimation. It assimilates measured and remotely sensed information within dynamical–physical coupled numerical models at 0.1° × 0.1° []. All these products have become widely used in hydroclimate analysis [,,,,,,]. However, their performance is far from uniform across regions and scales, especially in areas with complex terrain, where orographic processes, convective storms, and local land–atmosphere interactions remain difficult to capture [,,,]. Consequently, rigorous validation against ground observations is essential before these products can be confidently applied in climate diagnostics, hydrological modeling, or impact assessments.
Bolivia represents a compelling case study for such an evaluation. The country’s geography amplifies the limitations of global precipitation products: in the Altiplano, rainfall is scarce and highly variable, with strong sensitivity to the south American monsoon intraseasonal fluctuations []; in the Valleys and Amazonian piedmont, orographic uplift produces intense rainfall that is difficult to resolve with coarse resolution products []; while in the Chaco and Amazonian lowlands, precipitation regimes are shaped by both tropical and extratropical influences []. Moreover, interannual variability associated with ENSO and other modes of Pacific-Atlantic interaction further complicates the detection of robust spatio-temporal signals []. For these reasons, the accuracy of satellite and reanalysis products must be carefully benchmarked against the limited set of long-term meteorological stations available.
The present study evaluates the performance of three widely used gridded precipitation products with relatively high spatial resolution and long-term precipitation estimations (from 1980): MSWEP, CHIRPS, and ERA5-Land across Bolivia using approximately four decades of observations from processed ground meteorological stations. The analysis focuses on their capacity to reproduce monthly variability and seasonal cycles across different distinct climatological regions. We employ both continuous and categorical metrics to provide a comprehensive assessment of their strengths and weaknesses.
2. Data and Methodology
2.1. Study Area
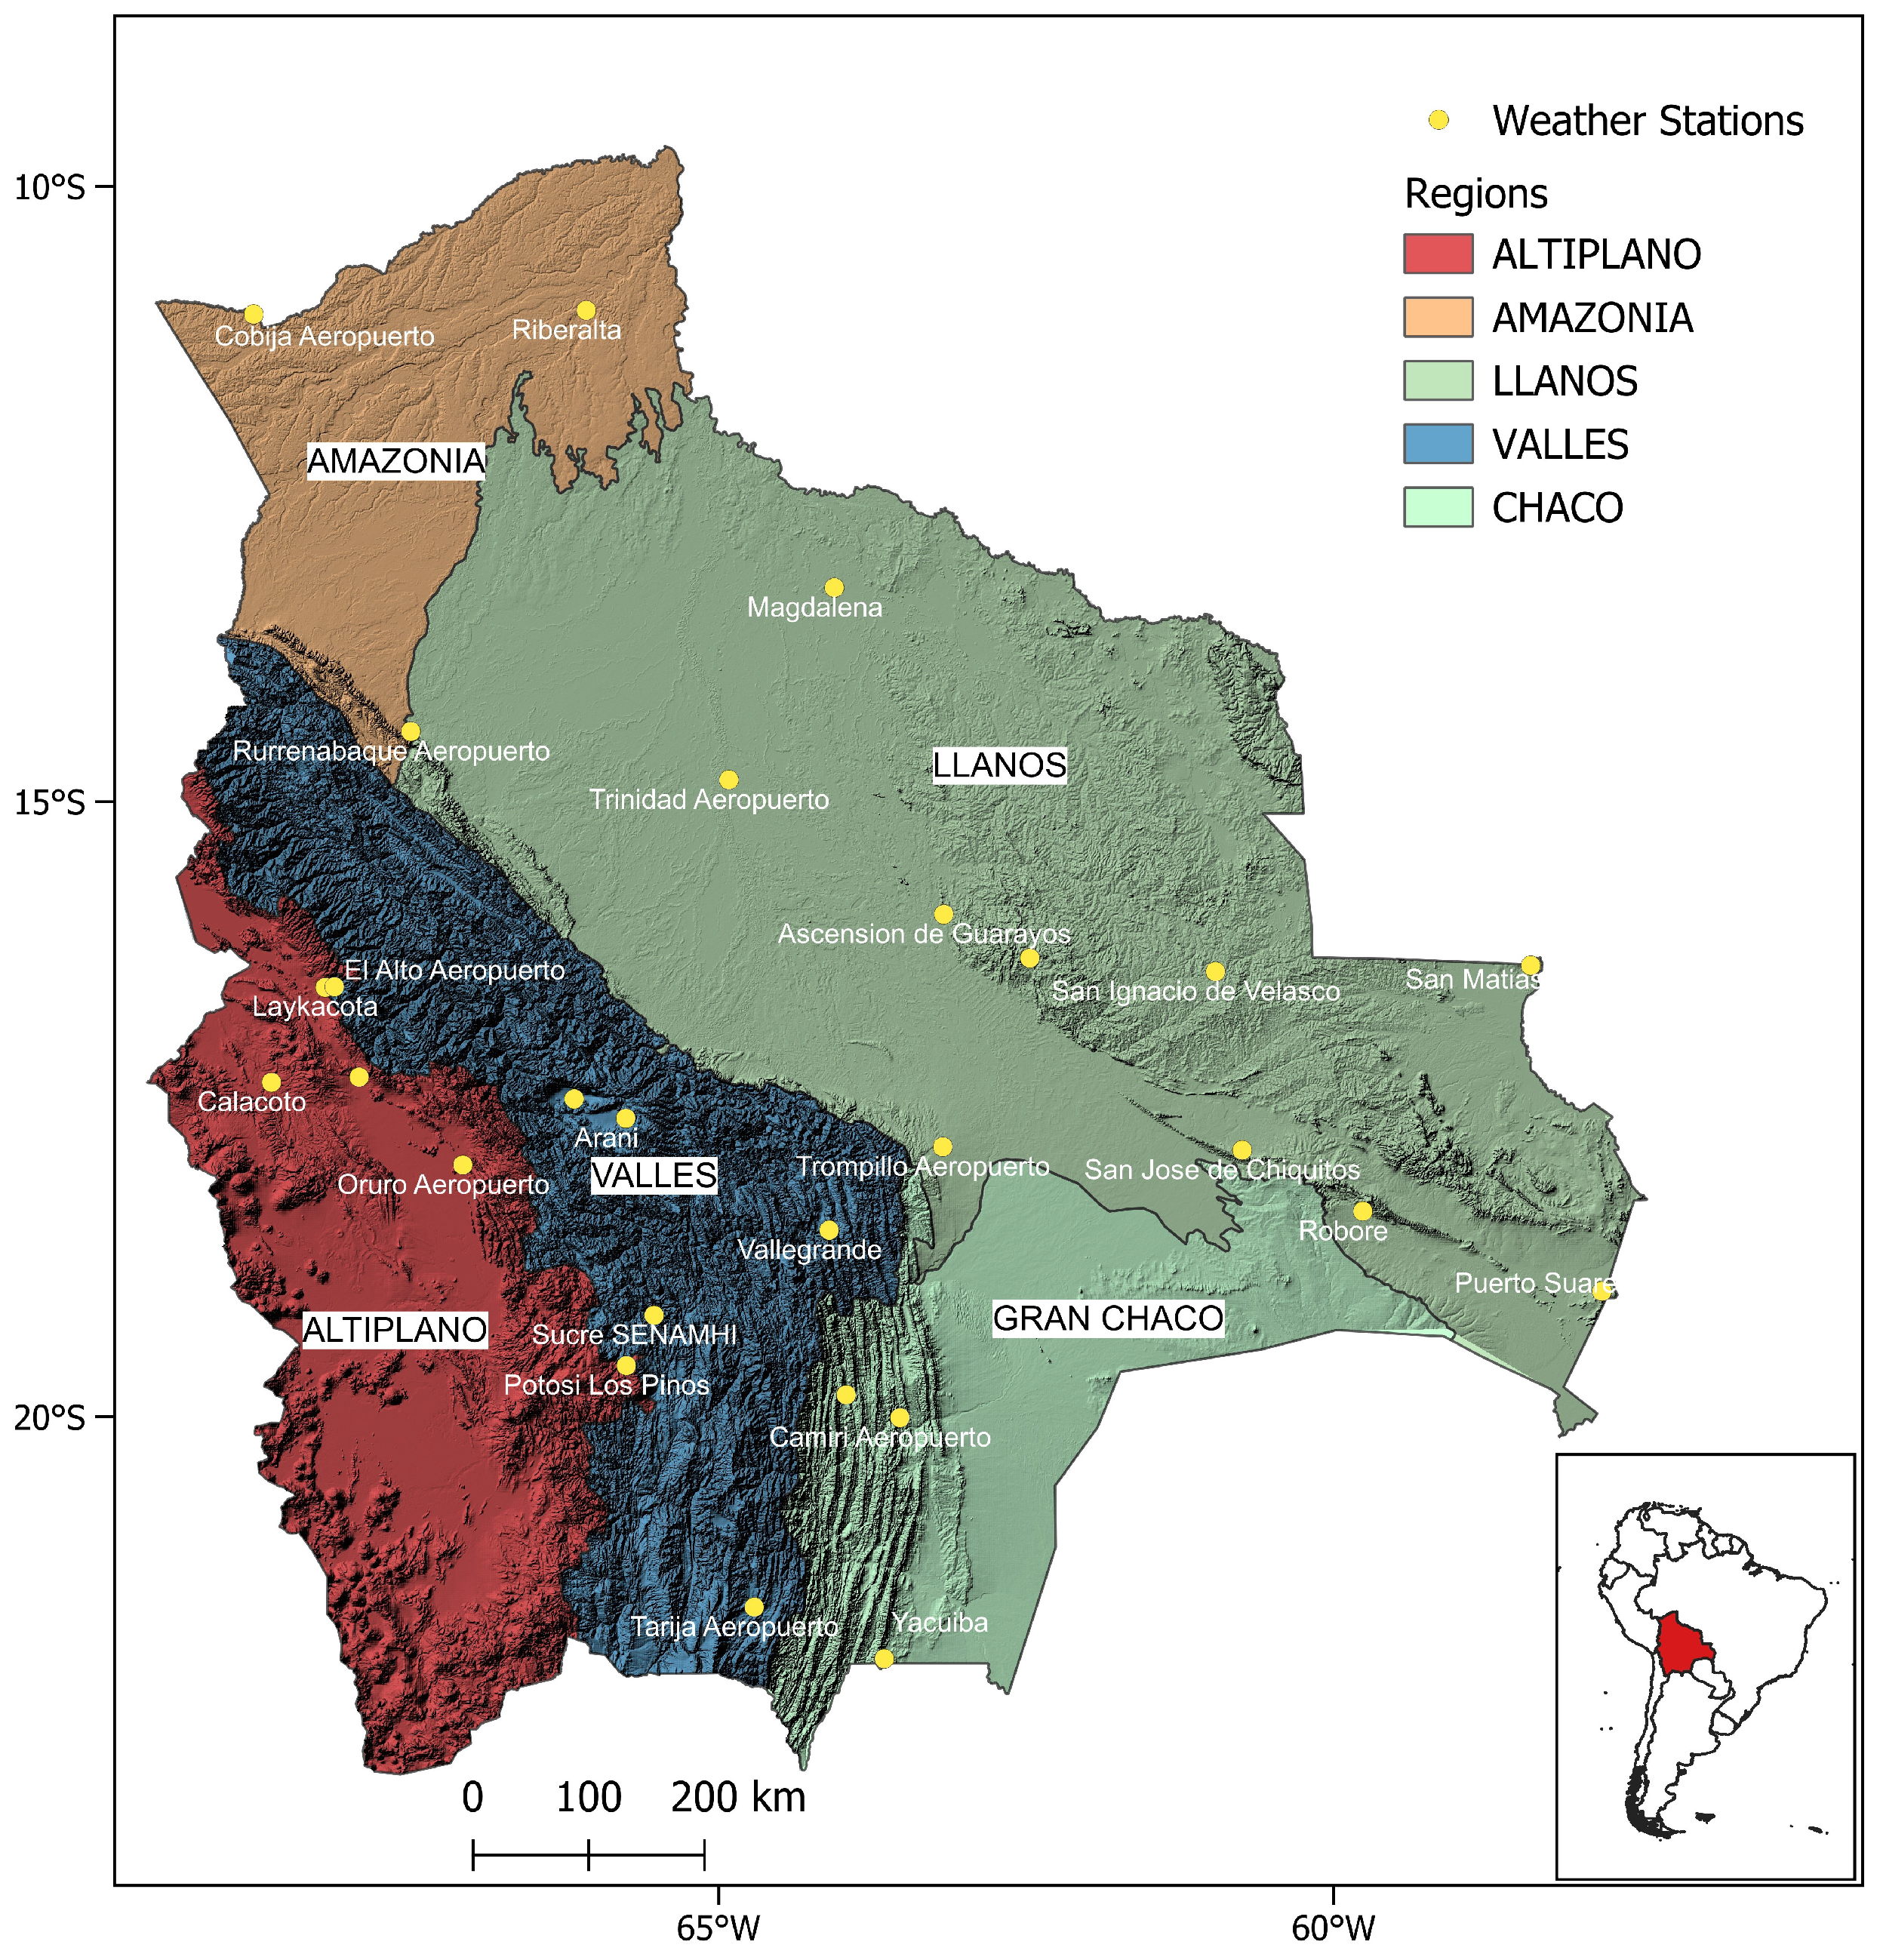
The study focuses on Bolivia’s main regions, following []: the arid Altiplano (Altiplano), the humid Amazon (Amazonia), the flood-prone tropical Llanos (Llanos), the dry forest of the Chaco (Chaco), and the inter-Andean Valles (Valles). This classification is broad enough to evaluate their climate evolution, and each region contains at least two weather stations for product validation (Figure 1).
Figure 1.
Broad climatological regions in Bolivia and distribution of weather stations considered in this study.
2.2. Data
2.2.1. Weather Stations
Ground-based observations from 27 stations are provided by the National Meteorological and Hydrological Service (SENHAMI, http://senamhi.gob.bo) for the period 1980–2022. We performed quality control and homogeneity of the series using Climatol 3.1.1 (http://www.climatol.eu). We used monthly sums (precipitation) as this time frame is more reliable for scientific use [,,,].
2.2.2. The Multi-Source Weighted-Ensemble Precipitation (MSWEP) Dataset V2.2
The MSWEP dataset provides global land and ocean coverage at 0.1° spatial and 3-hourly temporal resolution from 1979 to the present []. It merges precipitation estimates from the ERA5 reanalysis, two satellite-based products (IMERG and GridSat), and gauge observations from GSOD, GHCN-D, and national databases, with careful adjustments for reporting times to improve sub-daily alignment with satellite and model inputs. Local weights are assigned to non-gauge sources based on correlation with gauge data for each grid cell, adapting the weighting dynamically across different climatic and geographic regimes. Wet-day biases, particularly from ERA5, are corrected using gauge comparisons. The merged files are then calibrated by matching their cumulative distribution functions to a satellite-model precipitation reference, a step that mitigates drizzle artifacts and restores intensity peaks []. MSWEP has presented better performance than other precipitation products in both densely gauged and ungauged regions [,,].
2.2.3. The Climate Hazards Center InfraRed Precipitation with Stations (CHIRPS) V2
The CHIRPS dataset combines gauge observations with satellite retrievals []. The gauge data includes ground measurements from 32,000 stations in the early 1980s to 14,000 in the mid-2010s, producing a quasi-global (50° N–50° S) precipitation product at 0.05° spatial resolution from 1981 to the present.
2.2.4. ERA5-Land Precipitation Data
ERA5-Land is the fifth-generation reanalysis of the European Centre for Medium-Range Weather Forecasts (ECMWF), based on the IFS Cy41r2 forecasting system. It assimilates satellite, in situ, and other observations via a 4D-Var scheme []. ERA5-Land provides a physically consistent analysis of the atmosphere, land surface, and ocean by coupling IFS with CHTESSEL and the WAM wave model. The atmospheric component uses 137 hybrid sigma/pressure levels up to 1 Pa on a 31 km (0.218125°) grid. Data are produced hourly from 1950 to the present and include analyses and short-range forecasts produced daily at 06 and 18 UTC. To retrieve precipitation data for Bolivia, we used ERA5-Land, a 0.1° downscaled version of ERA5-Land based on the CHTESSEL land model. To generate its meteorological forcing, ERA5-Land applies lapse-rate and elevation corrections to ERA5-Land atmospheric variables before replaying CHTESSEL at a finer scale []. This enhanced resolution offers a more accurate representation of soil moisture, lakes, and river discharges, while significantly reducing errors in precipitation estimates [,,].
2.3. Methods
2.3.1. Validation of Predicted Precipitation Data
To identify the best-performing precipitation products for Bolivia, we compared MSWEP, CHIRPS, and ERA5-Land against validated monthly station data. We calculated a set of performance metrics (Table 1), including continuous metrics (quantifying agreement in magnitude and variability) and categorical skill metrics (assessing the ability to detect climatic events). All metrics were computed at the individual-station level and aggregated by region.
Table 1.
Performance metrics used to evaluate MSWEP, CHIRPS, and ERA5-Land data against weather station data. and represent the gridded and station precipitation values, respectively. n is the total number of months between 1980 and 2022. is the mean and is the coefficient of variation. , . H (hits) represents the number of correctly predicted climatic events, F (false alarms) the number of predicted events that did not occur, M (misses) the number of observed events that were not predicted, and CN (correct negatives) the number of correctly predicted non-events. Metrics are grouped into continuous performance metrics and event-based metrics.
2.3.2. Combined Accuracy Index (CAI)
We developed a Combined Accuracy Index to identify the best-performing gridded product. This method integrates continuous and categorical performance metrics into a single dimensionless indicator to ensure that products are not only statistically aligned with observed magnitudes but also operationally reliable in detecting rainfall occurrences and non-occurrences. As a continuous component, we used the mean Kling–Gupta Efficiency (KGE) across all stations. Given that the theoretical range of KGE is [, 1], values were first normalized to the interval [0, 1] using the following transformation that preserves the ordinal ranking of products while ensuring scale compatibility with the categorical component:
With this transformation, a raw KGE of 1 (perfect agreement) maps to 1.0, 0 (moderate performance) maps to 0.5, and extremely poor-performing raw KGEs (e.g., KGE = −1) maps near 0.0.
The categorical component of the CAI was derived from the Heidke skill scores (HSS). To adapt thresholds to local climatology, we defined precipitation events using dynamic, station-specific thresholds. For each meteorological station, we calculated the 25th, 50th and 75th percentiles of the observed precipitation distribution, representing low, moderate, and high monthly precipitation events. Station-specific thresholds reduce biases introduced by fixed thresholds when assessing detection skill across varying event intensities, providing more accurate results. Events or non-events were classified independently for observed and predicted values according to the percentile cutoffs, generating confusion matrices for each station-threshold combination, from which categorical skill metrics were calculated (Table 1). HSS values were aggregated by product, and the median (50th percentile) across all station-threshold combinations was used as the final categorical score. To match scale with the continuous component, HSS was normalized from [−1, 1] to [0, 1] as follows:
The final Combined Accuracy Index for each product was computed as the unweighted average of the normalized continuous and categorical components:
This formulation ensures equal weight between magnitude and event detection agreement. Scores > 0.75 indicate excellent overall performance, 0.5–0.75 reflect moderate to good, and <0.5 poor performance. All scores were computed for each product at the region and country scale, and the Wilcoxon signed-rank test was applied to assess statistical differences in performance between products [].
2.3.3. Trend Analysis
We analyzed precipitation trends from the best-performing products and weather stations using ordinary least squares (OLS) regressions. To account for temporal autocorrelation, inference statistics were corrected with a first-order autoregressive AR(1) adjustment. This correction reduces biases in variance estimation that otherwise lead to underestimated standard errors, overly narrow confidence intervals, and deflated p-values in the presence of positive autocorrelation [,]. The linear trend model was:
where is the climate variable at time t, the intercept, the linear trend coefficient (change per unit time), and the residual component. Residuals were assumed to follow an AR(1) process:
where is the first-order autoregressive coefficient, , the residuals at time and the white noise. Autocorrelation was quantified using a multi-lag autocorrelation function implemented in the statsmodels Python package version 0.14.4 [], employing Fast Fourier Transform (FFT) for computational efficiency. Lags up to were considered to capture seasonal cycles, ENSO teleconnections, and regional persistence. The autocorrelation at lag-k was calculated as:
The effective sample size () was then estimated following []:
where n is the original sample size. To strengthen the correction, we applied a penalty factor using . The corrected standard error of was:
where is the uncorrected OLS standard error. The corrected t-statistic was then:
Degrees of freedom were adjusted as:
accounting for estimation of the OLS intercept and slope while preventing undefined tests under strong autocorrelation or small sample sizes. Corrected two-tailed p-values were derived from the Student’s t-distribution with degrees of freedom:
computes the probability of observing a t-statistic at least as extreme as the one estimated () under the null hypothesis of no trend, where represents the cumulative distribution function of Student’s t-distribution with effective degrees of freedom. This effective sample size approach explicitly accounts for the reduced information content in autocorrelated time series. For cases with strong autocorrelation (), the p-values were increased by 50% (capped at 1.0) and the significance level tightened to , ensuring that only trends with compelling statistical evidence were considered significant. This procedure was applied to all grid cells of the grid products and to the 27 weather stations throughout Bolivia, using complete monthly records from 1980–2022.
3. Results
3.1. Overall Performance
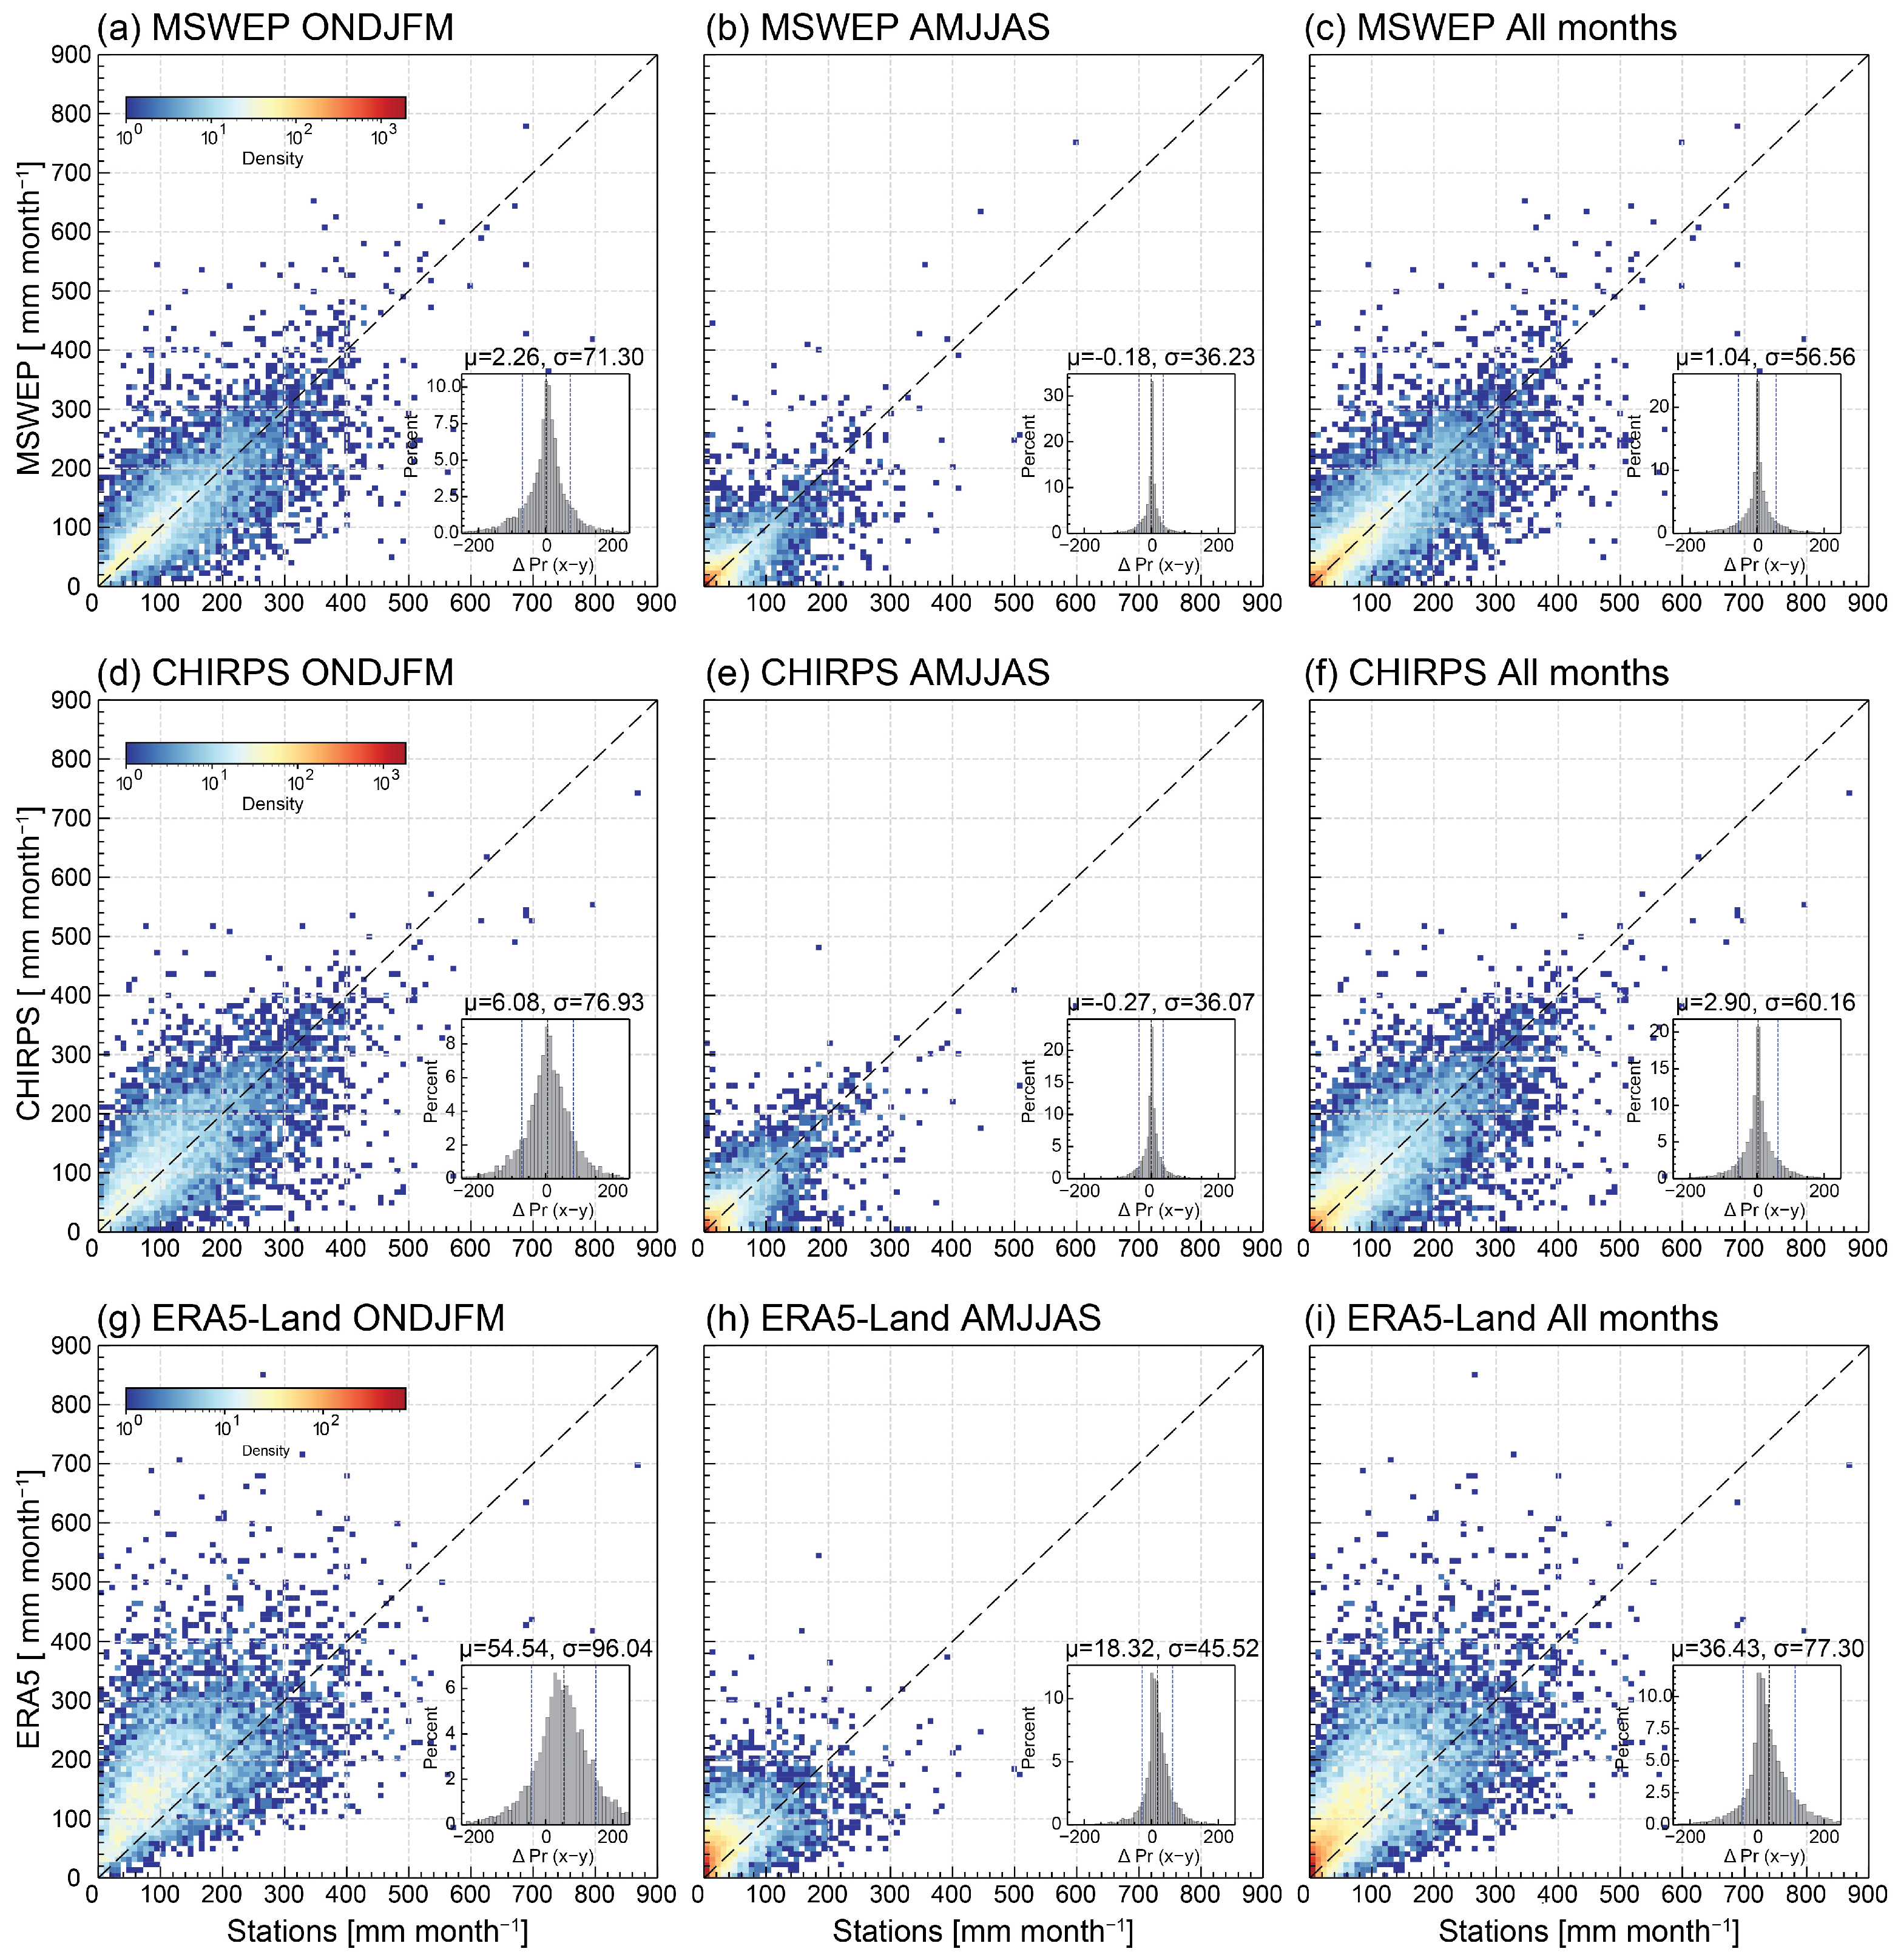
We compared the three precipitation datasets (MSWEP, CHIRPS, and ERA5-Land) against observed monthly precipitation over the entirety of Bolivia, assessed separately for the austral summer half-year (ONDJFM), the austral winter half-year (AMJJAS), and the full-year period (All months). We used the residuals’ mean () and standard deviation () as a measure of accuracy and precision, respectively (Figure 2).
Figure 2.
Density scatter plots of monthly precipitation from MSWEP, CHIRPS, and ERA5-Land against station observations across Bolivia for austral summer (ONDJFM), winter (AMJJAS), and all months. Observed precipitation is on the x-axis and product precipitation on the y-axis. Colors indicate point density (number of months falling within the bin) on a logarithmic scale. The insets show histograms of residuals with mean (, black dashed line) and ±1 standard deviation (, blue dashed lines) indicated.
MSWEP exhibited low overall bias, with slight overestimation during ONDJFM ( = 2.26 mm month−1, Figure 2a), near-zero bias during AMJJAS ( = −0.18 mm month−1, Figure 2b), and a very slight overestimation for the full year ( = 1.04 mm month−1, Figure 2c). Precision varied seasonally, being lower in ONDJFM ( = 71.30 mm month−1, Figure 2a), when precipitation magnitudes are higher and convective activity is enhanced []. In contrast, residual variability was lower in AMJJAS ( = 36.23 mm month−1, Figure 2b), consistent with drier winter conditions. The annual aggregate showed intermediate precision ( = 56.56 mm month−1, Figure 2c), indicating partial compensation between seasonal differences.
Overall, CHIRPS showed similar patterns to MSWEP. However, it more strongly overestimated precipitation during ONDJFM ( = 6.08 mm month−1, Figure 2d) while performing similarly during AMJJAS ( = −0.27 mm month−1, Figure 2e). At annual scales, the accuracy of CHIRPS was modest ( = 2.90 mm month−1, Figure 2f), indicating an acceptable overall agreement. The precision of CHIRPS was very similar to MSWEP in both patterns and magnitudes, being lower during ONDJFM ( = 76.93 mm month−1, Figure 2d) than during AMJJAS, with annual dispersion ( = 60.16 mm month−1, Figure 2f) closely matching MSWEP.
ERA5-Land systematically overestimated precipitation, with large positive biases during AMJJAS ( = 18.32 mm month−1, Figure 2h) and very large biases during ONDJFM ( = 54.54 mm month−1, Figure 2g), resulting in the highest annual bias among the three products ( = 36.43 mm month−1, Figure 2i). Precision was consistently lower than MSWEP and CHIRPS, particularly during ONDJFM ( = 96.04 mm month−1, Figure 2g), indicating low reliability during the wet season. Even during the dry season (AMJJAS), precision remained low ( = 45.52 mm month−1, Figure 2h), and the annual precision was the lowest of all products ( = 77.30 mm month−1, Figure 2i).
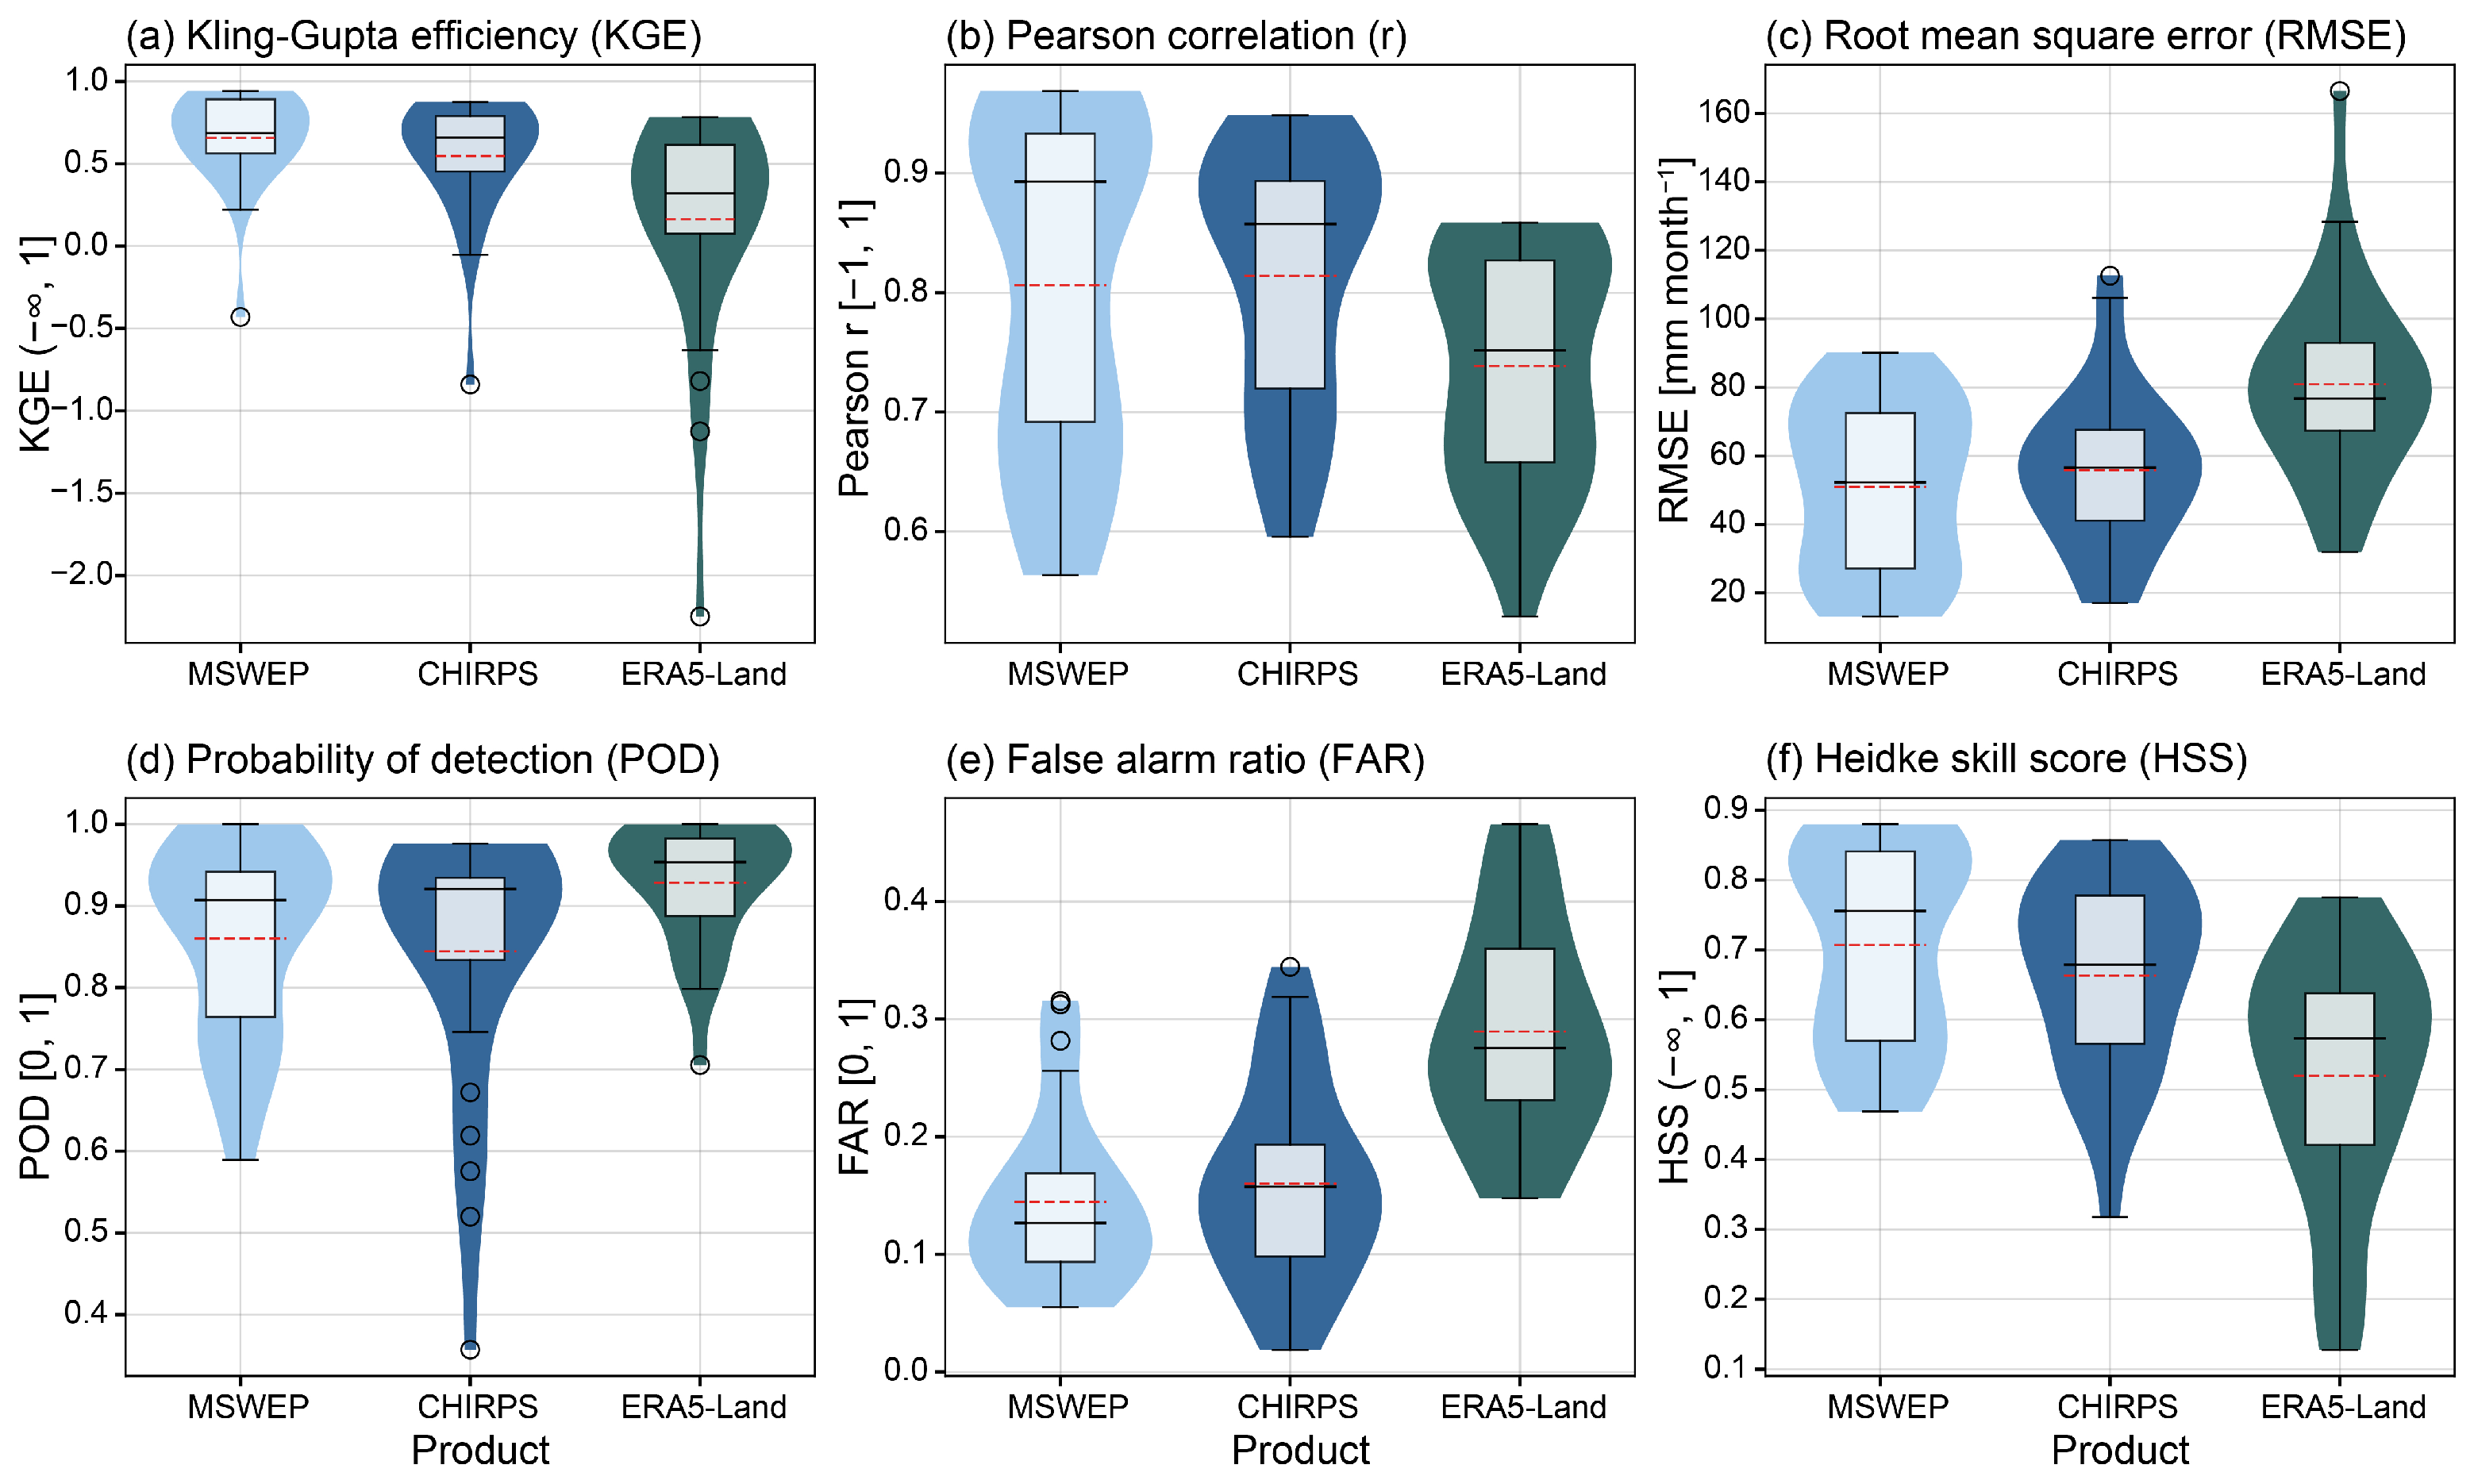
Continuous and categorical performance metrics (Figure 3) consistently demonstrated the superiority of MSWEP over CHIRPS and ERA5-Land. MSWEP achieved the highest median KGE (0.69, interquartile range (IQR): 0.56 to 0.85, Figure 3a), followed closely by CHIRPS (0.66, IQR: 0.49 to 0.79), while ERA5-Land lagged considerably (0.32 IQR: 0.10 to 0.57). MSWEP generally showed good to excellent results across Bolivia’s weather stations, as reflected by its relatively narrow interquartile range, while CHIRPS and ERA5-Land exhibited progressively wider ranges, indicating more variable performance (Figure 3a–c). Similarly, MSWEP attained the highest median Pearson correlation (r = 0.89, IQR: 0.69 to 0.93, Figure 3b), and the lowest median RMSE (52.25 mm month−1, IQR: 27.14 to 72.47 mm month−1, Figure 3c), though with a bimodal distribution, reflecting two station clusters. CHIRPS showed a similar median RMSE to MSWEP (56.58 mm month−1, IQR: 41.04 to 67.61 mm month−1) but a higher first quartile, indicating larger errors, while ERA5-Land performed worst with the highest median RMSE (76.79 mm month−1, IQR: 67.27 to 92.96 mm month−1, Figure 3c).
Figure 3.
Continuous and categorical metric performance comparison of MSWEP, CHIRPS, and ERA5-Land precipitation products across Bolivia. Violin plots show the distribution of (a) Kling–Gupta Efficiency (KGE), (b) Pearson correlation coefficient, (c) Root Mean Square Error (RMSE), (d) Probability of Detection (POD), (e) False Alarm Ratio (FAR), and (f) Heidke Skill Score (HSS) across 27 weather stations. Black solid lines indicate medians, red dashed lines show means, and white boxes represent interquartile ranges. Higher values indicate better performance for KGE, correlation, POD, and HSS, while lower values are preferred for RMSE and FAR. Except for the RMSE, the x-axis for dimensionless metrics (KGE, r, POD, FAR, and HSS) shows the metric [min, max].
In categorical metrics, MSWEP again performed best. It showed the highest ability to capture monthly precipitation events with a median POD of 0.91 (IQR: 0.76 to 0.94), while maintaining the lowest rate of false discoveries, indicated by its low median FAR (0.15, IQR: 0.08 to 0.19). By contrast, ERA5-Land achieved the highest POD value (median of 0.95, Figure 3d) and also the highest FAR (median of 0.28, Figure 3e). Finally, MSWEP obtained the highest median HSS (0.72, IQR: 0.51 to 0.80), confirming its overall performance in capturing precipitation events accurately. The Wilcoxon signed-rank tests confirmed MSWEP’s superiority across Bolivia, showing statistical differences with CHIRPS for KGE (p = 0.021) and HSS (p = 0.022) and with ERA5-Land for all metrics (p < 0.01). CHIRPS also outperformed ERA5-Land across all metrics (p < 0.01).
3.2. Combined Accuracy Index (CAI)
The Wilcoxon signed-rank test results reveal a clear statistical pattern in the relative performance of the three precipitation products. The pairwise comparisons demonstrated that MSWEP significantly outperformed ERA5-Land (p < 0.001) with a large effect size (r = 0.73), indicating a marked difference in performance across the same stations. Similarly, CHIRPS showed significantly better performance than ERA5-Land (p = 0.0014) with a medium effect size (r = 0.63), confirming the superiority of satellite-gauge merged products over pure reanalysis in the complex Bolivian terrain. Importantly, the comparison between MSWEP and CHIRPS also yielded a statistically significant difference (p < 0.05, r = 0.364), demonstrating that MSWEP consistently outperformed CHIRPS across the validation stations. This pattern of results establishes a clear performance hierarchy, with MSWEP as the top performer, CHIRPS as a strong second-tier product, and ERA5-Land showing substantially lower performance.
When analyzed over specific regions, the CAI showed MSWEP as the best-performing product in all of them, except the Llanos, where CHIRPS showed a slight advantage. In the Altiplano, MSWEP achieved the highest skill, with a CAI of 0.91, outperforming CHIRPS (0.80) and ERA5-Land (0.68). In the Valles, MSWEP also showed the best agreement with observations (CAI = 0.85), while CHIRPS obtained slightly lower skill (0.79) and ERA5-Land performed poorly (0.51), indicating limited capacity to reproduce precipitation in regions with steep gradients and localized convective events. In the Llanos, CHRIPS slightly outperformed MSWEP, with a CAI of 0.85 versus 0.82, while ERA5-Land ranked lowest (0.79). In the Chaco, both MSWEP and CHIRPS performed comparably, with CAI of 0.80 and 0.81, respectively, while ERA5-Land lagged behind (0.70). Finally, in Amazonia, all products displayed high skill, though MSWEP led with a CAI of 0.93, followed by ERA5-Land (0.88) and CHIRPS (0.86).
3.3. Continuous Metrics
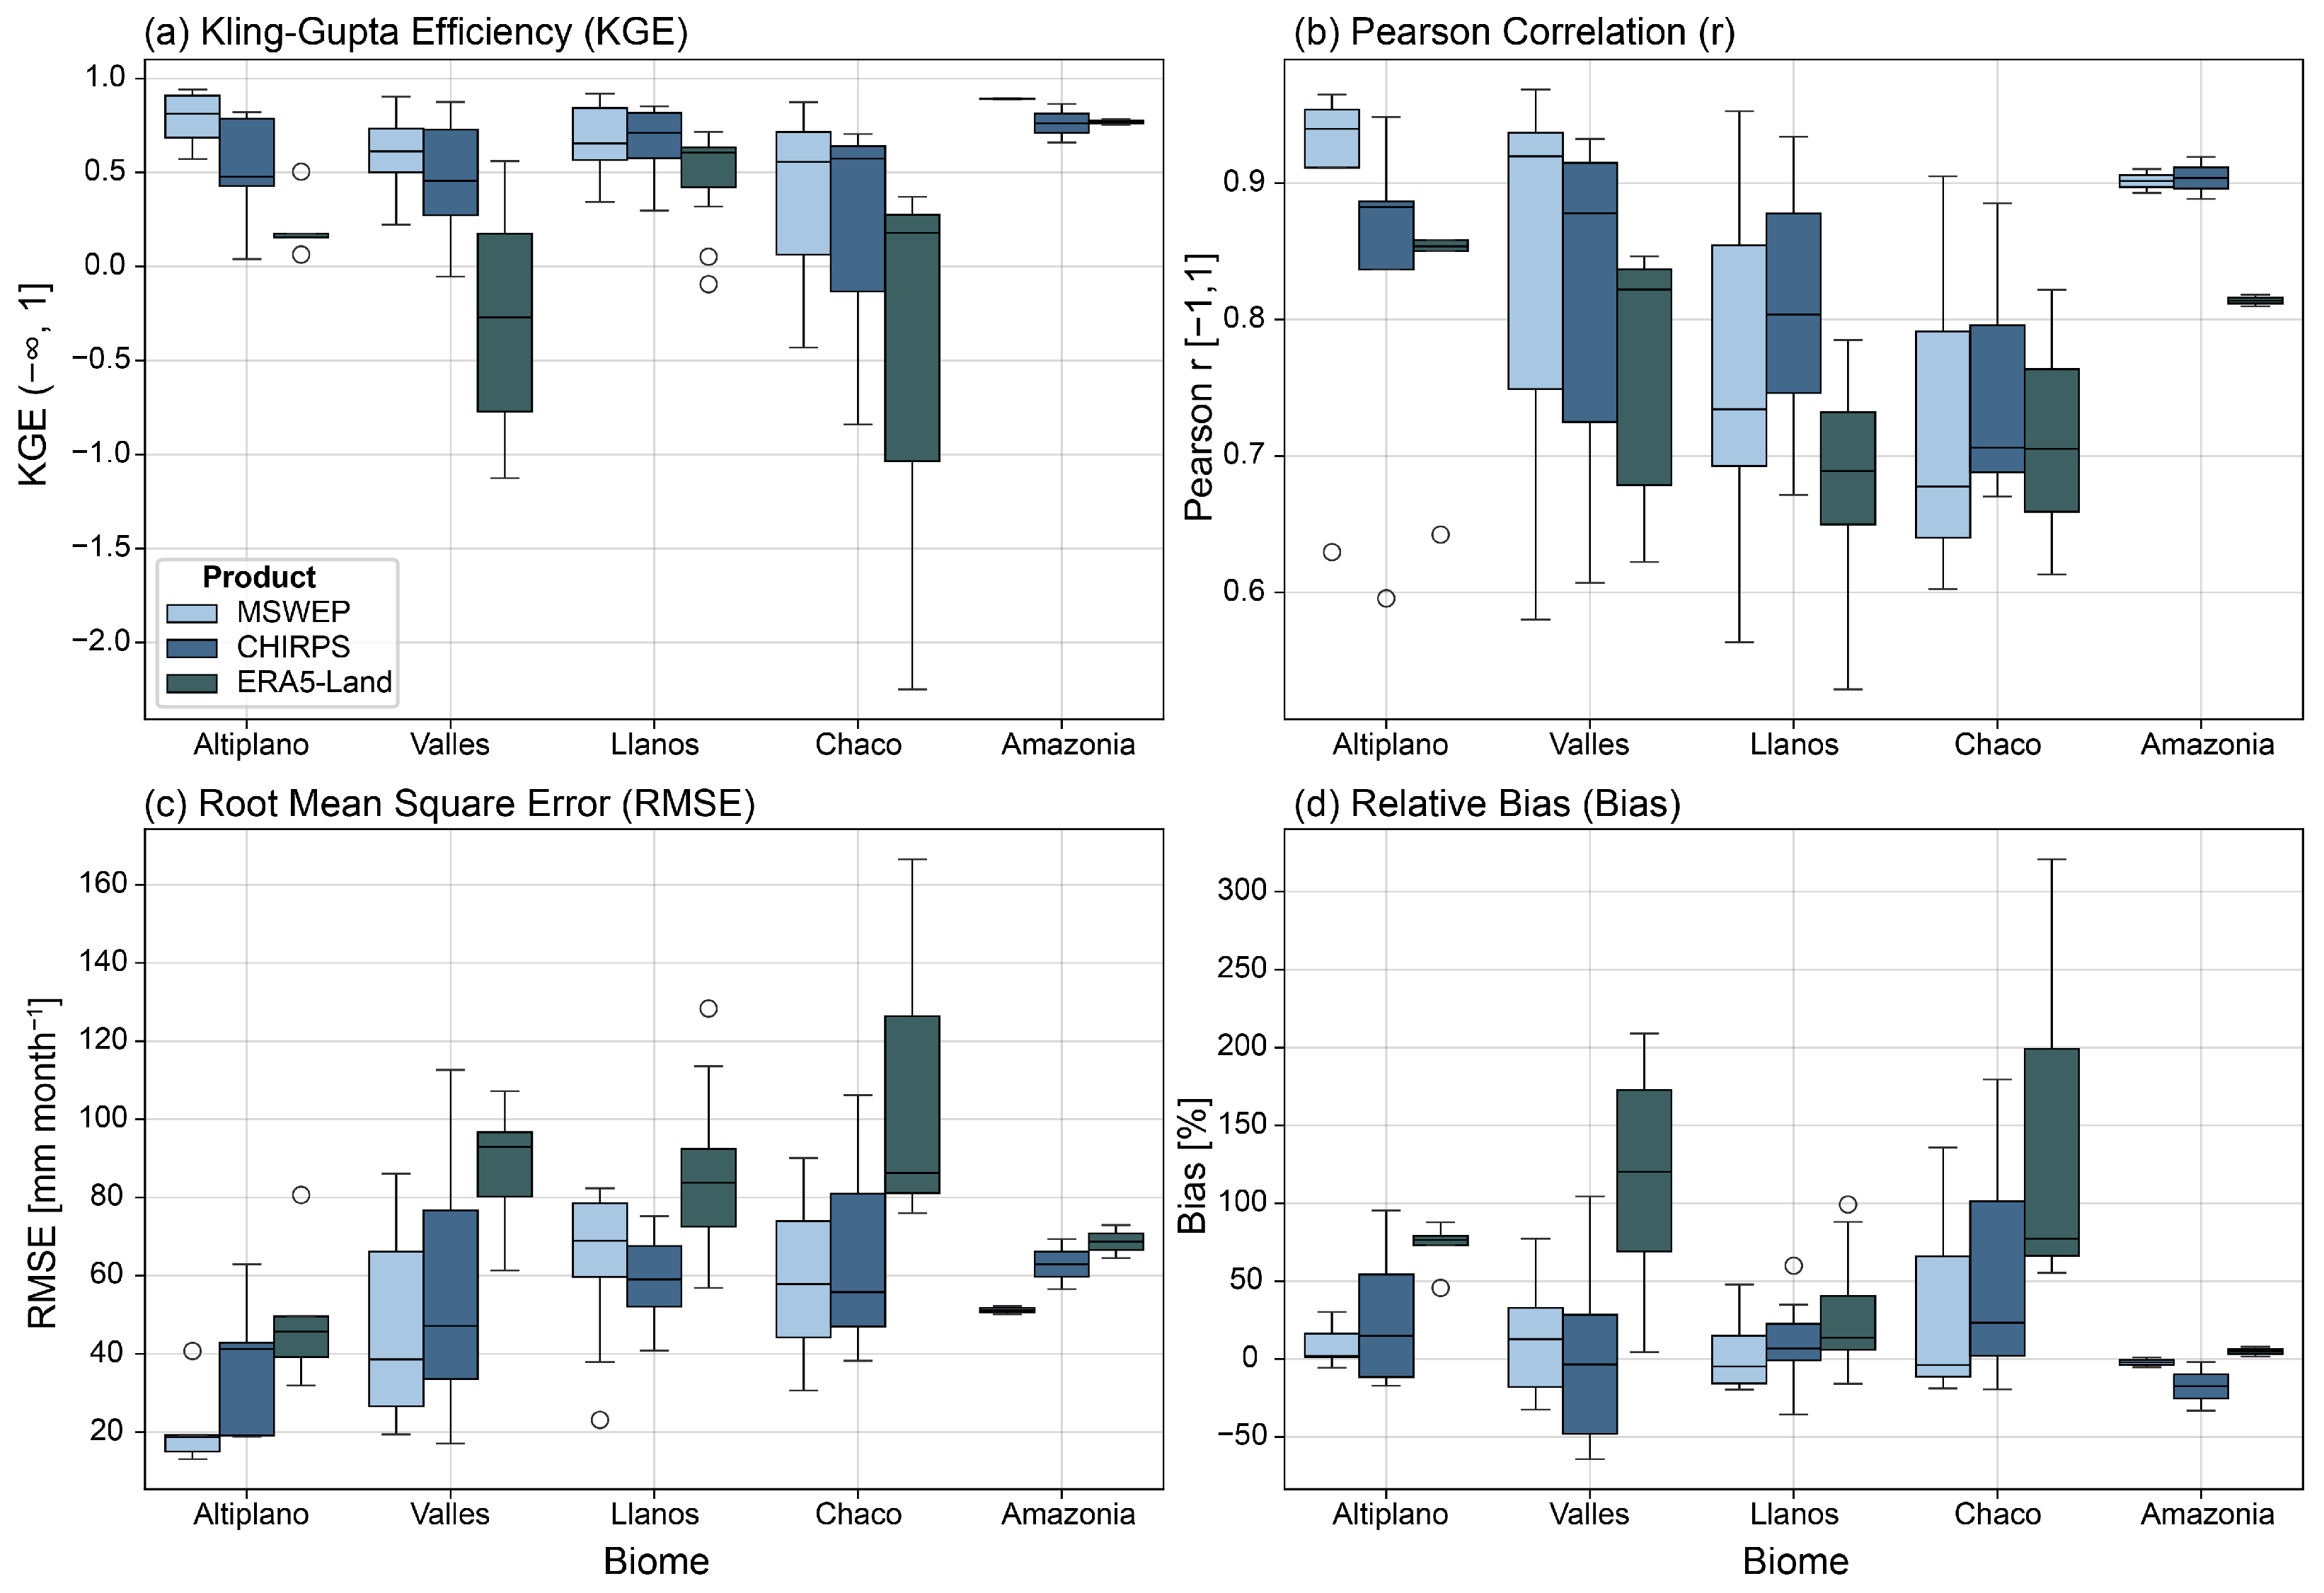
In the Altiplano (above 3500 m, a semi-arid high-elevation Andean plateau), MSWEP outperformed the other products, with a median KGE of 0.81 (IQR: 0.69 to 0.91, Figure 4a), much higher than CHIRPS (0.48, IQR: 0.43 to 0.79) and ERA5-Land (0.16, IQR: 0.15 to 0.18). MSWEP also achieved the highest correlation with station observations (r = 0.94, IQR: 0.91 to 0.95, Figure 4b), the lowest uncertainty (median RMSE = 18.72 mm month−1, IQR: 15.04 to 19.28 mm month−1, Figure 4c), substantially lower than CHIRPS (median RMSE = 41.26 mm month−1, IQR: 19.10 to 42.89 mm month−1) and ERA5-Land (median RMSE = 45.67 mm month−1, IQR: 39.18 to 49.60 mm month−1), and the lowest relative bias (median RMSE = 1.97%, IQR: 1.34% to 16.26%, Figure 4d), compared with CHIRPS (median RMSE = 14.94%, IQR: −11.60% to 54.29%) and ERA5-Land (median bias = 76.55%, IQR: 72.94% to 79.05%).
Figure 4.
Continuous metrics results for the three precipitation products analyzed. Plots are shown for each region considering 43 years of precipitation data for MSWEP, CHIRPS, and ERA5-Land compared with available weather stations across Bolivia.
The Valles (1500–3500 m, complex montane topography) presents moderate challenges for satellite precipitation retrieval algorithms due to pronounced orographic effects and steep elevation gradients that create highly localized precipitation patterns. MSWEP maintained performance with a median KGE of 0.61 (IQR: 0.50 to 0.73, Figure 4a), compared to 0.46 for CHIRPS (IQR: 0.27 to 0.73) and very poor results for ERA5-Land (median KGE =−0.27, IQR: −0.77 to 0.18). As in the Altiplano, MSWEP´s superiority was also supported by higher correlations with observations (median r = 0.92, IQR: 0.75 to 0.94 vs. median r = 0.88, IQR: 0.73–0.91 for CHIRPS and median r = 0.82, IQR: 0.68 to 0.84 for ERA5-Land), lower RMSE (median RMSE = 38.60 mm month−1, IQR: 26.64 to 66.11 vs. median RMSE = 47.16, IQR: 33.60 to 76.66 for CHIRPS and median RMSE = 92.96, IQR: 80.26 to 96.70 for ERA5-Land), and a narrower range of relative bias (median relative bias = 12.75%, IQR: −17.90% to 32.77% vs. median relative bias = −3.50%, IQR: −47.97% to 28.36% for CHIRPS and median relative bias = 120.08%, IQR: 69.12% to 172.69% for ERA5-Land, Figure 4b–d).
In the Llanos (200–1000 m, tropical grasslands and transitional wetlands), CHIRPS slightly outperformed MSWEP. It achieved a median KGE of 0.71 (IQR: 0.58 to 0.82, Figure 4a), compared to 0.65 (IQR: 0.57 to 0.84) for MSWEP and 0.61 (IQR: 0.42 to 0.63) for ERA5-Land. CHIRPS also showed a high correlation with precipitation observations (median r = 0.80, IQR: 0.75 to 0.88), a low RMSE (median RMSE = 59.05 mm month−1, IQR: 52.06 to 67.61), and a moderate relative bias (median bias = 6.87%, IQR: –0.79% to 22.58%). By contrast, MSWEP presented slightly lower correlations (median r = 0.73, IQR: 0.69 to 0.85), higher RMSE (median RMSE = 68.92 mm month−1, IQR: 59.71 to 78.57), and near-zero bias (median bias = –4.76%, IQR: –15.72% to 15.00%). ERA5-Land showed consistently weaker performance across all metrics (Figure 4b–d).
In the Chaco (below 1000 m, semi-arid lowlands with pronounced wet-dry cycles), MSWEP and CHIRPS showed similar moderate performance, with KGE of 0.56 (IQR: 0.06 to 0.72, Figure 4a) and 0.57 (IQR: −0.13 to 0.64), respectively. ERA5-Land performed worse (KGE = 0.18, IQR: −1.04 to 0.27), reflecting its limitations in capturing semi-arid precipitation regimes. In the Chaco, Pearson correlation was low for all products, implying that these have difficulties in capturing the distinctive wet-dry seasonal transitions characteristic of semi-arid lowland climates in Bolivia. Correlations with observations were modest for all three products (median r range: 0.68–0.71, Figure 4b). CHIRPS achieved the lowest RMSE (median RMSE = 55.80 mm month−1 IQR: 47.02 to 80.99 mm month−1, Figure 4c), followed by MSWEP (median RMSE = 57.83 mm month−1 IQR: 44.22 to 73.97 mm month−1), while ERA5-Land showed the highest errors (median RMSE = 86.25 mm month−1 IQR: 81.13 to 126.39 mm month−1). In contrast, MSWEP performed best in terms of relative bias (median = −3.88%, IQR: −11.40% to 65.96%, Figure 4d), compared to higher biases for CHIRPS (23.34%, IQR: 1.93% to 101.37%) and ERA5-Land (77.24%, IQR: 66.23% to 199.07%).
In Amazonia (below 200 m, a tropical rainforest environment with intense convective precipitation systems and >1500 mm annual precipitation), satellite retrieval algorithms face unique challenges due to dense vegetation canopies and the complexity of convective processes typical of humid tropical climates. MSWEP achieved exceptional performance, with a median KGE of 0.89 (IQR: 0.89 to 0.89, Figure 4a), the highest of all regions. CHIRPS also performed well (median KGE = 0.76, IQR: 0.71 to 0.81), while ERA5-Land demonstrated its strongest regional performance (median KGE = 0.77, IQR: 0.76 to 0.78), reflecting improved algorithm performance in the relatively uniform topographic conditions and high precipitation. Correlations with observations were excellent for both MSWEP and CHIRPS (median r = 0.90 and IQR: 0.90 to 0.91 for both products, Figure 4b), with the highest correlation coefficients observed across all regions. RMSE was the lowest for MSWEP (median error = 51.17 mm month−1, IQR: 50.64 to 51.71 mm month−1, Figure 4c), followed by CHIRPS (median error = 62.95 mm month−1, IQR: 59.76 to 66.13 mm month−1) and ERA5-Land (median error = 68.71 mm month−1, IQR: 66.59 to 70.84 mm month−1). Relative bias showed minimal bias with MSWEP (median relative bias = −2.09%, IQR: −3.63% to −0.56%, Figure 4d), compared to stronger underestimation with CHIRPS (median relative bias = −17.50%, IQR: −25.26% to −9.73%) and overestimation by ERA5-Land (median relative bias = 4.77%, IQR: 3.23% to 6.31%).
3.4. Trend Analysis
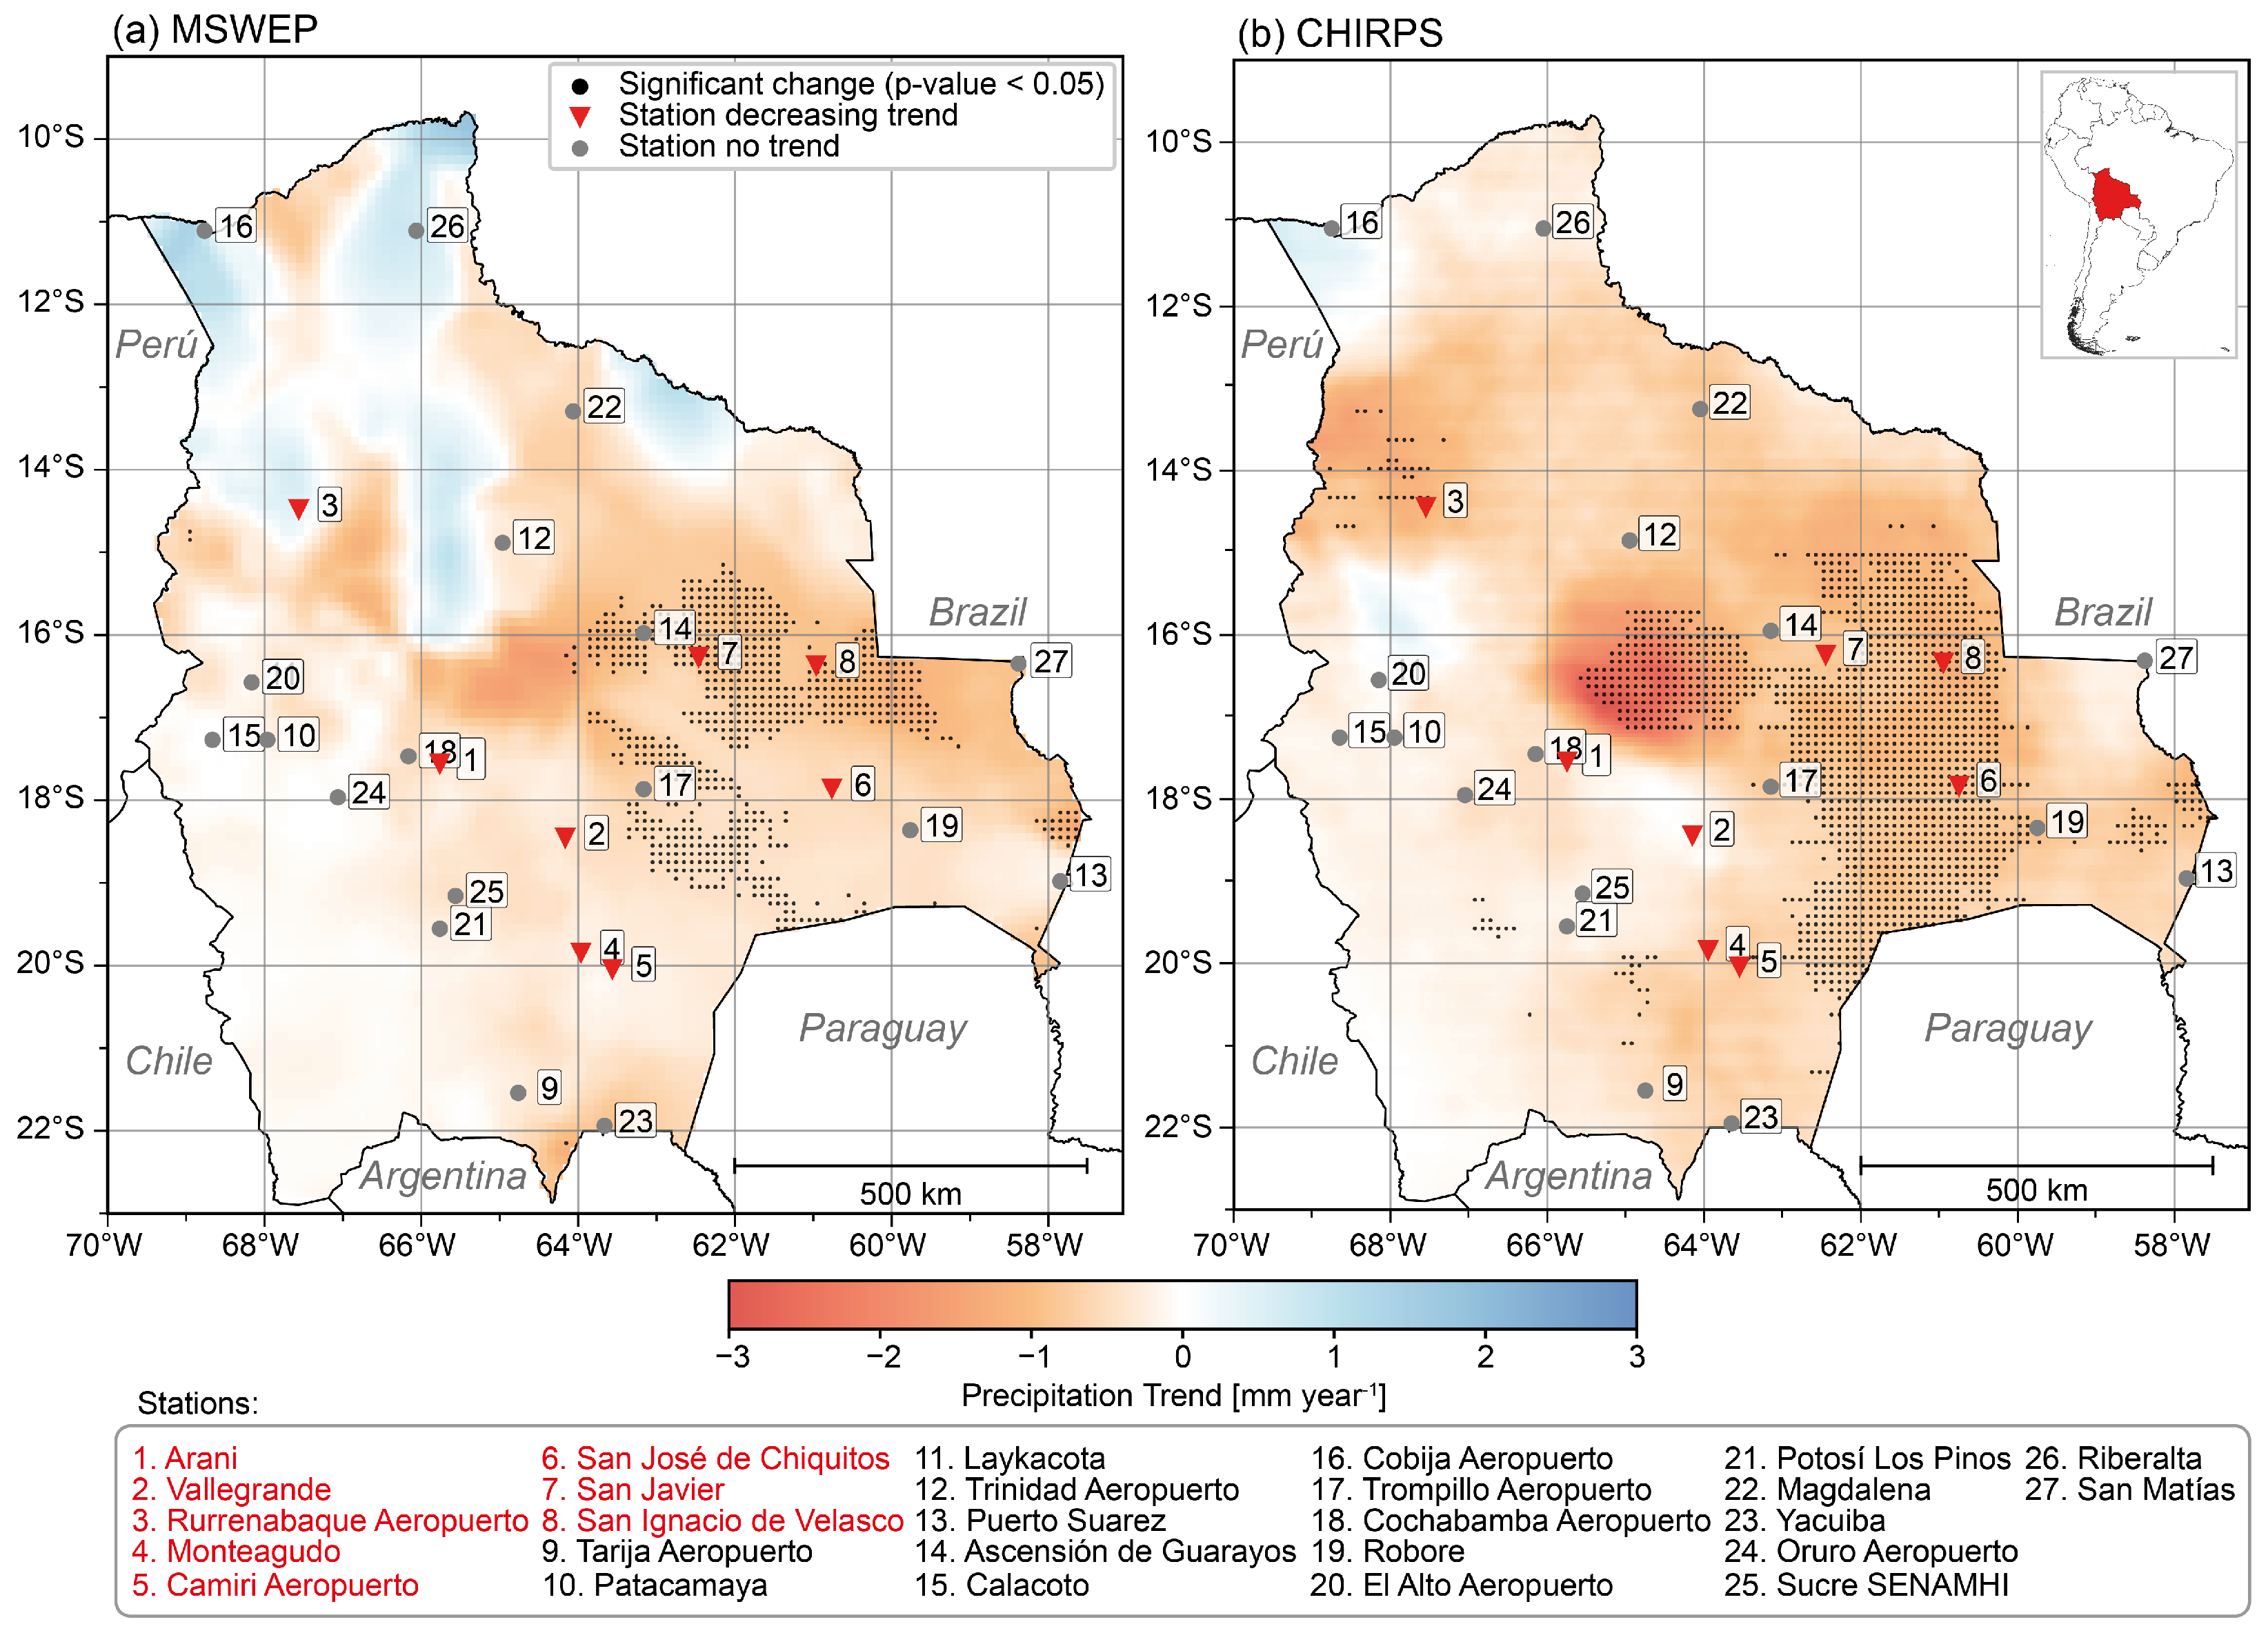
Figure 5 shows the precipitation trends during 1980–2022 for the best-performing products, MSWEP (Figure 5a) and CHIRPS (Figure 5b), along with the significance of station trends. When considering all grid points regardless of statistically significant trends (Table 2), both products indicate widespread precipitation reductions across most regions. The Altiplano showed the mildest declines, with CHIRPS indicating a median decrease of −0.17 mm year−1 (IQR: −0.22 to −0.11 mm year−1) and MSWEP a more moderate median decline of −0.08 mm year−1 (IQR: −0.13 to −0.05 mm year−1) over 149,000 km2. By contrast, the Amazonia region exhibited contrasting results between products, with CHIRPS indicating a strong precipitation decline (median= −0.33 mm year−1, IQR: −0.68 to −0.19 mm year−1), while MSWEP suggested a positive trend (median = 0.19 mm year−1, IQR: −0.09 to 0.51 mm year−1). The Chaco showed consistently negative precipitation trends across datasets, though magnitudes varied. CHIRPS reported a median decline of −0.64 mm year−1 (IQR: −0.74 to −0.56 mm year−1), while MSWEP indicated a less pronounced but still significant median decrease of −0.40 mm year−1 (IQR: −0.46 to −0.31 mm year−1). The narrower interquartile range in the MSWEP data suggests more spatially homogeneous patterns. In the Llanos, declines were most pronounced, with CHIRPS estimating a median decrease of −0.80 mm year−1 (IQR: −1.0 to −0.63 mm year−1), while MSWEP indicated −0.55 mm year−1 (IQR: −0.81 to −0.25 mm year−1). The Valles displayed intermediate declines, with CHIRPS showing a median decrease of −0.34 mm year−1 (IQR: −0.48 to −0.21 mm year−1) and MSWEP of −0.32 mm year−1 (IQR: −0.41 to −0.21 mm year−1).
Figure 5.
Trends of precipitation change (mm year−1) based on the best performing products: MSWEP and CHIRPS precipitation datasets (43 years). Stations with a significant negative trend are shown with red triangles in the figure and highlighted in red in the stations list. Black dots refer to grid points where the trend is statistically significant (p-value < 0.05) after serial correlation treatment. Both MSWEP and CHIRPS are shown in their original spatial resolution (0.1° and 0.05°, respectively). Lagend applies to both maps. See Figure 1 to relate to the studied regions.
Table 2.
Summary statistics of precipitation trends (mm year−1) from satellite products across entire regions, regardless of statistical significance. SD is the standard deviation, Q25 and Q75 are the 25th and 75th percentiles, respectively.
Restricting the analysis to statistically significant pixels (p < 0.05 with AR(1) correction) revealed a more robust pattern of precipitation change (Figure 5). The Llanos showed the highest decline in precipitation, with MSWEP indicating a median decrease of −0.87 mm year−1 (IQR: −1.00 to −0.76 mm year−1) over 55,900 km2, and CHIRPS registering a decline of −1.01 mm year−1 (IQR: −1.20 to −0.89 mm year−1) over 103,175 km2. Evidence for precipitation decline in the Llanos is also corroborated by the weather stations’ trend in Figure 5. The Chaco also showed high agreement between products, with MSWEP (median decline of −0.46 mm year−1, IQR: −0.48 to −0.44 mm year−1) and CHIRPS (median decline of −0.76 mm year−1, IQR: −0.83 to −0.67 mm year−1). In the remaining regions, significant changes were very localized (Figure 5 and Table 3).
Table 3.
Summary statistics for precipitation trends (mm year−1) from satellite products across regions, restricted to statistically significant pixels. Count indicates the number of significant pixels, SD is the standard deviation, and Q25 and Q75 are the 25th and 75th percentiles, respectively.
4. Discussion
4.1. Dataset Performance and Regional Differences
We conducted a comprehensive validation of precipitation datasets for Bolivia. In this country, the topographical complexity, the interplay of different moisture sources, and the sharp gradients between humid Amazonian lowlands and the arid Altiplano pose challenges for remotely sensed precipitation approximations. Previous studies have validated gridded precipitation datasets under a variety of climatic regimes [,,,,]. In Bolivia, these products were able to reproduce the temporal patterns of precipitation, albeit with a tendency to overestimate during the austral summer (ONDJFM) and underestimate during the austral winter (AMJJAS). This seasonal bias is consistent with higher precipitation magnitudes and increased convective activity during the austral summer/wet season [].
Our results highlight two overarching factors. First, the strong climatic and topographic heterogeneity of Bolivia, with steep sub-grid gradients and a dominance of convective activity, represents a challenge to precipitation products in reproducing the spatio-temporal variability of precipitation. Secondly, the scarcity and low density of meteorological stations hinder the representation of these gradients and limit robust ground-based validation. Together, these factors reinforce the value of gridded precipitation products for studying climate variability in Bolivia or environments alike, while also underscoring the need for cautious interpretation. In this study, we therefore applied a detailed validation framework and adopted a conservative approach to trend detection based on reliable monthly ground precipitation data.
Among the three precipitation datasets, MSWEP exhibited the highest overall accuracy and precision. It consistently achieved the highest KGE values, lowest RMSE, and best CAI in all regions, with the sole exception of the Llanos, where CHIRPS performed marginally better. Multiple studies indicate that MSWEP tends to exhibit better accuracy in complex terrains compared to CHIRPS and ERA5-Land (e.g., []). For instance, a global intercomparison of 22 products found that MSWEP (v1-2) achieved the best temporal correlation with gauges, outperforming both reanalysis and satellite datasets []. In the Tibetan Plateau, MSWEP also demonstrated higher correlations, lower RMSE, and better detection capabilities than CHIRPS for daily precipitation []. Across Africa, validation against 104 hydrometeorological stations showed MSWEP v2.8 to be among the most reliable products for monthly and annual precipitation, with KGE values exceeding 0.75 []. Comparable results have been reported for Pakistan [,], Iran [], and China [,], underscoring MSWEP’s robust performance across diverse climatic regimes. In South America, validation studies have focused more heavily on CHIRPS, which have also shown strong skill, particularly in mountainous [,] and coastal regions [].
An important consideration in Bolivia and regions with similar climatological and topographic complexity is the capacity of precipitation products to sustain accuracy across contrasting environments, from arid high mountains to lowland tropical rainforests []. MSWEP achieves this by combining satellite estimates in convective lowlands with gauge and reanalysis/satellite inputs in orographically complex terrain, delivering consistently strong performance across regions. By contrast, CHIRPS and ERA5-Land exhibit greater spatial variability in skill, suggesting that additional bias correction methods may be necessary to enhance accuracy across different regions [,].
In the tropical Llanos of eastern Bolivia, a flat region with marked wet/dry seasonal cycles, CHIRPS performed closely to MSWEP, achieving a median KGE of 0.71 against MSWEP’s 0.65. Both products effectively reproduced the seasonal precipitation cycle (correlations of 0.80 and 0.73, respectively), while ERA5-Land also performed reasonably well (KGE = 0.61, r = 0.69). A similar convergence among products was observed in the Amazon, suggesting that in relatively homogeneous climates with ample warm-season convection, the advantage of MSWEP’s merging method is less pronounced, and calibrated satellite and reanalysis products suffice. In contrast, moving towards more complex topography, such as the steep Valles and Altiplano regions with highly localized convective rainfall, MSWEP’s multi-source integration is highlighted as the best product. In these regions, CHIRPS performance declined to a KGE of 0.46–0.48 due to its difficulty, despite its higher resolution, in resolving sharp spatial gradients, whereas MSWEP maintained a KGE of 0.61–0.81. and ERA5-Land to −0.27 and 0.16 for the Valles and Altiplano, respectively. Instead of relying primarily on one source, as do CHIRPS (satellite and gauge) or ERA5-Land (reanalysis), MSWEP combines the complementary strengths of each. This integration ensures that when one source performs poorly in a given region (e.g., satellite in cloudy high Andes, or reanalysis in convective Amazonia), other sources compensate for precipitation estimations [,].
4.2. Causes of Systematic Biases
The use of global precipitation datasets demands an understanding of their systematic biases, which is essential for their correct use in climate and hydrological analysis. MSWEP, CHIRPS, and ERA5-Land integrate different types of observations and model outputs, which introduces a variety of sources of error. These biases are related to the physical representation of atmospheric processes, the spatial and temporal resolution of the inputs, and the methods used to merge or assimilate data. In MSWEP, biases originate mainly from the integration of its complex multi-source merging methodology [,]. This dataset combines gauge, satellite, and reanalysis data, and the propagation of errors from these inputs affects the final product [,]. For instance, despite its overall good global performance [], systematic biases often manifest locally, such as the overestimation observed in high-elevation regions like the Qinghai-Tibet Plateau []. This wet bias might be associated with the incorporation of certain input datasets like ERA5, which are known to overestimate precipitation in mountainous regions [,]. However, we did not observe a significant wet MSWEP bias in the Altiplano or the Valles regions (median relative bias of 2% and −5%, respectively). The weighting assigned to gauge observations, which is based on network density, is also a critical factor influencing the accuracy, and the blending process, applied independently to each grid cell, is noted as altering the resulting spatial distribution of local precipitation [,].
For CHIRPS, the primary sources of error relate to the spatial limitations of its reference data and the constraints of the satellite techniques used. Although it incorporates gauge corrections [], its accuracy is compromised by the sparse and uneven distribution of ground station data in complex or remote regions like the Andes, which introduces significant uncertainty [,,]. The product’s performance is also conditioned by the local geographical and climatic characteristics, including relief, vegetation cover, and the nature of convective precipitation systems [,]. Specifically, accuracy tends to decrease as elevation increases []. In our study, despite CHIRPS showing a wet relative bias in the Altiplano of 15%, the largest bias of 23% was observed in the Chaco, where only 3 weather stations were available for validation. For daily precipitation, CHIRPS tends to underestimate light rainfall but displays an overestimation for extreme events [,]. This overestimation tendency can be partially related to its fundamental training data, as aggregating satellite estimates (e.g., TRMM) over large areas can artificially inflate the perceived frequency of rainfall events [,].
ERA5 and ERA5-Land rely on numerical models and data assimilation. Their biases are dominated by systematic errors related to atmospheric physics and geographical complexities []. As in Bolivia (this study), a general wet bias is a common feature, often traced to the model overestimating precipitation on dry days []. In the geographical space, ERA5’s performance declines in regions with complex topography, indicating issues in resolving fine-scale orographic features [,,]. In addition, systematic errors can arise from describing land–atmosphere interactions, which impact moisture recycling and subsequent precipitation []. Although not reported in our study, early evidence has indicated that in trend analysis, ERA5 can introduce spurious variability into the output signal [].
4.3. Contribution of Reanalysis Products
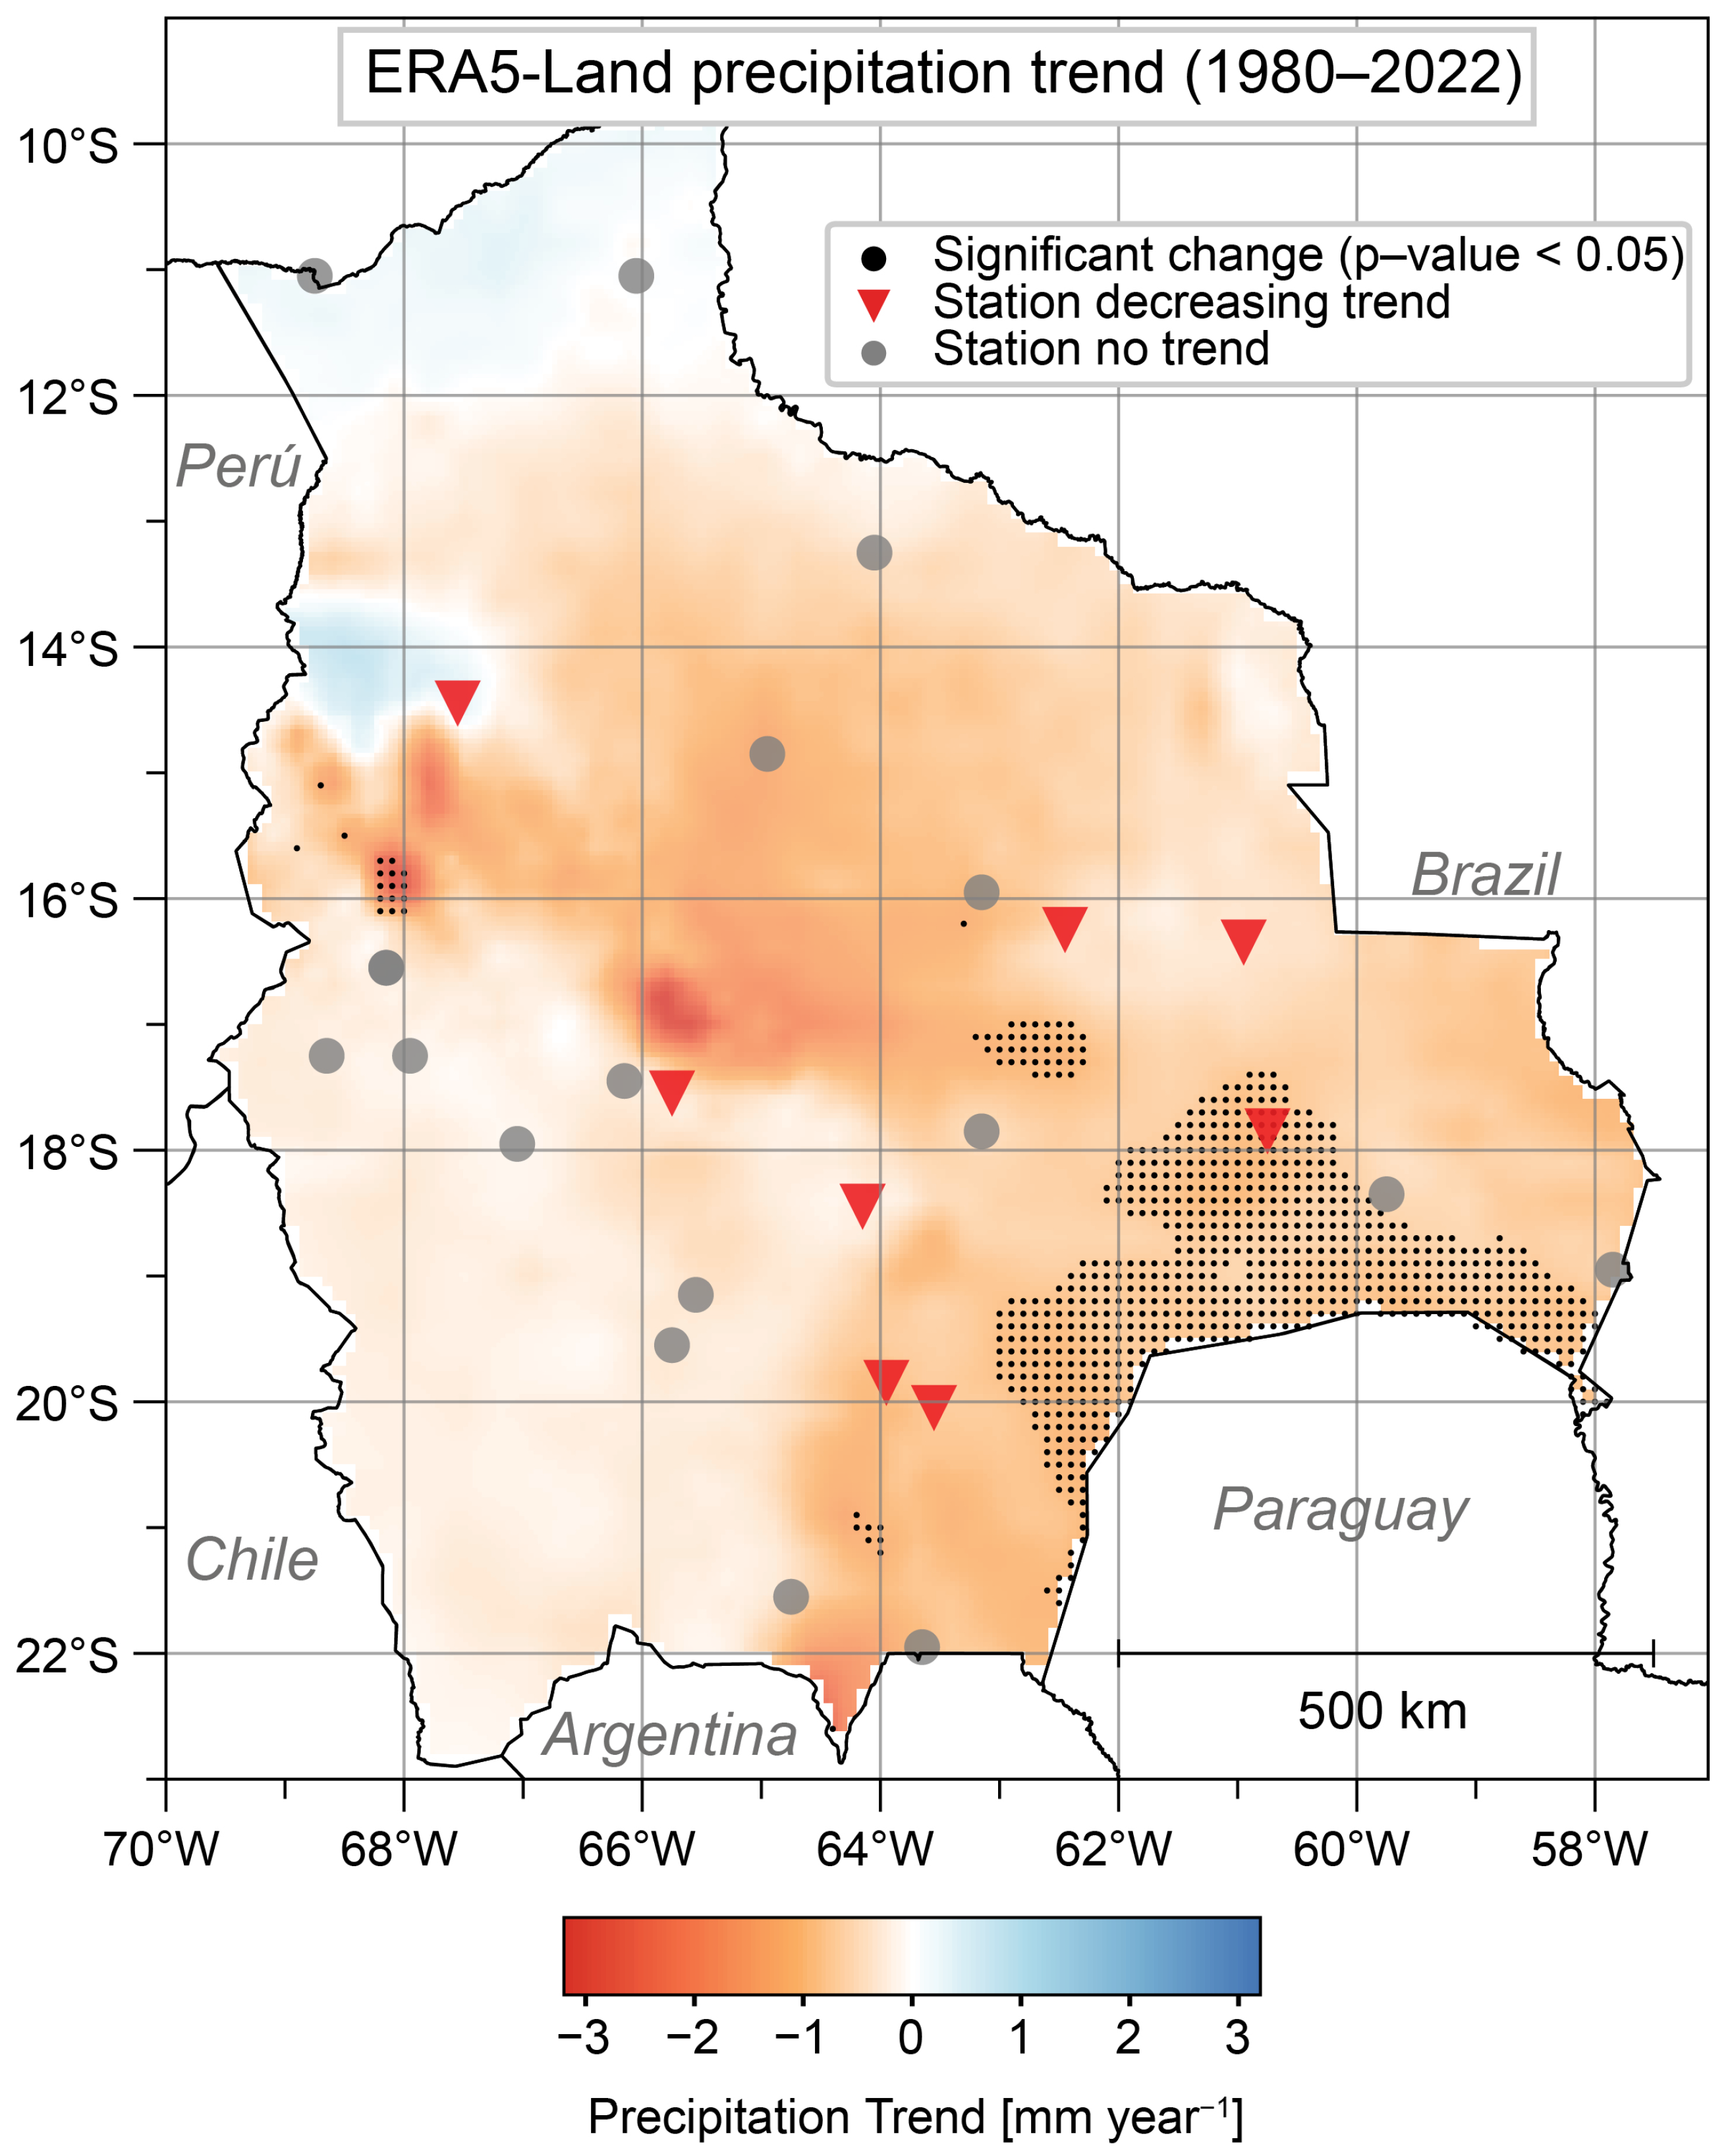
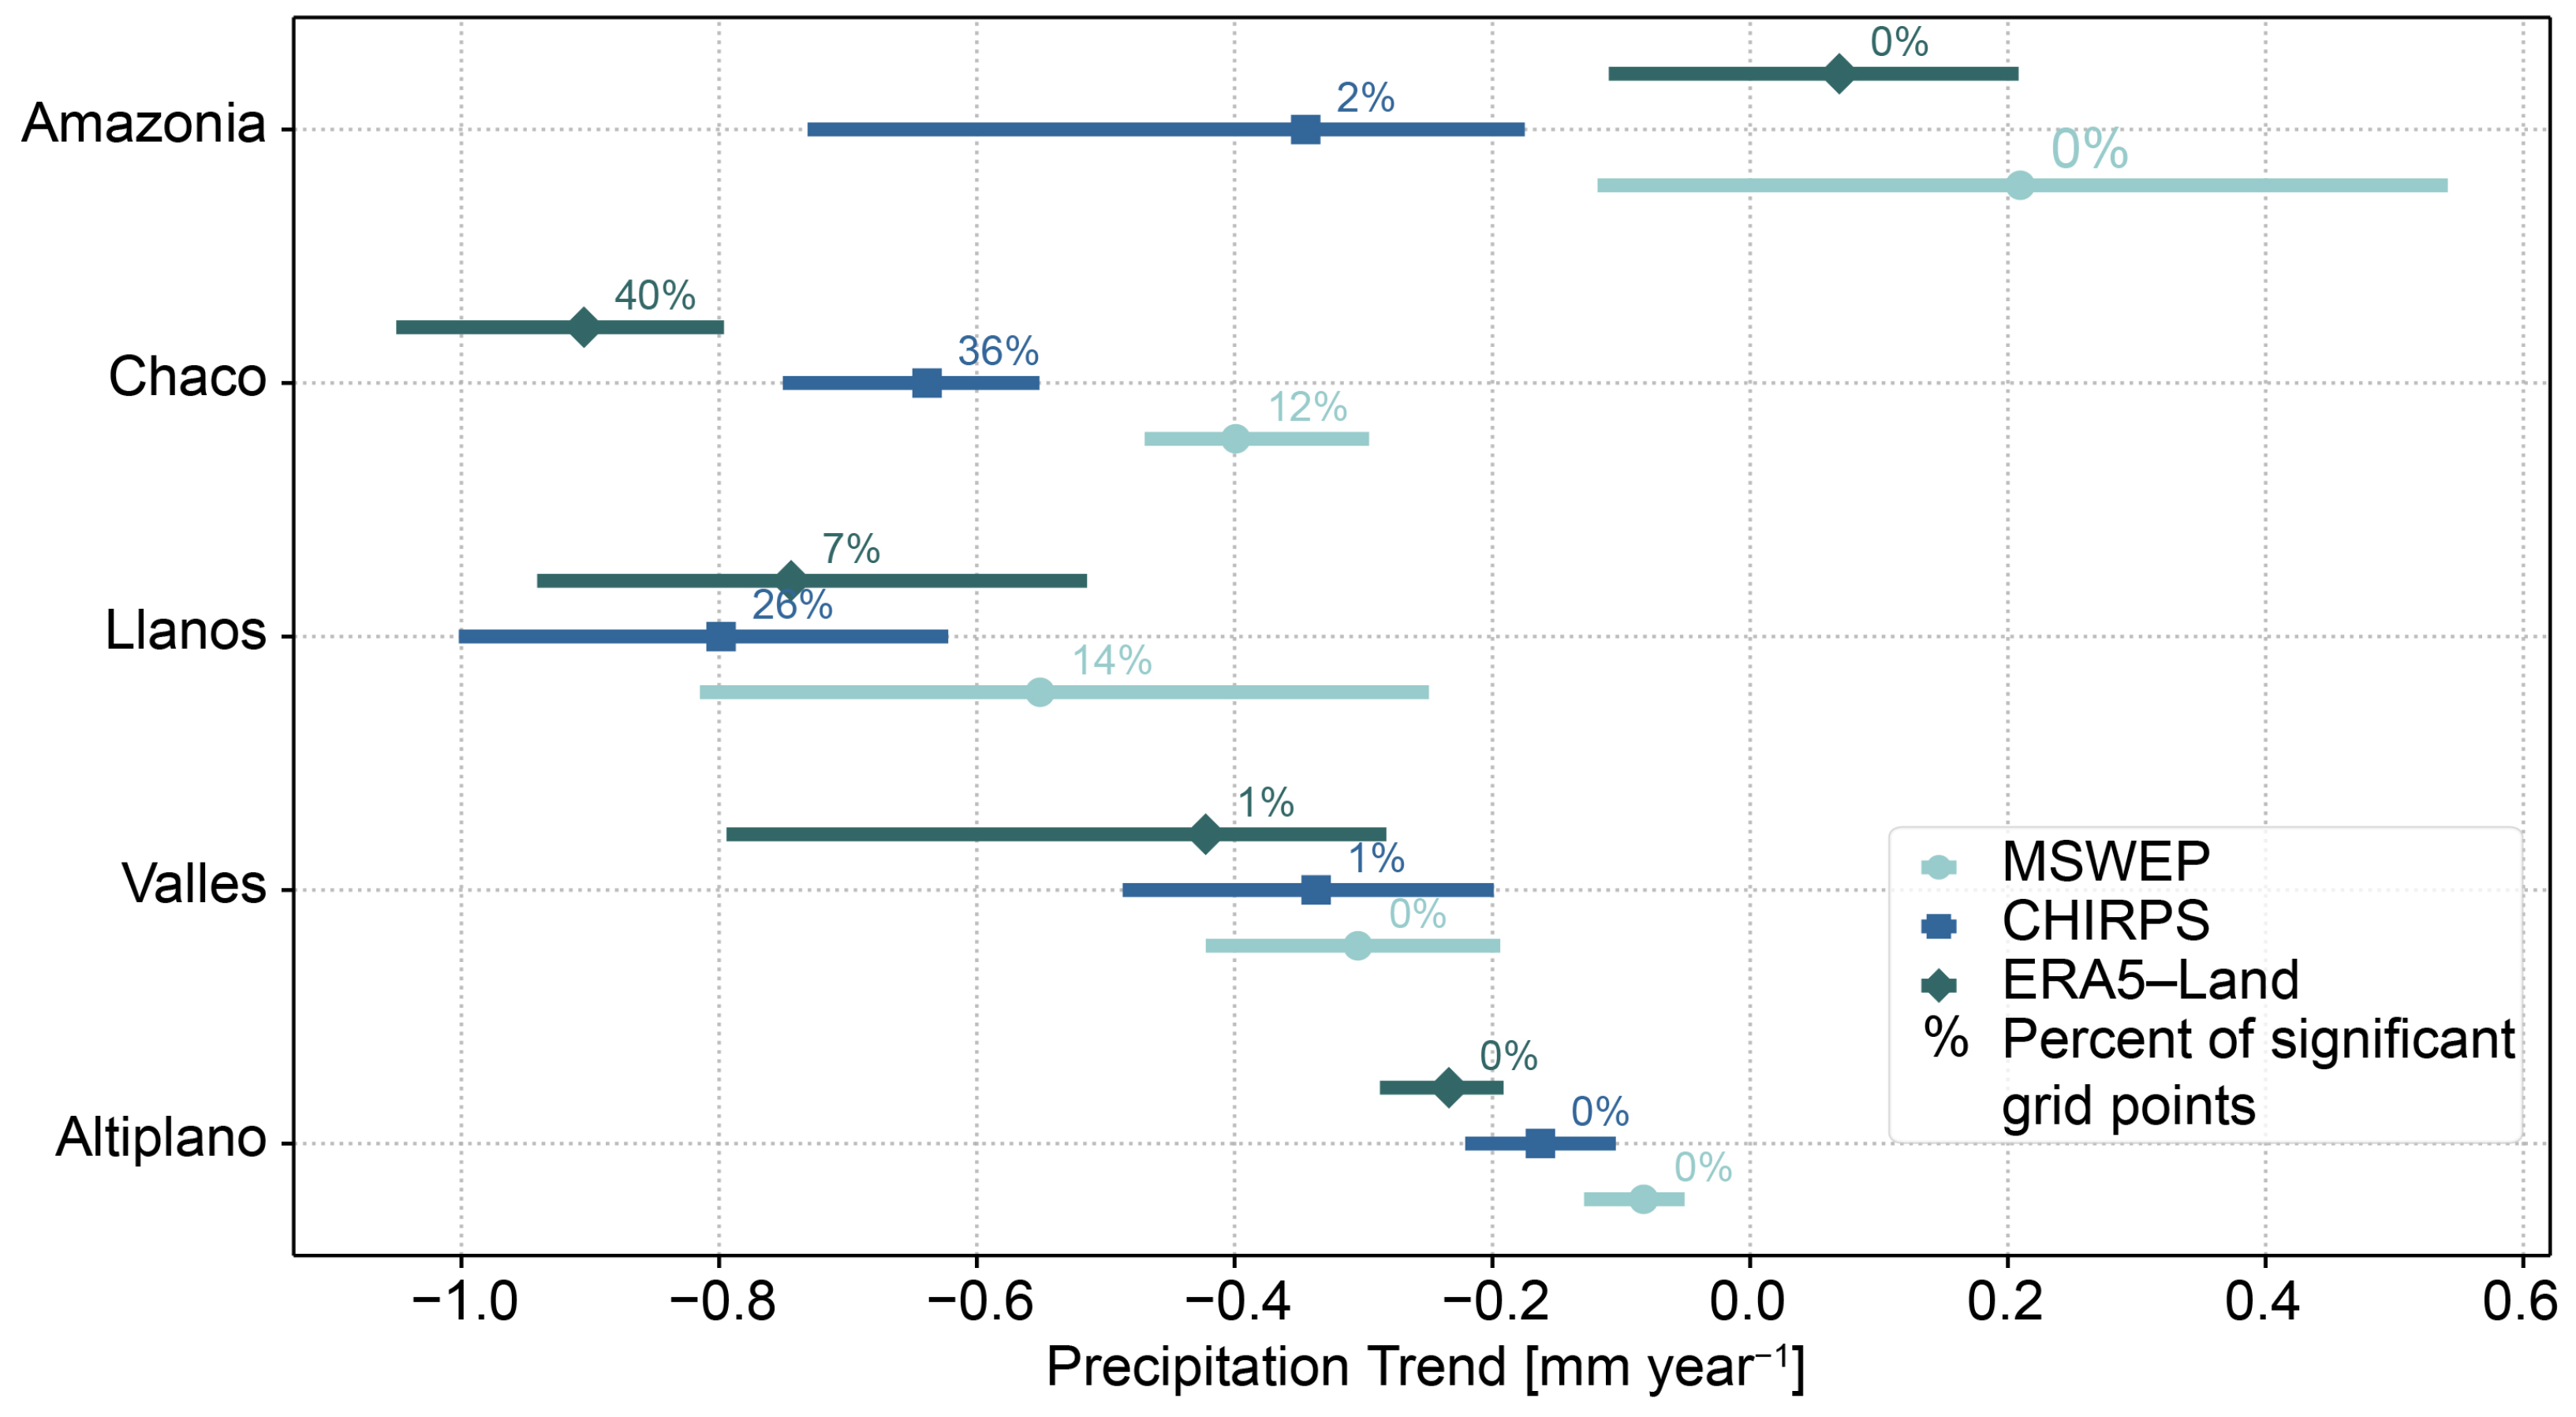
Although ERA5-Land demonstrated only moderate skill overall, its strength lies in the assimilation of a wide range of atmospheric variables. It tends to represent large-scale atmospheric dynamics rather than capturing localized rainfall events [,]. Yet, like other reanalysis products, ERA5-Land provides physically consistent climatological variables that are valuable for understanding underlying climate dynamics beyond the scope of satellite-based precipitation estimates [,]. This makes it particularly useful for exploring the mechanisms behind observed changes, as well as for validation and nesting dynamical climate models applied to Bolivia. Notably, ERA5-Land reproduced the spatial trend patterns identified by satellite-derived products, with all datasets converging on a gradient of drying that intensifies from the highlands to the lowlands (Figure 6). In the Altiplano and Valles, MSWEP, CHIRPS, and ERA5-Land all showed modest but consistent negative median trends, although these were not statistically significant (Figure 7). Drying intensified in the Llanos and Chaco, where all three products align on the strongest declines. In the Llanos, for instance, CHIRPS reached a median of −0.80 mm year−1 (IQR: −1.00 to −0.62), MSWEP −0.55 (IQR: −0.81 to −0.25), and ERA5-Land −0.74 (IQR: −0.94 to −0.51), with this region also concentrating most of the significant grid points. Whether this multiproduct agreement reflects the influence of deforestation [] or other regional drivers remains an open question for future research.
Figure 6.
Trends of precipitation change (mm year−1) based on ERA5-Land (43 years). Stations with a significant negative trend are shown with red triangles in the figure. Dots refer to grid points where the trend is statistically significant (p-value < 0.05) after serial correlation treatment. See Figure 7 to relate to the studied regions.
Figure 7.
Regional distribution of precipitation trends (1980–2022) for MSWEP, CHIRPS, and ERA5-Land after autocorrelation correction. Boxplots show the spread of trend slopes within each major region of Bolivia (Altiplano, Valles, Llanos, Chaco, and Amazonia). Central lines indicate median values and IQR. Plots highlight the consistent drying signal in the Llanos and Chaco, moderate but nonsignificant changes in the Altiplano and Valles, and divergent results in Amazonia.
4.4. Methodological Contributions
In this study, we introduced two methodological innovations that contribute to a broader context in climate data validation: a Combined Accuracy Index (CAI) that integrates continuous and categorical dimensions of skill, and a conservative correction for serial autocorrelation in trend analysis. Together, these approaches strengthen the reliability of conclusions drawn from noisy climatic records. The CAI explicitly combines continuous, represented by the Kling–Gupta Efficiency (KGE), and categorical, represented by the Heidke Skill Score (HSS), into one dimensionless index. This integration provided a balanced assessment of the precipitation dataset’s ability to reproduce both rainfall amounts and occurrence patterns. Most previous studies have reported these evaluations in parallel, reporting correlation, bias, RMSE, and also listing a hit rate or HSS, and then qualitatively judging which datasets are best overall [,,]. Other approaches rank products separately by each metric or highlight those that perform consistently well across distinct metrics []. For example, ref. [], in the evaluation of eight satellite precipitation products over a Chinese basin, emphasized that no single metric can fully reflect performance, and that multiple metrics must be considered jointly. Our index addresses this need by merging different metrics into a single score that enables a clearer ranking, while also allowing weights to be adjusted according to the objectives of future studies. Other composite metrics include the use of clustering and rank-sum approaches, where datasets are ranked for each metric and then aggregated to identify the best overall performer []. In Chile, ref. [] used a similar composite of continuous (modified KGE) and multiple categorical indices (POD, FAR, among others) to evaluate precipitation datasets across the country’s diverse climates. They found significant regional variations in performance, underscoring the need for multi-metric evaluation. This study mirrors our approach by integrating magnitude and event detection skill in validation. In another approach by [], rather than simply averaging a few predefined scores, they proposed the Bergen metrics framework using clustering and p-norms to create composite error metrics from a large set of performance indicators. Compared to our approach, ref. [] goes beyond our approach of model evaluation by using statistical learning to weight metrics optimally instead of equal weights. This yields a robust overall score capturing multiple error dimensions.
For the trend analysis, we adopted a deliberately conservative approach to account for serial autocorrelation. A two-step regression with autoregressive error correction: ordinary least squares estimates the slope, after which residuals are modeled as an AR(1) process to adjust standard errors, degrees of freedom, and p-values. This hybrid method minimizes the risk of spurious detections of climate trends []. Alternative treatments in the literature include variance-corrected Mann–Kendall tests [], which adjust the variance of the MK statistic to account for autocorrelation, pre-whitening methods such as trend-free pre-withening [], which removes persistence before applying the Mann–Kendall test, and Bayesian frameworks such as BEAST, which simultaneously estimate changepoints, trend, and seasonality in time series []. Each method balances Type I and II errors differently: for instance, the classical Mann–Kendall test yields the incorrect rejection rate when applied to an autocorrelated series with no trend, while pre-whitening corrects this bias, but reduces the power of the test when a trend exists []. More recently, ref. [] proposed an extended AR() pre-whitening method and demonstrated that classical AR(1) corrections fail in cases with higher-order autocorrelation or structural breaks. He showed that such conditions demand more careful treatment. This work complements ours by reinforcing the importance of conservative trend assessment and cautioning against the usage of AR(1) when longer memory is present.
4.5. Regional Context
The consistent signal of precipitation reduction across Bolivia over the study period, with the strongest declines concentrated in the Llanos and Chaco regions, aligns with observed trends towards a warmer, drier, and more flammable climate in South America []. The decline in mean precipitation, particularly over the Bolivian lowlands, can amplify a future of general water scarcity. However, this trend must be interpreted alongside the increasing risk of short-duration extreme events, which present a dual hydrological challenge. First, the decreasing precipitation contributes to dry compound extremes, which have increased in key South American regions, including the Gran Chaco and the Northern Amazon []. The Gran Chaco, with its northern geographical limit in southern Bolivia, has experienced a drop in precipitation of about 100 mm from 1971–2000 to 2001–2022 []. This rise in atmospheric dryness can interact with surface processes such as deforestation, amplifying the probability of catastrophic fire activity due to an increased surface temperature [,]. Secondly, regional climate modeling efforts in neighboring countries characterized by complex terrain, such as Central Chile, suggest that while basin-averaged precipitation may decrease overall, the maximum precipitation with a shorter duration can increase under future warming []. Therefore, future research must include specific extreme precipitation indices to capture the full spectrum of hydrological risks in Bolivia []. Unfortunately, the accuracy and analysis of precipitation trends in South America are fundamentally limited by a persistent data scarcity across the Andes and other regions of South America. This is a challenge universally acknowledged by regional research efforts [,,,]. The Andean region from Colombia to Patagonia presents complex orography and high-elevation areas that are poorly instrumented []. Bolivia exemplifies this scarcity in the Andes and Amazon regions, where the use of validated gridded datasets can decrease this uncertainty [,].
The accurate representation of precipitation, particularly extreme events, hinges on correctly modeling large-scale moisture transport processes such as atmospheric rivers (ARs) []. The Amazon basin, adjacent to our study area, is an important source of water that feeds the South American Low-Level Jet [], which is a critical source of rain for the region []. The projected drying trend observed in Bolivia´s Llanos and Chaco regions requires further investigation into how changes in these large-scale circulation patterns and land–atmosphere interactions may be modulating water vapor transport into the interior of South America to better understand the mechanisms of observed trends [,].
4.6. Limitations and Future Directions
We acknowledge several limitations of our study. The sparse and uneven distribution of weather stations across Bolivia, with only 27 long-term records available over an area of 1.1 million km2, limits the representativeness of the validation, particularly in regions with steep climatic and topographic gradients at sub-grid scales. Furthermore, our analysis focused on monthly precipitation, which, while more robust than daily data for regions with poor coverage, may obscure biases in capturing short-term extremes. This temporal aggregation was chosen to ensure data continuity and maximize the spatial representativeness of the station network over four decades; shorter durations, such as daily or hourly, would substantially reduce the available dataset due to gaps and inconsistencies in sub-daily records. However, we acknowledge that monthly data cannot resolve the timing, intensity, or spatial organization of high-impact precipitation events. Future work should therefore complement this analysis with shorter temporal scales.
Another limitation is the use of grid-to-point continuous and categorical metrics. Though these metrics provide valuable insights into the magnitude and detection skill of precipitation products, they are limited in their ability to capture structural and spatial characteristics of precipitation systems, especially in regions with high spatial heterogeneity, such as the Andes. Object-based methods, such as the Structure–Amplitude–Location (SAL) approach, treat precipitation fields as spatially coherent features rather than isolated grid points, allowing for the evaluation of differences in spatial organization, displacement, and morphology between observed and estimated precipitation [,]. These methods have been shown to complement traditional verification by identifying systematic biases related to the size, shape, and location of precipitation objects, which are often masked in grid-based analysis []. Incorporating object-based validation in future work could improve the assessment of precipitation products under complex topographic influences and enhance their applicability for hydrological and climate studies in data-scarce regions.
The trend analysis, although conservative, assumes that temporal dependence can be sufficiently described by a first-order autoregressive process, thereby excluding the possibility of long-range persistence of nonlinear dynamics considered in other studies []. Finally, by evaluating only three gridded datasets, our study does not capture the full uncertainty present in the growing suite of satellite and reanalysis products. Addressing these limitations will require expanded station networks, incorporating re-processed and homogenized station data [], and broader multi-product intercomparison to consolidate confidence in precipitation projections for Bolivia.
5. Conclusions
This study demonstrated that MSWEP is the most reliable precipitation product for Bolivia, outperforming CHIRPS and ERA5-Land across most regions, particularly in topographically complex environments. CHIRPS performed comparably in the Llanos and Amazon regions, while ERA5-Land, despite moderate skill, can provide valuable physically consistent fields for understanding change mechanisms. The application of a combined accuracy index and a conservative autocorrelation correction ensured robust and replicable results. Precipitation trend analysis for 1980–2022 revealed a consistent trend signal in the Llanos and Chaco not captured by previous studies. These findings underscore the need to consider growing water stress in Bolivia’s lowland ecosystems and its possible causes.
Author Contributions
All authors contributed to the study conception and design. Conceptualization: Á.S. and D.M.L.-A.; Methodology: Á.S. and A.P.; Validation: L.M. and F.A.S.; Formal analysis: Á.S.; Investigation: A.B. and N.G.; Data curation: A.P., O.M., D.O.-M. and F.A.S.; Writing—original draft: Á.S.; Writing—review & editing: D.M.L.-A., A.B., N.G., L.M., O.M. and D.O.-M.; Supervision: Á.S. and F.A.S.; Project administration: Á.S. and D.M.L.-A.; Funding acquisition: D.M.L.-A. All authors have read and agreed to the published version of the manuscript.
Funding
This research was funded by the Pando Verde project (Ecosystem conservation and sustainable socio-environmental management of biodiversity in Pando, Bolivian Amazon) implemented by Conservación Amazónica–ACEAA with the support of the Inter American Development Bank (IDB) Grant number GRT/AZ-20697-BO and Funding Agreement of the Delegations of the European Union and Sweden in Bolivia (ASDI-UE, SIDA Contribution N° 16854). Francisco A. Squeo was funded by Project Grant FB210006. Álvaro Salazar was also funded by Polo Científico y Tecnológico Project Grant ULS21992.
Institutional Review Board Statement
Not applicable.
Informed Consent Statement
Not applicable.
Data Availability Statement
The original data presented in the study and the code to perform the trend analysis are openly available at https://github.com/AlvaroSalazar2021/enhanced-ar1-github/tree/main.
Acknowledgments
We thank Juan Pablo Castillo (University of La Serena) who supported the final manuscript formatting.
Conflicts of Interest
The authors have no relevant financial or non-financial interests to disclose. The funders had no role in the design of the study; in the collection, analyses, or interpretation of data; in the writing of the manuscript, or in the decision to publish the results.
Abbreviations
The following abbreviations are used in this manuscript:
| AR(1) | First-order Autoregressive |
| CHETSSEL | Carbon-Hydrology Tiled ECMWF Forecasts Scheme for Surface Exchanges over Land |
| CHIRPS | Climate Hazards Group InfraRed Precipitation with Stations |
| CMORPH | Climate Prediction Center Morphing technique |
| ERA5-Land | ECMWF Reanalysis v5 Land |
| FAR | False Alarm Ratio |
| GHCN-D | Global Historical Climatology Network daily |
| GSOD | Global Surface Summary of the Day |
| HSS | Heidke Skill Score |
| IFS | Integrated Forecasting System |
| KGE | Kling–Gupta Efficiency |
| MSWEP | Multi-Source Weighted-Ensemble Precipitation |
| RMSE | Root Mean Square Error |
| OLS | Ordinary Least Squares |
| PERSIANN-CCS | Precipitation Estimation from Remotely Sensed Information using Artificial Neural Networks—Cloud Classification System |
| POD | Probability of Detection |
| WAM | ECMWF Wave Model |
References
- Kidd, C.; Becker, A.; Huffman, G.; Muller, C.; Joe, P.; Skofronick-Jackson, G.; Kirschbaum, D. So, how much of the Earth’s surface is covered by rain gauges? Bull. Am. Meteorol. Soc. 2017, 98, 69–78. [Google Scholar] [CrossRef]
- Condom, T.; Martínez, R.; Pabón, J.; Costa, F.; Pineda, L.; Nieto, J.; Villacis, M. Climatological and Hydrological Observations for the South American Andes: In situ Stations, Satellite, and Reanalysis Data Sets. Front. Earth Sci. 2020, 8, 92. [Google Scholar] [CrossRef]
- Seiler, C.; Hutjes, R.; Kabat, P. Climate Variability and Trends in Bolivia. J. Appl. Meteorol. Climatol. 2013, 52, 130–146. [Google Scholar] [CrossRef]
- Navarro, G.; Ferreira, W. Biogeografía de Bolivia. In Libro Rojo de Parientes Silvestres de Cultivos de Bolivia; VMABCC, Ed.; Plural editores: La Paz, Bolivia, 2009; pp. 23–39. [Google Scholar]
- Ibisch, P. Biodiversity Conservation in Bolivia: History, Trends and Challenges. In Environmental Issues in Latin America and the Caribbean; Romero, A., West, S., Eds.; Springer: Dordrecht, The Netherlands, 2005; pp. 55–71. [Google Scholar]
- Liu, J.; Shangguan, D.; Liu, S.; Ding, Y.; Wang, S.; Wang, X. Evaluation and comparison of CHIRPS and MSWEP daily-precipitation products in the Qinghai-Tibet Plateau during the period of 1981–2015. Atmos. Res. 2019, 230, 104634. [Google Scholar] [CrossRef]
- Huffman, G.; Bolvin, D.; Braithwaite, D.; Hsu, K.L.; Joyce, R.; Kidd, C.; Nelkin, E.; Sorooshian, S.; Stocker, E.; Tan, J.; et al. Integrated Multi-satellite Retrievals for the Global Precipitation Measurement (GPM) Mission (IMERG). In Satellite Precipitation Measurement: Volume 1; Levizzani, V., Kidd, C., Kirschbaum, D., Kummerow, C., Nakamura, K., Turk, F., Eds.; Springer International Publishing: Cham, Switzerland, 2020; pp. 343–353. [Google Scholar]
- Xie, P.; Joyce, R.; Wu, S.; Yoo, S.H.; Yarosh, Y.; Sun, F.; Lin, R. Reprocessed, Bias-Corrected CMORPH Global High-Resolution Precipitation Estimates from 1998. J. Hydrometeorol. 2017, 18, 1617–1641. [Google Scholar] [CrossRef]
- Nguyen, P.; Shearer, E.; Tran, H.; Ombadi, M.; Hayatbini, N.; Palacios, T.; Huynh, P.; Braithwaite, D.; Updegraff, G.; Hsu, K.; et al. The CHRS Data Portal, an easily accessible public repository for PERSIANN global satellite precipitation data. Sci. Data 2019, 6, 180296. [Google Scholar] [CrossRef]
- Funk, C.; Peterson, P.; Landsfeld, M.; Pedreros, D.; Verdin, J.; Shukla, S.; Husak, G.; Rowland, J.; Harrison, L.; Hoell, A.; et al. The climate hazards infrared precipitation with stations—A new environmental record for monitoring extremes. Sci. Data 2015, 2, 150066. [Google Scholar] [CrossRef]
- Hersbach, H.; Bell, B.; Berrisford, P.; Hirahara, S.; Horányi, A.; Muñoz-Sabater, J.; Nicolas, J.; Peubey, C.; Radu, R.; Schepers, D.; et al. The ERA5 global reanalysis. Q. J. R. Meteorol. Soc. 2020, 146, 1999–2049. [Google Scholar] [CrossRef]
- Cepeda Arias, E.; Cañon Barriga, J. Performance of high-resolution precipitation datasets CHIRPS and TerraClimate in a Colombian high Andean Basin. Geocarto Int. 2022, 37, 17382–17402. [Google Scholar] [CrossRef]
- López-Bermeo, C.; Montoya, R.; Caro-Lopera, F.; Díaz-García, J. Validation of the accuracy of the CHIRPS precipitation dataset at representing climate variability in a tropical mountainous region of South America. Phys. Chem. Earth Parts A/B/C 2022, 127, 103184. [Google Scholar] [CrossRef]
- Prakash, S. Performance assessment of CHIRPS, MSWEP, SM2RAIN-CCI, and TMPA precipitation products across India. J. Hydrol. 2019, 571, 50–59. [Google Scholar] [CrossRef]
- Li, L.; Wang, Y.; Wang, L.; Hu, Q.; Zhu, Z.; Li, L.; Li, C. Spatio-temporal accuracy evaluation of MSWEP daily precipitation over the Huaihe River Basin, China: A comparison study with representative satellite- and reanalysis-based products. J. Geogr. Sci. 2022, 32, 2271–2290. [Google Scholar] [CrossRef]
- Xu, Z.; Wu, Z.; He, H.; Wu, X.; Zhou, J.; Zhang, Y.; Guo, X. Evaluating the accuracy of MSWEP V2.1 and its performance for drought monitoring over mainland China. Atmos. Res. 2019, 226, 17–31. [Google Scholar] [CrossRef]
- Gomis-Cebolla, J.; Rattayova, V.; Salazar-Galán, S.; Francés, F. Evaluation of ERA5 and ERA5-Land reanalysis precipitation datasets over Spain (1951–2020). Atmos. Res. 2023, 284, 106606. [Google Scholar] [CrossRef]
- Jiao, D.; Xu, N.; Yang, F.; Xu, K. Evaluation of spatial-temporal variation performance of ERA5 precipitation data in China. Sci. Rep. 2021, 11, 17956. [Google Scholar] [CrossRef] [PubMed]
- Romero-Hernández, C.; Avila-Diaz, A.; Quesada, B.; Medeiros, F.; Cerón, W.; Guzman-Escalante, J.; Ocampo-Marulanda, C.; Rodrigues Torres, R.; Zuluaga, C. Bias-corrected high-resolution precipitation datasets assessment over a tropical mountainous region in Colombia: A case of study in Upper Cauca River Basin. J. S. Am. Earth Sci. 2024, 140, 104898. [Google Scholar] [CrossRef]
- Russell, A.; Gnanadesikan, A.; Zaitchik, B. Are the Central Andes Mountains a Warming Hot Spot? J. Clim. 2017, 30, 3589–3608. [Google Scholar] [CrossRef]
- Yu, L.; Zhang, Y.; Yang, Y. Using High-Density Rain Gauges to Validate the Accuracy of Satellite Precipitation Products over Complex Terrains. Atmosphere 2020, 11, 633. [Google Scholar] [CrossRef]
- Garreaud, R.; Vuille, M.; Clement, A. The climate of the Altiplano: Observed current conditions and mechanisms of past changes. Palaeogeogr. Palaeoclimatol. Palaeoecol. 2003, 194, 5–22. [Google Scholar] [CrossRef]
- Garreaud, R.; Vuille, M.; Compagnucci, R.; Marengo, J. Present-day South American climate. Palaeogeogr. Palaeoclimatol. Palaeoecol. 2009, 281, 180–195. [Google Scholar] [CrossRef]
- Arias, B.C.E.; Tito, L.; Aragón, O. Atlas de Riesgo Agropecuario y Cambio Climático para la Soberanía Alimentaria; Ministerio de Desarrollo Rural y Tierras: La Paz, Bolivia, 2014; p. 320. [Google Scholar]
- Abadi, A.; Rowe, C.; Andrade, M. Climate regionalization in Bolivia: A combination of non-hierarchical and consensus clustering analyses based on precipitation and temperature. Int. J. Climatol. 2020, 40, 4408–4421. [Google Scholar] [CrossRef]
- Fernández-Duque, B.; Vicente-Serrano, S.; Maillard, O.; Domínguez-Castro, F.; Peña-Angulo, D.; Noguera, I.; Azorin-Molina, C.; El Kenawy, A. Long-term observed changes of air temperature, relative humidity and vapour pressure deficit in Bolivia, 1950–2019. Int. J. Climatol. 2023, 43, 6484–6504. [Google Scholar] [CrossRef]
- Vicente-Serrano, S.; Maillard, O.; Peña-Angulo, D.; Domínguez-Castro, F.; Noguera, I.; Lorenzo-Lacruz, J.; Azorin-Molina, C.; Juez, C.; Guijarro, J.; Halifa-Marín, A.; et al. Evaluation of long-term changes in precipitation over Bolivia based on observations and Coupled Model Intercomparison Project models. Int. J. Climatol. 2022, 43, 1431–1447. [Google Scholar] [CrossRef]
- Beck, H.; Wood, E.; Pan, M.; Fisher, C.; Miralles, D.; van Dijk, A.; McVicar, T.; Adler, R. MSWEP V2 Global 3-Hourly 0.1° Precipitation: Methodology and Quantitative Assessment. Bull. Am. Meteorol. Soc. 2019, 100, 473–500. [Google Scholar] [CrossRef]
- Beck, H.; Pan, M.; Roy, T.; Weedon, G.; Pappenberger, F.; van Dijk, A.; Huffman, G.; Adler, R.; Wood, E. Daily evaluation of 26 precipitation datasets using Stage-IV gauge-radar data for the CONUS. Hydrol. Earth Syst. Sci. 2019, 23, 207–224. [Google Scholar] [CrossRef]
- Beck, H.; Vergopolan, N.; Pan, M.; Levizzani, V.; van Dijk, A.; Weedon, G.; Brocca, L.; Pappenberger, F.; Huffman, G.; Wood, E. Global-scale evaluation of 22 precipitation datasets using gauge observations and hydrological modeling. Hydrol. Earth Syst. Sci. 2017, 21, 6201–6217. [Google Scholar] [CrossRef]
- Muñoz-Sabater, J.; Dutra, E.; Agustí-Panareda, A.; Albergel, C.; Arduini, G.; Balsamo, G.; Boussetta, S.; Choulga, M.; Harrigan, S.; Hersbach, H.; et al. ERA5-Land: A state-of-the-art global reanalysis dataset for land applications. Earth Syst. Sci. Data 2021, 13, 4349–4383. [Google Scholar] [CrossRef]
- Liu, R.; Zhang, X.; Wang, W.; Wang, Y.; Liu, H.; Ma, M.; Tang, G. Global-scale ERA5 product precipitation and temperature evaluation. Ecol. Indic. 2024, 166, 112481. [Google Scholar] [CrossRef]
- Xie, W.; Yi, S.; Leng, C.; Xia, D.; Li, M.; Zhong, Z.; Ye, J. The evaluation of IMERG and ERA5-Land daily precipitation over China with considering the influence of gauge data bias. Sci. Rep. 2022, 12, 8085. [Google Scholar] [CrossRef]
- Wasserman, L. All of Nonparametric Statistics, 1st ed.; Springer: New York, NY, USA, 2006; p. 270. [Google Scholar]
- Cohn, T.; Lins, H. Nature’s style: Naturally trendy. Geophys. Res. Lett. 2005, 32, 1–5. [Google Scholar] [CrossRef]
- von Storch, H.; Zwiers, F. Statistical Analysis in Climate Research; Cambridge University Press: Cambridge, UK, 1999; p. 484. [Google Scholar]
- Seabold, S.; Perktold, J. Statsmodels: Econometric and Statistical Modeling with Python. In Proceedings of the 9th Python in Science Conference, Austin, TX, USA, 28 June–3 July 2010. [Google Scholar]
- Bretherton, C.; Widmann, M.; Dymnikov, V.; Wallace, J.; Bladé, I. The Effective Number of Spatial Degrees of Freedom of a Time-Varying Field. J. Clim. 1999, 12, 1990–2009. [Google Scholar] [CrossRef]
- Huber Magoffin, R.; Hales, R.; Erazo, B.; Nelson, E.; Larco, K.; Miskin, T. Evaluating the Performance of Satellite Derived Temperature and Precipitation Datasets in Ecuador. Remote Sens. 2023, 15, 5713. [Google Scholar] [CrossRef]
- Xavier, A.; Rudke, A.; Serrão, E.; Terassi, P.; Pontes, P. Evaluation of Satellite-Derived Products for the Daily Average and Extreme Rainfall in the Mearim River Drainage Basin (Maranhão, Brazil). Remote Sens. 2021, 13, 4393. [Google Scholar] [CrossRef]
- Ali, S.; Chen, Y.; Azmat, M.; Kayumba, P.; Ahmed, Z.; Mind’je, R.; Ghaffar, A.; Qin, J.; Tariq, A. Long-Term Performance Evaluation of the Latest Multi-Source Weighted-Ensemble Precipitation (MSWEP) over the Highlands of Indo-Pak (1981–2009). Remote Sens. 2022, 14, 4773. [Google Scholar] [CrossRef]
- Alijanian, M.; Rakhshandehroo, G.; Mishra, A.; Dehghani, M. Evaluation of satellite rainfall climatology using CMORPH, PERSIANN-CDR, PERSIANN, TRMM, MSWEP over Iran. Int. J. Climatol. 2017, 37, 4896–4914. [Google Scholar] [CrossRef]
- Blacutt, L.A.; Herdies, D.L.; de Gonçalves, L.G.G.; Vila, D.A.; Andrade, M. Precipitation comparison for the CFSR, MERRA, TRMM3B42 and Combined Scheme datasets in Bolivia. Atmos. Res. 2015, 163, 117–131. [Google Scholar] [CrossRef]
- Hafizi, H.; Sorman, A. Assessment of 13 Gridded Precipitation Datasets for Hydrological Modeling in a Mountainous Basin. Atmosphere 2022, 13, 143. [Google Scholar] [CrossRef]
- Mekonnen, K.; Velpuri, N.; Leh, M.; Akpoti, K.; Owusu, A.; Tinonetsana, P.; Hamouda, T.; Ghansah, B.; Paranamana, T.; Munzimi, Y. Accuracy of satellite and reanalysis rainfall estimates over Africa: A multi-scale assessment of eight products for continental applications. J. Hydrol. Reg. Stud. 2023, 49, 101514. [Google Scholar] [CrossRef]
- Ullah, W.; Wang, G.; Ali, G.; Tawia Hagan, D.; Bhatti, A.; Lou, D. Comparing Multiple Precipitation Products against In-Situ Observations over Different Climate Regions of Pakistan. Remote Sens. 2019, 11, 628. [Google Scholar] [CrossRef]
- Abbas, H.; Song, W.; Wang, Y.; Xiang, K.; Chen, L.; Feng, T.; Linghu, S.; Alam, M. Validation of CRU TS v4.08, ERA5-Land, IMERG v07B, and MSWEP v2.8 Precipitation Estimates Against Observed Values over Pakistan. Remote Sens. 2024, 16, 4803. [Google Scholar] [CrossRef]
- Wu, X.; Zhao, N. Evaluation and Comparison of Six High-Resolution Daily Precipitation Products in Mainland China. Remote Sens. 2022, 15, 223. [Google Scholar] [CrossRef]
- Zambrano-Bigiarini, M.; Nauditt, A.; Birkel, C.; Verbist, K.; Ribbe, L. Temporal and spatial evaluation of satellite-based rainfall estimates across the complex topographical and climatic gradients of Chile. Hydrol. Earth Syst. Sci. 2017, 21, 1295–1320. [Google Scholar] [CrossRef]
- Arregocés, H.; Rojano, R.; Pérez, J. Validation of the CHIRPS dataset in a coastal region with extensive plains and complex topography. Case Stud. Chem. Environ. Eng. 2023, 8, 100452. [Google Scholar] [CrossRef]
- Chao, L.; Deng, Y.; Wang, S.; Ren, J.; Zhang, K.; Wang, G. Development of a two-stage correction framework for satellite, multi-source Merged, and reanalysis precipitation products Across the Huang-Huai-Hai Plain, China, During 2000–2020. Remote Sens. 2025, 17, 2809. [Google Scholar] [CrossRef]
- Kimani, M.; Hoedjes, J.; Su, Z. Bayesian Bias Correction of Satellite Rainfall Estimates for Climate Studies. Remote Sens. 2018, 10, 1074. [Google Scholar] [CrossRef]
- Gu, L.; Yin, J.; Wang, S.; Chen, J.; Qin, H.; Yan, X.; He, S.; Zhao, T. How well do the multi-satellite and atmospheric reanalysis products perform in hydrological modelling. J. Hydrol. 2023, 617, 128920. [Google Scholar] [CrossRef]
- Valencia, S.; Marín Palacio, D.; Gómez, D.; Hoyos, N.; Salazar, J.F.; Villegas, J.C. Spatio-temporal assessment of gridded precipitation products across topographic and climatic gradients in Colombia. Atmos. Res. 2023, 285, 106643. [Google Scholar] [CrossRef]
- Tang, X.; Zhang, J.; Wang, G.; Ruben, G.B.; Bao, Z.; Liu, Y.; Liu, C.; Jin, J. Error Correction of Multi-Source Weighted-Ensemble Precipitation (MSWEP) over the Lancang-Mekong River Basin. Remote Sens. 2021, 13, 312. [Google Scholar] [CrossRef]
- Sapucci, C.R.; Mayta, V.C.; da Silva Dias, P.L. Evaluation of diverse-based precipitation data over the Amazon Region. Theor. Appl. Climatol. 2022, 149, 1167–1193. [Google Scholar] [CrossRef]
- Lavers, D.A.; Simmons, A.; Vamborg, F.; Rodwell, M.J. An evaluation of ERA5 precipitation for climate monitoring. Q. J. R. Meteorol. Soc. 2022, 148, 3152–3165. [Google Scholar] [CrossRef]
- Tarek, M.; Brissette, F.; Arsenault, R. Evaluation of the ERA5 reanalysis as a potential reference dataset for hydrological modelling over North America. Hydrol. Earth Syst. Sci. 2020, 24, 2527–2544. [Google Scholar] [CrossRef]
- Thorne, P.W.; Vose, R.S. Reanalyses Suitable for Characterizing Long-Term Trends. Bull. Am. Meteorol. Soc. 2010, 91, 353–362. [Google Scholar] [CrossRef]
- Garreaud, R. A plausible atmospheric trigger for the 2017 coastal El Niño. Int. J. Climatol. 2018, 38, e1296–e1302. [Google Scholar] [CrossRef]
- André, J.; D’Andrea, F.; Drobinski, P.; Muller, C. Regimes of Precipitation Change Over Europe and the Mediterranean. J. Geophys. Res. Atmos. 2024, 129, e2023JD040413. [Google Scholar] [CrossRef]
- Maillard, O.; Vides-Almonacid, R.; Salazar, Á.; Larrea-Alcazar, D. Effect of Deforestation on Land Surface Temperature in the Chiquitania Region, Bolivia. Land 2022, 12, 2. [Google Scholar] [CrossRef]
- Guo, B.; Xu, T.; Yang, Q.; Zhang, J.; Dai, Z.; Deng, Y.; Zou, J. Multiple Spatial and Temporal Scales Evaluation of Eight Satellite Precipitation Products in a Mountainous Catchment of South China. Remote Sens. 2023, 15, 1373. [Google Scholar] [CrossRef]
- Zhu, S.; Liu, Z. Comprehensive quantitative assessment of the performance of fourteen satellite precipitation products over Chinese mainland. Clim. Dyn. 2024, 62, 6799–6818. [Google Scholar] [CrossRef]
- Kumar, V.; Borgemeister, C.; Tischbein, B.; Kumar, N. Evaluation and inter-comparison of twenty-three gridded rainfall products representing a typical urban monsoon climate in India. Theor. Appl. Climatol. 2024, 155, 9529–9553. [Google Scholar] [CrossRef]
- Samantaray, A.; Mooney, P.; Vivacqua, C. Bergen metrics: Composite error metrics for assessing performance of climate models using EURO-CORDEX simulations. Geosci. Model Dev. 2024, 17, 3321–3339. [Google Scholar] [CrossRef]
- Hamed, K.; Ramachandra Rao, A. A modified Mann-Kendall trend test for autocorrelated data. J. Hydrol. 1998, 204, 182–196. [Google Scholar] [CrossRef]
- Yue, S.; Pilon, P.; Phinney, B. Canadian streamflow trend detection: Impacts of serial and cross-correlation. Hydrol. Sci. J. 2003, 48, 51–63. [Google Scholar] [CrossRef]
- Zhao, K.; Wulder, M.; Hu, T.; Bright, R.; Wu, Q.; Qin, H.; Li, Y.; Toman, E.; Mallick, B.; Zhang, X.; et al. Detecting change-point, trend, and seasonality in satellite time series data to track abrupt changes and nonlinear dynamics: A Bayesian ensemble algorithm. Remote Sens. Environ. 2019, 232, 111330. [Google Scholar] [CrossRef]
- Bayazit, M.; Önöz, B. To prewhiten or not to prewhiten in trend analysis? Hydrol. Sci. J. 2007, 52, 611–624. [Google Scholar] [CrossRef]
- Bürger, G. Trends? Complicated answers to a simple question. Hydrol. Sci. J. 2023, 68, 1680–1692. [Google Scholar] [CrossRef]
- Feron, S.; Cordero, R.R.; Damiani, A.; MacDonell, S.; Pizarro, J.; Goubanova, K.; Valenzuela, R.; Wang, C.; Rester, L.; Beaulieu, A. South America is becoming warmer, drier, and more flammable. Commun. Earth Environ. 2024, 5, 23. [Google Scholar] [CrossRef]
- Hiraga, Y.; Tahara, R.; Meza, J. A methodology to estimate Probable Maximum Precipitation (PMP) under climate change using a numerical weather model. J. Hydrol. 2025, 652, 132659. [Google Scholar] [CrossRef]
- Lagos-Zúñiga, M.; Balmaceda-Huarte, R.; Regoto, P.; Torrez, L.; Olmo, M.; Lyra, A.; Pareja-Quispe, D.; Bettolli, M.L. Extreme indices of temperature and precipitation in South America: Trends and intercomparison of regional climate models. Clim. Dyn. 2022, 62, 4541–4562. [Google Scholar] [CrossRef]
- Viale, M.; Valenzuela, R.; Garreaud, R.D.; Ralph, F.M. Impacts of Atmospheric Rivers on Precipitation in Southern South America. J. Hydrometeorol. 2018, 19, 1671–1687. [Google Scholar] [CrossRef]
- Montini, T.L.; Jones, C.; Carvalho, L.M.V. The South American Low-Level Jet: A New Climatology, Variability, and Changes. J. Geophys. Res. Atmos. 2019, 124, 1200–1218. [Google Scholar] [CrossRef]
- Salazar, A.; Baldi, G.; Hirota, M.; Syktus, J.; McAlpine, C. Land use and land cover change impacts on the regional climate of non-Amazonian South America: A review. Glob. Planet. Change 2015, 128, 103–119. [Google Scholar] [CrossRef]
- Su, D.; Zhong, J.; Xu, Y.; Lv, L.; Liu, H.; Fan, X.; Han, L.; Wang, F. SAL Method Applied in Grid Forecasting Product Verification with Three-Source Fusion Product. Atmosphere 2024, 15, 1366. [Google Scholar] [CrossRef]
- Hiraga, Y.; Tahara, R. Sensitivity of localized heavy rainfall in Northern Japan to WRF physics parameterization schemes. Atmos. Res. 2025, 314, 107802. [Google Scholar] [CrossRef]
- Huerta, A.; Serrano-Notivoli, R.; Bronnimann, S. SC-PREC4SA: A serially complete daily precipitation dataset for South America. Sci. Data 2025, 12, 1006. [Google Scholar] [CrossRef] [PubMed]
Disclaimer/Publisher’s Note: The statements, opinions and data contained in all publications are solely those of the individual author(s) and contributor(s) and not of MDPI and/or the editor(s). MDPI and/or the editor(s) disclaim responsibility for any injury to people or property resulting from any ideas, methods, instructions or products referred to in the content. |
© 2025 by the authors. Licensee MDPI, Basel, Switzerland. This article is an open access article distributed under the terms and conditions of the Creative Commons Attribution (CC BY) license (https://creativecommons.org/licenses/by/4.0/).